Page 1
CHAPTER - III
WAGE STRUCTURE OF CASHEW INDUSTRY INKANYAKUMARI DISTRICT
Kanyakumari District, the southern most district of
India, with its headquarters at Nagercoil, has an area of 1984
sq.kms. As per the 2001 census, its population was 16.69'
lakhs with a density of 920 persons per sq.km . The district is
situated at the foot of the Western Ghats and is bounded by
Tirunelveli District in the north and north east, Kerala State in
the north west, Bay of Bengal in the south east, Indian Ocean
in the south and the Arabian sea in the west. It is benefitted
by the South-west monsoon from June to September and North-
East monsoon from October to December. The normal rainfall
per annum is 470mm. The economy is predominantly agrarian.
For administrative purposes the district is divided into four
Taluks viz. Thovalai, Agasteeswaram, Kalkulam and Vilavancode.
3.1. INDUSTRIAL STATUS OF KANYAKUMARI DISTRICT
Kanyakumari District does not abound with major
industries. At present there are only six large scale units and
Page 2
75
one medium scale unit in the district. The large scale units
are the Indian Rare Earths Limited, Manavalakurichi, Borax
Morarji Ltd., Shenbagaramanpudur, Vasantham Monofile (P) Ltd.,
Thammathukonam, Kanam Latex Industries (P) Ltd.,
Parvathipuram, Nagercoil, Kanyakumari District Co-operative
Spinning Mills Limited, Aralvaimozhi and the Nagammal
Spinning Mills, Nagercoil. The TAC Floor Company Limited at
Ammandivilai is the only medium scale unit. The investment in
these industrial units, their line of activity and their
employment potentials are summarised in Table 3.1.
The scope for the emergence of ancillary industries
to these large scale units is rather limited. The TAC Floor
Company, Ammandivilai has created some ancillary cottage
industries producing two-ply yarn which at present is being
brought from Kerala. The district has potential for the starting
of industries manufacturing Titanium coated abrasives from the
minerals separated by the Indian Rare Earths, Manavalakurichi.
In the case of small scale industries too,
Kanyakumari District still
remains extremely backward. There
are at present 20 different types of small-scale industries
functioning in 2000-2001 as shown in Table 3.2.
Page 3
CO)
ri
zzz0z
76
I-z
00C)
(N
C
Co
C
C
ccC
(N
N-N-
Cl)
1c
0 0
0
CC
C.
C.o
Lt)(N
N-00
'-4
cc
o
N-ce)It
4C
C
If)C')
_'I
bn
Cl,
0.)
00 (N
(N
CC
C. If)
cO
C
C.c. i
ciid
It)
1-4V
•0
C.)
0—
-
4Jo
0.)
•. c00)
o
0
0
"-4
c0
QD
0
0
•DC
o
0o
•••
'-4Z
00
r-4
C,)-4
C/)-
Cl,
•ci)
0)
-
aS
•.-'-d
0
—
•.4
•.j
00
Cd
-4'd
—
P4
aS
m
a)aS
HC
ocd
1-4
ra
Cd
•z
,j
ir
I-z—1<
I —z
—4
• -400)
0.)
0.)
C-)
0)
Cl,
—4
4J0Cl,
.1CC00C(N200
N-
'-41-4
Ia.)C
)1-4
0(I)
Page 4
77
Table 3.2
SMALL-SCALE INDUSTRIAL UNITS IN KANYAKUMARI DISTRICTDURING THE YEAR 2000-2001
Si. No. Industry Group No. of Units
1.
2.
3.
4.
5.
6.
7.
8.
9.
10.
11.
12.
13.
14.
15.
16.
17.
18.
19.
20.
Wood Based Industries
Printing and Paper Industries
Engineering Industries
Chemical Industry
Plastic and Rubber Based Industries
Garments & Coir Industries
Beverages and Tobacco Product
Cotton Textiles
Wool and Silk Industry
Food Products
Cashew Industry
Transport Equipment
Non-Metallic Mineral Products
Basic Metal Product
Repairing & Servicing Industries
Jute Industry
Safety Matches
Leather Products
Electrical Machinery
Miscellaneous Industries
1141
450
823
380
468
3227
67
32
3
976
241
222
530
11
1092
1
190
377
350
361
Source: Codes for Product-2001 -District Industries Centre,Nagercoil
Page 5
78
However, there are certain village industries which
have registered rapid growth in the Khadi and Village Industries
sector. Some of the prominent and flourishing village industries
are palm gur, soap production, village pottery, carpentry and
black smithy, fiber extraction, bamboo and rattan works, fruit
preservation, village tanneries, village oil ghani, bee-keeping,
hand made paper, lime kiln, gur and kandasari and medicinal
herb extraction.
Like all the other districts in Tamil Nadu,
Kanyakumari has a number of industries of art and crafts.
Among them, mention could be made of wood carving, art metal
wares, temple jewellery, conch, musical instruments, screwpine
products, lack works, palm leaf products, korai mat, painting in
peepul leaf and doll making. A significant point to remember is
that Kanyakumari District is not wanting in basic infrastructural
facilities like power, transport, communication, roads, railways,
ports, banks, educational and technical institutions and
industrial estates. The district has a good network of roads
connecting important commercial centres like Marthandam,
Colachel, Kottar, Vadasery, Karungal, Mylaudy and Kaliakkavilai.
The district is also well connected with other districts and the
neighbouring State, Kerala. The broad-gauge railway connects
Page 6
79
the district with Tirunelveli and Trivandrum and other parts of
India. There are two industrial estates in Kanyakumari District.
The industrial estate at Nagercoil has 18 sheds of which 6 are
regular and the remaining being residential-cum-work sheds.
The industrial estate at Kappicaud has 15 work sheds, of which
there are 10 tiny sheds, 4 regular sheds and one special shed.
3.2. FINANCIAL RESOURCES
Apart from the commercial banks which have played
a commendable role in the agricultural and industrial
development of Kanyakumari District, there are branches of
industrial finance institutions such as the Tamil Nadu Industrial
Investment Corporation Limited and the Small industries
Development Corporation which provide term-loan assistance.
3.3. AREA UNDER CULTIVATION
Kanyakumari District is noted for its agriculture. As
much as 63 per cent of its total area has been put under
agricultural use. A crop. wise distribution of the area under
cultivation is given in Table 3.3.
Page 7
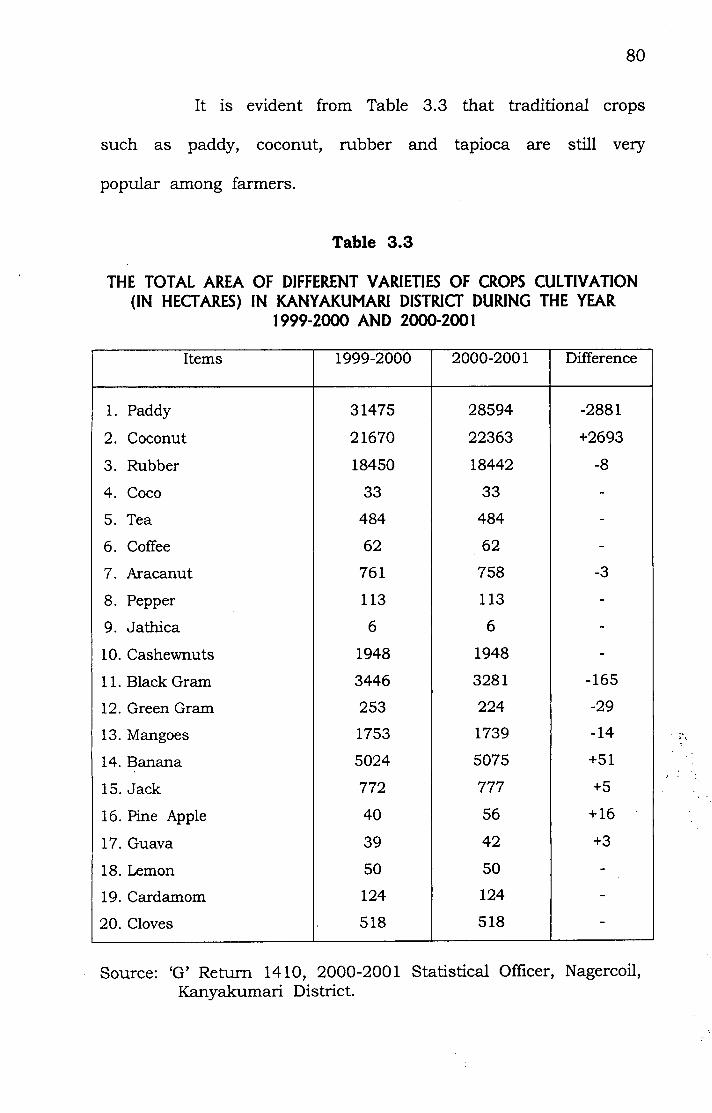
It is evident from Table 3.3 that traditional crops
such as paddy, coconut, rubber and tapioca are still very
popular among farmers.
Table 3.3
THE TOTAL AREA OF DIFFERENT VARIETIES OF CROPS CULTIVATION(IN HECTARES) IN KANYAKUMARI DISTRICT DURING THE YEAR
1999-2000 AND 2000-2001
Items 1999-2000 2000-2001 Difference
1. Paddy 31475 28594 -2881
2. Coconut 21670 22363 +2693
3. Rubber 18450 18442 -8
4. Coco 33 33 -
5. Tea 484 484 -
6. Coffee 62 62 -
7. Aracanut 761 758 -3
8. Pepper 113 113 -
9.Jathica 6 6 -
10. Cashewnuts 1948 1948 -
11. Black Gram 3446 3281 -165
12. Green Gram 253 224 -29
13. Mangoes 1753 1739 -14
14. Banana 5024 5075 +51
15. Jack 772 777 +5
16. Pine Apple 40 56 +16
17. Guava 39 42 +3
18. Lemon 50 50 -
19. Cardamom 124 124 -
20. Cloves 518 518 -
Source: 'G' Return 1410, 2000-2001 Statistical Officer, Nagercoil,Kanyakumari District.
Page 8
[.7
3.4. TREND OF CASHEW CULTIVATION IN KANYAKUMARIAND OTHER DISTRICTS OF TAMIL NADU
The declining trend on the total area under cultivation
is peculiar to Kanyakumari District only. In South Arcot,
Ramnad, Tanjore and Trichy Districts, the area under cashew
cultivation has never suffered any decline.
It is evident from Table 3.4 that the declining trend
in the area under cultivation is a phenomenon quite peculiar to
Kanyakumari District. As stated earlier, this is because of the
higher return on the cultivation of other crops. From 1989-90
to 2000-2001 the area under cashew cultivation has gone down
from 2850 hectares to 1948 hectares in Kanyakumari District.
But in the districts of Chengalput, South Arcot, Trichi, Tanjore,
Ramnad and Tirunelveli it has gone up considerably during the
year.
There are at present 29 districts in Tamil Nadu only
some of the important districts where cashew cultivation takes
place shown in Table 3.4. The reason attributed to the low
profit of the cashew cultivation in Kanyakumari District is that
the farmers seldom find it a gainful proposition. The economic
return on cashew cultivation is less than any crop.
Page 9
Table 3.4
AREA UNDER CASHEW CULTIVATION IN TAMIL NADU FORTHE YEAR 1990-1991
Si. J I Area inName of the District INo. I Hectares
82
1. Chingalput
11550
2. South Arcot
25000
3. North Arcot
260
4. Salem 110
5. Dharmapuri
230
6. Trichy 29620
7. Thanjavur 7649
8. Madurai
120
9. Ramnad
11570
10. Tirunelveli
2510
11. Kanyakumari
2850
Total
91469
Source: Season and Crop Report of Tamil Nadu, 1990-91, p.14.
Page 10
[*]
3.5 MIGRATION OF CASHEW INDUSTRY FROM KERALA TOKANYAKUMARI DISTRICT
When the cashew industry was organised on the
factory basis during 1930's there was indeed much difficulty in
getting adequate number of workers, especially for shelling
which is an unpleasant work in the cashew processing. The
disequilibrium between the supply of and demand for labour
posed a serious threat to the expansion of the industry. This
led the employers to seek the help of agents to recruit labour
for the factories. Apart from paying commission and credit to
the agents, the cashew processors also provided dwelling
facilities to workers so as to ensure regular supply of labour to
the factories.
The lure of money wages and continuity of employment
induced the workers to seek work in the cashew factories.
However, during sowing and harvesting seasons they attend to
the work in the villages. This has practically resulted in h.1
igh
degree of labour absenteeism affecting the smooth operation of
factories in and around Kollam. The labour absenteeism in the
cashew industry was aggravated by the fact that women
constituted the bulk of the labour force. Absenteeism is
generally found high among women and children since they only
Page 11
84
supplement the income of the families. In the subsequent years
the difficulty of getting labour was minimised and hence the
industry began to get regular supply of workers drawn from the
lower middle class families of different castes.
3.5.1 Conditions of Work in Kerala State
Conditions of work in the cashew factories in the
early years were deplorably poor. Work used to start at 3 a.m.
and go upto 7 p.m. There was no fixity of working hours. The
factories were only in the form of worksheds with no permanent
structures. Those who were engaged in roasting of raw
cashewnuts were not given any protection from burns and
accidents. The tools used for roasting and other types of works
were primitive. Since the work started at 3 a.m. the workers
had to proceed from their homes soon after mid-night. The
majority of workers in the cashew industry were women, they
were particularly subjected to a greater degree of exploitation.
From the very beginning of the industry the
employers preferred the payment of wages at week-end on the
basis of piece rate. They enjoyed absolute freedom in wage
determination. The basic consideration was "how to get the
workers and not how much they shall be paid". The prevalence
Page 12
85
of acute poverty created a situation in which employer's freedom
in wage determination was bound to increase. The absence of
competition on the one hand and the lack of effective trade
unionism and government intervention on the other ensured the
continuation of this system for a long period.
Before the enforcement of the minimum wage
,legislation in 1953 the system of wage payment and the level of
wages were not subject to any state regulations. While then,
some categories of work (shelling and peeling) were paid on a
piece-rate basis and some others on a time-rate basis, there
was hardly any uniformity in the system and the workers were
not sufficiently organised to protect interests. Though trade
unions had been registered as early as 1940's, they were largely
controlled by employers.
During this period, the employers used to adopt
many devices to exploit labour. Weighing was one method
through which the wages of price-rated workers were
manipulated. In the case of time-rated workers, the practice of
fixing a work load to be completed for the award of wage was
used to reduce labour cost. There was no regulation to ensure
any uniformity either in the time-rate or in the work load. This
Page 13
system of work load, with all its undesirable effects, existed as
recently as 1975, when it was legally banned. Nor did the
workers, the large majority of whom were females, have any
welfare amenities like creches, social benefits like maternity
benefits, sick leave, festival paid holidays, etc. were completely
absent.
During this period there was no difference between
processing in cottages or in factories mainly with regard to
wage rates. In the absence of any legislation on wage rates
and given the scarcity of employment opportunities the
industrialists were assured of ample supply of cheap labour.
3.5.2 Trade Unions in Cashew Industry and the StateIntervention
It is popularly believed that under such conditions
the labourers united to fight for their rights. "The first trade
union exclusively for the cashew industry - Thiruvithancore Kasu
Andi Thozhilali Union was registered in 1940 by Shri.A.Thangal
Kunju Mudaliar a prominent cashew industrialist in Kollam".2
Eventhough this employer sponsored trade union had only a
short life, it paved the way for an intensive trade union
movement in cashew industry. "It is found that there were 15
Page 14
87
registered trade unions functioning in the industry in the state
even in 1952".
At present all workers are organised in trade unions
and there are five central trade unions functioning in the
cashew industry. Not only the number of trade unions
increased over time but they also became more powerful and
they have waged successfully a number of struggles on a
variety of grounds like fixing and revising minimum wages,
compensation for unemployment, etc.
It was not until 1953 that the state effectively
intervened to regulate wages and working conditions in the
industry. Even this was not done without considerable struggle
by trade unions. Though the Minimum Wages Act came into
effect in 1948, the cashew industry was not mentioned in the
original schedule of industries. It was only after wide spread
strikes and agitations that the cashew industry was included in
the schedule in 1951.
The trade union activity to organise the cashew
workers to press for better wage and working conditions began
to gather force after independence. The number of disputes and
Page 15
88
man days lost assumed significant dimensions in 1951 and 52.
Perhaps this contributed to the appointment of Minimum Wages
Committee for cashew industry in 1952.
In 1952, the Government of Travancore-Cochin by
their notification dated 23rd April 1952 appointed a committee
under the Chairmanship of Sri. A.P. Udayabhanu, Advocate,
Thiruvananthapuram. The committee submitted its report in
1953 and minimum wages for cashew industry came into force
for the first time on 30th December, 1953.
In between 1953 and 1960 there was no change in
minimum wage legislation. But as the cost of living began to
rise in the mid fifties, the agitation by the trade unions
intensified. In 1958, there were 19 disputes involving 11,000
workers; the corresponding figures for the next year were nearly
twice that level and 1960 witnessed on the all time high level
of labour unrest in the industry. On the face of this, the
Government appointed the second minimum wages committee
for cashew industry in 1959 under the chairmanship of
Shri.K.J.Mathew Tharakan. On the basis of the recommendations
of this committee, the Government of Kerala revised the rates
of minimum wage for cashew workers with effect from 15t"
June 1960.
Page 16
89
An 'important feature of 1960 notifications is that it,
for the first time, introduced compensation for changes in cost
of hying. Till 1960 there was n distinction of earnings as
basic wage or Dearness Allowance and hence no adjustments
for changes in the cost of living. The increase in the labour
cost due to the revision of the minimum wages in 1960
induced the factory owners first to shift their processing to
"cottages" and later to Kanyakumari District of Tamil Nadu.
The continued agitations of the unions (after 1960
when cottage processing became important due to the fixation of
minimum wages in factories, the diversion of raw nuts from
factories to cottages led to struggles in 1965 and 67 by factory
workers and this has resulted in the passing of the unregistered
Cashewnut Factories Prohibition Act of 1967 and the revision of
minimum wages in 1967) led to the further revision of
minimip rages in 1967. The factory workers in Kerala did not
get the full benefit of this revision because, this together with
the passing of the law prohibiting unregistered units in Kerala
in the same year only accelerated to shift the industry to
Kanyakumari District of Tamil Nadu.
Page 17
The intensity and magnitude of the shifting of the
processing units to Tamil Nadu can be understood from the
growth in the number of factories since 1966 (see Table 3.5).
Table 3.5
GROWTH IN NUMBER OF CASHEW PROCESSING FACTORYIN KERALA AND TAMIL NADU
Number of Factories
State 1966 1972 1980 1991
Kerala 211 214 260 367
Tamil Nadu 12 107 172 224
Total 223 321 432 591
Source: Economic Review, State Planning Board, Trivandrum
It is obvious from Table 3.5 that the growth of
factories in Tamil Nadu occurred after 1966, when the minimum
wages were revised in 1967. It is also worth noting that during
the period 1996-1972, the growth of factories in Kerala was
almost nil and in 1991 slowly increased.
The adverse effects on employment in Kerala were
further compounded by shortage of raw nuts. Several factories
Page 18
91
were closed and the state intervened to protect the jobs. of the
workers by the taking over of some factories. Even so the total
quanthm of work declined and the average duration of employment
per worker per year fell steadily. While the unions continued to
agitate, they have been unable to check the declining trend in
employment and their effective power has been substantially
eroded. The latest revision of the minimum wages has taken
place in September 1975. A distinct feature of 1975 notification
is the abolition of work-load system.
Wage rates both overall and for different categories
of workers were the highest in the factory establishments
located in Kollam. On an average a worker employed in this
segment got 36 to 37 per cent more than his counterpart in
the cottage sector in the same town. The wage rates in the
cottage sector, apparently was also subject to wider variation
than in the factory sector. However, the cottage worker in
Kollam was considerably better paid than the factory worker inLI
Kanyakumari District.
"The mean wage in cottage processing in Kerala was
54 per cent of that in factory processing and the mean wage in
factory processing in Tamil Nadu was only 34 per cent of that
of factory processing in Kerala".4
Page 19
The Cashew Industry in Tamil Nadu has still not
been brought under the Minimum Wages Act and Factories Act
1948. Consequently, not only are the low wage rates but no
payments need be made by way of Dearness Allowance, Maternity
Benefits, Holiday Wages and other benefits provided by the Act.
The main feature of locating or shifting cashew industry from
Kerala to Tamil Nadu are low labour cost, no labour legislations
and weakness of Trade Union activity. The child labour is
available on a large scale in Tamil Nadu unlike in Kerala. It
has been estimated that workers below the age of 16 account
for about 15 per cent of the work force. Working hours are
also long (10 hours or more); and even the bare minimum of
amenities available in the factories in Kerala are non-existent in
the factories in Tamil Nadu. In fact, "the conditions of work
existing at present in the factories in Kanyakumari are as bad
as the conditions which prevailed in Kollam in the early stages
of the cashew industry during the 1930's.
Cashewnut processing industry in Kanyakumari District
is only 40 years old. The first factory began functioning in
1960. When the cashew magnets in Kollam found themselves
helpless before the organised and right conscious labourers they
searched for safer places where they could make money the
Page 20
easy way. Vilavancode and Kalkulam Taluks, with abundant
cheap labour presented a haven for them. The way the first
enterprising industrialists minted money there served as an
inducement for the rest, resulting in a steady migration of
cashewnut from the cashew district of Kollam to that area.
Now almost all the licenced factories there are run by such
migrated cashew industrialists of Kerala.
The exodus of the industrialists has naturally hit the
Kerala Cashew Industry hard. Those who chose to stay behind
were left without even the raw nuts to provide work for the
labourers they had hired. Since the processing charges were
cheaper in Kanyakumari District, the industrialists managed to
move all the available raw nuts there leaving their brethren in
the lurch. Though the Kerala Government has imposed a ban
on the movement of nuts from the State, smuggling goes on
unabated.
3.6. PRODUCTIVITY IN KERALA
In India, the total production of raw cashewnuts
has reached an all time high of 1,40,000 tonnes in 1990. The
share of Tamil Nadu in India's total production was estimated
Page 21
at 15,000 tonnes for the factory sector.' But Kanyakumari
District could account for only 4,840 tonnes in the same year.6
The average productivity is found to be the highest in Kerala.
In 1990 the per hectare productivity in Kerala was estimated at
1,122 kilograms of raw nuts. It was five times that of the all
India average of 222 kilograms per hectare. In Tamil Nadu the
average yield stood at 400 kilograms per hectare for the same
year.
3.7. FLOW OF RAW CASHEWNUTS INTO KANYAKUMARIDISTRICT FROM KERALA
The local production of raw nuts in Kanyakumari
District is quite inadequate for the installed processing capacity.
So the industry depends upon imported nuts from abroad and
smuggled nuts from other states, particularly from Kerala and
Karnataka. Raw cashewnuts are being smuggled to the factories
of Kanyakumari District mainly through Maakkottam, Shenkottai
and Balaramapuram.
Another major centre of smuggling of raw cashewnuts
from Kerala to the factories of Kanyakumari District is
Panachamoodu, which is the border of Kerala and Tamil Nadu.
More than 20 tonnes of raw cashewnuts are being smuggled
Page 22
95
daily through Panachamoodu by head-loads and vehicles.7
People get profit when they bring the cashew to the Tamil
.' Nadu border. The raw nuts collected from Ariyancode,
Kattakada and Malayinkeezu are brought through head-loads.
The cyclists smuggle cashew through the Neyyar dam during
summer when there is less water in the dam. They need not
fear the check post. The raw nuts collected from Nedumangad,
Venjaramoodu, Vidhura and Anchal are smuggled through trucks
and cars. These cashews are brought in trucks and jeeps to
Vellarada through Mandapathinkadavu, Neyyar Dam Kallikadu
and from Vellarada the raw cashewnuts are brought to the
factories of Kanyakumari District through Kadukkara,
Panacharnoodu, Puliyoorshala, Cheriyakolla, Kannumamoodu and
Tholadi.
3.8. PATTERN OF OWNERSHIP OF CASHEW PROCESSING UNITS
In Kanyalcumari District out of a total of 350
cashew factories, as many as 305 units are owned and directly
administered by entrepreneurs from Kerala and Karnataka.
As the cashew processors of Kerala are noted for
their traditional skill expertise and experience, they are able to
Page 23
outshine the local producers who are totally new to the
industry. Further, in the cashew factories owned or operated by
Keralities, the entire administrative staff are from Kerala and
they are under the direct control of their headquarters at
Kollarn. They do not give out any of their business secrets. The
natural corollary of it is that the local cashew producers, unable
to cope up with the market pressures, have come forward to
lease out their factories to their counter-parts from Kerala.
3.8.1 Leasing
There were 15 local cashew processors with 45 cashew
factories in the district. But the survey undertaken in the
taluks of Kalkulam and Vilavancode made it evident to the
investigator that this number has come down as nine of the
local processors have given their factories on lease to processors
from Kerala.
There are two kinds of leasing-direct leasing and
indirect leasing.
3.8.2 Direct Leasing
Direct leasing is usually resorted to when a cashew
factory runs into severe loss. The terms and conditions of
Page 24
97
direct leasing are such that the entire factory is taken over by
the lease-holder. In Vilavancode and Kalkulam Taluks the
cashew factories are usually taken on lease renewable every
year by the Quilon based cashew kernel producers. A
consolidated sum of Rs.6000 to Rs. 10,000 is paid to the lessor
every month as rent. Appointment of workers and supervisors is
made by the lessee. He is not bound by the terms and
conditions of the lease to retain those who were already in
employment.
3.8.3 Indirect Leasing
Indirect leasing is resorted to during periods when
cashew factories meet with problems pertaining to short-supply
of raw cashewnuts. If a certain factory has exhausted the
entire stock of its raw cashewnuts and it is on the brink of a
lay off, it would call upon other cashew factories with very
huge stocks of raw cashewnuts, to process their nuts. If this
offer is accepted, a cashew factory can keep functioning even
during periods when raw cashewnuts are in short supply.
When a cashew factory thus undertakes to process the nuts of
somebody else, it can avoid or reduce lay off which is one of
the major problems in many agro-based industries. This system
is known as indirect leasing in the jargon of the cashew
Page 25
ralmePAC
industry. During the period when a cashew factory is held on
indirect lease, the lessee pays the employees their wages, and
he pays the lessor rent for the use of his equipments at the
rate of 12 to 18 rupees per bag processed. In another method
of indirect leasing, the lessee supplies the raw nuts and pays a
sum of Rs.250 per bag on contract basis for processing
expenses. This amount is quite attractive to the lessor as it is
Rs. 15 to 30 more than what could be expected as returns for
a bag of rawnuts processed.
3.8.4 Cashew Combines
Combine is a type of business organisation which
had its origin in the U.S.A. The principle involved in forming a
combine consists in the opening of numerous factories or
processing units by a lone or a group of producers. Combines
facilitated the growth of monopolistic trends in the U.S.A. which
ultimately led to the enactment of numerous antitrust
legislations. The growth of combines in the cashew industry
was spearheaded by industrialists namely the Vendor Groups,
Rajmohan Cashew (R.M.C.) K.Parameswaran Pillai & Co. (K.P.P.)
and the Mudaliar Group. Cashew combines were launched by
starting several small-scale units by the same individual or
group of entrepreneurs to reap the advantages such as:
Page 26
WeWAM
1. getting loans from the same credit institution in different
names.
2. deriving all the advantages of industrial units in the
small-scale sector.
3. evading the stringent provisions of labour laws and tax
laws.
4. establishing monopolistic control over the markets for
cashew kernels and
5. keeping the trade secrets of these business groups.
As the administrative staff are transferred from one
factory to another quite often, they do not get any opportunity
to get into contact with the local producers and thereby spread
the business secrets or details about the structure and
functioning of their business groups.
There are three main reasons why business groups
prefer Kanyakumari District to establish business combines.
They are:
1. The District is quite close to Kerala. This makes the
smuggling of raw nuts from Kerala quite easy.
Page 27
100
2. In Kanyakumari District labour is cheap, compared to
Kerala. The workers are less militant in forming trade
unions.
3. In Kanyakumari District, the cashew industry does not
come under the Minimum Wages Act and certain other
labour laws. The employees in cashew factories do not
claimbur for provident fund, sickness benefits, maternity
leave facilities and improved hygenic conditions although
they are provided for in the legislations.
4. Finally, the workers are quite skilled for the industry and
child labour is also available in plenty.
3.9. NATURE OF EMPLOYMENT AND WAGE STRUCTURE
The 350 cashew factories in Kanyakumari District
provide employment opportunities to as many as 60,000 men
and women, of different age groups. About 90 per cent of the
workers are females. Of this most of them are non-household
workers. The nature of employment in the cashew factories is
such that it could be brought under six broad categories. They are:
1. Roasters
2. Shellers
3. Peelers
4. Graders
5. Packers and
6. General Administrative Staff
Page 28
101
3.9.1 Roasters
The roasters in a cashew factory are entrusted with
the most important task of getting the raw cashewnuts suitably
roasted for shelling. Under normal circumstances a cashew
factory of average size requires six roasters. These six roasters
attend to jobs such as feeding the nuts into the roasting drum,
stirring, drum operations, removal of roasted nuts, carrying the
roasted nuts to the shelling section and fetching water. They
are paid at a flat rate of Rs.81/- per day. In certain factories
there are only five roasters. Here each roaster is paid a sum
of ten extra and the management gains thirty one rupees
altogether.
As the roasters usually begin their work as early as
5 a.m. everyday, they are selected mostly from places around
the cashew factories. A cashew factory can roast, on an
average, of 48 bags of raw nuts per day. Roasting is done in
two shifts. Each roaster should roast about eight bags of nuts.
When these nuts go through the other stages of processing, the
roasters begin their second shift of work. However, the
quantum of work done in the two shifts has a tendency to
differ in certain factories, although considerable standardisation
could be observed.
Page 29
102
In addition to their routine work, they are engaged
in loading the processed nuts and unloading the raw nuts. For
unloading local nuts they are paid at the rate of two rupee
fifty paise per bag. But, when they unload imported nuts, they
are paid at the rate of two rupee per bag. Over and above
these, they also do the work of checking the shells every
evening. This is an extra work and the roasters who do it are
paid in kind. The practice in Kanyakumari District is to give
each roaster a bag of cashew shells free of cost for a week's
checking work. The checking work is undertaken to see if the
roasted cashewnuts are purposely or carelessly taken along with
the shells.
3.9.2 Shellers
The usual practice in the cashew factory is to
employ only women workers in the shelling section. They
constitute 44.1 per cent of the total work force. Shelling is
usually done with a wooden block. One gentle knock at the
ventral side would make the shell covering the kernel to split
and go into two halves. A sheller, with ordinary skill, can
produce about eight kilograms of kernels a day. However, the
quantity of work done depends on the size and nature of nuts.
The nuts brought from Kerala are bigger in size when compared
Page 30
103
to the locally available nuts. So one can produce more than 8
kgs, of kernel a day if one is supplied with nuts from Kerala.
The shellers are paid according to the piece rate
system. They are paid at the rate of 4 rupee and 10 paise for
every kilogram of kernels produced. The work done by the
shellers is carefully supervised. As the supervisors are mostly
from Kerala they see to it that the shellers execute their work
with neatness and care.
3.9.3 Peelers
The peelers are employed to remove, with utmost
care and dexterity, the husks covering the kernels. Peeling is
done 48 hours after the kernels pass through the Bhorma
stage. The women workers who are engaged in peeling account
for 36.8 per cent of the work force in the cashew factory. They
are paid at the rate of 4 rupee and 70 paise per kilogram of
kernels peeled.
3.9.4 Graders
Grading is a relatively lighter job. So workers, in
the grading section are called 'mekkadu' workers. Payment for
them is made on the basis of a 'vela' or a unit of work. The
Page 31
104
graders separate the kernels into more than 18 grades. They
constitute 11.03 per cent of total workers in cashew industries.
3.9.5 Packers
The work of filling the processed nuts is being done
in a 'consumer centre', if a single proprietor owns more than
one factory. The work is done in the same factory, if the
proprietor owns only one factory. Some times the processed
nuts are sold locally to other industrialists. Tins are used for
packing processed nuts. Carbon-di-oxide is filled in the tins
before sealing to keep the kernels free from contamination. The
tins are carefully packed in cardboard boxes. The packers form
2.64 per cent of the workers in a cashew factory. They are
paid at the rate of Rs.81 per day.
3.9.6 Administrative Staff
The administrative staff of a cashew factory include
a manager, two clerks, and two or three watchmen. They were
found to be those from Kerala. The salary of the manager
ranges from Rs.3000/- to Rs.4000/- But it is Rs.1500/- to
Rs.2500/- for clerks and Rs.1200/- to Rs.1600/- for supervisor
and watchmen per month.
Page 32
105
3.10 GRADING FUNCTIONS OF KERNELS IN CASHEW FACTORIES
The cashewnuts are turned into finished products
through the process explained in Chapter two. The cashew
kernels could be brought under 18 major categories. The out
turn in each stage and the method by which the categorisation
is done are discussed with the data obtained from the cashew
factories through Table 3.6, Table 3.7 and Table 3.8 and 3.9.
Table 3.6
OUT TURN IN THE PROCESSING OF 22 BAGS (1760 Kg)RAWNUTS
(Shelling input 1760 Kgs of Rawnuts)
Out turn in Kgs. Out turn per bag (80 kgs)in Kgs.
Wholes 475.5 21.61Pieces 18.0 0.82Perival 1.4.5 0.66Rejection 3.5 0.16
Total in Kgs. 5 11. 5 23.25
Source: Collected from cashew factories
Page 33
106
Table 3.7
OUTPUT FROM PEELING OF 475.5 Kgs. OF WHOLES, 18 Kgs.PIECES AND 14.5 Kgs. OF PERJVAL
L Different Categories of output Wholes Pieces Pervival
1. White wholes 244.02. Scorched wholes 12.03. Brown wholes 72.04. Puzhukuttu wholes 42.55. Puzhukuttu Scorched wholes 6.06. Perival wholes 3.77. Scorched wholes-2 2.5
Total 382.78. Buds - -
Scorched Buds 8.7 2.6Splits 0.4 0.4Scorched splits 7.2 2.8Pieces 1.0 0.4Scorched pieces 14.5 8.2Desert pieces 2.2 0.7 0.2Vellakedu 1.4 0.6Kattal podi 0.8 -Gurunna podi 0.6 0.2Gurunnapodi-2 11.5 0.6white splits 4.8Brown pieces -
Brown pieces-2 0.7Tholipilpodi 0.1Perival podi 0.1Total (inKgs) 431.0 16.5 1 13.4
Source: Data supplied by the factories
Page 34
—LU
0—
—
——
---.
o
a
a
a
-—
4(N
LI)(N
(N
V
I
-4o9
0o
o o
00
oo
0
0
0
ciC
J)rii
Co
ON
-—
4a
co
II
(NC
o—
o
(N
C)
-4C
o
o
-
CL
Co
VC) —
--
-—
cd
.,-1V
V
V
Co
0
Coco
V
0V
OV
--'
C)o
O
0)
0O
.-4C
I) C
I) C
I) C
I)P.
CI)
o
I!)C
o.O
Co
(N
Co
-
(N(N
-
-
(N
CO
Cd
Co
V—4
Co
0E1-i-4
-V
0
VV
p.
—4
0_
.-00
0s-I
s-4V
V
Co
(J
(N
LI)(N
0I
•
.C
;0
0
LI)0
—4
Co
Cl)C
o
Co
v
v
EC)
0
0
coCd
•-V
V
V-
..
V
--4
0
Co
op
.C
o0
0
NV
0•,.4
Vo
M 04
p-4
CL4 C
14
0 _____ ______
0C
C
(N
C
C)
1-4
LI)
C
(N
0
(N
(N-'-I
0
0
-
-0
10
P4
P4
Cd
0
0—
404
0
-;
p.
V
V
o
'-4
-
--
Vo
o
E-
C
C
It
C
CO
—
U,
C
C
(N
I I
0O0U-
0zQ
107
V-40V—4
—40C.)
0• -4-4s-I
• -4V4)
0-dV-4-I
E00I.'
0
Page 35
108
Table 3.9
NET OUT TURN FROM 22 BAGS (1760 Kgs)
Items 22 Bags Per bagKg. Kg.
Export quality / American qualityWholes 338.1 15.37Pieces 88.7 4.03
Indian Quality / Local QualityWholes 7 0.32Pieces 12.6 0.57
Rejection 14.5 0.66
Total 460.9 20.95
Source: Prepared from the collected informations
Generally 90 percent of the kernels can be produced
in wholes, provided there are skilled and efficient workers. The
factory which processes 22 bags of raw cashewnuts (1760 kg)
produces 475.5 kg. kernels in wholes, 18 kg. in pieces, 14.5 kg.
as 'perival' and 3.5 kg. as rejection. Thus a total of 511.5 kg.
of kernels are obtained from 1760 kg. of raw nuts. In other
words 9.295 percentage of wholes, 3.53 percentage of pieces,
2.84 percentage of perival and 0.68 percentage of rejection are
obtained in shelling.
Page 36
109
Shelled kernels are sent for peeling after heating in
Borma. Usually 18 categories of kernels are obtained in peeling.
They are seven types of whole kernels, namely White Wholes
(W.W.), Scorched Wholes (S.W), Brown Wholes (B.W), Puzhukuttu
Wholes (Puk), Puzhukuttu Scorched Wholes (PUK2), Perival
Wholes (P.W) and Scorched Wholes 3 (S.W3). The other eleven
categories are Buds (B) Scorched Buds (S.B) Splits (S), Scorched
Splits (S.S.), Pieces (P.S.), Scorched Pieces (S.P.), Desert Pieces
(D.P), Vellakedu (V.K.), Kattal Podi (K.P.), Gurunnupodi (G.P.)
and Gurunnupodi Second (G.P2). While peeling 475.5 kg
kernels obtained in shelling, W.W. 244 Kg., S.W. 12 Kg., B.W. 72
Kg., Puk 42.5 Kg, Puk2 6 Kg., P.W. 2.7 Kg., and S.W3 2.5 Kg. of
wholes are obtained. Thus a total of 382.7 Kg. of wholes are
obtained. Apart from the wholes S.B. 8.7 Kg., S. 0.4 Kg., S.S.
7.2 Kg., P.S. 1 Kg., S.P. 14.5 Kg., D.P. 2.2 Kg., V.K. t4 Kg., K.P.
0.8 Kg., G.P. 0.6 Kg. and G.02 11.5 Kg. are also obtained.
Thus a total of 48.3 Kg. of kernels other than wholes are
obtained. While peeling 18 kg. of pieces S.W. 2.6 Kg., S 0.4 Kg.,
S. S. 2.8 Kg., P. S. 0.4 Kg., S. S. 2.8 Kg, P. S. 0.4 Kg, S. P. 8.2 Kg,
D.P. 0.7 Kg., K.K. 0.6 Kg, G.P. 0.2 Kg. and O.P.2 0.6 Kg. are
obtained. Thus a total of 16.5 Kg. of pieces are obtained.
While peeling 14.5 Kg. of perival W.S. 4.8 Kg., D.P. 0.2 Kg. B.P.
0.7 Kg. and B.P.2. 7.5 Kg., T. P. 0.1 Kg. and PVP 0.1 Kg. are
Page 37
110
obtained. Thus a total of 13.4 Kg. of perival kernels are obtained.
Hence a net out turn of 460.9 Kg. of kernels in different
categories are obtained from 22 bags (1760 kgs) of nuts.
After peeling, the kernels are sent for selection.
(Selection is the word used in the industry for grading) kernels
are selected as export quality and local quality (Indian Quality).
Selection of wholes is done on the basis of counts namely 180,
210, 240, 320, 450 (whole kernels per pound), scorched wholes
and scorched small wholes. Under pieces, buds, splits, scorched
splits, pieces, scorched pieces, white scorched pieces (W.S.P.)
and scorched small pieces (S.S.P.) are obtained. These are
exported. Kara Niram (K.N.), Raja Wholes (R.W), Perival Wholes
(P.W.), Perival Wholes 2 (P.W2), Scorched Wholes (S.W1),
Scorched Wholes 2 (S.W2) and Kuruppal Wholes (K.W.) are the
wholes that come under local quality that is not exported.
Desert Pieces (D.P.), Brown Pieces (B.P.), Brown Pieces 2 (B.P.2),
Scorched Small Pieces, Perival Pieces (P.W.P.), Puzukuttu Pieces
(Puk P) Chettu Podi, Cheevu Podi, Kattal Podi, Tholipil, Perival
Podi, Gurunnu and Gurunnu 2 are the other items of kernels
that come under local quality. Thus from the 460.9 kg. of
peeled kernels 20.8 kg. of 210 counts, 87.9 kg. of 240, 217.1 kg.
of 320, 8.9 kg. of 450 and 3.4 kg of S.W. wholes are obtained
Page 38
111
for export. In total 338.1 kg. of wholes are obtained for export.
22.4 kg. of B, 11.5 kg of S.B., 10.8 kg. of S, 4.7 kg. of S.S.,
26.6 kg. of P.S., 8.8 kg. of S.P., 1.7 kg. of W.S.P. and 2.2 kg.
of S.S.P. are obtained for export. A total of 88.7 kg. of pieces
are produced for export. Under the local quality wholes K.N.
0.2 kg. P.W. 0.7 kg, S.W. 0.5 kg, S.W. 25.4 kg, K.W. 0.2 kg.
and thus a total of 7 kg. of wholes come under this quality. 3
Kg. of D.P., 5 Kg. of B.P., 0.2 Kg. of B.P. 2, 2 Kg. of S.S.P. 2,
0.3 kg. of P.W.P. and 2.10 kg. PUKP are obtained as pieces
under local quality. Apart from this 0.4 kg. of Chettupodi 1 kg.
of Cheevupodi 0.8 kg. of Kattal podi, 0.1 kg. of Tholipil and
12.1 kg. of Perivalpodi are obtained. Thus a total of 14.5 kg.
of podi other than wholes and pieces are got under local
quality. The table 3.10 shows the count ratio of grades.
Table 3.10
SHOWING THE APPROX COUNT RATIO OF GRADES
Kilogram Count Ratio of Grades
1 Kg. Wholes 180 396 Kernels
1 Kg. Wholes 210 462 Kernels
1 Kg. Wholes 240 528 Kernels
1 Kg. Wholes 320 705 Kernels
1 Kg. Wholes 450 990 Kernels
Source: Cashew Export Promotion Council of India, CochinExport on Directory, p.21, 1999
Page 39
112
To summarise, after processing 1760 kg. (22 bags) of
raw nuts, 338.1 kg. of export quality wholes, (American Quality)
88.7 kg. of export quality pieces, 7 kg. of Indian quality wholes
and 12.6 kg. of Indian quality pieces are produced. In addition
to this, there is 14.5 kg. of kernels which come under the
rejected category. In a nut shell, a bag of 80 kg. of raw nuts
produces 20.29 kg. of processed kernels. This clearly shows
that the net out turn is 25% of the total quantity processed.
The act prescribes 33 different grades of cashew kernels. But
only 26 grades are commercially available and exported in the
structure.
Page 40
113
References
1. Population Census-2001, Kanyakumari District, Statistical
Office, Nagercoil.
2. Report of the Commission for Enquiry into the Cashew
Industry, 1970, Appukuttan Nair, D, Chief Engineer, PHED,
Thiruvananthapuram.
3. Report of the Travancore-Cochin Minimum Wages
Committee for Cashew Industry, 1952.
4. Kannan, K.P. Cashew Development in India - Potentialities
and Constrains, Agricole Publishing Academy, New Delhi,
1983, p.111.
5. "Seasons and Crop Report of Tamil Nadu for Agriculture"
issued by the Commissioner of Statistics, Government of
Tamil Nadu, 1990.
6. Profile of Kanyakumari District, Cropping Pattern District
Industries Centre, Nagercoil, 1990.
7. "Malayala Manorama" Daily, February 17, 1990, p.3.