CHAPTER 10 FIXED ASSETS AND INTANGIBLE ASSETS EYE OPENERS 1. a. Tangible b. Capable of repeated use in the operations of the business e. Long-lived 2. a. Property, plant, and equipment b. Current assets (merchandise inventory) 3. Real estate acquired as speculation should be listed in the balance sheet under the caption “Investments,” below the Current Assets section. 4. $298,500 5. Capital expenditures include the cost of acquiring fixed assets and the cost of improving an asset. These costs are recorded by increasing (debiting) the fixed asset account. Capital expenditures also include the costs of extraordinary repairs, which are recorded by decreasing (debiting) the asset’s accumulated depreciation account. Revenue expenditures are recorded as expenses and are costs that benefit only the current period and are incurred for normal maintenance and repairs of fixed assets. 6. Capital expenditure 7. A capital lease is accounted for as if the lessee has purchased the asset and the asset is written off over its useful life. An operating lease is accounted for as a current-period expense (rent expense). 8. Ordinarily not; if the book values closely approximate the market values of fixed assets, it is coincidental. 9. a. No, it does not provide a special cash fund for the replacement of assets. Unlike most expenses, however, depreciation expense does not require an equivalent outlay of cash in the period to which the expense is allocated. b. Depreciation is the cost of fixed assets periodically charged to revenue over their expected useful lives. 10. 12 years 581 581
Transcript
CHAPTER 10FIXED ASSETS AND INTANGIBLE ASSETS
EYE OPENERS
1. a. Tangibleb. Capable of repeated use in the opera-
tions of the businesse. Long-lived
2. a. Property, plant, and equipmentb. Current assets (merchandise inventory)
3. Real estate acquired as speculation should be listed in the balance sheet under the cap-tion “Investments,” below the Current Assets section.
4. $298,5005. Capital expenditures include the cost of ac-
quiring fixed assets and the cost of improv-ing an asset. These costs are recorded by increasing (debiting) the fixed asset ac-count. Capital expenditures also include the costs of extraordinary repairs, which are recorded by decreasing (debiting) the as-set’s accumulated depreciation account. Revenue expenditures are recorded as ex-penses and are costs that benefit only the current period and are incurred for normal maintenance and repairs of fixed assets.
6. Capital expenditure 7. A capital lease is accounted for as if the
lessee has purchased the asset and the as-set is written off over its useful life. An oper-ating lease is accounted for as a current-pe-riod expense (rent expense).
8. Ordinarily not; if the book values closely ap-proximate the market values of fixed assets, it is coincidental.
9. a. No, it does not provide a special cash fund for the replacement of assets. Un-like most expenses, however, deprecia-tion expense does not require an equiv-alent outlay of cash in the period to which the expense is allocated.
b. Depreciation is the cost of fixed assets periodically charged to revenue over their expected useful lives.
10. 12 years
11. a. Nob. No
12. a. An accelerated depreciation method is most appropriate for situations in which the decline in productivity or earning power of the asset is proportionately greater in the early years of use than in later years, and the repairs tend to in-crease with the age of the asset.
b. An accelerated depreciation method re-duces income tax payable to the IRS in the earlier periods of an asset’s life. Thus, cash is freed up in the earlier peri-ods to be used for other business pur-poses.
c. MACRS was enacted by the Tax Re-form Act of 1986 and provides for de-preciation for fixed assets acquired after 1986.
13. No. Financial Accounting Standards No. 154, “Accounting Changes and Error Cor-rections,” is quite specific about the treat-ment of changes in depreciable assets’ esti-mated service lives. Such changes should be reflected in the amounts for depreciation expense in the current and future periods. The amounts recorded for depreciation ex-pense in the past are not affected.
14. a. No, the accumulated depreciation for an asset cannot exceed the cost of the as-set. To do so would create a negative book value, which is meaningless.
b. The cost and accumulated depreciation should be removed from the accounts when the asset is no longer useful and is removed from service. Presumably, the asset will then be sold, traded in, or discarded.
15. a. Over the shorter of its legal life or years of usefulness.
b. Expense as incurred.c. Goodwill should not be amortized, but
written down when impaired.
581581
PRACTICE EXERCISES
PE 10–1A
May 27 Accumulated Depreciation—Delivery Van........ 950Cash................................................................. 950
Second-year depreciation...... (60,750 ) [($324,000 – $81,000) × 25%]Book value at end of second year.... $182,250
Gain on sale ($200,000 – $182,250) = $17,750
c. Cash................................................................................. 200,000Accumulated Depreciation—Equipment...................... 141,750
Equipment.................................................................. 324,000Gain on Sale of Equipment...................................... 17,750
PE 10–6B
a. $9,500 [($160,000 – $17,500)/15]
b. $13,000 loss {$90,000 – [$160,000 – ($9,500 × 6)]}
c. Cash................................................................................. 90,000Accumulated Depreciation—Equipment...................... 57,000Loss on Sale of Equipment........................................... 13,000
b. $18,693,000 = (31,155,000 tons × $0.60 per ton)
c. Dec. 31 Depletion Expense........................................ 18,693,000Accumulated Depletion........................... 18,693,000
Depletion of mineral deposit.
PE 10–7B
a. $0.40 per ton = $50,000,000/125,000,000 tons
b. $16,954,000 = (42,385,000 tons × $0.40 per ton)
c. Dec. 31 Depletion Expense........................................ 16,954,000Accumulated Depletion........................... 16,954,000
Depletion of mineral deposit.
PE 10–8A
a. Dec. 31 Loss from Impaired Goodwill...................... 500,000Goodwill................................................... 500,000
Impaired goodwill.
b. Dec. 31 Amortization Expense—Patents.................. 24,250Patents...................................................... 24,250
Amortized patent rights [($388,000/8) × 6/12].
PE 10–8B
a. Dec. 31 Loss from Impaired Goodwill...................... 875,000Goodwill................................................... 875,000
Impaired goodwill.
b. Dec. 31 Amortization Expense—Patents.................. 18,750Patents...................................................... 18,750
Amortized patent rights [($425,000/17) × 9/12].
EXERCISES
Ex. 10–1
a. New printing press: 1, 2, 3, 4, 6
b. Used printing press: 7, 8, 9, 11
Ex. 10–2
a. Yes. All expenditures incurred for the purpose of making the land suitable for its intended use should be debited to the land account.
b. No. Land is not depreciated.
Ex. 10–3
Initial cost of land ($30,000 + $270,000).................... $300,000Plus: Legal fees.......................................................... $ 1,425
Delinquent taxes............................................... 12,000Demolition of building...................................... 18,500 31,925
$331,925Less: Salvage of materials......................................... 4,500 Cost of land.................................................................. $327,425
July 15 Delivery Truck...................................................... 1,100Cash................................................................. 1,100
Oct. 3 Repairs and Maintenance Expense................... 72Cash................................................................. 72
Ex. 10–7
a. No. The $3,175,000 represents the original cost of the equipment. Its replace-ment cost, which may be more or less than $3,175,000, is not reported in the financial statements.
b. No. The $2,683,000 is the accumulation of the past depreciation charges on the equipment. The recognition of depreciation expense has no relationship to the cash account or accumulation of cash funds.
*Mileage depreciation of $5,250 (21 cents × 25,000) is limited to $3,000, which reduces the book value of the truck to $9,900, its residual value.
b. Depreciation Expense—Trucks.................................... 31,370Accumulated Depreciation—Trucks....................... 31,370
Truck depreciation.
Ex. 10–12
First Year Second Year
a. 5% of $75,000 = $3,750 5% of $75,000 = $3,750
or or
($75,000/20) = $3,750 ($75,000/20) = $3,750
b. 10% of $75,000 = $7,500 10% of ($75,000 – $7,500) = $6,750
Ex. 10–13
a. 12 1/2% of ($172,000 – $20,000) = $19,000 or [($172,000 – $20,000)/8]
b. Year 1: 25% of $172,000 = $43,000
Year 2: 25% of ($172,000 – $43,000) = $32,250
Ex. 10–14
a. Year 1: 3/12 × [($85,000 – $5,000)/10] = $2,000
Year 2: ($85,000 – $5,000)/10 = $8,000
b. Year 1: 3/12 × 20% of $85,000 = $4,250
Year 2: 20% of ($85,000 – $4,250) = $16,150
Ex. 10–15
a. $17,500 [($1,050,000 – $420,000)/36]
b. $700,000 [$1,050,000 – ($17,500 × 20 yrs.)]
c. $20,000 [($700,000 – $300,000)/20 yrs.]
Ex. 10–16
a. Mar. 30 Carpet............................................................. 12,000Cash.......................................................... 12,000
b. Dec. 31 Depreciation Expense.................................. 600Accumulated Depreciation..................... 600
Carpet depreciation [($12,000/15 years) × 9/12].
Ex. 10–17
a. Cost of equipment..................................................................... $504,000Accumulated depreciation at December 31, 2010
(4 years at $38,500* per year)............................................. 154,000 Book value at December 31, 2010........................................... $350,000*($504,000 – $42,000)/12 = $38,500
b. (1) Depreciation Expense—Equipment....................... 9,625Accumulated Depreciation—Equipment.......... 9,625
Truck depreciation ($38,500 × 3/12 = $9,625).
(2) Cash.......................................................................... 315,000Accumulated Depreciation—Equipment............... 163,625*Loss on Sale of Equipment.................................... 25,375
a. 2007 depreciation expense: $29,250 [($265,500 – $31,500)/8]
2008 depreciation expense: $29,250
2009 depreciation expense: $29,250
b. $177,750 [$265,500 – ($29,250 × 3)]
c. Cash................................................................................. 168,500Accumulated Depreciation—Equipment...................... 87,750Loss on Disposal of Fixed Assets................................ 9,250
d. Cash................................................................................. 180,000Accumulated Depreciation—Equipment...................... 87,750
Equipment.................................................................. 265,500Gain on Sale of Equipment...................................... 2,250
Ex. 10–19
a. $16,200,000/90,000,000 tons = $0.18 depletion per ton
13,750,000 × $0.18 = $2,475,000 depletion expense
b. Depletion Expense......................................................... 2,475,000Accumulated Depletion............................................ 2,475,000
Depletion of mineral deposit.
Ex. 10–20
a. ($750,000/15) + ($90,000/12) = $57,500 total patent expense
b. Amortization Expense—Patents................................... 57,500Patents....................................................................... 57,500
Amortized patent rights ($50,000 + $7,500).
Ex. 10–21
a. Property, Plant, and Equipment (in millions):
Current Preceding Year Year
Land and buildings.................................................... $ 626 $ 361 Machinery, equipment, and internal-use software.. 595 470 Office furniture and equipment................................. 94 81 Other fixed assets related to leases......................... 760 569
$2,075 $1,481 Less accumulated depreciation................................ 794 664 Book value.................................................................. $ 1,281 $ 817
A comparison of the book values of the current and preceding years indi-cates that they increased. A comparison of the total cost and accumulated depreciation reveals that Apple purchased $594 million ($2,075 – $1,481) of additional fixed assets, which was offset by the additional depreciation ex-pense of $130 million ($794 – $664) taken during the current year.
b. The book value of fixed assets should normally increase during the year. Al-though additional depreciation expense will reduce the book value, most companies invest in new assets in an amount that is at least equal to the de-preciation expense. However, during periods of economic downturn, compa-nies purchase fewer fixed assets, and the book value of their fixed assets may decline.
Ex. 10–22
1. Fixed assets should be reported at cost and not replacement cost.
2. Land does not depreciate.
3. Patents and goodwill are intangible assets that should be listed in a separate section following the Fixed Assets section. Patents should be reported at their net book values (cost less amortization to date). Goodwill should not be amortized, but should be only written down upon impairment.
Appendix 1 Ex. 10–23
Sum of Years of Useful Life = = = 210
First year: 20/210 × $75,000 = $7,143
Second year: 19/210 × $75,000 = $6,786
Appendix 1 Ex. 10–24
Sum of Years of Useful Life = = = 36
First year: 8/36 × ($172,000 – $20,000) = $33,778
Second year: 7/36 × ($172,000 – $20,000) = $29,556
Price (fair market value) of new equipment...................................... $300,000Trade-in allowance of old equipment................................................ 120,000 Cash paid on the date of exchange................................................... $180,000
b.
Price (fair market value) of new equipment..................... $300,000Less assets given up in exchange:
Book value of old equipment..................................... $115,500Cash paid on the exchange........................................ 180,000 295,500
Gain on exchange of equipment....................................... $ 4,500
Appendix 2 Ex. 10–27
a.
Price (fair market value) of new equipment...................................... $300,000Trade-in allowance of old equipment................................................ 120,000 Cash paid on the date of exchange................................................... $180,000
b.
Price (fair market value) of new equipment........................ $300,000Less assets given up in exchange:
Book value of old equipment........................................ $127,750Cash paid on the exchange.......................................... 180,000 307,750
Loss on exchange of equipment......................................... $ 7,750
Appendix 2 Ex. 10–28
a. Depreciation Expense—Equipment.............................. 15,000Accumulated Depreciation—Equipment................ 15,000
Equipment depreciation ($20,000 × 9/12).
b. Accumulated Depreciation—Equipment...................... 235,000Equipment....................................................................... 462,000Loss on Exchange of Fixed Assets.............................. 5,000
a. Depreciation Expense—Trucks.................................... 4,000Accumulated Depreciation—Trucks....................... 4,000
Truck depreciation ($16,000 × 3/12).
b. Accumulated Depreciation—Trucks............................. 68,000Trucks.............................................................................. 150,000
Trucks........................................................................ 96,000Cash........................................................................... 120,000Gain on Exchange of Fixed Assets......................... 2,000
Ex. 10–30
a. Fixed Asset Turnover Ratio =
Fixed Asset Turnover Ratio =
Fixed Asset Turnover Ratio = 1.12
b. Verizon earns $1.12 revenue for every dollar of fixed assets. This is a low fixed asset turnover ratio, reflecting the high fixed asset intensity in a telecommunications company. The industry average fixed turnover ratio is slightly lower at 1.10. Thus, Verizon is using its fixed assets slightly more ef-ficiently than the industry as a whole.
Ex. 10–31
a. Best Buy: 12.72 ($35,934/$2,825)
Circuit City Stores, Inc.: 14.13 ($12,430/$880)
b. Circuit City’s fixed asset turnover ratio of 14.13 is higher than Best Buy’s fixed asset turnover ratio of 12.72. Thus, Circuit City is generating $1.41 ($14.13 – $12.72) more revenue for each dollar of fixed assets than is Best Buy. On this basis, Circuit City is managing its fixed assets slightly more effi-ciently than is Best Buy.
PROBLEMS
Prob. 10–1A
1.
Land OtherItem Land Improvements Building Accounts
3. Since land used as a plant site does not lose its ability to provide services, it is not depreciated. However, land improvements do lose their ability to pro-vide services as time passes and are therefore depreciated.
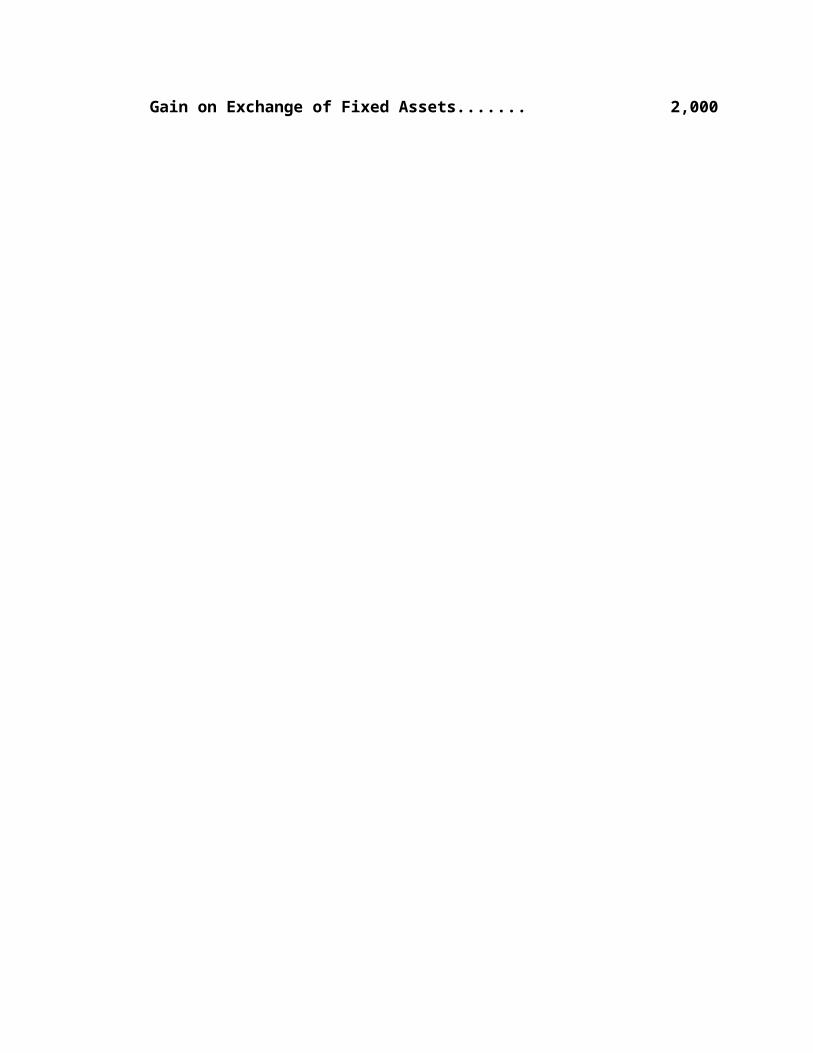
Prob. 10–2A
Depreciation Expensea. Straight- b. Units-of- c. Double-
Line Production Declining-BalanceYear Method Method Method
Equipment.................................................................. 144,000Gain on Sale of Equipment...................................... 1,750**($19,750 – $18,000)
3. Cash................................................................................. 14,900Accumulated Depreciation—Equipment...................... 126,000Loss on Sale of Equipment........................................... 3,100*
30 Acc. Depreciation—Delivery Equipment..................... 14,250Cash............................................................................... 30,000Loss on Sale of Delivery Equipment........................... 1,350
b. $675,000/10 years = $67,500; 1/2 of $67,500 = $33,750
c. $1,665,000/9,000,000 board feet = $0.185 per board foot; 2,400,000 board feet × $0.185 per board foot = $444,000
2. a. Loss on Impairment of Goodwill............................. 20,000,000Goodwill................................................................ 20,000,000
b. Amortization Expense—Patents.............................. 33,750Patents.................................................................. 33,750
Patent amortization.
c. Depletion Expense.................................................... 444,000Accumulated Depletion....................................... 444,000
Depletion of timber rights.
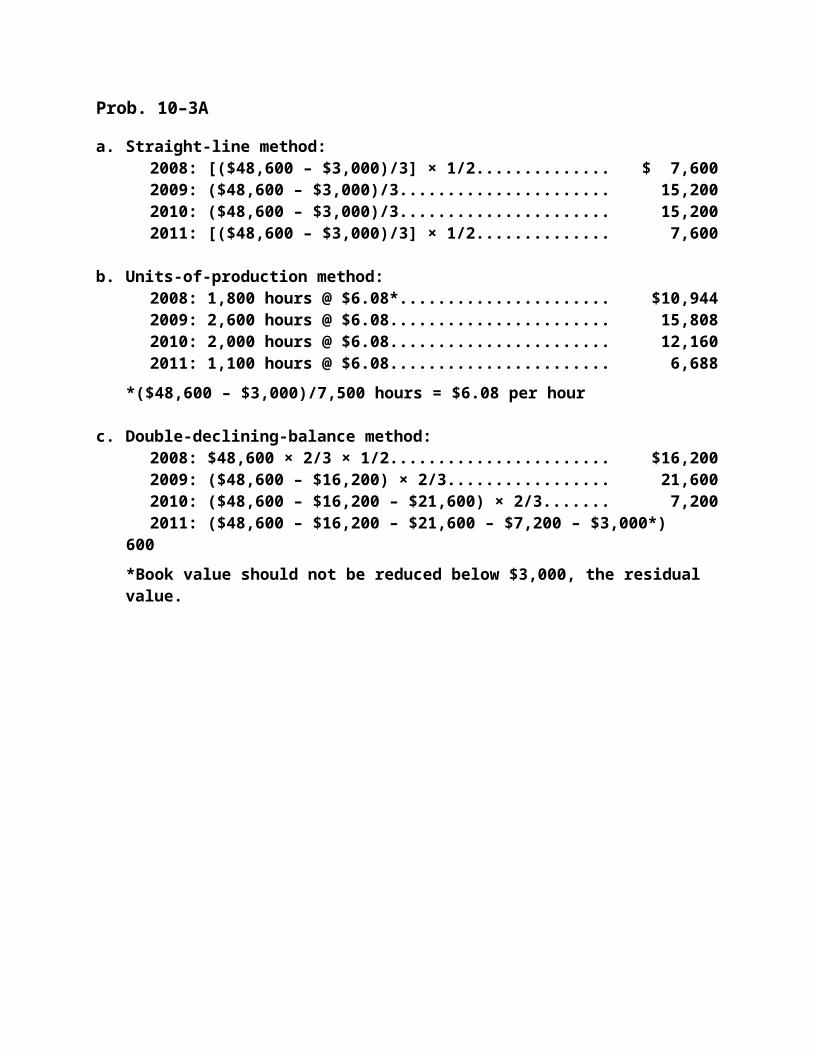
Prob. 10–1B
1.
Land OtherItem Land Improvements Building Accounts
3. Since land used as a plant site does not lose its ability to provide services, it is not depreciated. However, land improvements do lose their ability to pro-vide services as time passes and are therefore depreciated.
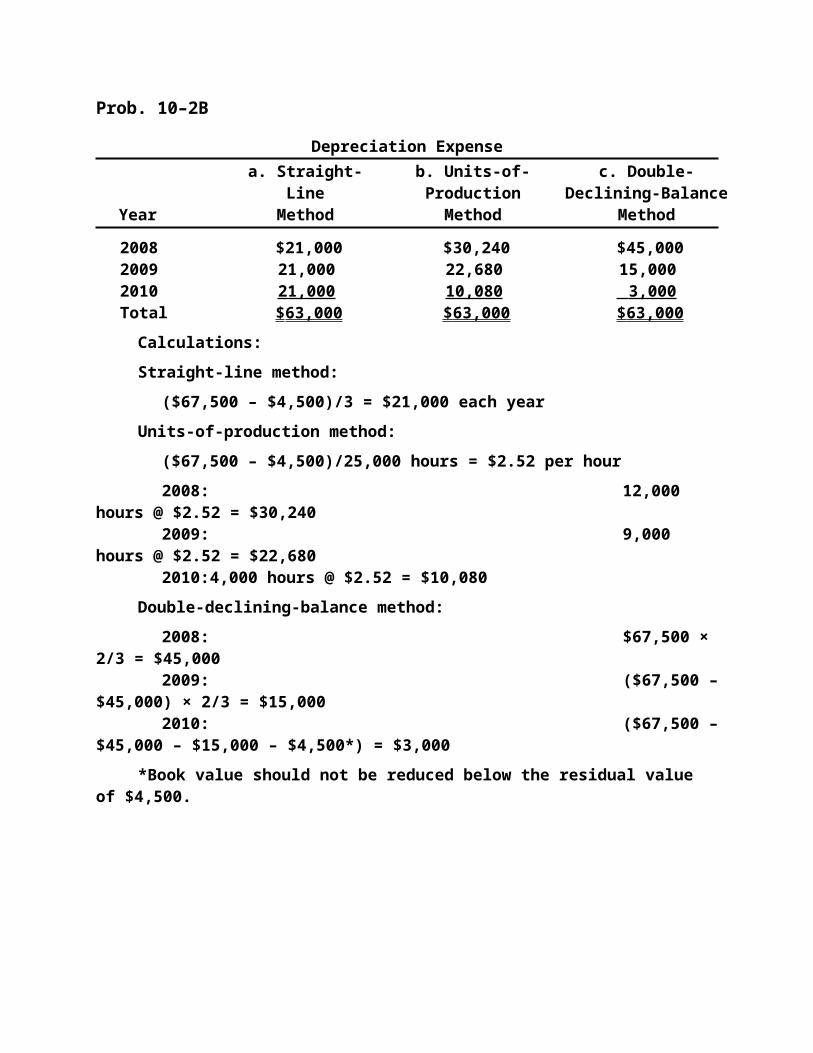
Prob. 10–2B
Depreciation Expensea. Straight- b. Units-of- c. Double-
Line Production Declining-BalanceYear Method Method Method
Equipment.................................................................. 131,250Gain on Sale of Equipment...................................... 4,490**($21,500 – $17,010)
3. Cash................................................................................. 12,500Accumulated Depreciation—Equipment...................... 114,240Loss on Sale of Equipment........................................... 4,510*
1 Cash............................................................................... 25,000Accumulated Depreciation—Delivery Equipment..... 40,020Loss on Sale of Delivery Equipment........................... 3,980
1. a. $1,170,000/4,500,000 board feet = $0.26 per board foot; 1,370,000 board feet × $0.26 per board foot = $356,200
b. Loss on impairment of goodwill, $5,000,000
c. $234,000/12 years = $19,500; 3/4 of $19,500 = $14,625
2. a. Depletion Expense.................................................... 356,200Accumulated Depletion....................................... 356,200
Depletion of timber rights.
b. Loss on Impairment of Goodwill............................. 5,000,000Goodwill................................................................ 5,000,000
c. Amortization Expense—Patents.............................. 14,625*Patents.................................................................. 14,625*
It is considered unprofessional for employees to use company assets for personal reasons, because such use reduces the useful life of the assets for nor-mal business purposes. Thus, it is unethical for Esteban Appleby to use Sum-merfield Consulting Co.'s computers and laser printers to service his part-time accounting business, even on an after-hours basis. In addition, it is improper for Esteban’s clients to call him during regular working hours. Such calls may inter-rupt or interfere with Esteban’s ability to carry out his assigned duties for Sum-merfield Consulting Co.
Activity 10–2
You should explain to Faye and Pat that it is acceptable to maintain two sets of records for tax and financial reporting purposes. This can happen when a company uses one method for financial statement purposes, such as straight-line depreciation, and another method for tax purposes, such as MACRS depreci-ation. This should not be surprising, since the methods for taxes and financial statements are established by two different groups with different objectives. That is, tax laws and related accounting methods are established by Congress. The Internal Revenue Service then applies the laws and, in some cases, issues interpretations of the law and congressional intent. The primary objective of the tax laws is to generate revenue in an equitable manner for government use. Generally accepted accounting principles, on the other hand, are established pri-marily by the Financial Accounting Standards Board. The objective of generally accepted accounting principles is the preparation and reporting of true eco-nomic conditions and results of operations of business entities.
You might note, however, that companies are required in their tax returns to rec-oncile differences in accounting methods. For example, income reported on the company’s financial statements must be reconciled with taxable income.
Finally, you might also indicate to Faye and Pat that even generally accepted ac-counting principles allow for alternative methods of accounting for the same transactions or economic events. For example, a company could use straight-line depreciation for some assets and double-declining-balance depreciation for other assets.
Income before income tax............. $460,000 $436,000 $461,600 $477,000 $477,000 $488,400
Income tax...................................... 184,000 174,400 184,640 190,800 190,800 195,360
Net income...................................... $276,000 $261,600 $276,960 $286,200 $286,200 $293,040
Activity 10–3 Concluded
3. For financial reporting purposes, Mike should select the method that pro-vides the net income figure that best represents the results of operations. (Note to Instructors: The concept of matching revenues and expenses is dis-cussed in Chapter 3.) However, for income tax purposes, Mike should con-sider selecting the method that will minimize taxes. Based on the analyses in (2), both methods of depreciation will yield the same total amount of taxes over the useful life of the equipment. MACRS results in fewer taxes paid in the early years of useful life and more in the later years. For example, in 2008 the income tax expense using MACRS is $184,000, which is $8,000 ($192,000 – $184,000) less than the income tax expense using the straight-line deprecia-tion of $192,000. Lonesome Dove Construction Co. can invest such differ-ences in the early years and earn income.
In some situations, it may be more beneficial for a taxpayer not to choose MACRS. These situations usually occur when a taxpayer is expected to be subject to a low tax rate in the early years of use of an asset and a higher tax rate in the later years of the asset’s useful life. In this case, the taxpayer may be better off to defer the larger deductions to offset the higher tax rate.
Activity 10–4
Note to Instructors: The purpose of this activity is to familiarize students with the differences in cost and other factors in leasing and buying a business vehicle.
Activity 10–5
Note to Instructors: The purpose of this activity is to familiarize students with the procedures involved in acquiring a patent, a copyright, and a trademark.
Activity 10–6
a. Fixed Asset Turnover =
Wal-Mart: = 4.16
Alcoa Inc.: = 2.10
Comcast Corporation: = 1.25
b. The fixed asset turnover measures the amount of revenue earned per dollar of fixed assets. Wal-Mart earns $4.16 of revenue for every dollar of fixed as-sets, while Alcoa only earns $2.10 and Comcast Corporation only earns $1.25 in revenue for every dollar of fixed assets. This says that Alcoa and Comcast require more fixed assets to operate their businesses than does Wal-Mart, for a given level of revenue volume. Does this mean that Wal-Mart is a better company? Not necessarily. Revenue is not the same as earnings. More likely, Wal-Mart has a smaller profit margin than do Alcoa and Comcast. Although not required by the exercise, the income from operations before tax as a per-cent of sales (operating margin) for the three companies is: Comcast, 14.3%, Alcoa, 9.9%, and Wal-Mart, 5.3%. Thus, the difference between the fixed asset turnovers seems reasonable. Generally, companies with very low fixed asset turnovers, such as aluminum making and cable communications, must be compensated with higher operating margins.
Note to Instructors: You may wish to consider the impact of different fixed asset turnover ratios across industries and the implications of these differ-ences. This is a conceptual question designed to have students think about how competitive markets would likely reward the low fixed asset turnover companies for embracing high fixed asset commitments.