134
DESIGN MANUAL power and water corporation
DESIGN MANUAL
power and water corporation

2
Report Type: ExternalDate: 19 December 2011 Container No: F2006/6541Authors: J Ashworth; M Skinner Document No: D2011/578598Drafting: R Innes; A ChinApproved by: S McKenzieReviewed by N McCarthy; S Tsoukalis; C Evans
(WA Water Corporation); L Monteith (GHD); Department of Health & Families, NT
Supported by: D D MaraTitle: Waste Stabilisation Pond Design
ManualVersion: 19 December 2011
about the cover The front cover: is painted by Jessica Jones from Tennant Creek. The Aboriginal artist’s family has lived in the Northern Territory for many generations.
The story tells of bush tucker in Tennant Creek region. The berries, bush bananas, plums, witchetty grub and emu are all traditional fare the product of the seasonal rain.
Returning the goodness to nature to sustain new life is an Aboriginal belief. This links the importance of the cycle with the earth where all beginnings come. The recycling of waste and the preservation of water is at the base of survival and practiced by nature for billions of years.
copyright notice Content and use of information in this manual is subject to the operation of the Copyright Act 1968. This copyright information is owned by Power and Water Corporation.
You may not use this information other than for your own private use (such as for research, non commercial or personal use). You may not copy, distribute, post, mirror, reproduce, alter, store or transmit the material which appears on this manual, in any form, without the express written consent of Power and Water Corporation.
Offenders may be sued and/or prosecuted.

3power and water corporation waste stabilisation pond design manual
foreword by professor duncan maraWaste stabilisation ponds are a very appropriate method of wastewater treatment in the Northern Territory of Australia as land availability is not normally a problem. PowerWater, as the utility responsible for wastewater treatment in the Territory, is to be congratulated for producing this Waste Stabilisation Ponds Design Manual as it provides clear guidance on pond design for the 21st century. Many people are unaware of the benefits of WSP and they sometimes think that, because they are the cheapest option, they cannot possibly also be the best option – after all, high performance and low cost do not often go hand-in-hand. However, with WSP they do, especially when they are properly designed and well operated and maintained. This may not please manufacturers of the electromechanical equipment for other more ‘conventional’ wastewater treatment processes (such as activated sludge), but it should please PowerWater’s customers as their bills will be lower and the treated wastewater can be used for crop irrigation without the need for costly chemical disinfection.
The term ‘conventional’ is commonly used by many wastewater-treatment engineers, to refer to processes like activated sludge and its variants, but it is not always an appropriate descriptor, especially here in the Northern Territory where it is in fact more conventional to use WSP. This Manual will help to ensure that this conventional Northern Territory solution remains a wholly appropriate choice for at least the rest of this century.
Duncan Mara, PhD, DSc(Eng), EurIng, FICE, FSBiol, FCIWEM, August 2010Professor of Civil Engineering, University of Leeds, UK
4
contents PREFACE ........................................................................................ 10
2 INTRODUCTION ..........................................................................12 Background ..................................................................................12 2.2 How to use the manual ................................................13 Table 2.1 Guideline for manual usage ................................ 14
3 GLOSSARY OF TERMS AND ABBREVIATIONS .....................15 3.1 Glossary of Terms ............................................................15 3.2 Abbreviations .................................................................. 16
Part 1 - pond planning template1 Design data ................................................................................. 18 2 Recirculation ............................................................................... 18 3 Inlet works ................................................................................... 19 4 Primary pond (Anaerobic/Facultative) ............................. 20 5 Maturation pond ........................................................................21 6 Maturation pond (1,2,…) ...........................................................21 7 Pond layout ................................................................................. 22 8 Sludge disposal area ................................................................24 9 Buildings ...................................................................................... 25 10 Buffer zone requirement compliance check .................... 25 11 Trees and other Landscaping Features .............................. 25 12 Fencing, lighting, signage and OH&S ................................ compliance check...................................................................... 25 13 SCADA and Process Control ...................................................26 14 Commissioning, decommissioning and operation during construction .............................................26 15 Check on stakeholder requirement compliance ............26 16 Estimate .......................................................................................26
Part 2 - waste stabilisation pond design code1 Effluent and Odour Standards .............................................28 1.1 Northern Territory Guidelines....................................28 1.2 Operational and Strategic Guidelines .....................30 1.3 Irrigation nutrient rates ...............................................30 1.4 Phosphorus removal ..................................................... 32 1.5 Odour buffer distances ................................................ 32
2 Sewage Flows, Loads & Temperatures ............................... 33 2.1 Flows .................................................................................. 33 2.2 Organic loads ..................................................................36 2.3 Sewage strength ............................................................ 37 2.4 Sewage Temperature ....................................................38 2.5 Evaporation ......................................................................39

5power and water corporation waste stabilisation pond design manual
3 WSP Biological Processes ...................................................... 40 3.1 Aerobic .............................................................................. 40 3.2 Anaerobic ..........................................................................43 3.3 Odour Production ..........................................................44 3.4 Mosquito and Midge Infestation ............................ 46
4 WSP Principal Units ................................................................. 48 4.1 Preliminary treatment ................................................ 48 4.2 Anaerobic and facultative ponds
(primary ponds) ............................................................. 49 4.3 Maturation ponds (secondary ponds) .....................50 4.4 Tertiary treatment ..........................................................51 4.5 Sludge treatment ........................................................... 52
5 WSP Process Design .................................................................56 5.1 Guide ..................................................................................56 5.2 Design Parameters ........................................................56 5.3 Anaerobic ponds ............................................................ 57 5.4 Facultative ponds ...........................................................58 5.5 Maturation ponds ..........................................................62 5.6 Sludge Production .........................................................62 5.7 Tertiary treatment .........................................................63
6 Pond Hydraulics ........................................................................ 69 6.1 General ............................................................................. 69 6.2 Inlet Works and Storm Flows .....................................70 6.3 Pond Short-circuiting .....................................................71 6.4 Pond inlets ........................................................................ 74 6.5 Stub walls .........................................................................76 6.6 Aerators and Pumps ......................................................78 6.7 Outlets and emergency overflows .......................... 80 6.8 Recirculation .................................................................... 81 6.9 Pond Hydraulic Grade ................................................... 81
7 Pond Parameters & Structures .............................................82 7.1 Guidance ...........................................................................82 7.2 Location, drainage & Mid Depth Area.....................82 7.3 Pond Geometry, Soils & Wave Action ......................82 7.4 Inlet works ........................................................................85 7.5 Anaerobic ponds ............................................................87 7.6 Facultative ponds ...........................................................87 7.7 Maturation ponds ..........................................................87 7.8 Sludge Handling Structures ...................................... 88 7.9 Ancillaries ........................................................................ 89 7.10 Standard designs – 1,000−5,000 populations .... 94 7.11 Individual pond design ................................................95

6
8 Pond Upgrading ....................................................................... 96 8.1 General planning requirements .............................. 96 8.2 Data & Performance Verification .............................97 8.3 Pond Hydraulic improvements ..................................97 8.4 Additional process capacity ....................................... 98 Figure 8.2 Intermittent Sand Filters ................................... 99
9 Septage Ponds ..........................................................................101 9.1 Septic tank .......................................................................101 9.2 Commercial Oil and Grease .......................................101
10 Effluent Reuse ..........................................................................102 10.1 Effluent Reuse ...............................................................102 10.2 Effluent Reuse Standards ..........................................102 10.3 Agriculture .....................................................................102 10.4 Aquaculture ................................................................... 103
11 Operations & Maintenance ................................................. 103 11.1 Pond operational manual ......................................... 103 11.2 Asset Condition and Performance ......................... 103 11.3 Operational Data.......................................................... 103 11.4 Operational Problems................................................. 103
12 Pilot Pond Projects .................................................................. 105 12.1 Philosophy and Planning ........................................... 105 12.2 Effluent Improvement ................................................ 105 12.3 Hydraulic efficiency .................................................... 106 12.4 Pond desludging.......................................................... 106 12.5 Methane Collection .................................................... 106 12.6 Collaboration ................................................................ 106
13 Monitoring and control ........................................................ 107
14 Cost Estimates ..........................................................................110 14.1 General .............................................................................110 14.2 Financial and programme planning .......................110 14.3 Investigations and Planning .....................................110 14.4 Procurement of Contract Services ...........................110 14.5 Detailed Design .............................................................110 14.6 Construction & Supervision ......................................110 14.7 Operations .......................................................................110 14.8 Post Commissioning Review ......................................111
15 References .................................................................................. 112
Appendices............................................................................................ 115

7power and water corporation waste stabilisation pond design manual
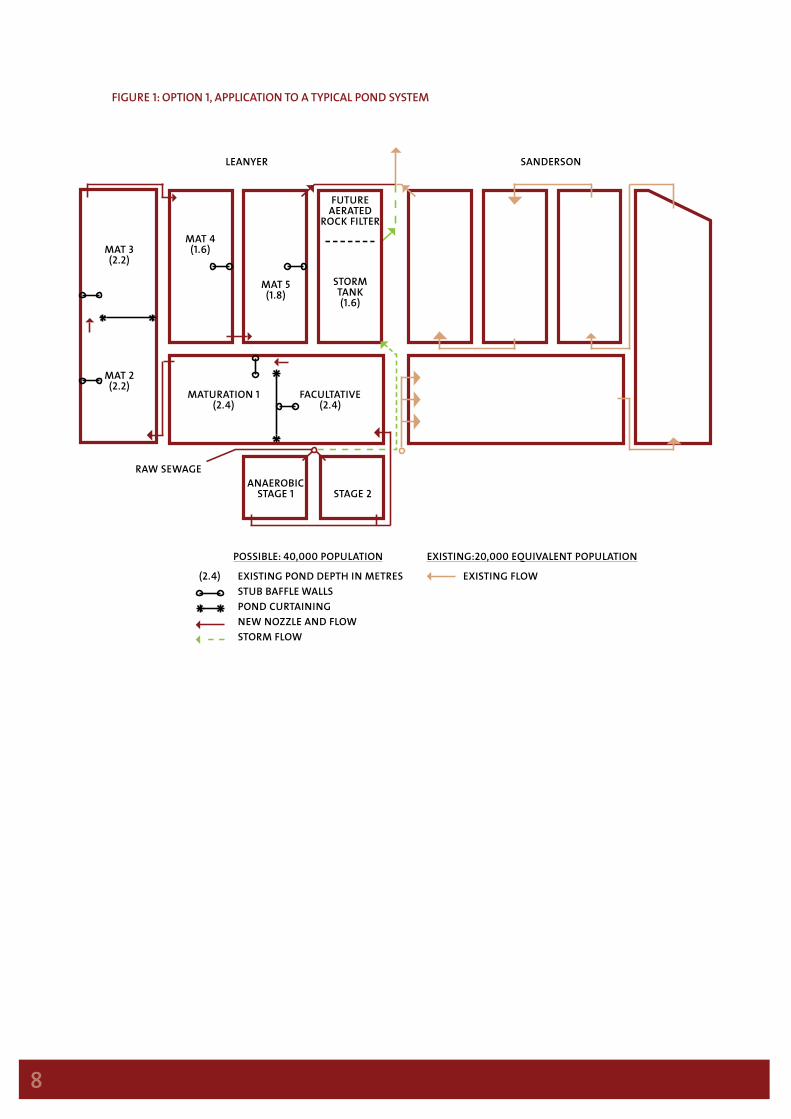
how the systems work The Figure following, Option 1: is an illustration of how this manual might be applied to a typical pond system, such as Leanyer Sanderson waste stabilisation ponds which serve a Darwin population of some 46,000. The ponds have a mid depth area of 35 hectares. Possible hydraulic improvement shown on the Leanyer half of the ponds would probably reduce effluent Escherichia coli by two log orders (99%).
The diagram shows how with relatively simple, low cost modifications traditional WSP systems can be modified. The construction of the anaerobic pond and other features described in this manual – shown on the Leanyer pond – would considerably increase the treatment capacity of the ponds. Pond curtaining of the facultative and first maturation pond would allow the final three maturation ponds to be taken out of operation.
The anaerobic pond would be sufficiently small to allow covering and methane gas collection – a desirable objective with current concern of global warming – for possible power generation.
The closure of the final maturation pond could provide stormwater treatment during the Northern Territory wet season. In the dry season, experience has shown that it could be used for dewatering pond sludge using the hot climate to produce a dry sludge within two months. There would be sufficient time to return the pond to its storm duties before the next rains.
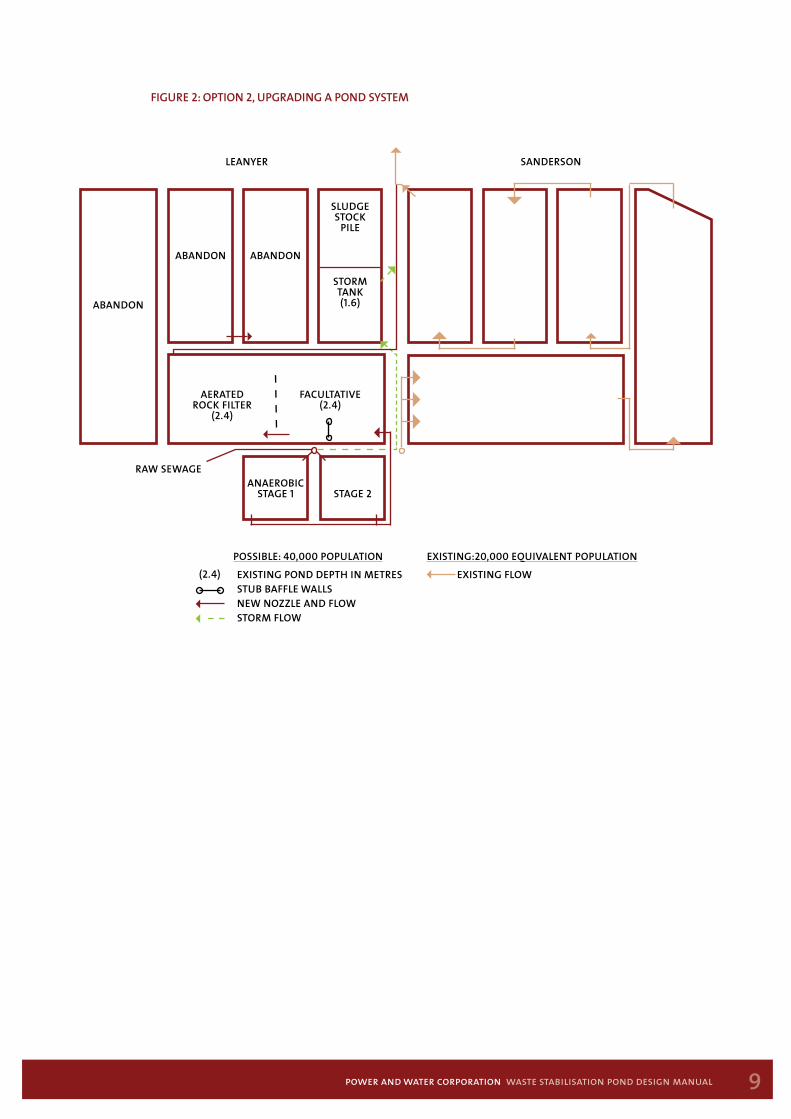
The Figure after, Option 2: is another illustration of how to upgrade an existing pond system (in this case the Leanyer Sanderson ponds) using Professor Mara’s future direction of waste stabilisation pond design. Anaerobic pre-treatment, a facultative pond and tertiary polishing by an aerated rock filter reduces considerably the area of ponds, permitting long term expansion.
8
Figure 1: oPtion 1, aPPlication to a tyPical Pond system
eXisting:20,000 eQuiValent PoPulation
eXisting FloW
mat 3(2.2)
mat 4(1.6)
maturation 1(2.4)
(2.4)
FacultatiVe (2.4)
anaeroBicstage 1 stage 2
leanyer sanderson
PossiBle: 40,000 PoPulation
eXisting Pond dePtH in metresstuB BaFFle WallsPond curtainingneW noZZle and FloWstorm FloW
raW seWage
mat 5(1.8)
stormtanK(1.6)
Futureaerated
rocK Filter
mat 2(2.2)
9power and water corporation waste stabilisation pond design manual
Figure 2: oPtion 2, uPgrading a Pond system
eXisting:20,000 eQuiValent PoPulation
eXisting FloW
aBandon
aBandon aBandon
aerated rocK Filter
(2.4)
(2.4)
FacultatiVe (2.4)
anaeroBicstage 1 stage 2
leanyer sanderson
PossiBle: 40,000 PoPulation
eXisting Pond dePtH in metresstuB BaFFle WallsneW noZZle and FloWstorm FloW
raW seWage
stormtanK(1.6)
sludgestocK
Pile

10
preface The Waste Stabilisation Pond Design Manual is a summary manual of planning and design code. The purpose of these documents is to provide guidance on the planning and design of waste stabilisation ponds (WSPs) in the Northern Territory (NT) managed by the Power and Water Corporation (PWC).
It is intended for use by experienced process design professionals, or less experienced professionals under guidance. First time users of this Manual are strongly advised to read Section 2.2 ‘How to use the manual’.
It does not provide detailed specifications or prescription for detailed design of such engineering standard elements as power supply, SCADA, concrete work, earthworks or general pipework. These are presently available through mastertext specifications, other Power and Water publications, or through standard methods.
The Pond Planning Manual (Template) uses the planning framework outlined in the Queensland Department of Environment and Natural Resources Management Planning Guidelines for Water Supply and Sewerage 2005. The planning manual outlines procedures that need to be considered to ensure a successful implementation of a WSP scheme, including public consultation.
The Pond Design Code begins with standards for effluent quality and odour, and describes the steps to enable completion of WSP sewage process and hydraulic design. The manual contains sufficient information to allow engineers to size quickly WSPs for small populations. In addition, there is a detailed explanation of process and hydraulic design parameters to assist in the review of existing pond schemes or for the design from first principles of new WSPs. Process design examples have been included in the appendices. Figures of typical hydraulic details have also been included. The manual also encourages the reuse of pond effluent by outlining a number of possibilities.
The Operation Manual begins with the importance of sewage treatment to public health, moves to a summary of sewage treatment systems and then describes in detail waste stabilisation pond operational practices. It provides solutions to recover ponds from “crashing”. Where the explanation is inadequate the operator is to ring for specialist help. Finally, a generic maintenance schedule is included for the yearly cycle.
The Waste Stabilisation Pond Design and Operation Manuals are a guide to PWC project officers and consultants on the design and process requirements for WSPs.
other associated documents • PWC’s Draft Guidelines for Buffer Zones for Waste Water Treatment Plants, Wellheads and
Chlorine Installations;• The Northern Territory Government, Department of Health and Families (DHF) Fact Sheet,
No 511, DHF requirements for the design of waste stabilisation ponds and the associated disposal or recycling of sewage effluent.
This latter document gives a framework to assess appropriate water quality standards for public health and environmental well-being. Community consultation and economics are notable elements in assessing the viability of recycled water for a new scheme.
The Figure below represents the relationship between the Queensland Water and Sewerage Planning Guidelines adopted by PWC and the procedures required to implement a WSP scheme. The wide number of parties involved with any project implementation is also reflected by the broad approach of this planning and design manual.
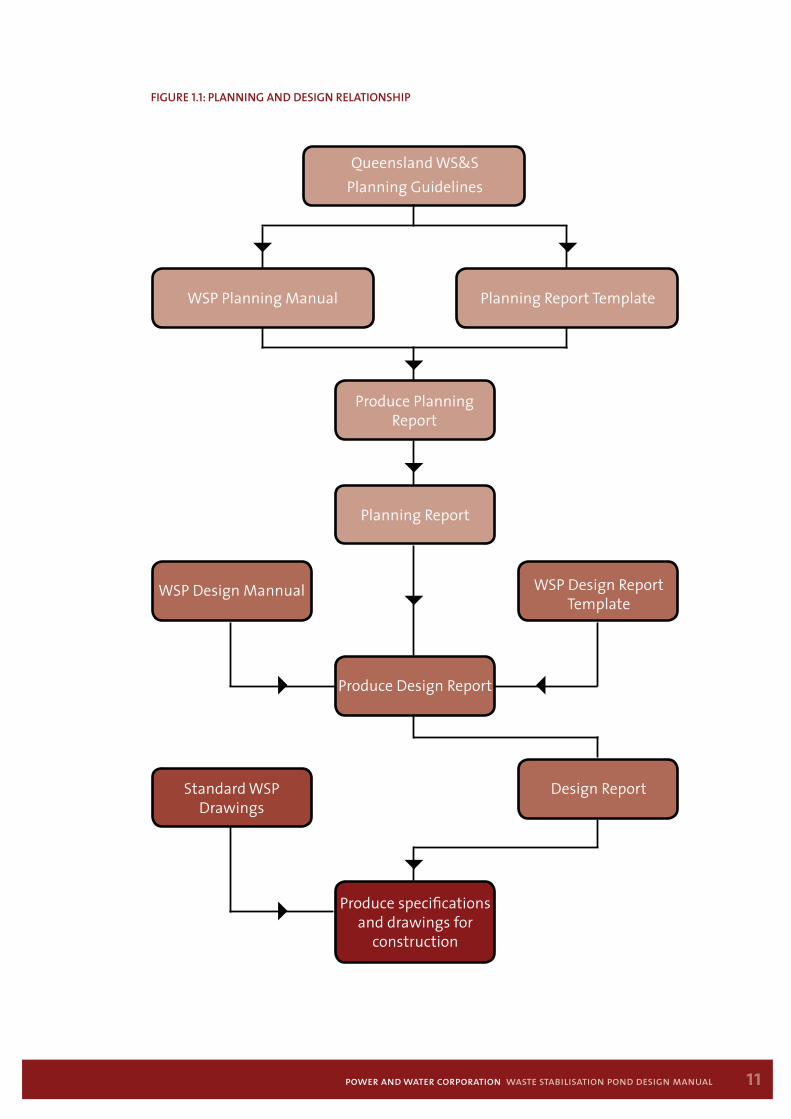
11power and water corporation waste stabilisation pond design manual
Figure 1.1: Planning and design relationsHiP
Queensland WS&SPlanning Guidelines
Produce Planning Report
Planning Report
Produce Design Report
Produce specifications and drawings for
construction
Design Report
WSP Planning Manual
WSP Design Mannual
Standard WSP Drawings
WSP Design Report Template
Planning Report Template

12
introductionIn Australia, urban large sewage treatment began in 1880s with the Islington sewage farm in Adelaide, and then in the 1890s with the Werribee farms outside Melbourne. The farms were the forerunner of waste stabilisation ponds and provided a place to dispose and to crudely treat sewage, whose association with disease and low life expectancy was well known. Treatment reduced the harmful sewage into relatively innocuous liquid (effluent) and gaseous and solid (sludge) by-products.
Today, this has changed because of a more sophisticated understanding of the adverse environmental and public health issues associated with unrestricted release of effluent, gases such as methane and carbon dioxide, and sludge to the environment. Werribee economic benefit has been from their effluent that irrigates 85km2 of land that supports 15,000 cattle and 40,000 sheep – “where there is muck there is money” (Ray, 1678).
In the future, sewage effluent will be further treated to produce recycled potable water, the sludge used as a soil conditioner and the methane gases used to generate power.
In the past, when selecting a sewage treatment process for a given site, the principal factors against waste stabilisation ponds have been their dependence on the unpredictable aspects of weather, especially sunlight and wind shear. This unpredictability, if not addressed in the design, leads to poor control and variable effluent quality. The control and minimisation of these factors through design is therefore one of the features of this manual.
Biological activity within ponds varies greatly between seasons. The calm wind periods can result in stratification, leading to potential short circuiting and possible pond inversion and process failure when the wind returns. This may also lead to a lower degree of predictability and control of waste stabilisation ponds compared to activated sludge and similar processes if not accounted for in the initial design.
Planners, regulators and designers have often preferred mechanised treatment processes for their perceived consistent effluent standard. However, these mechanised processes generally incur a penalty in terms of increased energy consumption, higher cost and lower ease of operation. While these are therefore suitable for areas where a highly skilled workforce is readily available, they are not at all suitable for areas where providing such skills is difficult. This is especially the case in many areas in the north of Australia and in outback communities. Increasingly, with the high carbon footprint of mechanical and electrical plant, the solar powered waste stabilisation pond has also considerable environmental advantages.
The World Bank supports waste stabilisation pond technology as first choice for sewage treatment. Economic analysis, primarily between the cost of land and the electricity is a major factor in determining if ponds are chosen or not.
The drive to reduce greenhouse gas emissions and the on-going shortage of those highly specialised operators – particularly in the Northern Territory – means that WSP technology has become even more compelling.
Furthermore, recent developments in science and application of technology now challenge the proposition that WSPs are subject to unacceptable and unpredictable influence from the weather. These developments are:• Mara’s (2003) work on pond organic loading based on temperature. Mara’s work has
enabled pond designers to confidently size ponds to produce reliable outcomes in given temperature zones. Professors Marais of South Africa, Howard Pearson of Brazil, Oswald of California and Duncan Mara, as well as McGarry, Pescod and Arthur, have all contributed significantly to the current design improvements;
• Shilton and Harrison (2003) on pond hydraulics have enabled designers to specify hydraulic and control systems so that the effects of wind on ponds can be countered and eliminated from consideration in the selection process;

13power and water corporation waste stabilisation pond design manual
• Supervisory control and data acquisition (SCADA) and control technology (Power and Water uses CITEC). Flow, vertical temperature – possible stratification – and dissolved oxygen monitoring provide advance warnings of out of specification performance. Control technology permits pond mixers to be remotely switched and directed in advance of limited or adverse wind conditions that reduce pond mixing.
The combination of these factors makes it possible to a design a WSP system that is controllable by remote supervision resulting in a tight and more consistent effluent standard. The proposition that other processes are more controllable or easier to supervise carries far less weight in process selection than in the past.
The importance of green house gases (GHG) to climate change is generally accepted and the “carbon footprint” needs to be considered in engineering designs, although compared to natural methane omission from swamps etc, emissions from WSP are a small part. Waste stabilisation ponds are solar powered and may require an external energy source for relatively light loads such as control equipment (which are still amenable to solar power in any event). Further, the addition of an anaerobic pond at the head of the WSP train provides a practical opportunity for the collection of the majority of the methane emitted from the process. The methane – a GHG twenty-one times more damaging than carbon dioxide – can be either burned or used as fuel for generation of electricity. Most of the power generated can be fed to the grid, unlike processes, such as activated sludge, where the plant demands for aeration require generally more energy than can be produced. This provides further economic incentives to invest in WSPs rather than alternative treatment technology.
2.2 HoW to use tHe manual
This manual is designed to be used for both greenfield design of a new plant, as well as for assessment and upgrading of existing ponds.
To achieve this, the Waste Stabilisation Ponds Manual structure is as follows:
Part 1 - A Planning Template for use by Project Officers and Designers showing the requirements for design – this template is designed to be used by Power and Water project officers to develop a comprehensive brief for pond designers, and for designers to ensure that all aspects of a design brief are addressed. It is also intended that the template form the basis of the design report accompanying the design documentation.
Part 2 - A Pond Design Code which has the following information to be referred to, as necessary, during the design process covering:• Consideration of effluent and odour standards;• Plant loads and temperatures;• Descriptions of processes and process units;• Process design;• Pond hydraulics and structures;• Pond upgrading;• A brief discussion of reuse as it applies to WSPs;• Cost estimates.
Appendices - with checklists for design.
An Excel spreadsheet design aid - incorporating the various design equations herein.
The Waste Stabilisation Design Manual together with construction master texts, and Power and Water’s Strategic Products Manual and Standard Drawings, will enable designers to produce final specifications, estimates and drawings for tender and construction purposes.

14
An experienced WSP designer can use these to quickly prepare estimates for design estimate and to provide a design and design report that complies with Power and Water requirements.
An inexperienced designer under the guidance of an experienced professional can use this manual both as an information source, and with the check lists in the appendices, undertake design using the steps set out in those checklists.
The usage of this manual will vary according to the complexity of the project and the experience of the designer as indicated in the table below.
taBle 2.1 guideline For manual usage
Who What Comment on manual usage1 Experienced pond process
designers with WSP design experience
Major pond schemes. Innovative designs
Information necessary for PWC designs and innovation from the body of the manual, design report format and requirements in Part 2 and Appendices
2 Experienced conventional sewage treatment engineer
Major pond schemes Standard designs
Standard design method outlined in Part 1 and with further information in Part 2 and appendices
3 Graduates working under supervision of experienced pond designers, or students studying or undertaking research for Power and Water under the supervision of lecturers.
Small pond schemes Standard designs
Standard design method outlined in Part 1 and with further information in Part 2 together with access to assistance from experienced process designers or lecturers.
15power and water corporation waste stabilisation pond design manual
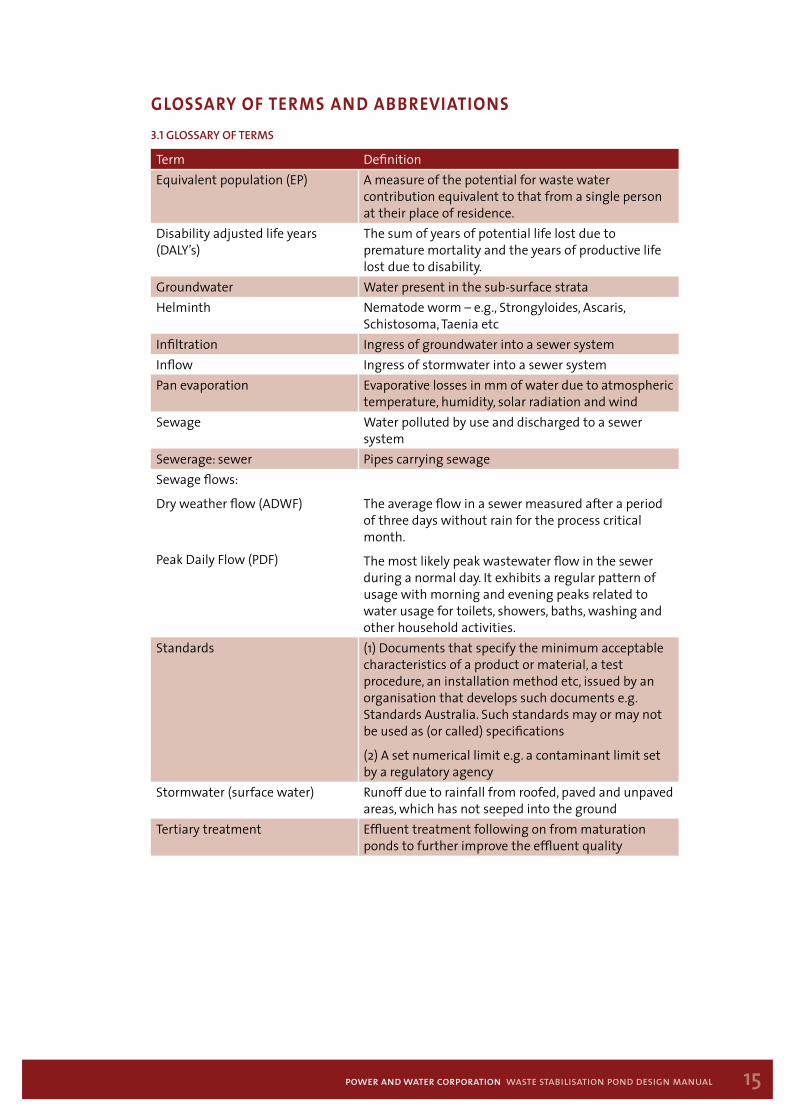
glossary of terms and abbreviations 3.1 glossary oF terms
Term DefinitionEquivalent population (EP) A measure of the potential for waste water
contribution equivalent to that from a single person at their place of residence.
Disability adjusted life years (DALY’s)
The sum of years of potential life lost due to premature mortality and the years of productive life lost due to disability.
Groundwater Water present in the sub-surface strataHelminth Nematode worm – e.g., Strongyloides, Ascaris,
Schistosoma, Taenia etcInfiltration Ingress of groundwater into a sewer systemInflow Ingress of stormwater into a sewer systemPan evaporation Evaporative losses in mm of water due to atmospheric
temperature, humidity, solar radiation and windSewage Water polluted by use and discharged to a sewer
systemSewerage: sewer Pipes carrying sewageSewage flows:
Dry weather flow (ADWF)
Peak Daily Flow (PDF)
The average flow in a sewer measured after a period of three days without rain for the process critical month.
The most likely peak wastewater flow in the sewer during a normal day. It exhibits a regular pattern of usage with morning and evening peaks related to water usage for toilets, showers, baths, washing and other household activities.
Standards (1) Documents that specify the minimum acceptable characteristics of a product or material, a test procedure, an installation method etc, issued by an organisation that develops such documents e.g. Standards Australia. Such standards may or may not be used as (or called) specifications
(2) A set numerical limit e.g. a contaminant limit set by a regulatory agency
Stormwater (surface water) Runoff due to rainfall from roofed, paved and unpaved areas, which has not seeped into the ground
Tertiary treatment Effluent treatment following on from maturation ponds to further improve the effluent quality

16
Term DefinitionWaste stabilisation ponds
Anaerobic
Facultative
Maturation
A pond (normally at least 3m deep) where sewage is digested anaerobically
A pond (normally 1.5m to 2m deep) where both anaerobic and aerobic digestion of sewage takes place
A pond, (normally 0.9m to 1.5m deep) primarily responsible for pathogen removal by various ways mechanisms, including UV disinfection and daily high pH levels
3.2 aBBreViations
Abbreviation InterpretationADWF Average dry weather flow for the process critical month.AS/NZS Australian/New Zealand StandardsBoM Bureau of MeteorologyBOD or BOD5 Biochemical Oxygen Demand at 20ºC and 5 days DHF Department of Health and FamiliesDALYs Disability adjusted life yearsEP Equivalent populationE. coli Escherichia coliGHG Green house gasesH2S Hydrogen sulphideha HectareL/s Litres/secondm/s Metres per secondmg/L Milligrams/litreNRETAS Natural Resources, Environment, The Arts and SportNT Northern TerritoryOH&S Occupational health and safetyPDWF Peak dry weather flowSCADA Supervisory control and data acquisitionSBR Sequencing Batch ReactorSS Suspended solidsUWWTD 1991 Council of the European Communities Urban
Wastewater Treatment Directive (UWTD)UV UltravioletWHO World Health Organization

17power and water corporation waste stabilisation pond design manual
Part 1 pond planning templatewaste stabilisation pond design template - design/design report
18
notes for using this templateThis template once completed can be used to form a consultant brief for designs for WSPs, or as a basis for production of a Design Report and guide to WSP design.
In the case of this being used as a consultant brief, consultants requested to tender would then provide a return brief in exactly the same format showing how they would address each item.
After the consultancy is awarded, the final report would also be in the format of this document, with each design element completed in accordance with the brief and the consultant’s return brief.
In preparing this template, italic typeface is used for supporting and explanatory text.
This page and other italicised text is to be deleted as appropriate on completion of the brief or the return brief as appropriate.
The completed Report is then to be incorporated in the information required under Power and Water’s procurement processes.
The checklist for designers and project officers Appendix 3 will assist in the production of the design.
1. design data
Obtain design data either from Planning Report, or, if not available, using the methods described in Section 1 and 2 of Part 2 this manual.
1.1 Inflow
Design – tabulate inflow calculations from the planning report. If inflow calculations are not in the planning report – calculate inflow using method agreed with PWC Project officer and in Section 2 of Part 2 of this manual. (Power and Water project officer to use the methods outlined in the Connection Code in the absence of better information).
Design report – tabulate inflow calculations and state the methods used, the reliability, and any other assumptions the designer has assigned to those calculations.
1.2 Sewage Strength CalCulatIon
Design – tabulate sewage strength from the planning report. If sewage strength data is not available from the planning report – use values agreed with Power and Water and using methods outlined in Section 2.2 of this manual.
Design report – tabulate the calculations, state methods used, reliability, and assumptions as in 1.1.
1.3 requIred treated effluent qualIty requIred
Design and design report – state here the required treated effluent quality from either the planning report, or the Power and Water project officer requirement. In the design brief, the Power and Water project officer must state the effluent quality requirement at this point.
2. recirculation
Design - determine the need for a recirculation report based on planning data and 1.1 and 1.2 above. Typically used for upgrading of existing plants rather than for new plants.
Calculate recirculation hydraulics based on Section 6.8 of Part 2 of this manual.
Design report – tabulate the decision on whether or not to use recirculation or to allow for future recirculation facilities.
19power and water corporation waste stabilisation pond design manual
If the decision is made to employ recirculation, tabulate flows required and likely hours of operation for use in Sections 7.6 and 7.7 of this template.
3. inlet WorKs
3.1 grIt and SCreenIngS removal
Design – from planning report, item 1.1 above, and from this manual Section decide on the type of grit removal and screening to be used. (See Table 4.1 of Part 2 of this manual). Then size the grit and screenings area (See Section 7.4 of Part 2 of this manual). Allow space around the plant for personnel and vehicle access, including allowance for crane to remove and install. Use at least two and preferably three different manufacturers of screens and grit removal products to arrive at grit and screenings plant footprint. Complete screening, washing and crushing of grit as required with the facility to load into trucks or bins for disposal. Either allow for one year’s storage of washed crushed grit and screenings, or check with Power and Water project officer that regular removal of washed crushed grit and screenings will be undertaken. Allow space for transport and handling of grit and screenings.
Design report – state relevant dimensions and characteristics of the plant to achieve the planning report and flow requirements – append the data from the manufacturers and refer to the information in those data sheets that confirm those requirements (eg screen aperture, flow rates, head required etc.).
Power and Water project officer should specify whether a separate specification is required for transport of grit and screenings off site.
3.2. Inlet bypaSS
See Design Manual Part 2 Section 6.2
Design – from planning report determine the flow at which the inlet is to be bypassed, where it is to be bypassed to and the maximum bypass flow. Size and route the bypass and specify the bypass to enable construction (e.g. if a channel, then concrete specification, reinforcement details, cover etc.). Provide information to enable the drawings to be completed.
Design report – State the assumptions and flows at which bypass is to be undertaken and the relevant sizes of the bypass and its location. Refer to the drawings that form part of this design.
3.3. Inlet ChannelS (or pIpework)
Design – from planning report determine the design flows at the inlet, what the appropriate route to and from the grit and screenings treatment area is. Size and route the inlet channels (or pipework) and specify the bypass to enable construction. (eg if a channel, then concrete specification, reinforcement details, cover etc.). Ensure that all OH&S issues are addressed – covering of channels, access control, elimination of confined spaces. Provide information to enable the drawings to be completed.
Design report – State the assumptions and flows for the inlet channels, and the relevant sizes and its location. Refer to the drawings that form part of this design.
3.4. meterIng
Design – from 1.1 above, the designer is to specify metering that will measure the flows. Ensure that there is access to maintain the meter and avoid placing the meter in a confined space if possible. If a confined space is unavoidable, provide information on the drawings and allow for any required safety equipment in the design.
Design report – include details of metering required, including manufacturer’s data. Refer to the drawings that form part of this design.
20
4. Primary Pond (anaeroBic/FacultatiVe)
4.1 number of treatment StreamS
Change Section title above depending on what type of pond is being designed.
Design – refer to this manual Part 2 Sections 5, 6, and 7. Use the Excel program provided as part of this manual using the flow and quality parameters in 1 above. The decision whether to design an anaerobic or facultative pond will be in the planning report. If not in the planning report, the Power and Water project officer is to state at this point the requirement or preference, or whether the consultant is to investigate both as part of a preliminary design step. At this point, the designer must consider whether to have two parallel trains or a single train. This is considered at some length in the manual. However, if only one train is proposed, then the designer must consider the following: how is the primary pond to be desludged? Is it possible or economical to bring in a contractor to desludge the pond? If not, then how is the pond to be desludged? If no practical method for desludging is available, then two process trains are mandatory unless either the plant is to be abandoned within the time required for desludging, OR the plant is to be augmented within that time and the future augmentation will then allow one pond to be taken off line for desludging.
Design report – to discuss desludging method recommended by the designer and number of process trains.
4.2. prImary pond volume
Design – from the Excel spreadsheet extract the primary pond volume use either the anaerobic or facultative option as appropriate.
4.3. prImary pond depth
Design – if the plant has screening and grit removal – depth is 1.8m facultative, if no screening and grit removal, the depth is 2.5m for the first third of the facultative pond and 1.5m for the balance. For an anaerobic pond the depths are 3.5m to 5m. Anaerobic pond outlets are 300mm deep, facultative pond outlets are to be 600mm deep. See Fig. 4.1 Part 2 of this Manual.
Pond freeboard is at Section 10.3.
Ponds must have bottoms which grade slightly to one end to avoid pooling when ponds are being decanted for maintenance to eliminate insect breeding sites.
Design report – state the depth of pond required and the freeboard.
4.4. prImary pond area
Design – facultative use an aspect ratio of 3 to 1 and the pond depth from Section 4.3 above to derive the primary pond area. For anaerobic option, use square ponds. Allow 10m access all round to enable access for desludging of pond.
4.5. pond hydraulICS
Design – use the Shilton Harrison method to size the inlet jets for facultative ponds and the location of the stub walls (see Figure 6.4 A and B)
Design report – list the jet size and wind speed assumptions used to derive the jet size. List the stub wall length and materials required.
21power and water corporation waste stabilisation pond design manual
5. maturation Pond
5.1 maturatIon pond future
Design – refer to this manual Part 2 Sections 5, 6, and 7. Use the Excel program provided as part of this manual using the flow and quality parameters in Section 1 above. The comments in 4 above relating to the number of process trains apply in this Section as well. However, since desludging of maturation ponds is much more infrequent than that of facultative ponds the designer needs only provide space for future duplication.
The Planning Report may replace all maturation ponds by an aerated rock filter, depending upon discharge consent. Particularly for weak sewages, low organic loading in maturation ponds is likely to result in high levels of Cyanobacteria in the final effluent.
If raw sewage has high levels of salinity, the Planning Report may give direction on using less maturation ponds to reduce evaporative losses and increased salinity.
Note loading limits for midge breeding Figure 3.5.
5.2. maturatIon pond volume
Design – use the excel program with flow and quality parameters in Section 1. above.
Design report – state volume required
5.3. maturatIon pond depth
Design Guidelines Part 2 Section 4.3 and Fig 4.1 or use 1.3m depth.
Pond freeboard is set out in Section 7.3. Pond bottoms must be flat and grade slightly to one end to ensure no insect breeding sites when ponds are decanted for maintenance.
Design report – state the depth of pond required and the freeboard.
5.4. maturatIon pond area
Design – use spreadsheet provided, use an aspect ratio of 3 to 1 and the pond depth from Section 4.3 above to derive the primary pond area. Allow 10m access on at least one side, and 5m on other sides round to enable access for maintenance and monitoring of pond. All ponds to be able to be accessed on at least one side by cranes and heavy machinery.
Design report – state the pond areas and access requirements. Provide information to be placed on drawings suitable for construction purposes.
6. maturation Pond (1,2,…)
Repeat process as for 5 above. Note that there is a preference for no more than two maturation ponds to reduce the risk of Cyanobacteria in the final effluent. An aerated rock filter will improve both nutrient and pathogen levels compared to two maturation ponds in series. To meet discharge consents levels, the Planning Report may require the use of an aerated rock filter.
22
7. Pond layout
7.1 ISSueS
General - Design Guidelines Part 2 Section 7 and the Planning report – especially in relation to buffer distances.
Planning Report – what were the issues relating to aesthetics and plant layout canvassed therein? Incorporate these in the design.
7.2. SIte ContourS and draInage
Design Guidelines Part 2 Chapter 7.2
Design - use site contours and considerations of machinery use to shape ponds for minimum construction cost.
Use site contours and Australian Rainfall and Runoff data to position site drainage. Site drainage to divert runoff around the plant and back to normal drainage lines. Site drainage should also NOT concentrate drainage flow intensity.
Design report – comment on how contours and pond layout relate to each other. Provide site drainage report and design of drainage bypass for inclusion on construction specification and drawings.
7.3. wInd
Design Guidelines Chapter 7.9.5
Design – align ponds at right angles to wind direction to minimise short circuiting and help locate inlets and outlets. Ponds must incorporate baffles. Ensure that trees are set back at least 50m from pond edges.
7.4. pond Shape and proteCtIon
Design Guidelines Chapter 7.3.
Design must take into account Planning Report issues related to shape (i.e. did public consultation require irregular shape for aesthetic reasons?).
Pond must not have angular corners. Corners are to be rounded so that equipment used in construction can negotiate the corners without “dead running”.
Aspect Ratio is not critical for maturation ponds or anaerobic ponds – use 3:1 as an approximate guide. Check on the planning report to ascertain if there is any requirement for pond shape to achieve any aesthetic or other objective. If there is no requirement stated in the planning report, then the pond may be shaped for construction ease - especially with regard to elimination of sharp corners that require dead running for earthmoving machinery.
If it is likely that the pond will be subject to storm surge or interrupt drainage channels of significance (see planning report – and if not in planning report, the Power and Water project officer should provide details), then the designer must provide design of bank protection for the pond walls.
Pond walls, especially at the wave margin, must be impermeable and prevent weed growth to eliminate mosquito breeding sites. Walls must either be vertical reinforced concrete where there are biting insect problems within the local community, or sloped concrete or bitumen spray seal. Compacted soil or stone is unacceptable and designs incorporating these will be rejected.
23power and water corporation waste stabilisation pond design manual
Bank protection may be required as a result of consideration of tidal surges – the requirements should be specified in the planning report, or as part of environmental review documents.
Design report – to specify the shape, the factors that have led to that shape, and any bank protection requirements detailed to enable construction.
7.5. loCatIon of treatment plant elementS
Design report – describe the design philosophy and outcomes on the location of the plant elements. Locate the various process elements, interconnecting pipework, power and communications facilities, roads, buildings and fences on site.
7.6. reCIrCulatIon SyStem
Design Guidelines Chapter 6.8
Design report – provide details of design recirculation rate, details of pipework, pump duties and locations suitable for inclusion in drawings and final specification.
7.7. plant overflow
Design - In the case of excessive inflows during storm events and to ensure that overtopping does not cause catastrophic pond failure, ponds shall have overflow points capable of passing ten times dry weather flow. These will be broad crested weirs based on water flowing over slightly lower pond walls which have been designed to take flow at that point. The designer may use concrete, spray seal, or stabilised cement fill for smaller ponds (less than 1000 EP).
The designer shall identify flow paths for such flows to the nearest low point. Note that this is an emergency condition, not normally expected to be used.
Plant overflows of greater than six times dry weather flow should be designed to be routed through the final maturation pond before discharge to the environment.
Design report – locations, details and specifications of emergency and wet weather bypasses as well as overflow routes. Information for placing on construction drawings.
7.8. flow meaSurIng poIntS
Design Guidelines Chapter
Design – use the Planning Report requirements especially in consideration of licensing requirements – if there is no planning report, the Power and Water project officer is to state the requirement at this point.
Flow measuring is required at the inlet and the outlet. Measurement may be either flume and depth sensing type, or magnetic flow meter type. In both cases, the final discharge must be below the water surface upstream of the meter.
Flow measuring should be easily accessible to operators – confined spaces are to be avoided. Designers are to provide details of all safety equipment and signage required for access.
Design report – the designer is to state the specific design characteristics of the metering required and the dimensions of the installation, the construction details of the installation, the OH&S issues if any. The designer should also append manufacturer’s information on recommended metering types.
24
7.9. InletS and outletS
Consider effects of wind and short circuiting. Use the Shilton Harrison method outlined in this manual Section 6.4.1 For design of small plants use the layout indicated in Figure 6.4, scaled up or down as appropriate.
Inlet and outlet structures to be accessible for maintenance wherever possible. If not possible, the designer is to state how inlet and outlet structures are to be maintained. (e.g. by boat, or by draining the pond. If by pond drainage, then there must be parallel process trains to allow that to occur).
Calculate outlet sizes based on design flows from 1 above.
Inlets and outlets are to be in the shortest dimensioned pond wall unless modelling shows other locations to be feasible in specific cases.
Depths as stated in ‘pond depths above’.
Design report – state the size and location of the inlet jets and outlets.
7.10. Stub wallS and baffleS
Design Guidelines Section 6.5
Design – for small populations it is sufficient to use Figure 6.4 scaled up or down to suit the population and the area of pond required as calculated in Section 4.4 above. Alternatively, the use of solar powered horizontal propeller mixers may be considered as calculated in Design Manual Section 6.4.
To meet strong wind conditions facultative ponds should incorporate two baffles 70% of pond width.
Stub baffles to be considered for retrofitting existing maturation ponds.
Design report - state the size and location of the baffles or propeller mixers
8. sludge disPosal area
8.1 Sludge dISpoSal area CalCulatIon
Design Guidelines Sections 5.6 and 7.8.
Design – estimate sludge production volume from this manual Section . If no better Figures are available, use 0.04 m3/EP year wet. If sludge is removed after drying, allow 0.01 m3/EP year dry
Allow 20% volume in the facultative pond to estimate the frequency of desludging required.
If a proprietary drying method, such as a dewatering bag or centrifugation or belt filter, is to be used then use the manufacturer’s recommendation on sludge volumes treated and final moisture content to estimate volumes.
Allow for sludge to be deposited at a depth of 300mm either wet or dry to arrive at an area required for disposal.
8.2. Sludge dISpoSal area layout
Design Guidelines Section 7.8.
Sludge disposal area must be lined to ensure no leachate enters local aquifers. This should be addressed in the planning report. If not, the Power and Water project officer must provide guidance on the lining method. Where no lining method is otherwise specified, a trafficable impermeable surface such as spray seal bitumen shall be used. The area must be bunded and sloped toward a sump for pumping the leachate to the head of the plant. The sludge disposal area must be able to be accessed easily from the facultative pond (or aerobic pond if it exists).
25power and water corporation waste stabilisation pond design manual
9. Buildings
9.1 buIldIng and road deSIgn
Design Guidelines Section 7.9.7
A building is to be provided with emergency showering, toilet and drinking water facilities for operators as well as any other functions – the Power and Water project officer is to set out site-specific requirements.
Roads and pond bunds are to be located high enough to be trafficable during a one in fifty-year flood.
Roads are to be designed in accordance with the master text specification. The roads will be needed to carry one tonne utility type vehicles once or twice a week, and construction type machinery such as cranes and front end loaders daily for one or two weeks per year during maintenance.
9.2. buIldIng and road loCatIon
Design Guidelines Part 2 Section 7.9.4, 7.9.7, 7.8
The building is to be located to give the operator the maximum overview of the ponds and have road access and turning ability for 5 tonne trucks.
Roads are to be located all round inlet structures such as screens and inlet channels, facultative ponds. Roads are to be located at least on one side of each maturation pond and flow meters. Trafficable areas of at least four metres width are to be provided around all other plant items such as the other sides of ponds where no roads exist.
Roads shall be laid out so that large plant such as cranes can exit the plant without having to back out.
10. BuFFer Zone reQuirement comPliance cHecK
Draft Guidelines for Buffer Zones
Check the design against the Power and Water buffer zone guidelines.
11. trees and otHer landscaPing Features
Design Manual, Part 2, Section 7.9.5
Design - trees should be remote from ponds (at least fifty metres unless contrary guidance is available) if wind is required for mixing and minimisation of short circuiting.
Check that tree requirements (if any) from the planning report are allowed for.
Place trees and shrubs around the operator’s building to provide shade.
Design report – provide listing of trees and shrubs required and their location as well as costings for their establishment.
12. Fencing, ligHting, signage and oH&s comPliance cHecK
Fencing in accordance with Power and Water standard drawings is required around the site as indicated by the Power and Water project officer for the particular plant. Power and Water project officer to provide this information if not in the planning report.
Signage in accordance with Manual Part 2 Section 7.9.6.
OH&S risk assessment in conjunction with Power and Water corporate procedure. Power and Water project officer to provide latest reference to designers.
Design report – certify that the Power and Water corporate procedure has been complied with.

26
13. scada and Process control
Refer planning report and Design Manual Part 2 Section 7.9.2 and Section 13.
Project officer to confer with Operations to develop brief for designers to take into account planning issues, operational issues and Sections 7.9.2, 13.
List and specify the SCADA and control requirements to undertake monitoring and process control as determined in the first two paragraphs above.
14. commissioning, decommissioning and oPeration during construction
Refer Planning Report
Ensure that plant layout does not impinge on existing operation during construction. Provide a strategy for commissioning that avoids interference with existing operation, or which can be carried out in conjunction with existing operation. See Section 8.1.4 Design Manual Part 2.
If there are design requirements for future decommissioning described in the Planning Report, ensure that those requirements are allowed for.
15. cHecK on staKeHolder reQuirement comPliance
Refer Planning Report
Check through the planning report to ensure that no agreed stakeholder compliance issues have been omitted.
16. estimate
Refer to Design Manual, Part 1 Section 14 for cost estimates. Power and Water project officer to specify which items are to be included in the estimate. Preliminary estimates may also be available from the Planning Report and these will be useful for comparison purposes.
Design report to tabulate the estimate including any caveats the designer considers significant.

27power and water corporation waste stabilisation pond design manual
Part 2 - waste stabilisation pond design code
28
1 effluent and odour standards1.1 nortHern territory guidelines
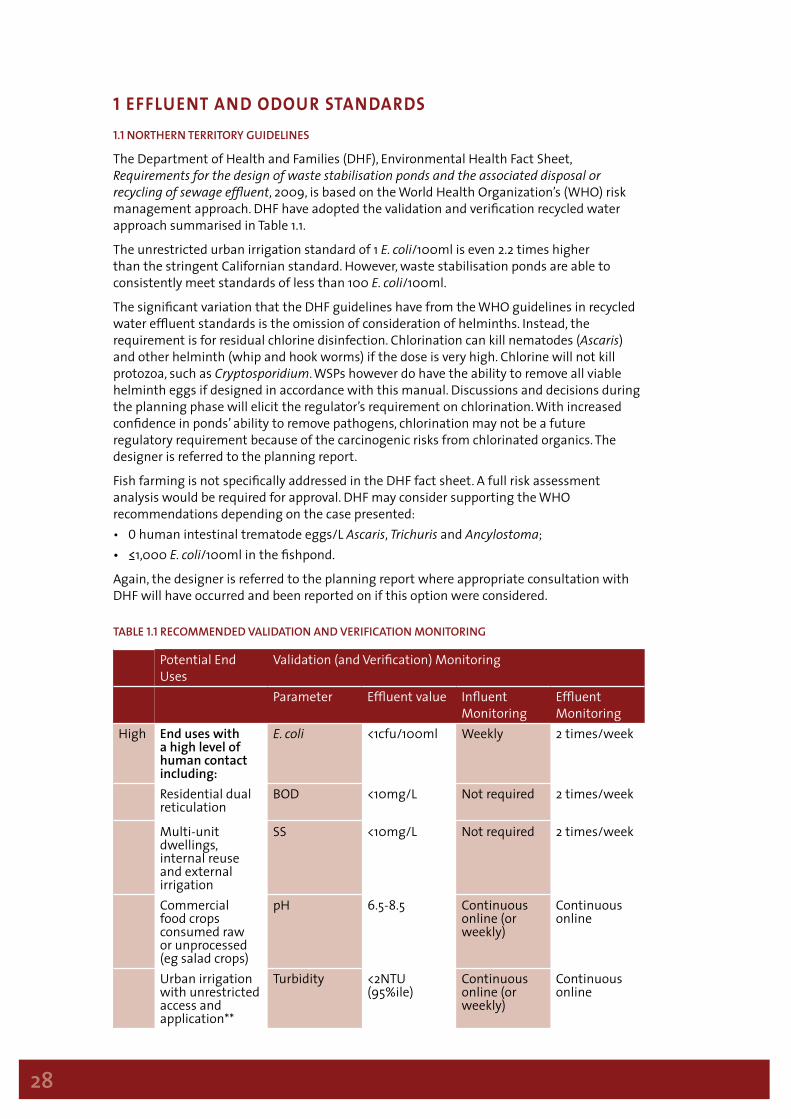
The Department of Health and Families (DHF), Environmental Health Fact Sheet, Requirements for the design of waste stabilisation ponds and the associated disposal or recycling of sewage effluent, 2009, is based on the World Health Organization’s (WHO) risk management approach. DHF have adopted the validation and verification recycled water approach summarised in Table 1.1.
The unrestricted urban irrigation standard of 1 E. coli/100ml is even 2.2 times higher than the stringent Californian standard. However, waste stabilisation ponds are able to consistently meet standards of less than 100 E. coli/100ml.
The significant variation that the DHF guidelines have from the WHO guidelines in recycled water effluent standards is the omission of consideration of helminths. Instead, the requirement is for residual chlorine disinfection. Chlorination can kill nematodes (Ascaris) and other helminth (whip and hook worms) if the dose is very high. Chlorine will not kill protozoa, such as Cryptosporidium. WSPs however do have the ability to remove all viable helminth eggs if designed in accordance with this manual. Discussions and decisions during the planning phase will elicit the regulator’s requirement on chlorination. With increased confidence in ponds’ ability to remove pathogens, chlorination may not be a future regulatory requirement because of the carcinogenic risks from chlorinated organics. The designer is referred to the planning report.
Fish farming is not specifically addressed in the DHF fact sheet. A full risk assessment analysis would be required for approval. DHF may consider supporting the WHO recommendations depending on the case presented:• 0 human intestinal trematode eggs/L Ascaris, Trichuris and Ancylostoma;• ≤1,000 E. coli/100ml in the fishpond.
Again, the designer is referred to the planning report where appropriate consultation with DHF will have occurred and been reported on if this option were considered.
taBle 1.1 recommended Validation and VeriFication monitoring
Potential End Uses
Validation (and Verification) Monitoring
Parameter Effluent value Influent Monitoring
Effluent Monitoring
High End uses with a high level of human contact including:
E. coli <1cfu/100ml Weekly 2 times/week
Residential dual reticulation
BOD <10mg/L Not required 2 times/week
Multi-unit dwellings, internal reuse and external irrigation
SS <10mg/L Not required 2 times/week
Commercial food crops consumed raw or unprocessed (eg salad crops)
pH 6.5-8.5 Continuous online (or weekly)
Continuous online
Urban irrigation with unrestricted access and application**
Turbidity <2NTU (95%ile)
Continuous online (or weekly)
Continuous online

29power and water corporation waste stabilisation pond design manual
Disinfection
<5NTU (maximum)Cl: 0.2-1.0mg/L residualUV:TBAOzone: TBA
Continuous online (or weekly) N/A
Continuous online
Coliphages <1cfu/100ml Fortnightly WeeklyClostridia <1cfu/100ml Fortnightly Weekly
Med. End users with a medium level human contact, including:
E. coli <1,000cfu /100ml
Weekly 2 times/week
Urban irrigation with some restricted access and application*** Commercial food crops
BOD <20mg/L Not required 2 times/week
Fountains and water features
SS <30mg/L Not required 2 times/week
pH 6.5-8.5 Continuous online (or weekly)
Continuous online
Turbidity <5NTU (95%ile)
Continuous online (or weekly)
Continuous online
Disinfection Cl: 0.2-1.0mg/L residualUV:TBAOzone: TBA
N/A Continuous online
Low End users with a low level of human contact including:
E. coli <1,000cfu /100ml
Weekly 2 times/week
Urban irrigation with enhanced restricted access and application irrigation****
BOD <20mg/L Not required 2 times/week
Commercial food crops
SS <30mg/L Not required 2 times/week
pH 6.5-8.5 Continuous online (or weekly)
Continuous online
Disinfection Cl: 0.2-1.0mg/L residualUV:TBAOzone: TBA
N/A Continuous online
Non-food crops (trees, turf, woodlots, flowers)
E. coli <10,000cfu /100ml
12 monthly 12 monthly
Notes: * Urban irrigation with the potential for full public contact, no control to restrict access or minimise spray drift ** Urban irrigation with restricted public access *** Urban irrigation with restricted public access. Source: NT FHD
30
1.2 oPerational and strategic guidelines
There are other elements in relation to influent to effluent monitoring:• Compliance monitoring, that ensures the discharge standards are met;• Operational needs, covering data on inter-pond sample analysis to help with pond
operating or process trouble shooting. Operation health and safety (OH&S) possibly related to spray irrigation and infectious risk to operators;
• Strategic guidelines, for the reuse of effluent, for example, to be used for power station cooling water.
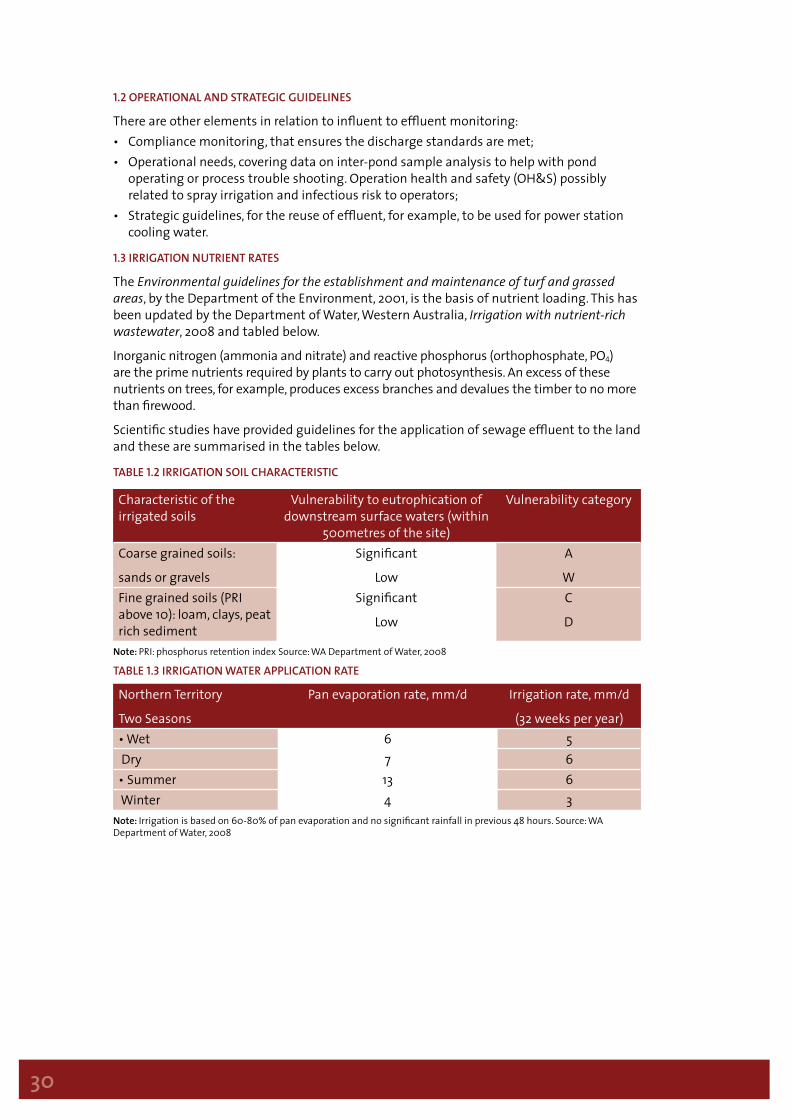
1.3 irrigation nutrient rates
The Environmental guidelines for the establishment and maintenance of turf and grassed areas, by the Department of the Environment, 2001, is the basis of nutrient loading. This has been updated by the Department of Water, Western Australia, Irrigation with nutrient-rich wastewater, 2008 and tabled below.
Inorganic nitrogen (ammonia and nitrate) and reactive phosphorus (orthophosphate, PO4) are the prime nutrients required by plants to carry out photosynthesis. An excess of these nutrients on trees, for example, produces excess branches and devalues the timber to no more than firewood.
Scientific studies have provided guidelines for the application of sewage effluent to the land and these are summarised in the tables below.
taBle 1.2 irrigation soil cHaracteristic
Characteristic of the irrigated soils
Vulnerability to eutrophication of downstream surface waters (within
500metres of the site)
Vulnerability category
Coarse grained soils:
sands or gravels
Significant
Low
A
WFine grained soils (PRI above 10): loam, clays, peat rich sediment
Significant
Low
C
D
Note: PRI: phosphorus retention index Source: WA Department of Water, 2008
taBle 1.3 irrigation Water aPPlication rate
Northern Territory
Two Seasons
Pan evaporation rate, mm/d Irrigation rate, mm/d
(32 weeks per year)• Wet 6 5 Dry 7 6• Summer 13 6 Winter 4 3
Note: Irrigation is based on 60-80% of pan evaporation and no significant rainfall in previous 48 hours. Source: WA Department of Water, 2008

31power and water corporation waste stabilisation pond design manual
Potassium, essential to plants, may need to be added as Australian sewage effluents and soils are often low in this necessary metal.
1.3.1 bIoChemICal oxygen demand and SuSpended SolIdS
The DHF guidelines (see Table 1.1) require two other important parameters to be met in effluent discharge:• Biochemical oxygen demand (BOD5): indicates the level of organic matter left to be
oxidised – generally in the receiving water;• Suspended solids (SS): contaminates the receiving water and settles to be digested
anaerobically on the bed of the river or lake.
The levels range from 10:10, BOD:SS mg/L, for areas of high human contact to 20:30, BOD:SS mg/L, for low human contact. DHF require the tests include the algae component, which is 70%-90% of WSP effluent.
In comparison with this, for waste stabilisation pond designs it is recommended that the 1991 Council of the European Communities Urban Wastewater Treatment Directive (UWWTD) be discussed extensively with regulators in the design stage with a view to relaxation of this requirement for WSPs. The EC directive requires WSP effluent to be filtered to remove algae before determining the BOD. The European Union accepts that there is a difference to the receiving water on the oxygen demand exerted by algae BOD and SS compared to the effluent from other processes where the BOD and SS are not algal based:• The WSP process converts sewage BOD to algal BOD (Gray, 2004);• During daylight, algae discharged to a receiving water continue to undertake
photosynthesis and give off oxygen to the benefit of the water (Mara 2003, p51);• Algae provides zooplankton, fish and other predators in the receiving water with food;• In Europe, WSP effluent discharges follow the 1915 Royal Commission recommendation
of eight times dilution with “clean water”. Eutrophication is primarily related to the upstream nutrient concentration and would be little affected by the algae addition;
• Algae laden effluent used for agricultural irrigation acts as a slow release fertilizer. (Designing irrigation systems to be self-flushing – last ten minutes with clean water – might negate the need for dissolved air flotation (DAF) or direct filtration processes such as “Dynasand” for removing algae from WSP effluent). In addition, the DAF process removes some 2 log order of pathogens.
Thus, the UWWTD requires WSP effluent to be pre-filtered to remove algae and then achieve <25mg/L BOD and <150mg/L SS. The 150mg/L SS would be excessive for many rivers and is expected to be reduced.
Whatman glass fibre C (1.2 µm) filter paper is recommended for the separation of algae from WSP effluent organic BOD.
taBle 1.4 irrigation cHemical aPPlication rate aPPlication rate
Vulnerability category*
Maximum inorganic nitrogen (NH3 +NO3 as N)
Maximum reactive phosphorus (PO4 as P)
kg/ha yr mg/L kg/ha yr mg/LA 140 9 10 0.6B 180 11 20 1.2C 300 19 50 3.1D 480 30 120 7.5
Note: * see Table 4.2 Source: WA Department of Water, 2008
32
1.4 PHosPHorus remoVal
WSPs reduce phosphorus by typically 45%, but reactive phosphorus limits are normally much higher than the preferred level of less than 1mg/L. Nitrogen, not phosphorus, is likely to be the nutrient critical for discharge to the sea or a high salinity tidal estuary.
Phosphorus removal can be achieved by algal growth and algal settlement (Gray, 2004) within the receiving water. An interesting example is the Ruhr River. Artificial shallow basins were created in the river bed similar in performance to maturation ponds. The Ruhr nutrient load provides food for algae to proliferate in the basins. Algae die and sink to form Part of the benthic or bed sediment. Phosphorus is held in the bed sediment until dredged. Dredging removes sediment that contains phosphorus as well as industrial metals. The aerated rock filter (see Section 5.7.3) utilises a similar process where phosphorus is taken up by algae that eventually are precipitated in the sludge as dead cells.
Traditionally, effluent is dosed with coagulants such as aluminium sulphate. The subsequent sludge incorporates phosphorus as a salt in the pond sludge.
1.5 odour BuFFer distances
Power and Water guidelines for WSP odour buffer distances are contained in the Power and Water draft publication “Guidelines for Buffer Zones for Waste Water Treatment Plants, Wellheads and Chlorine Installations.”
Odour problems do occur:• Where raw sewage sulphate concentrations are in excess of 500 mg/L SO4 (Gloyna, 1969).
Potable water supplies can contain excessive levels of sulphate and these are passed to the sewage. Odour from anaerobic ponds is likely at such levels;
• When households use high levels of sodium sulphate based detergents. To reduce the risk of odour at the WSP, it may be necessary to repeat campaigns to discourage the sale of sodium sulphate detergents;
• From certain illegal trade waste discharges. Tracing the illegal trade waste and implementing pre-treatment before discharge to the public sewer is essential. WSP do have a substantial buffer capacity against shock organic loads or trade waste discharges, but both the algae and microbes are fragile and will die at sustained toxic levels;
• With long rising mains in hot climates. The depletion of oxygen in the raw sewage will activate anaerobic sulphate-reducing bacteria (for example, Desulfovibrio spp.) (Pomeroy, 1981) bacteria to reduce the pH and give off hydrogen sulphide that is likely to “gas off” on arriving at the sewage treatment inlet works. Discharging the rising main flow at mid depth in the first pond can contain much of the odour;
• When ponds are inundated by sea water, raising the sulphate levels in excess of 500mg/L. The Darwin Sanderson pond has received sea water at some time as it is well stocked with oxeye herring (Megalops cyprinoides), which only breeds in sea water.
Additional discussion on odour control measures is given in Section 3.3.

33power and water corporation waste stabilisation pond design manual
2 sewage flows, loads & temperatures2.1 FloWs
2.1.1 northern terrItory ClImatIC featureS affeCtIng flowS
WSP process design is based on the average flow and organic load conditions. The long retention time from 20 to, in some cases, 40 days provides a buffer to average out peak flows and loads. In comparison, an activated sludge reactor has 4 to 16 hours retention and consequently little buffering capacity against peak flows and organic loads.
Pond hydraulic structures must be designed on peak, not average, flows and the storm rainfall inflow derived from the pond area to ensure storm flows are controlled and not a threat to embankments. The intense Northern Territory rain, inflow and infiltration require storm bypasses if pond bio-mass is not to be washed out into the receiving water.
The hot Northern Territory climate results in high water usage. The tropical north (see Figure below) is a wet/dry climate where a long ‘dry’ season with no rainfall has led to consistent high water usage. In the southern states, which lie in temperate zones, water consumption is lower. On average, water consumption in the Northern Territory is 950L/capita day, but 1,100L/capita day is used for design.
Water consumption for design purposes should be either derived from measured values for a specific project, or from Power and Water’s developers’ guidelines available on line at:
http://www.powerwater.com.au/?a=911
Figure 2.1 australia climatic maP
In the temperate winter climates of Alice Springs, facultative ponds need to be three times the size to those in tropical climates, such as Darwin. Chapter 5 discusses pond design related to temperature in detail.
34
2.1.2 domestic seWage FloWs
Domestic sewage flows in the Northern Territory are typically taken as:• 300 L/capita day in the tropical north
and• 270 L/capita day in the temperate south.
The flows do vary considerably depending upon the climatic zone, sewer inflow and infiltration, prosperity and whether the water supply is metered.
There is a wide variation in sewage flows, which ideally requires each project to be considered separately if efficiency in design is to be achieved. For upgrading or expanding existing WSPs flow monitoring in both seasons should provide a better guide for use in pond process design.
However, where flow monitoring has not taken place, flows should be estimated using the methods stipulated in Power and Water’s guidelines for developers:
http://www.powerwater.com.au/?a=911
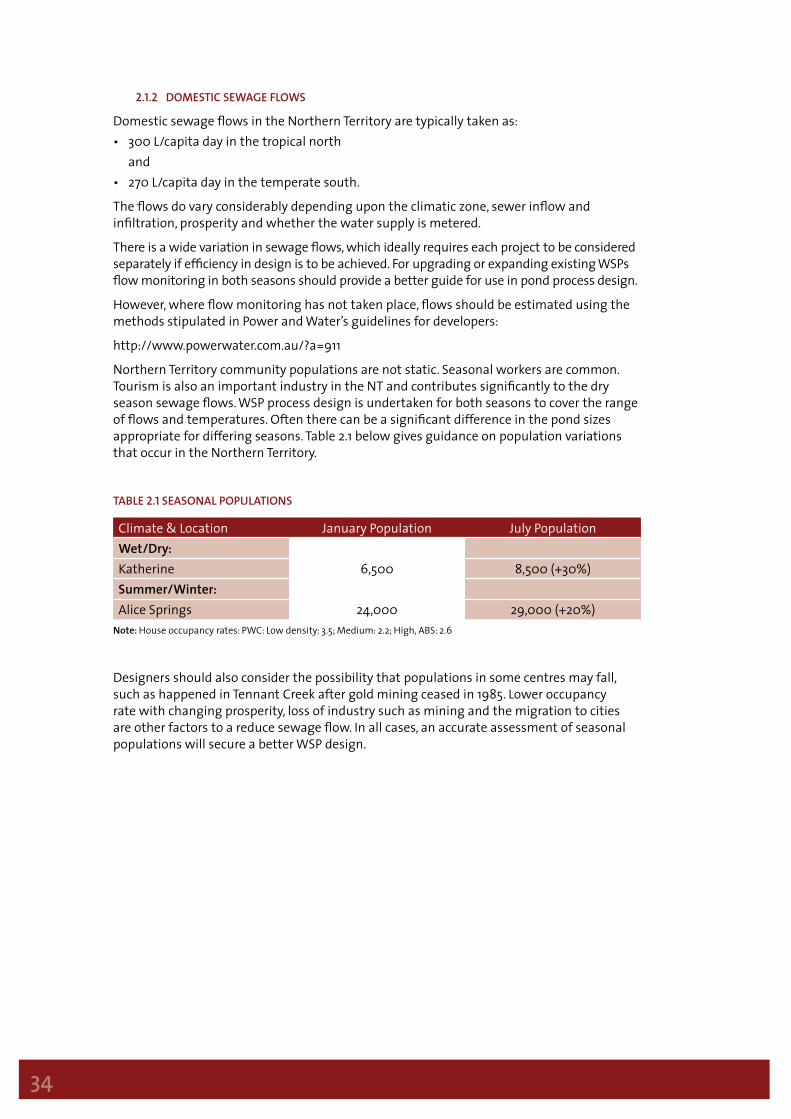
Northern Territory community populations are not static. Seasonal workers are common. Tourism is also an important industry in the NT and contributes significantly to the dry season sewage flows. WSP process design is undertaken for both seasons to cover the range of flows and temperatures. Often there can be a significant difference in the pond sizes appropriate for differing seasons. Table 2.1 below gives guidance on population variations that occur in the Northern Territory.
taBle 2.1 seasonal PoPulations
Climate & Location January Population July PopulationWet/Dry:Katherine 6,500 8,500 (+30%)Summer/Winter:Alice Springs 24,000 29,000 (+20%)
Note: House occupancy rates: PWC: Low density: 3.5; Medium: 2.2; High, ABS: 2.6
Designers should also consider the possibility that populations in some centres may fall, such as happened in Tennant Creek after gold mining ceased in 1985. Lower occupancy rate with changing prosperity, loss of industry such as mining and the migration to cities are other factors to a reduce sewage flow. In all cases, an accurate assessment of seasonal populations will secure a better WSP design.

35power and water corporation waste stabilisation pond design manual
2.1.3 commercial and industrial FloWs
Commercial sewage flows are occasionally measured but often will have to be estimated from water consumption data Figures and the assumption that 100% enters the public sewer. Power and Water does hold water meter readings for all commercial consumers. Power and Water’s Water Services officers will be able to give guidance on the extent of commercial properties discharging to the sewers. The strength of sewage would be expected to be the same as the domestic population (see Section 2.3).
Major industrial discharges are regulated under the Power and Water trade waste agreements for discharge to public sewers. A site-by-site investigation to check actual discharge records will be required. Accurate information for the organic strength of the sewage should be determined by individual sampling and analysis. Power and Water’s trade waste officers will be able to provide advice and guidance. Often, a few companies discharge the majority of the waste loading, making it unnecessary to test more than these for a representative sample.
2.1.4 inFloW and inFiltration
Heavy tropical rain in the Top End, low annual rainfall in Alice Springs/Tennant Creek and the current theories on climate change influence predictions of inflow to the sewers. During cyclones or heavy storms, flooding from torrential downpours may directly discharge to the sewer. Campaigns by Power and Water to disconnect illegal storm water to the sewer are on-going, but making these illegal connections is relatively simple. Repeated campaigns against illegal inflow are required to limit inflows to less than 20% of the domestic flow. Above this level, flows become significant for WSP design.
Groundwater infiltration to the sewer is also correlated to rainfall and high tides where sewerage is in coastal areas. Projects have been undertaken to seal sewer joints, but the cost is high and sometimes the repairs are short lived by increased head from a rising ground water table. New sewerage schemes have the benefit of better pipe jointing and less illegal interconnection to storm water disposal systems.
The large variation in inflow and infiltration to Power and Water sewers requires individual hydraulic assessment by catchment. Where total flows to the WSPs have been recorded over many years, it may be possible to assess inflow and infiltration by deducting the theoretical flows calculated for domestic, commercial and industrial discharges. This should be undertaken for the two seasons used for the process analysis. An alternative method is to measure chloride ion of potable water and the influent to calculate the inflow and infiltration flows.
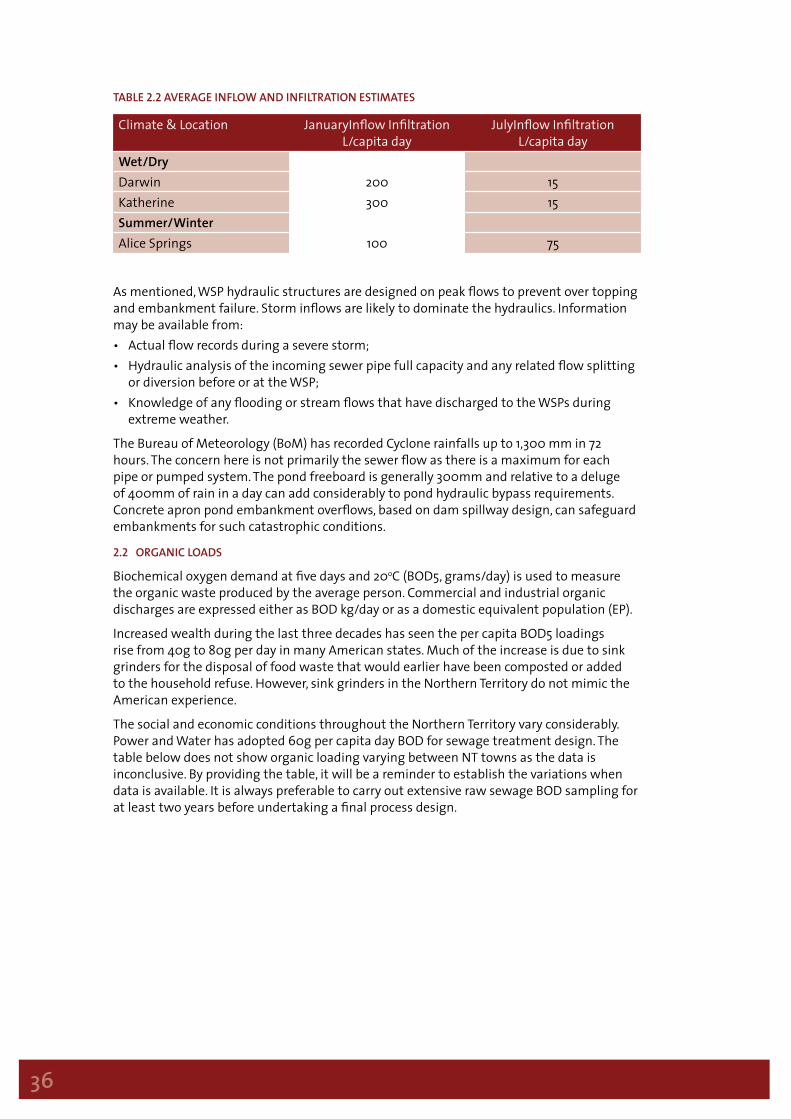
To emphasize the range of inflow and infiltration in Power and Water’s sewers, Table 2.2 gives preliminary values. It is emphasised that this is no substitute for flow monitoring undertaken over several seasons.
36
taBle 2.2 aVerage inFloW and inFiltration estimates
Climate & Location JanuaryInflow Infiltration L/capita day
JulyInflow Infiltration L/capita day
Wet/DryDarwin 200 15Katherine 300 15Summer/WinterAlice Springs 100 75
As mentioned, WSP hydraulic structures are designed on peak flows to prevent over topping and embankment failure. Storm inflows are likely to dominate the hydraulics. Information may be available from:• Actual flow records during a severe storm;• Hydraulic analysis of the incoming sewer pipe full capacity and any related flow splitting
or diversion before or at the WSP;• Knowledge of any flooding or stream flows that have discharged to the WSPs during
extreme weather.
The Bureau of Meteorology (BoM) has recorded Cyclone rainfalls up to 1,300 mm in 72 hours. The concern here is not primarily the sewer flow as there is a maximum for each pipe or pumped system. The pond freeboard is generally 300mm and relative to a deluge of 400mm of rain in a day can add considerably to pond hydraulic bypass requirements. Concrete apron pond embankment overflows, based on dam spillway design, can safeguard embankments for such catastrophic conditions.
2.2 organic loads
Biochemical oxygen demand at five days and 20oC (BOD5, grams/day) is used to measure the organic waste produced by the average person. Commercial and industrial organic discharges are expressed either as BOD kg/day or as a domestic equivalent population (EP).
Increased wealth during the last three decades has seen the per capita BOD5 loadings rise from 40g to 80g per day in many American states. Much of the increase is due to sink grinders for the disposal of food waste that would earlier have been composted or added to the household refuse. However, sink grinders in the Northern Territory do not mimic the American experience.
The social and economic conditions throughout the Northern Territory vary considerably. Power and Water has adopted 60g per capita day BOD for sewage treatment design. The table below does not show organic loading varying between NT towns as the data is inconclusive. By providing the table, it will be a reminder to establish the variations when data is available. It is always preferable to carry out extensive raw sewage BOD sampling for at least two years before undertaking a final process design.

37power and water corporation waste stabilisation pond design manual
taBle 2.3 domestic organic loadings
Climate & Location BOD5 grams per capita day CommentsWet/DryDarwin 53 Sink grinders not significantKatherine 53 High tourist areaSummer/WinterAlice Springs 53 Older sewer system & high
tourist populationTennant Creek 53 High Aboriginal population
The WSP process designer will also wish to calculate the reduction in pathogens and nutrients. Licences to discharge effluent now commonly demand high standards to reduce both public health and environmental contamination risks. To assist in the preliminary process designs, an indication of the loadings is given below.
taBle 2.4 non-organic seWage comPosition
UrbanNitrogen, g N/cap day:
• Total nitrogen
• Ammonia (NH3):
o Inorganic:
o Organic:
• TKN
14
14
8.4
5.6
14Phosphorus, g P/cap day:
• Total phosphorus
• Reactive P (PO4)
4
3Alkalinity, mg/L, CaC03 200Escherichia coli, No/100ml 10 millionHelminth, eggs/L 500
Note: Almost all nitrogen in raw sewage is present as organic nitrogen and ammonia: that is, total nitrogen and TKN are numerically the same.
2.3 seWage strengtH
Power and Water has considerable records of raw sewage strengths throughout the Northern Territory, summarised below. The designer should investigate further if the correlation is poor.
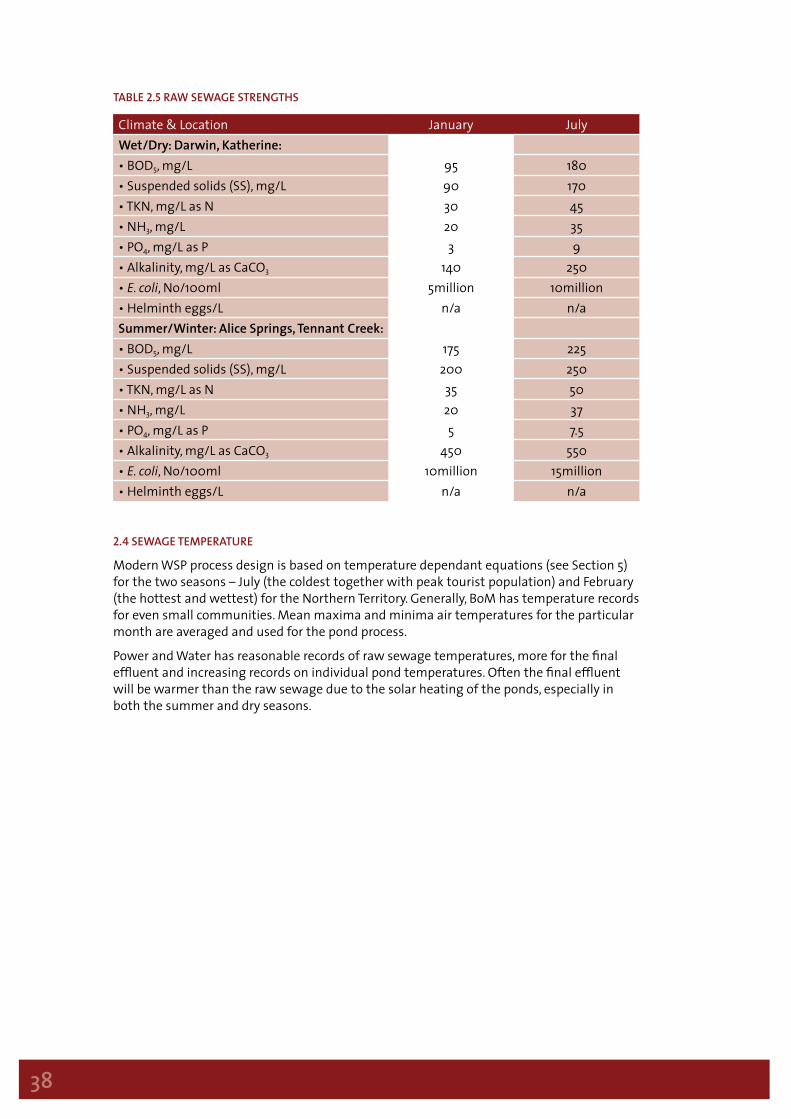
38
taBle 2.5 raW seWage strengtHs
Climate & Location January JulyWet/Dry: Darwin, Katherine:• BOD5, mg/L 95 180• Suspended solids (SS), mg/L 90 170• TKN, mg/L as N 30 45• NH3, mg/L 20 35• PO4, mg/L as P 3 9• Alkalinity, mg/L as CaCO3 140 250• E. coli, No/100ml 5million 10million• Helminth eggs/L n/a n/aSummer/Winter: Alice Springs, Tennant Creek:• BOD5, mg/L 175 225• Suspended solids (SS), mg/L 200 250• TKN, mg/L as N 35 50• NH3, mg/L 20 37• PO4, mg/L as P 5 7.5• Alkalinity, mg/L as CaCO3 450 550• E. coli, No/100ml 10million 15million• Helminth eggs/L n/a n/a
2.4 seWage temPerature
Modern WSP process design is based on temperature dependant equations (see Section 5) for the two seasons – July (the coldest together with peak tourist population) and February (the hottest and wettest) for the Northern Territory. Generally, BoM has temperature records for even small communities. Mean maxima and minima air temperatures for the particular month are averaged and used for the pond process.
Power and Water has reasonable records of raw sewage temperatures, more for the final effluent and increasing records on individual pond temperatures. Often the final effluent will be warmer than the raw sewage due to the solar heating of the ponds, especially in both the summer and dry seasons.
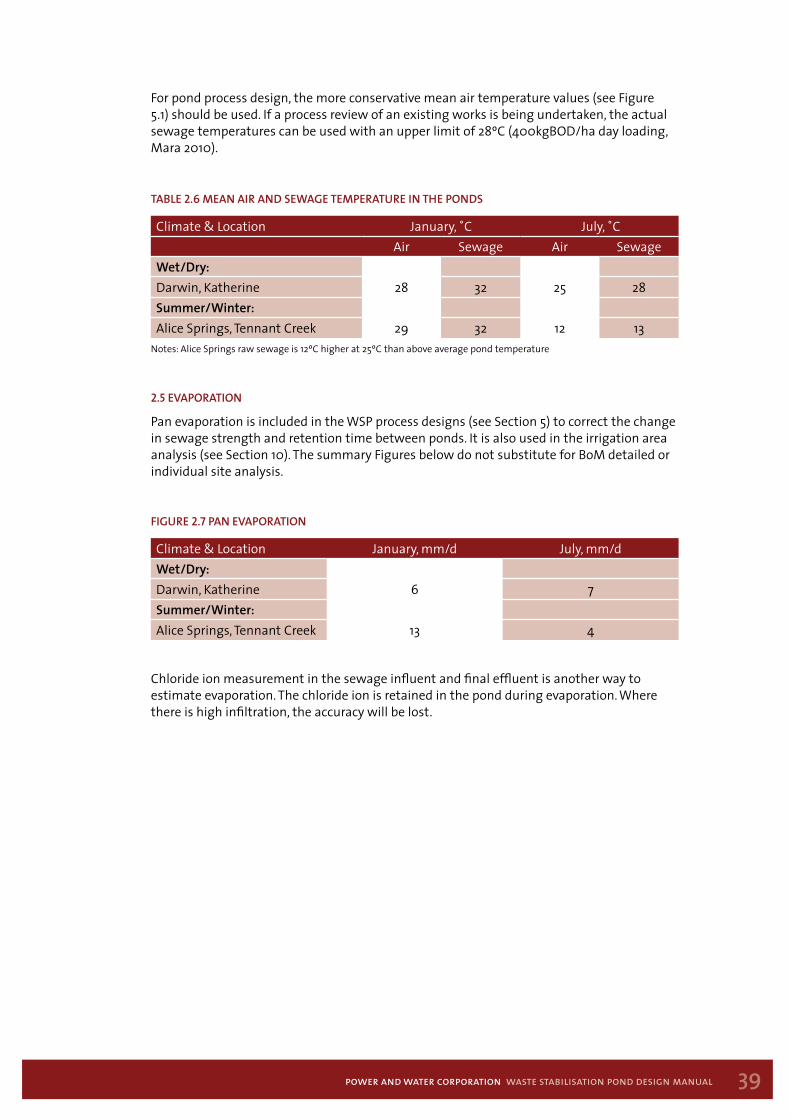
39power and water corporation waste stabilisation pond design manual
For pond process design, the more conservative mean air temperature values (see Figure 5.1) should be used. If a process review of an existing works is being undertaken, the actual sewage temperatures can be used with an upper limit of 28ºC (400kgBOD/ha day loading, Mara 2010).
taBle 2.6 mean air and seWage temPerature in tHe Ponds
Climate & Location January, ˚C July, ˚CAir Sewage Air Sewage
Wet/Dry:Darwin, Katherine 28 32 25 28Summer/Winter:Alice Springs, Tennant Creek 29 32 12 13
Notes: Alice Springs raw sewage is 12ºC higher at 25ºC than above average pond temperature
2.5 eVaPoration
Pan evaporation is included in the WSP process designs (see Section 5) to correct the change in sewage strength and retention time between ponds. It is also used in the irrigation area analysis (see Section 10). The summary Figures below do not substitute for BoM detailed or individual site analysis.
Figure 2.7 Pan eVaPoration
Climate & Location January, mm/d July, mm/dWet/Dry:Darwin, Katherine 6 7Summer/Winter:Alice Springs, Tennant Creek 13 4
Chloride ion measurement in the sewage influent and final effluent is another way to estimate evaporation. The chloride ion is retained in the pond during evaporation. Where there is high infiltration, the accuracy will be lost.
40
3 wsp biological processes3.1 aeroBic
Life on earth would not exist without micro-organisms. The single cell bacteria, viruses, protozoa and algae break down waste and provide compounds to support life. These micro-organisms, together with fungi, are the main consumers of organic waste contained in sewage. Aerobic micro-organisms require oxygen for metabolism as well as minerals such as nitrates and phosphates. Their rate of growth depends upon sufficient organic matter to nutrients ratios (100:5:1 BOD:N:P), pH and temperature. In addition, algal cell division supports the pathogen “killing process” by the significant diurnal pH change in the pond when changing from oxygen production in sunlight to carbon dioxide (respiration) and lower pH at night. In sunlight, algal production has its maximum demand for carbon dioxide some of which is derived from carbonate and bicarbonate. The result is a rapid rise in pH to 9.5 or more.
The production of oxygen by algae is proportional to solar intensity and the larger the pond surface area, the greater the total oxygen production. The oxygen is used by the bacteria to break down the complex organic matter (sewage) into simple compounds. The higher the temperature, the more rapid the reaction. The stronger the organic waste, the greater the aerobic pond area needed for a given temperature. Because of these considerations, the temperature differences between Darwin (28°C in the dry season), and Alice Springs (13°C in the winter) mean that facultative ponds need to be three times larger in Alice Springs than in Darwin.
Modern compact treatment systems, such as activated sludge and membranes, also rely on microbes to convert the organic mass of sewage to gases (carbon dioxide; nitrogen) and sludge. Their source of oxygen is air, which is blown through the water and so allows a much smaller “footprint” for the treatment works. Electricity is the major operational cost of modern electromechanical sewage works. Nearly all of this cost is avoided by ponds as they are solar driven.
The nitrogen content of sewage has complex relationships in ponds:• Anaerobic ponds convert the organic nitrogen in excreta, urine and food waste to
ammonia, significantly increasing the ammonia discharged from the pond;• Aerobic nitrification is the conversion of ammonia to nitrites and then nitrates
by bacteria;• Nitrates are stripped in the anoxic zone of the pond (denitrification) to nitrous gases.
In the high NT pond temperatures the nitrification and de-nitrification can be rapid. It is not clear how this can happen, but effluent results do not show the expected nitrites.
3.1.1 algal relationsHiPs in WsP treatment Processes
Sewage ponds provide the conditions for the symbiotic relation between algae and bacteria (see Figure 3.1A):• Aerobic bacteria break down (catabolism) of organic waste to give off carbon dioxide;• Algae use the carbon dioxide for cell growth (anabolism) and, in turn, give off oxygen in
day light;• Aerobic bacteria use the oxygen given off by the algae and diffused from the atmosphere
for their own metabolism and new cell production.
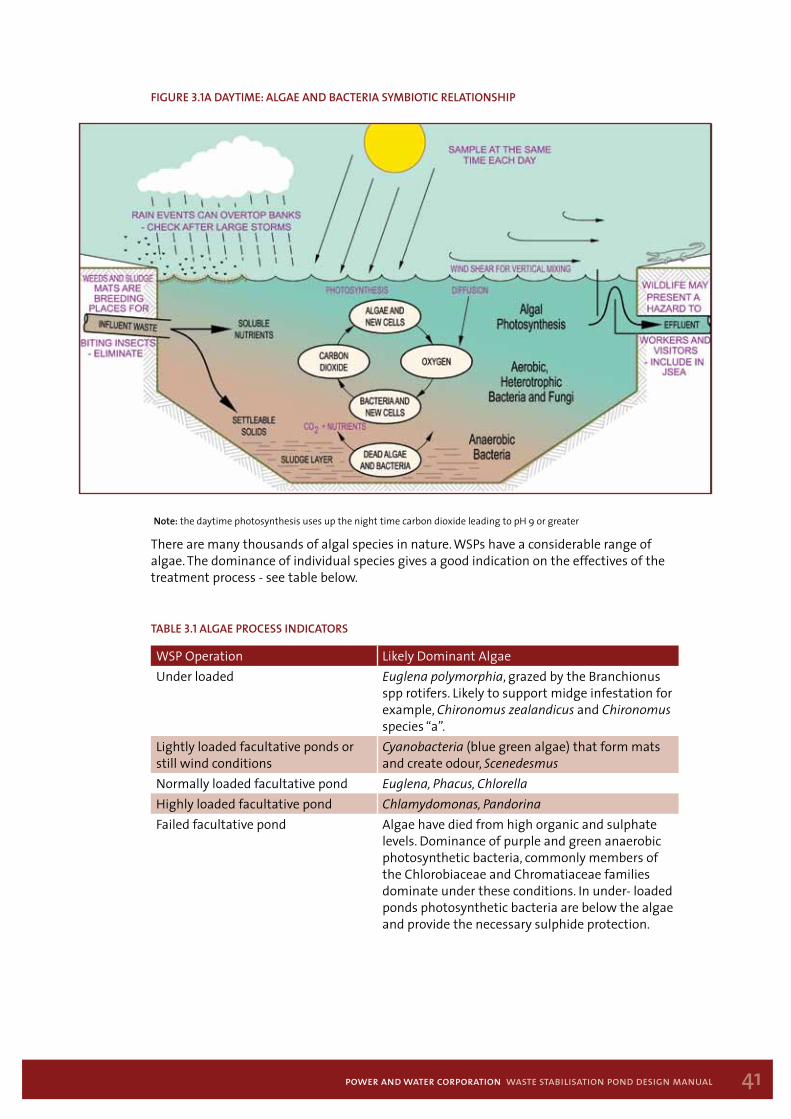
41power and water corporation waste stabilisation pond design manual
Figure 3.1a daytime: algae and Bacteria symBiotic relationsHiP
Note: the daytime photosynthesis uses up the night time carbon dioxide leading to pH 9 or greater
There are many thousands of algal species in nature. WSPs have a considerable range of algae. The dominance of individual species gives a good indication on the effectives of the treatment process - see table below.
taBle 3.1 algae Process indicators
WSP Operation Likely Dominant AlgaeUnder loaded Euglena polymorphia, grazed by the Branchionus
spp rotifers. Likely to support midge infestation for example, Chironomus zealandicus and Chironomus species “a”.
Lightly loaded facultative ponds or still wind conditions
Cyanobacteria (blue green algae) that form mats and create odour, Scenedesmus
Normally loaded facultative pond Euglena, Phacus, ChlorellaHighly loaded facultative pond Chlamydomonas, PandorinaFailed facultative pond Algae have died from high organic and sulphate
levels. Dominance of purple and green anaerobic photosynthetic bacteria, commonly members of the Chlorobiaceae and Chromatiaceae families dominate under these conditions. In under- loaded ponds photosynthetic bacteria are below the algae and provide the necessary sulphide protection.
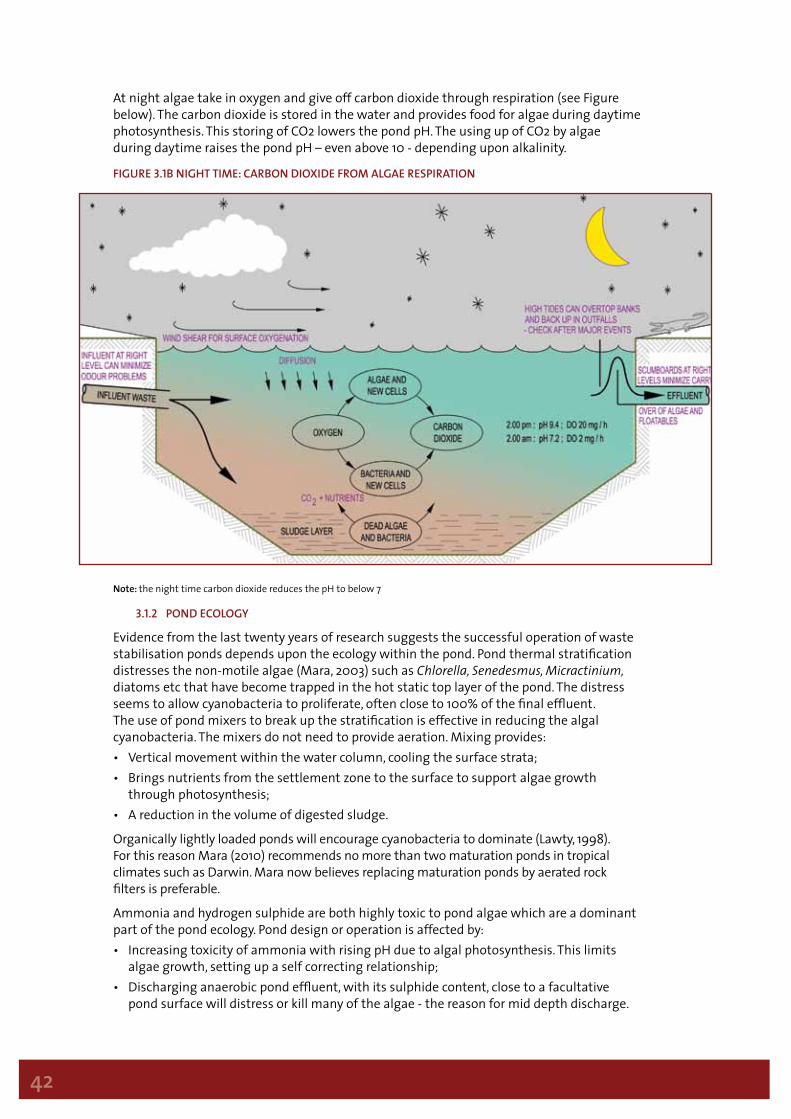
42
At night algae take in oxygen and give off carbon dioxide through respiration (see Figure below). The carbon dioxide is stored in the water and provides food for algae during daytime photosynthesis. This storing of CO2 lowers the pond pH. The using up of CO2 by algae during daytime raises the pond pH – even above 10 - depending upon alkalinity.
Figure 3.1B nigHt time: carBon dioXide From algae resPiration
Note: the night time carbon dioxide reduces the pH to below 7
3.1.2 Pond ecology
Evidence from the last twenty years of research suggests the successful operation of waste stabilisation ponds depends upon the ecology within the pond. Pond thermal stratification distresses the non-motile algae (Mara, 2003) such as Chlorella, Senedesmus, Micractinium, diatoms etc that have become trapped in the hot static top layer of the pond. The distress seems to allow cyanobacteria to proliferate, often close to 100% of the final effluent. The use of pond mixers to break up the stratification is effective in reducing the algal cyanobacteria. The mixers do not need to provide aeration. Mixing provides:• Vertical movement within the water column, cooling the surface strata;• Brings nutrients from the settlement zone to the surface to support algae growth
through photosynthesis;• A reduction in the volume of digested sludge.
Organically lightly loaded ponds will encourage cyanobacteria to dominate (Lawty, 1998). For this reason Mara (2010) recommends no more than two maturation ponds in tropical climates such as Darwin. Mara now believes replacing maturation ponds by aerated rock filters is preferable.
Ammonia and hydrogen sulphide are both highly toxic to pond algae which are a dominant part of the pond ecology. Pond design or operation is affected by:• Increasing toxicity of ammonia with rising pH due to algal photosynthesis. This limits
algae growth, setting up a self correcting relationship;• Discharging anaerobic pond effluent, with its sulphide content, close to a facultative
pond surface will distress or kill many of the algae - the reason for mid depth discharge.

43power and water corporation waste stabilisation pond design manual
Algae diurnal variation (Figure 5.3) shows facultative pond effluent algae concentration can drop to a fifth at the end of the day. Maturation pond effluent would show less variation but should be sufficient to support a diurnal regulated discharge for lower nutrients in the receiving water. However, where there is cyanobacterial dominance, it does not allow this advantage to be taken (PWC Sanderson, Sampling October 2009).
Marais’ (1976) experience in Zambia gave the first proof of the importance of wind shear on pond ecology, preventing a pond from becoming odorous and going septic from lack of oxygen.
By removing the vegetation that had overgrown the fence surrounding the ponds, the ponds returned to normal operation within two days. Wind is now known to provide vertical mixing and prevent stratification that supports odour and algal mats.
Even so ponds are highly complicated reactors that are still too difficult to define.
3.2 anaeroBic
Where insufficient oxygen is present, anaerobic heterotrophs and methanogenic bacteria break down the organic matter in sewage to extract oxygen from nitrates and sulphates.
3.2.1 green houSe gaSeS
3.2.1.1.1 methane and Carbon dIoxIde
Methane is given off in WSPs by a four stage break down of the organic matter beginning with glucose and finishing with bacterial conversions of acetates to methane (CH4). The biogas given off is some 70% methane and 30% carbon dioxide – both “green house” gases. Methane is considered to be up to 25 times more damaging to the atmosphere than carbon dioxide (see Section 16.7).
The actual volumes of greenhouse gas emitted from sewage treatment processes are not that well known. However, for design purposes, the following approach is suggested until better Figures are available.
Traditional sewage works primary sludge digestion is some 15 litres per capita day of digester gas at standard pressure and temperature. This increases to 20L/capita day for secondary digestion (Gray, 2004). The very long sludge retention time in WSPs probably is closer to secondary digestion, whilst the primary sludge digestion would mimic an anaerobic pond. Based on two thirds of the 15 L/capita day bio-gas produced being methane, this equates to close to 35 kWh per capita year.
Sewage works, such as Western Australia’s Woodman Point, use methane given off during sludge digestion to drive generators powered by reciprocating engines. Below populations less than 100,000 it is unlikely to be economic. The advances in fuel cell technology do allow scrubbed sewage derived gas to be used for producing electricity. Fuel cell costs are reducing, but with efficiencies of 40% do not match modern gas condensing boilers – 90% efficiency. Unfortunately, most of the Power and Water pond schemes are remote from industries requiring hot water.
Micro-turbines are a practical alternative to fuel cells for generating electricity. They have an efficiency of up to 30%.
Even if anaerobic pond gas collection is undertaken and the gas is flared, producing carbon dioxide, green house gas effects will have been reduced by 25%.
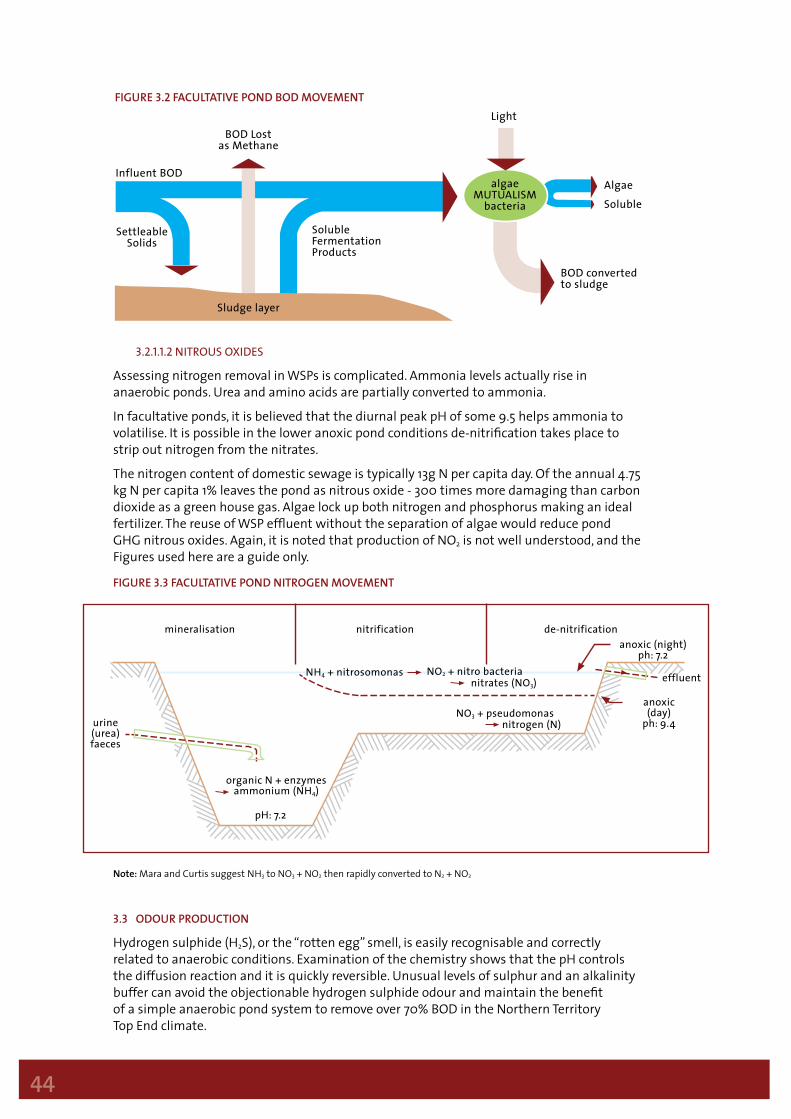
44
3.2.1.1.2 nItrouS oxIdeS
Assessing nitrogen removal in WSPs is complicated. Ammonia levels actually rise in anaerobic ponds. Urea and amino acids are partially converted to ammonia.
In facultative ponds, it is believed that the diurnal peak pH of some 9.5 helps ammonia to volatilise. It is possible in the lower anoxic pond conditions de-nitrification takes place to strip out nitrogen from the nitrates.
The nitrogen content of domestic sewage is typically 13g N per capita day. Of the annual 4.75 kg N per capita 1% leaves the pond as nitrous oxide - 300 times more damaging than carbon dioxide as a green house gas. Algae lock up both nitrogen and phosphorus making an ideal fertilizer. The reuse of WSP effluent without the separation of algae would reduce pond GHG nitrous oxides. Again, it is noted that production of NO2 is not well understood, and the Figures used here are a guide only.
Figure 3.3 FacultatiVe Pond nitrogen moVement
Note: Mara and Curtis suggest NH3 to NO3 + NO2 then rapidly converted to N2 + NO2
3.3 odour Production
Hydrogen sulphide (H2S), or the “rotten egg” smell, is easily recognisable and correctly related to anaerobic conditions. Examination of the chemistry shows that the pH controls the diffusion reaction and it is quickly reversible. Unusual levels of sulphur and an alkalinity buffer can avoid the objectionable hydrogen sulphide odour and maintain the benefit of a simple anaerobic pond system to remove over 70% BOD in the Northern Territory Top End climate.
mineralisation
organic N + enzymesammonium (NH4)
NH4 + nitrosomonas
NO3 + pseudomonas
NO2 + nitro bacterianitrates (NO3)
nitrogen (N)urine(urea)faeces
effluent
anoxic (night)ph: 7.2
anoxic (day)
ph: 9.4
pH: 7.2
nitrification de-nitrification
Figure 3.2 FacultatiVe Pond Bod moVement
Sludge layer
BOD Lostas Methane
Influent BOD
SettleableSolids
SolubleFermentationProducts
BOD convertedto sludge
Algae
Soluble
algaeMUTUALISM
bacteria
Light
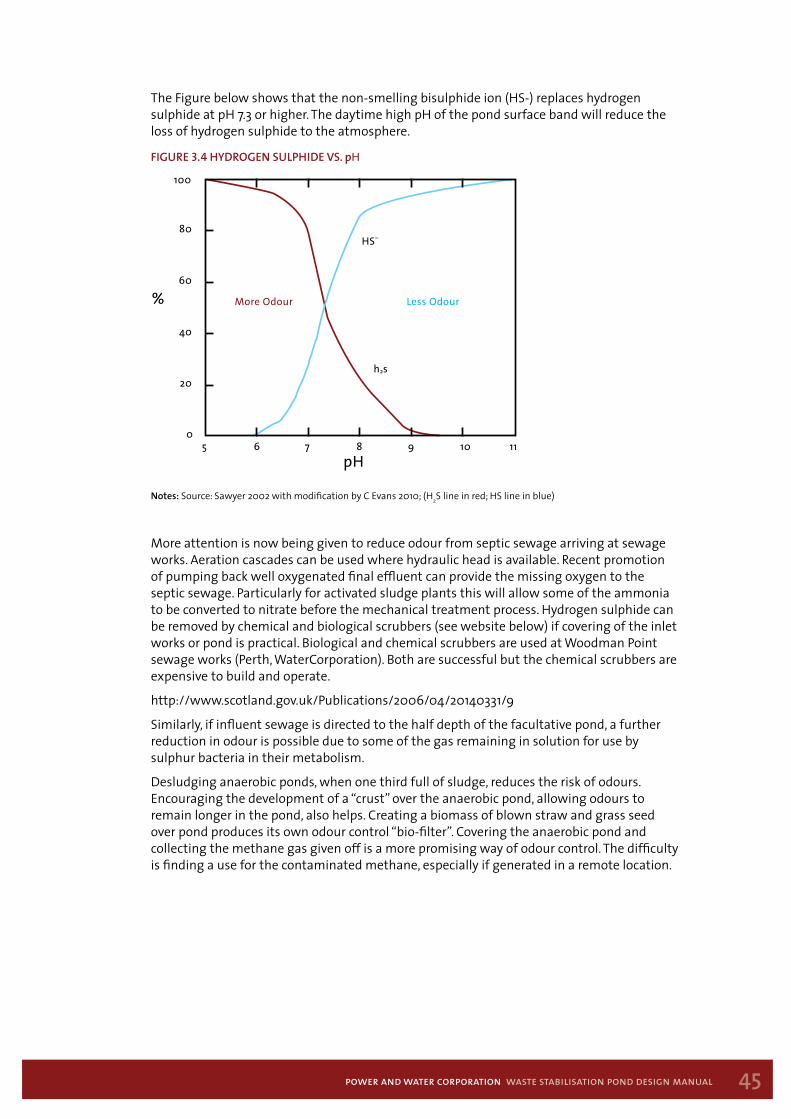
45power and water corporation waste stabilisation pond design manual
The Figure below shows that the non-smelling bisulphide ion (HS-) replaces hydrogen sulphide at pH 7.3 or higher. The daytime high pH of the pond surface band will reduce the loss of hydrogen sulphide to the atmosphere.
Figure 3.4 Hydrogen sulPHide Vs. pH
Notes: Source: Sawyer 2002 with modification by C Evans 2010; (H2S line in red; HS line in blue)
More attention is now being given to reduce odour from septic sewage arriving at sewage works. Aeration cascades can be used where hydraulic head is available. Recent promotion of pumping back well oxygenated final effluent can provide the missing oxygen to the septic sewage. Particularly for activated sludge plants this will allow some of the ammonia to be converted to nitrate before the mechanical treatment process. Hydrogen sulphide can be removed by chemical and biological scrubbers (see website below) if covering of the inlet works or pond is practical. Biological and chemical scrubbers are used at Woodman Point sewage works (Perth, WaterCorporation). Both are successful but the chemical scrubbers are expensive to build and operate.
http://www.scotland.gov.uk/Publications/2006/04/20140331/9
Similarly, if influent sewage is directed to the half depth of the facultative pond, a further reduction in odour is possible due to some of the gas remaining in solution for use by sulphur bacteria in their metabolism.
Desludging anaerobic ponds, when one third full of sludge, reduces the risk of odours. Encouraging the development of a “crust” over the anaerobic pond, allowing odours to remain longer in the pond, also helps. Creating a biomass of blown straw and grass seed over pond produces its own odour control “bio-filter”. Covering the anaerobic pond and collecting the methane gas given off is a more promising way of odour control. The difficulty is finding a use for the contaminated methane, especially if generated in a remote location.
pH
100
80
60
40
Less OdourMore Odour
20
05 6 7 8 9 10 11
%
h2s
HS–
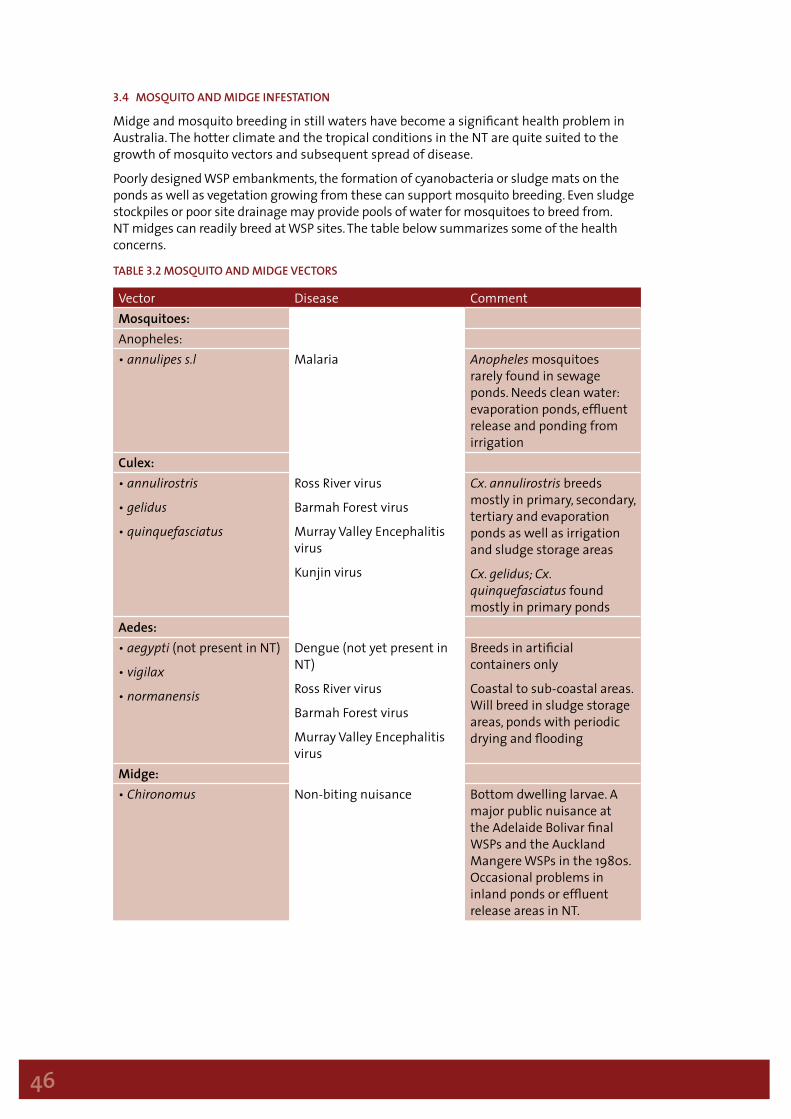
46
3.4 mosQuito and midge inFestation
Midge and mosquito breeding in still waters have become a significant health problem in Australia. The hotter climate and the tropical conditions in the NT are quite suited to the growth of mosquito vectors and subsequent spread of disease.
Poorly designed WSP embankments, the formation of cyanobacteria or sludge mats on the ponds as well as vegetation growing from these can support mosquito breeding. Even sludge stockpiles or poor site drainage may provide pools of water for mosquitoes to breed from. NT midges can readily breed at WSP sites. The table below summarizes some of the health concerns.
taBle 3.2 mosQuito and midge Vectors
Vector Disease CommentMosquitoes: Anopheles: • annulipes s.l Malaria Anopheles mosquitoes
rarely found in sewage ponds. Needs clean water: evaporation ponds, effluent release and ponding from irrigation
Culex:• annulirostris
• gelidus
• quinquefasciatus
Ross River virus
Barmah Forest virus
Murray Valley Encephalitis virus
Kunjin virus
Cx. annulirostris breeds mostly in primary, secondary, tertiary and evaporation ponds as well as irrigation and sludge storage areas
Cx. gelidus; Cx. quinquefasciatus found mostly in primary ponds
Aedes:• aegypti (not present in NT)
• vigilax
• normanensis
Dengue (not yet present in NT)
Ross River virus
Barmah Forest virus
Murray Valley Encephalitis virus
Breeds in artificial containers only
Coastal to sub-coastal areas. Will breed in sludge storage areas, ponds with periodic drying and flooding
Midge:• Chironomus Non-biting nuisance Bottom dwelling larvae. A
major public nuisance at the Adelaide Bolivar final WSPs and the Auckland Mangere WSPs in the 1980s. Occasional problems in inland ponds or effluent release areas in NT.
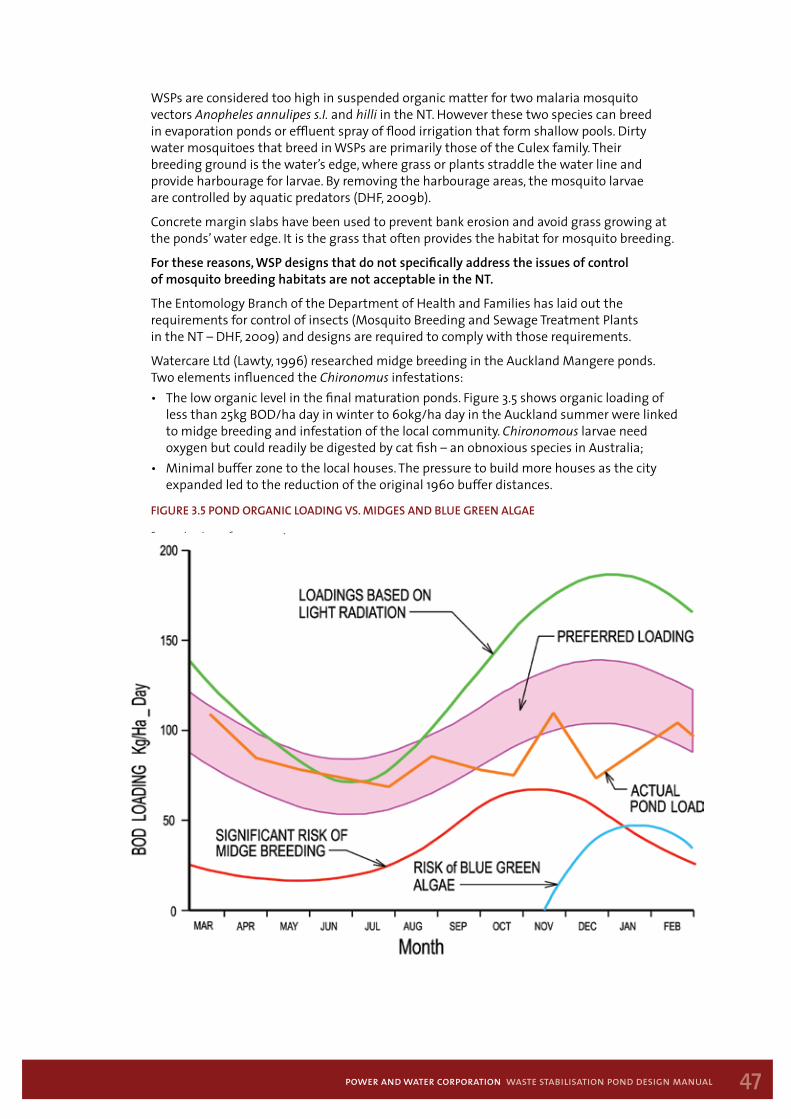
47power and water corporation waste stabilisation pond design manual
WSPs are considered too high in suspended organic matter for two malaria mosquito vectors Anopheles annulipes s.I. and hilli in the NT. However these two species can breed in evaporation ponds or effluent spray of flood irrigation that form shallow pools. Dirty water mosquitoes that breed in WSPs are primarily those of the Culex family. Their breeding ground is the water’s edge, where grass or plants straddle the water line and provide harbourage for larvae. By removing the harbourage areas, the mosquito larvae are controlled by aquatic predators (DHF, 2009b).
Concrete margin slabs have been used to prevent bank erosion and avoid grass growing at the ponds’ water edge. It is the grass that often provides the habitat for mosquito breeding.
For these reasons, WSP designs that do not specifically address the issues of control of mosquito breeding habitats are not acceptable in the NT.
The Entomology Branch of the Department of Health and Families has laid out the requirements for control of insects (Mosquito Breeding and Sewage Treatment Plants in the NT – DHF, 2009) and designs are required to comply with those requirements.
Watercare Ltd (Lawty, 1996) researched midge breeding in the Auckland Mangere ponds. Two elements influenced the Chironomus infestations:• The low organic level in the final maturation ponds. Figure 3.5 shows organic loading of
less than 25kg BOD/ha day in winter to 60kg/ha day in the Auckland summer were linked to midge breeding and infestation of the local community. Chironomous larvae need oxygen but could readily be digested by cat fish – an obnoxious species in Australia;
• Minimal buffer zone to the local houses. The pressure to build more houses as the city expanded led to the reduction of the original 1960 buffer distances.
Figure 3.5 Pond organic loading Vs. midges and Blue green algae
Source: Lawty, 1996
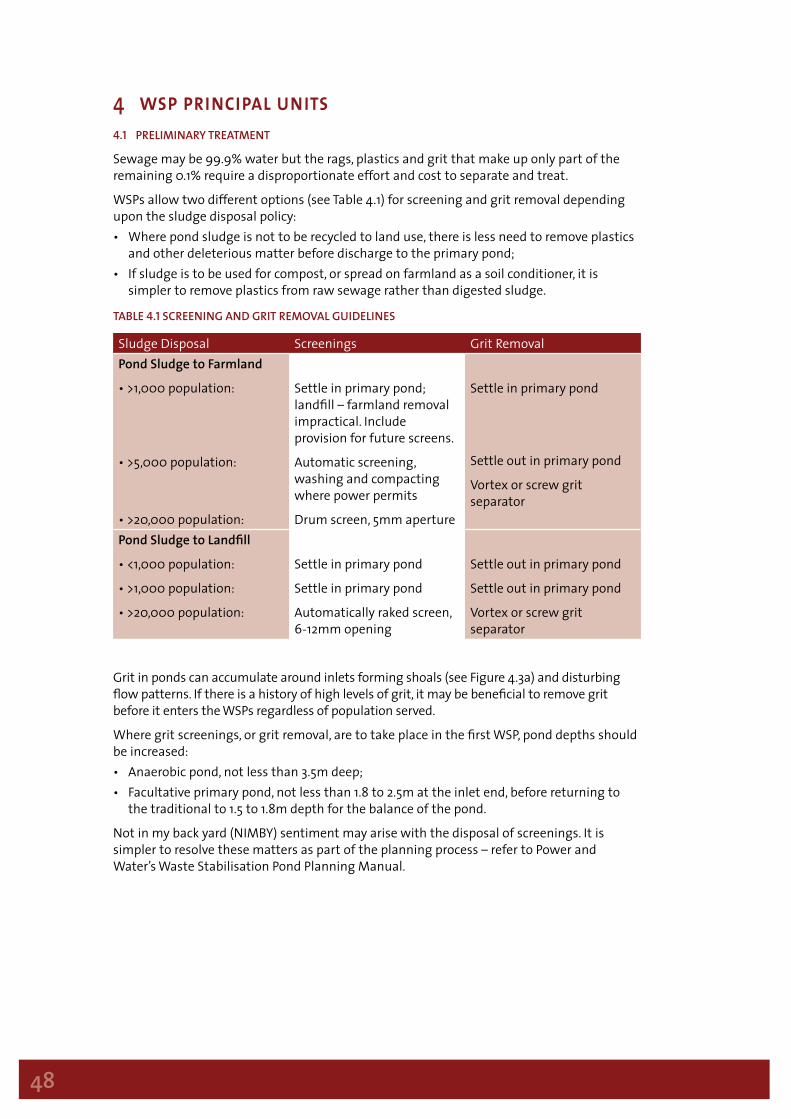
48
4 wsp principal units4.1 Preliminary treatment
Sewage may be 99.9% water but the rags, plastics and grit that make up only part of the remaining 0.1% require a disproportionate effort and cost to separate and treat.
WSPs allow two different options (see Table 4.1) for screening and grit removal depending upon the sludge disposal policy:• Where pond sludge is not to be recycled to land use, there is less need to remove plastics
and other deleterious matter before discharge to the primary pond;• If sludge is to be used for compost, or spread on farmland as a soil conditioner, it is
simpler to remove plastics from raw sewage rather than digested sludge.
taBle 4.1 screening and grit remoVal guidelines
Sludge Disposal Screenings Grit RemovalPond Sludge to Farmland
• >1,000 population:
• >5,000 population:
• >20,000 population:
Settle in primary pond; landfill – farmland removal impractical. Include provision for future screens.
Automatic screening, washing and compacting where power permits
Drum screen, 5mm aperture
Settle in primary pond
Settle out in primary pond
Vortex or screw grit separator
Pond Sludge to Landfill
• <1,000 population:
• >1,000 population:
• >20,000 population:
Settle in primary pond
Settle in primary pond
Automatically raked screen, 6-12mm opening
Settle out in primary pond
Settle out in primary pond
Vortex or screw grit separator
Grit in ponds can accumulate around inlets forming shoals (see Figure 4.3a) and disturbing flow patterns. If there is a history of high levels of grit, it may be beneficial to remove grit before it enters the WSPs regardless of population served.
Where grit screenings, or grit removal, are to take place in the first WSP, pond depths should be increased:• Anaerobic pond, not less than 3.5m deep;• Facultative primary pond, not less than 1.8 to 2.5m at the inlet end, before returning to
the traditional to 1.5 to 1.8m depth for the balance of the pond.
Not in my back yard (NIMBY) sentiment may arise with the disposal of screenings. It is simpler to resolve these matters as part of the planning process – refer to Power and Water’s Waste Stabilisation Pond Planning Manual.
49power and water corporation waste stabilisation pond design manual
Possible screening disposal options are given in the table below.
taBle 4.2 screening disPosal oPtions
Option CommentBuried on site Regulators wish to limit the risk of ground water contamination.
Modern screen equipment employs washing and compaction technology. Hard standing and covered skips are needed to support the operators in undertaking the unpleasant task.
Land fill Not all landfill sites are licensed to receive sewage screenings. The risk of groundwater contamination and treatment of leachate are points to be answered. Washed and compressed screenings are more likely to be accepted.
Incineration Once dried most screenings have sufficient combustible material to be burnt. Unfortunately, basic drum incinerators are not hot enough: dioxins will be given off from the combustion of plastics. Hospital incinerators are regulated and operate at high temperatures to avoid carcinogenic pollution. Negotiating with hospitals to use their incinerators will be easier if screenings are washed and compacted.
Flow monitoring, inlet works design and management of storm flows are discussed in Section 6.
4.2 anaeroBic and FacultatiVe Ponds (Primary Ponds)
Anaerobic ponds are 3m to 5m deep excavations, lined if necessary, where bacteria, without the presence of oxygen, break down organic sewage. Anaerobic ponds are excellent at treating high strength sewage of 30,000mg/L BOD, encountered at offal rendering plants or piggeries. For domestic sewage, they are frequently kept in reserve until WSPs require upgrading for additional capacity. Storm water inflow in the tropical north of Australia, may dilute the raw sewage to prevent anaerobic conditions forming. Actual experience of sewage strengths during the wet months will allow an assessment to be made for using anaerobic ponds. In temperate zones, such as Alice Springs and Tennant Creek, anaerobic ponds will be larger, but BOD reduction will be less in the winter temperatures.
Facultative ponds are, preferably 1.5 to 1.8m deep, but deeper (1.8 to 2.5m) at the inlet end if screenings or grit removal are to take place inside the pond. The top half to one third of the pond supports aerobic bacteria and algae to provide oxygen.
The bottom part of the pond stores grit and organic sludge for slow anaerobic digestion. Facultative ponds are preferred as the primary pond for a new WSP scheme to allow confidence in the actual raw sewage flows and strength to be gained.
Primary anaerobic and facultative ponds in the tropical temperatures can remove some 70% BOD. Anaerobic ponds in the tropics would achieve this by one day’s retention. In comparison, the facultative pond requires six days. In temperate climates, such as Alice Springs, Tennant Creek and Yulara - which might experience sub zero overnight temperatures - the retention times will be longer (see Section 5 for the pond temperature-dependent design equations).
The decision to use anaerobic ponds vs. facultative ponds is generally economically driven. Usually, the use of anaerobic ponds will provide the lowest cost outcome. Mara recommends anaerobic ponds should be used as a default.
However, uncovered anaerobic ponds may have odour issues which may not meet planning criteria.
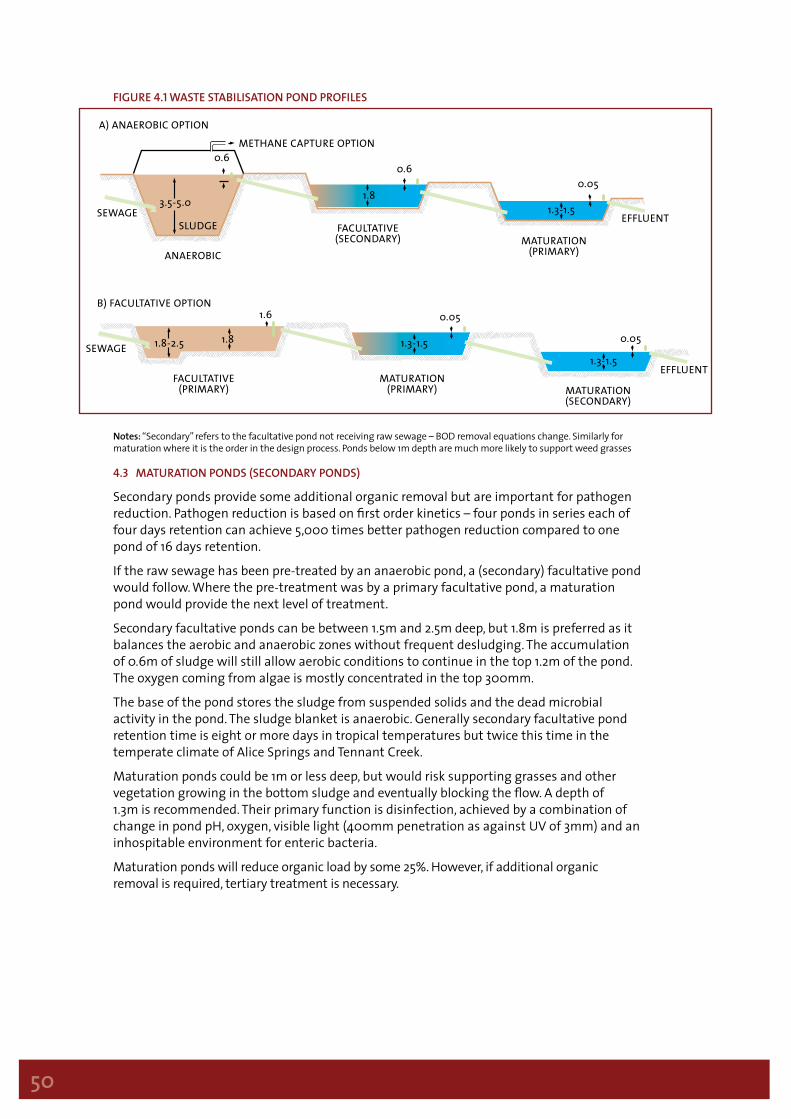
50
Figure 4.1 Waste staBilisation Pond ProFiles
Notes: “Secondary” refers to the facultative pond not receiving raw sewage – BOD removal equations change. Similarly for maturation where it is the order in the design process. Ponds below 1m depth are much more likely to support weed grasses
4.3 maturation Ponds (secondary Ponds)
Secondary ponds provide some additional organic removal but are important for pathogen reduction. Pathogen reduction is based on first order kinetics – four ponds in series each of four days retention can achieve 5,000 times better pathogen reduction compared to one pond of 16 days retention.
If the raw sewage has been pre-treated by an anaerobic pond, a (secondary) facultative pond would follow. Where the pre-treatment was by a primary facultative pond, a maturation pond would provide the next level of treatment.
Secondary facultative ponds can be between 1.5m and 2.5m deep, but 1.8m is preferred as it balances the aerobic and anaerobic zones without frequent desludging. The accumulation of 0.6m of sludge will still allow aerobic conditions to continue in the top 1.2m of the pond. The oxygen coming from algae is mostly concentrated in the top 300mm.
The base of the pond stores the sludge from suspended solids and the dead microbial activity in the pond. The sludge blanket is anaerobic. Generally secondary facultative pond retention time is eight or more days in tropical temperatures but twice this time in the temperate climate of Alice Springs and Tennant Creek.
Maturation ponds could be 1m or less deep, but would risk supporting grasses and other vegetation growing in the bottom sludge and eventually blocking the flow. A depth of 1.3m is recommended. Their primary function is disinfection, achieved by a combination of change in pond pH, oxygen, visible light (400mm penetration as against UV of 3mm) and an inhospitable environment for enteric bacteria.
Maturation ponds will reduce organic load by some 25%. However, if additional organic removal is required, tertiary treatment is necessary.
MATURATION(SECONDARY)
MATURATION(PRIMARY)
MATURATION(PRIMARY)
FACULTATIVE(PRIMARY)
FACULTATIVE(SECONDARY)
ANAEROBIC
SEWAGESLUDGE
SEWAGE 1.8-2.5
3.5-5.0
1.8 1.3-1.5
1.8
1.3-1.5
1.3-1.5
1.6 0.05
0.60.6
0.05
0.05
B) FACULTATIVE OPTION
A) ANAEROBIC OPTION
METHANE CAPTURE OPTION
EFFLUENT
EFFLUENT

51power and water corporation waste stabilisation pond design manual
4.4 tertiary treatment
WSPs can produce a 10:20:12, BOD:SS:NH3 mg/L effluent – pre-filtered to remove algae (reference Section 1.3.1). Inorganic nitrogen (NH3 and NO3
-) of 20mg/L and reactive phosphorus (P2+) of 5mg/L are achieved in the Northern Territory.
Effluent pathogen levels for unrestricted irrigation would be less than 0.1 helminth eggs/L and less than 500 E. coli per 100ml. The World Health Organisation recommends less than 0.1 nematode eggs and a Quantitative Microbial Risk Assessment (QMRA) to determine E. coli per litre to protect field workers less than 15 years of age when standing in effluent being used for irrigation.
For a regulator to accept pre-filtering of the compliance effluent sample to remove algae, designers will need to convince the regulator that consistent effluent quality at the 90% percentile is achievable. This is likely to require compliance with best pond practice using flow mixers, baffle walls, correctly positioned scum boards and storm flows diverted and treated separately. Otherwise, tertiary treatment of the final effluent may be required, or at the very least, the regulator will not accept filtered sampling results.
One of the oldest and simplest tertiary treatments is the grass plot. Recent developments in Australia have used Dissolved Air Flotation (DAF), sand filtration and, finally, reverse osmosis to provide high quality industrial water. Alice Springs WSPs use both DAF and Soil Aquifer Treatment (SAT) using sand filtration, and chlorination prior to aquifer recharge. The chlorination of WSP effluent is not supported as ponds are exceptionally good at pathogen reduction. Tri-Halomethanes (THMs) are formed from chlorination and are now known to be carcinogenic.
The most promising low carbon footprint tertiary treatments for WSP effluent are:• Aerated rock filters to follow the facultative pond. BOD and SS removals above 70%, 40%
for inorganic nitrogen, and E. coli reduction to 100/100ml in the Top End temperatures are likely;
• Slow sand filters, with a schmutzdecke, are likely to achieve similar results to aerated rock filters. If used on an intermittent dosing and rotating basis, algae removal should be practical;
• Sub-surface wetlands (See Figure 4.2), as with rock filters, block the light to algae and are also likely to see nutrient reductions similar to un-aerated rock filters. Often sub-surface wetland performance drops after one or two years;
• Membrane mats (see Figure 4.2) is a recent advancement using vertically suspended curtains and bottom curtain aeration to promote biomass and nutrient reduction.
Figure 4.2 suB-surFace Wetland and aQuamats

52
Duckweed, portioned into cells, is being experimented within the Northern Territory. By creating a thin cover in the final pond, algae are unable to undertake photosynthesis. The algae die and are broken down anaerobically in the base of the pond. However there are significant difficulties of wind breaking up the coverage and the final effluent must be re-aerated prior to discharge to the receiving water.
To support any of these tertiary treatment systems requires confidence from pilot projects. Four of the above schemes have been developed in climates cooler than the Top End, while duckweed trials have been carried out at Humpty Doo and North Lakes. Section 5 provides additional detail on tertiary treatment.
4.5 sludge treatment
It is essential that the proposed methods and cost of treating WSP sewage sludge be considered in the initial designs. If this does not occur the desludging operation, unsurprisingly, may be expensive and possibly hazardous. Unlike conventional treatment works, where sludge treatment and disposal is a daily occurrence, pond desludging may only be once in ten years.
This means that construction of sludge removal services can be staged to coincide with the first de-sludging operation. However, designers must not fail to provide those designs as part of the initial plant design.
Anaerobic ponds can be desludged by constructing a second pond to operate in parallel with the first or by taking out of operation of one pond if two are already operating together. An example of where this has worked well is at the Katherine WSPs (see Figure below) where the one of the two facultative ponds was shut down at the end of the rainy season. After decanting, the sludge was allowed to dry out naturally before removal.
Sludge treatment designs must include allowance for areas for storage and handling of removed sludge, as well as land for associated mechanical and electrical plant and road access. Plant drawings should include layouts showing the sludge processing details.
Figure 4.3a KatHerine FacultatiVe Pond natural sludge drying

53power and water corporation waste stabilisation pond design manual
Figure 4.3B desludging tHe Pond aBoVe at tHe Final moPPing uP stage
The dried sludge is simply removed by a tracked excavator. Using nature to dry the sludge is likely to reduce the whole pond desludging operation cost by 80%.
Process calculations often show that the pond size required in summer is much less than in winter. Thus, by referring to the design calculations, it is often possible that critical maintenance requiring an empty pond (such as sludge removal) can be undertaken during summer as the full plant influent load may be able to be treated by a parallel facultative pond. It is recommended to set up primary ponds in parallel pairs to allow flow diversion for maintenance.
In tropical climates where there is less temperature variation, an economic analysis should be undertaken to determine whether the provision of an extra pond, which can be used while desludging is undertaken in the other ponds, is warranted. Given that costs of dredging ponds while in service is expensive - normally undertaken by contractors coming in remotely with specialised equipment – it can be seen that an extra primary primary or anaerobic pond solely for desludging may be economic.
Additional land is needed, whatever the dual primary pond arrangement, for stockpiling the sludge for a year to ensure helminth eggs have been sufficiently destroyed for the organic matter to be used as a soil conditioner.
Facultative ponds can be desludged whilst operating. A suction barge (see Figure below) traverses the pond and the 2% to 3% solids are pumped ashore. Dewatering and stockpiling the sludge requires bunded space, which must be planned for as part of the design process.
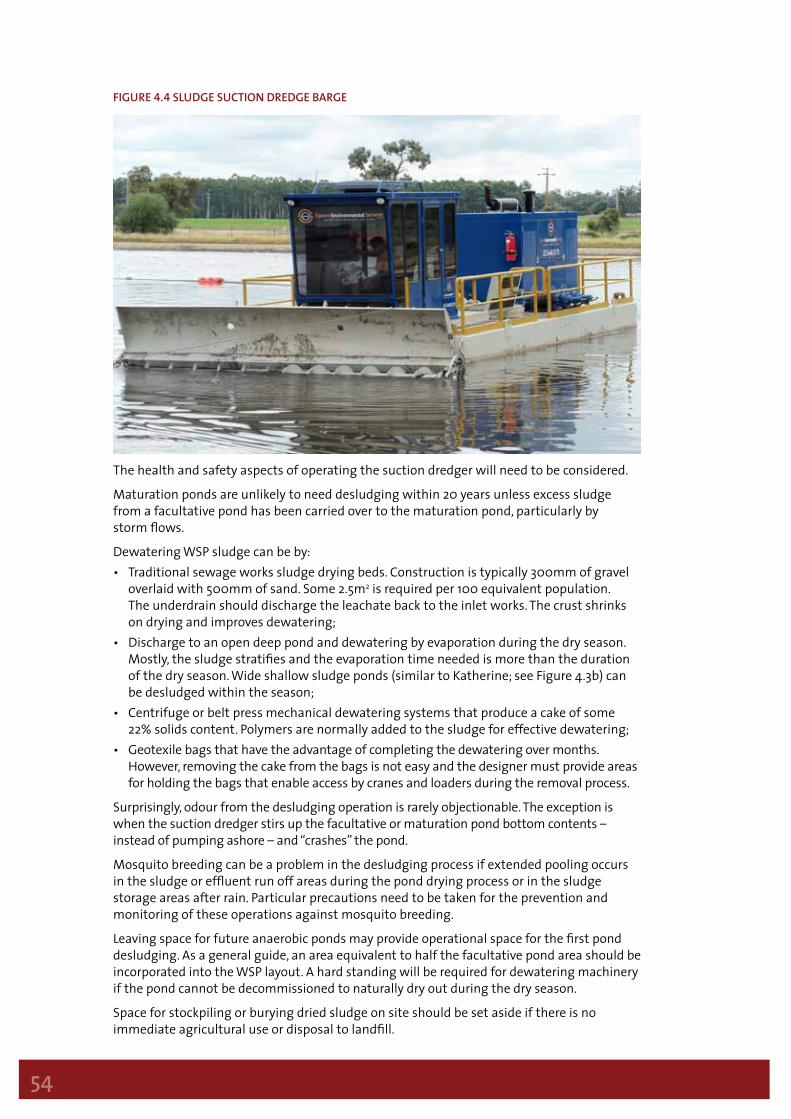
54
Figure 4.4 sludge suction dredge Barge
The health and safety aspects of operating the suction dredger will need to be considered.
Maturation ponds are unlikely to need desludging within 20 years unless excess sludge from a facultative pond has been carried over to the maturation pond, particularly by storm flows.
Dewatering WSP sludge can be by:• Traditional sewage works sludge drying beds. Construction is typically 300mm of gravel
overlaid with 500mm of sand. Some 2.5m2 is required per 100 equivalent population. The underdrain should discharge the leachate back to the inlet works. The crust shrinks on drying and improves dewatering;
• Discharge to an open deep pond and dewatering by evaporation during the dry season. Mostly, the sludge stratifies and the evaporation time needed is more than the duration of the dry season. Wide shallow sludge ponds (similar to Katherine; see Figure 4.3b) can be desludged within the season;
• Centrifuge or belt press mechanical dewatering systems that produce a cake of some 22% solids content. Polymers are normally added to the sludge for effective dewatering;
• Geotexile bags that have the advantage of completing the dewatering over months. However, removing the cake from the bags is not easy and the designer must provide areas for holding the bags that enable access by cranes and loaders during the removal process.
Surprisingly, odour from the desludging operation is rarely objectionable. The exception is when the suction dredger stirs up the facultative or maturation pond bottom contents – instead of pumping ashore – and “crashes” the pond.
Mosquito breeding can be a problem in the desludging process if extended pooling occurs in the sludge or effluent run off areas during the pond drying process or in the sludge storage areas after rain. Particular precautions need to be taken for the prevention and monitoring of these operations against mosquito breeding.
Leaving space for future anaerobic ponds may provide operational space for the first pond desludging. As a general guide, an area equivalent to half the facultative pond area should be incorporated into the WSP layout. A hard standing will be required for dewatering machinery if the pond cannot be decommissioned to naturally dry out during the dry season.
Space for stockpiling or burying dried sludge on site should be set aside if there is no immediate agricultural use or disposal to landfill.

55power and water corporation waste stabilisation pond design manual
Figure 4.5 dried sludge stocKPile
Note: Well screen and sump, in the background, to remove leachate when stockpile completed and rains begin
Depending upon the method of desludging, providing a ramp to allow suction dredgers to be slid in and out of the pond should be considered. The same ramp would be suitable for excavators and lorries if desludged by the natural drying process.
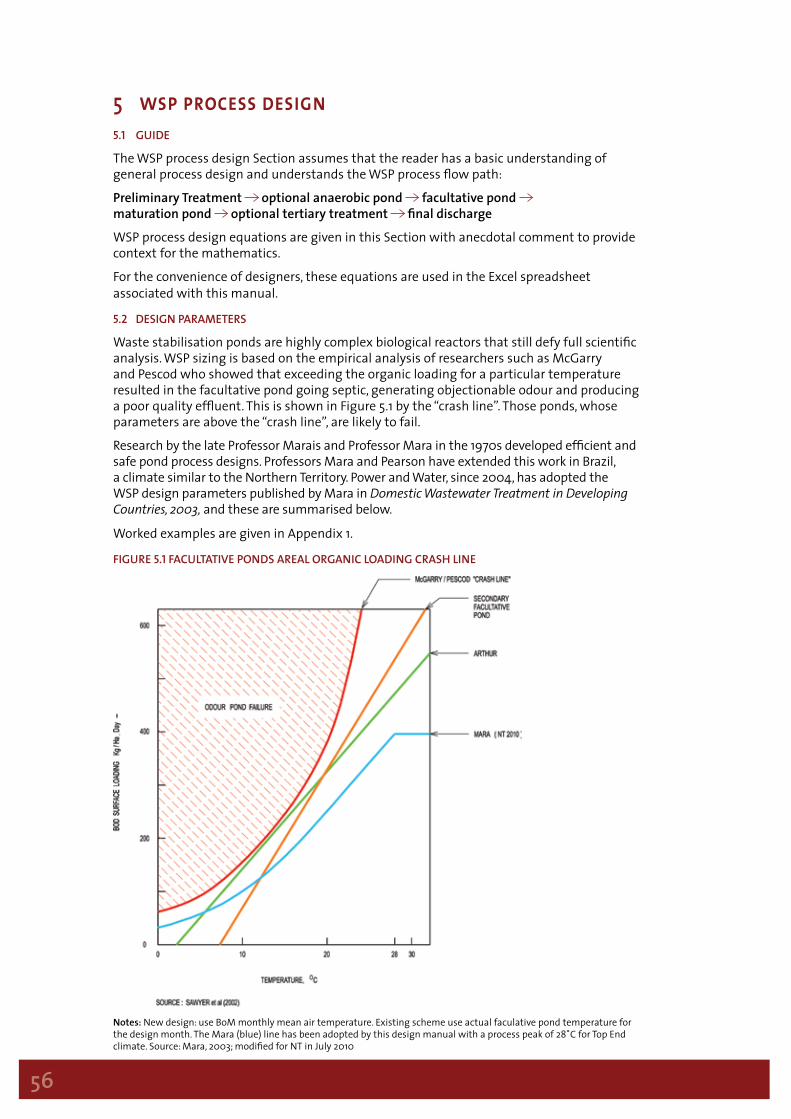
56
5 wsp process design5.1 guide
The WSP process design Section assumes that the reader has a basic understanding of general process design and understands the WSP process flow path:
Preliminary Treatment optional anaerobic pond facultative pond maturation pond optional tertiary treatment final discharge
WSP process design equations are given in this Section with anecdotal comment to provide context for the mathematics.
For the convenience of designers, these equations are used in the Excel spreadsheet associated with this manual.
5.2 design Parameters
Waste stabilisation ponds are highly complex biological reactors that still defy full scientific analysis. WSP sizing is based on the empirical analysis of researchers such as McGarry and Pescod who showed that exceeding the organic loading for a particular temperature resulted in the facultative pond going septic, generating objectionable odour and producing a poor quality effluent. This is shown in Figure 5.1 by the “crash line”. Those ponds, whose parameters are above the “crash line”, are likely to fail.
Research by the late Professor Marais and Professor Mara in the 1970s developed efficient and safe pond process designs. Professors Mara and Pearson have extended this work in Brazil, a climate similar to the Northern Territory. Power and Water, since 2004, has adopted the WSP design parameters published by Mara in Domestic Wastewater Treatment in Developing Countries, 2003, and these are summarised below.
Worked examples are given in Appendix 1.
Figure 5.1 FacultatiVe Ponds areal organic loading crasH line
Notes: New design: use BoM monthly mean air temperature. Existing scheme use actual faculative pond temperature for the design month. The Mara (blue) line has been adopted by this design manual with a process peak of 28˚C for Top End climate. Source: Mara, 2003; modified for NT in July 2010
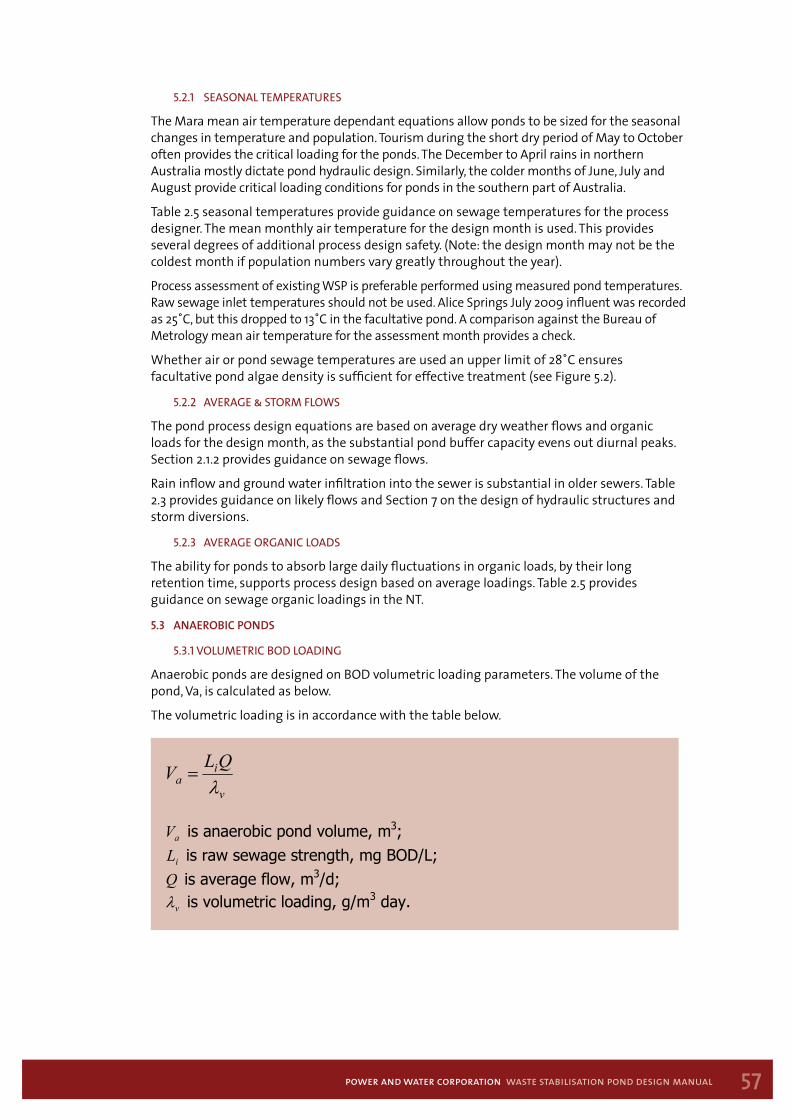
57power and water corporation waste stabilisation pond design manual
5.2.1 SeaSonal temperatureS
The Mara mean air temperature dependant equations allow ponds to be sized for the seasonal changes in temperature and population. Tourism during the short dry period of May to October often provides the critical loading for the ponds. The December to April rains in northern Australia mostly dictate pond hydraulic design. Similarly, the colder months of June, July and August provide critical loading conditions for ponds in the southern part of Australia.
Table 2.5 seasonal temperatures provide guidance on sewage temperatures for the process designer. The mean monthly air temperature for the design month is used. This provides several degrees of additional process design safety. (Note: the design month may not be the coldest month if population numbers vary greatly throughout the year).
Process assessment of existing WSP is preferable performed using measured pond temperatures. Raw sewage inlet temperatures should not be used. Alice Springs July 2009 influent was recorded as 25˚C, but this dropped to 13˚C in the facultative pond. A comparison against the Bureau of Metrology mean air temperature for the assessment month provides a check.
Whether air or pond sewage temperatures are used an upper limit of 28˚C ensures facultative pond algae density is sufficient for effective treatment (see Figure 5.2).
5.2.2 average & Storm flowS
The pond process design equations are based on average dry weather flows and organic loads for the design month, as the substantial pond buffer capacity evens out diurnal peaks. Section 2.1.2 provides guidance on sewage flows.
Rain inflow and ground water infiltration into the sewer is substantial in older sewers. Table 2.3 provides guidance on likely flows and Section 7 on the design of hydraulic structures and storm diversions.
5.2.3 average organIC loadS
The ability for ponds to absorb large daily fluctuations in organic loads, by their long retention time, supports process design based on average loadings. Table 2.5 provides guidance on sewage organic loadings in the NT.
5.3 anaeroBic Ponds
5.3.1 volumetrIC bod loadIng
Anaerobic ponds are designed on BOD volumetric loading parameters. The volume of the pond, Va, is calculated as below.
The volumetric loading is in accordance with the table below.
WASTE STABILISATION POND DESIGN MANUAL DESIGN EQUATIONS
1. Sec 5.3 Anaerobic Ponds
v
ia
QLV
aV is anaerobic pond volume, m3;
iL is raw sewage strength, mg BOD/L; Q is average flow, m3/d;
v is volumetric loading, g/m3 day.
20085.049.0exp41.01100 R R is percentage egg removal, 95percentile; is pond retention time in days. 2. Sec 5.4 Facultative Ponds
s
iQLAf
10
fA is facultative pond mid depth area, m2;
iL is raw sewage strength, mg BOD/L; Q is average flow, m3/d;
s is surface loading, kg BOD/ha day.
fTkLiLe11
Le is the unfiltered effluent strength, mg BOD/L; iL is raw sewage strength, mg BOD/L;
Tk1 is first order rate constant per day;
f is retention time, days.
20)20(1)(1 05.1 T
T kk
For primary facultative pond, 3.0)20(1 k per day
For secondary facultative pond,
D:\Documents and Settings\m2g\Local Settings\Temporary Internet Files\OLK2E\Waste Stabilisation Pond Design Manual Equations 22Nov11.doc
58
taBle 5.1 anaeroBic Volumetric loading
Temperature, ˚C Volumetric loading g BOD/m3 day
BOD removal %
<10 100 4010-20 20T-100 2T+2020-25 10T+100 2T+20
>25 350 70Note: T is temperature in ˚C. Mara uses mean air temperature of the coldest month. For existing ponds, actual pond temperatures may be used. Source: Mara, 2003; 2010.
Worked examples are given in Appendix 1.
5.3.2. helmInth removal
Ayres, 1992, established that nematode egg removal in WSP was related to retention time. The nematode egg removal equation below is the same for anaerobic, facultative and maturation ponds. It has a 95 percentile confidence.
15 days retention is often sufficient to comply with effluent reuse standards of less than 1 egg/L.
5.4 FacultatiVe Ponds
5.4.1 SurfaCe loadIng and bod removal
Facultative ponds are designed on surface BOD loading parameters to correlate with the algae photosynthesis area. The pond area, Af, is calculated as below.
Mid depth area is used for all WSP process calculations. It self cancels surface and bottom areas where embankments are used to build the pond.
WIP: POWER AND WATER:1074786_PW WS Ponds Design Manual:supplied_text:Waste Stabilisation Pond Design Manual Equations 16May11.doc
WASTE STABILISATION POND DESIGN MANUAL DESIGN EQUATIONS
1. Sec 5.3 Anaerobic Ponds
is anaerobic pond volume, m3; is raw sewage strength, mg BOD/L; is average flow, m3/d; is volumetric loading, g/m3 day.
is percentage egg removal, 95percentile; is pond retention time in days.
2. Sec 5.4 Facultative Ponds
is facultative pond mid depth area, m2;
is raw sewage strength, mg BOD/L; is average flow, m3/d; is surface loading, kg BOD/ha day.
is the unfiltered effluent strength, mg BOD/L; is raw sewage strength, mg BOD/L; is first order rate constant per day; is retention time, days.
For primary facultative pond, per day
For secondary facultative pond, per day
WASTE STABILISATION POND DESIGN MANUAL DESIGN EQUATIONS
1. Sec 5.3 Anaerobic Ponds
v
ia
QLV
aV is anaerobic pond volume, m3;
iL is raw sewage strength, mg BOD/L; Q is average flow, m3/d;
v is volumetric loading, g/m3 day.
20085.049.0exp41.01100 R R is percentage egg removal, 95percentile; is pond retention time in days. 2. Sec 5.4 Facultative Ponds
s
iQLAf
10
fA is facultative pond mid depth area, m2;
iL is raw sewage strength, mg BOD/L; Q is average flow, m3/d;
s is surface loading, kg BOD/ha day.
fTkLiLe11
Le is the unfiltered effluent strength, mg BOD/L; iL is raw sewage strength, mg BOD/L;
Tk1 is first order rate constant per day;
f is retention time, days.
20)20(1)(1 05.1 T
T kk
For primary facultative pond, 3.0)20(1 k per day
For secondary facultative pond,
D:\Documents and Settings\m2g\Local Settings\Temporary Internet Files\OLK2E\Waste Stabilisation Pond Design Manual Equations 22Nov11.doc
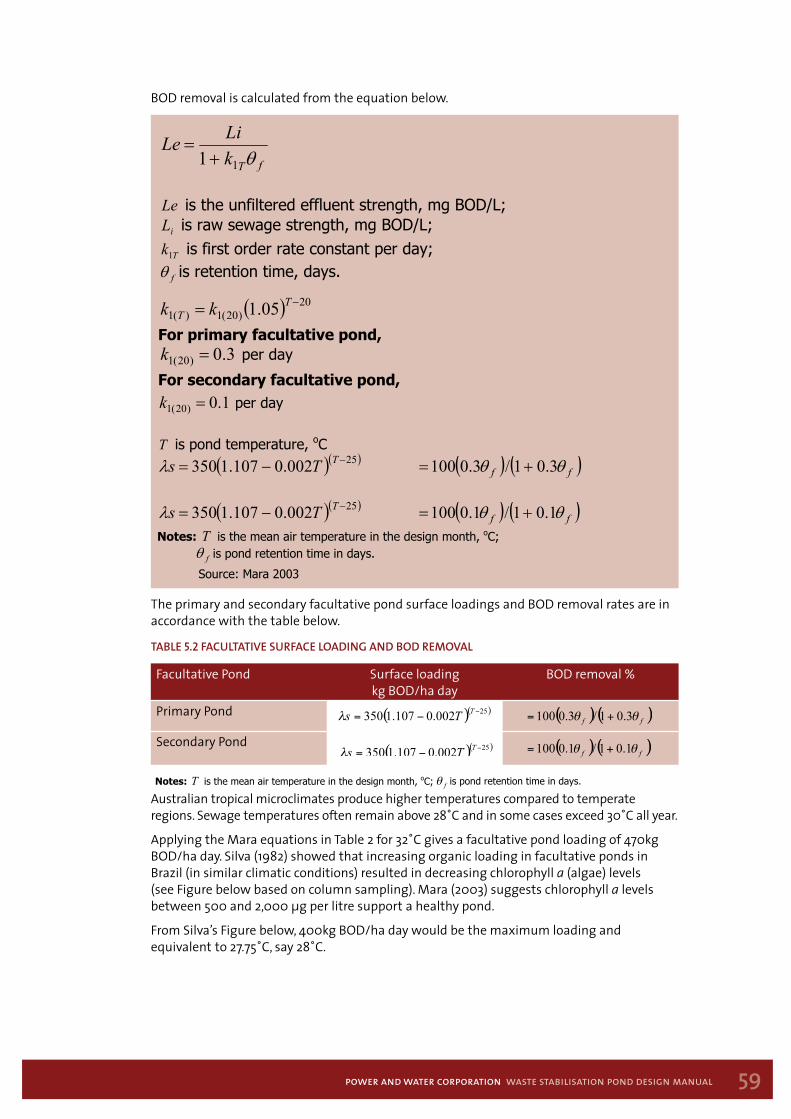
59power and water corporation waste stabilisation pond design manual
BOD removal is calculated from the equation below.
The primary and secondary facultative pond surface loadings and BOD removal rates are in accordance with the table below.
taBle 5.2 FacultatiVe surFace loading and Bod remoVal
Facultative Pond Surface loading kg BOD/ha day
BOD removal %
Primary Pond
WIP: POWER AND WATER:1074786_PW WS Ponds Design Manual:supplied_text:equations:Waste Stabilisation Pond Design Manual Equations 10May11.doc
Notes: is the mean air temperature in the design month, oC; is pond retention time in days.
Source: Mara 2003 ADAM: IN TEXT BELOW IT SHOULD BE “..equations in Table 5.2 for..” NOT TABLE 2
is E coli pond effluent, per 100ml; is E coli pond influent, per 100ml;
is first order constant, per day;
is pond design temperature, oC.
is anaerobic pond retention time, days; is facultative pond retention time, days;
is maturation pond retention time, days; is number of maturation ponds in series.
Secondary Pond
WIP: POWER AND WATER:1074786_PW WS Ponds Design Manual:supplied_text:equations:Waste Stabilisation Pond Design Manual Equations 10May11.doc
Notes: is the mean air temperature in the design month, oC; is pond retention time in days.
Source: Mara 2003 ADAM: IN TEXT BELOW IT SHOULD BE “..equations in Table 5.2 for..” NOT TABLE 2
is E coli pond effluent, per 100ml; is E coli pond influent, per 100ml;
is first order constant, per day;
is pond design temperature, oC.
is anaerobic pond retention time, days; is facultative pond retention time, days;
is maturation pond retention time, days; is number of maturation ponds in series.
Australian tropical microclimates produce higher temperatures compared to temperate regions. Sewage temperatures often remain above 28˚C and in some cases exceed 30˚C all year.
Applying the Mara equations in Table 2 for 32˚C gives a facultative pond loading of 470kg BOD/ha day. Silva (1982) showed that increasing organic loading in facultative ponds in Brazil (in similar climatic conditions) resulted in decreasing chlorophyll a (algae) levels (see Figure below based on column sampling). Mara (2003) suggests chlorophyll a levels between 500 and 2,000 µg per litre support a healthy pond.
From Silva’s Figure below, 400kg BOD/ha day would be the maximum loading and equivalent to 27.75˚C, say 28˚C.
WASTE STABILISATION POND DESIGN MANUAL DESIGN EQUATIONS
1. Sec 5.3 Anaerobic Ponds
v
ia
QLV
aV is anaerobic pond volume, m3;
iL is raw sewage strength, mg BOD/L; Q is average flow, m3/d;
v is volumetric loading, g/m3 day.
20085.049.0exp41.01100 R R is percentage egg removal, 95percentile; is pond retention time in days. 2. Sec 5.4 Facultative Ponds
s
iQLAf
10
fA is facultative pond mid depth area, m2;
iL is raw sewage strength, mg BOD/L; Q is average flow, m3/d;
s is surface loading, kg BOD/ha day.
fTkLiLe11
Le is the unfiltered effluent strength, mg BOD/L; iL is raw sewage strength, mg BOD/L;
Tk1 is first order rate constant per day;
f is retention time, days.
20)20(1)(1 05.1 T
T kk
For primary facultative pond, 3.0)20(1 k per day
For secondary facultative pond,
D:\Documents and Settings\m2g\Local Settings\Temporary Internet Files\OLK2E\Waste Stabilisation Pond Design Manual Equations 22Nov11.doc
D:\Documents and Settings\m2g\Local Settings\Temporary Internet Files\OLK2E\Waste Stabilisation Pond Design Manual Equations 22Nov11.doc
per day
1.01 )20(k
T is pond temperature, oC 25002.0107.1350 TTs ff 3.01/3.0100
25002.0107.1350 TTs ff 1.01/1.0100
Notes: T is the mean air temperature in the design month, oC; f is pond retention time in days.
TEXT BELOW IT SHOULD BE “..equations in Table 5.2 for..” NOT ABLE 2
Source: Mara 2003
DAM: INAT
)(1 TB
ie k
NN
is E coli pond influent, per 100ml;
;
eN is E coli pond effluent, per 100ml;
fN
20( 19.16.2 TTBk )
)(T is first order constant, per dayBkT is pond design temperature, oC.
nmTBfTBaTB )()()(
ie kkk
NN 111
a is anaerobic pond retention time, days;
f is facultative pond retention time, days;
m is maturation pond retention time, days; n is number of maturation ponds in series.
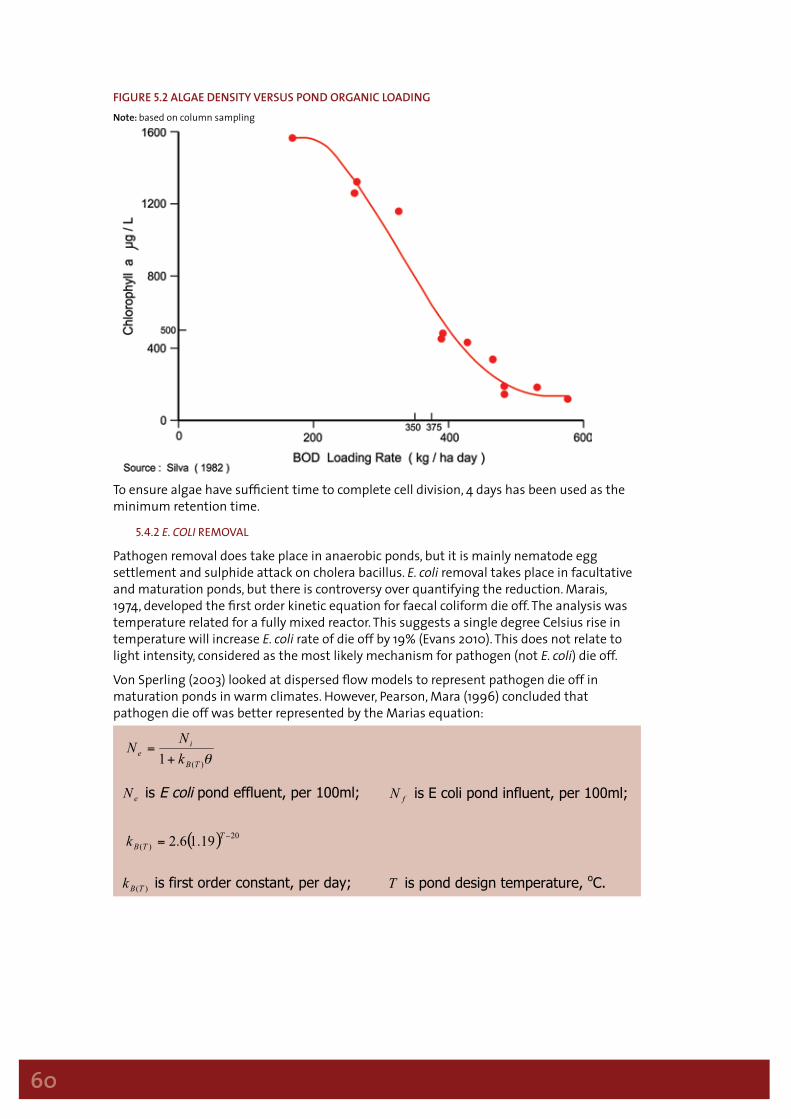
60
Figure 5.2 algae density Versus Pond organic loadingNote: based on column sampling
To ensure algae have sufficient time to complete cell division, 4 days has been used as the minimum retention time.
5.4.2 E. coli removal
Pathogen removal does take place in anaerobic ponds, but it is mainly nematode egg settlement and sulphide attack on cholera bacillus. E. coli removal takes place in facultative and maturation ponds, but there is controversy over quantifying the reduction. Marais, 1974, developed the first order kinetic equation for faecal coliform die off. The analysis was temperature related for a fully mixed reactor. This suggests a single degree Celsius rise in temperature will increase E. coli rate of die off by 19% (Evans 2010). This does not relate to light intensity, considered as the most likely mechanism for pathogen (not E. coli) die off.
Von Sperling (2003) looked at dispersed flow models to represent pathogen die off in maturation ponds in warm climates. However, Pearson, Mara (1996) concluded that pathogen die off was better represented by the Marias equation:
WIP: POWER AND WATER:1074786_PW WS Ponds Design Manual:supplied_text:equations:Waste Stabilisation Pond Design Manual Equations 10May11.doc
Notes: is the mean air temperature in the design month, oC; is pond retention time in days.
Source: Mara 2003 ADAM: IN TEXT BELOW IT SHOULD BE “..equations in Table 5.2 for..” NOT TABLE 2
is E coli pond effluent, per 100ml; is E coli pond influent, per 100ml;
is first order constant, per day;
is pond design temperature, oC.
is anaerobic pond retention time, days; is facultative pond retention time, days;
is maturation pond retention time, days; is number of maturation ponds in series.
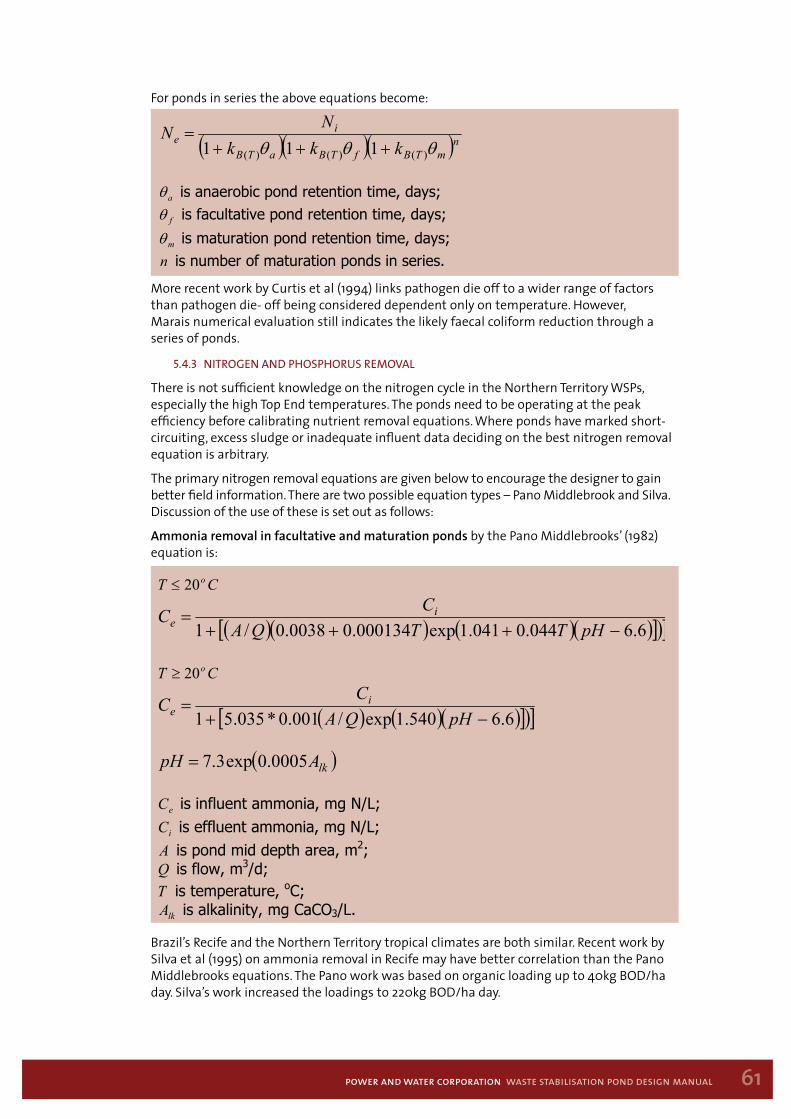
61power and water corporation waste stabilisation pond design manual
For ponds in series the above equations become:
More recent work by Curtis et al (1994) links pathogen die off to a wider range of factors than pathogen die- off being considered dependent only on temperature. However, Marais numerical evaluation still indicates the likely faecal coliform reduction through a series of ponds.
5.4.3 nItrogen and phoSphoruS removal
There is not sufficient knowledge on the nitrogen cycle in the Northern Territory WSPs, especially the high Top End temperatures. The ponds need to be operating at the peak efficiency before calibrating nutrient removal equations. Where ponds have marked short-circuiting, excess sludge or inadequate influent data deciding on the best nitrogen removal equation is arbitrary.
The primary nitrogen removal equations are given below to encourage the designer to gain better field information. There are two possible equation types – Pano Middlebrook and Silva. Discussion of the use of these is set out as follows:
Ammonia removal in facultative and maturation ponds by the Pano Middlebrooks’ (1982) equation is:
Brazil’s Recife and the Northern Territory tropical climates are both similar. Recent work by Silva et al (1995) on ammonia removal in Recife may have better correlation than the Pano Middlebrooks equations. The Pano work was based on organic loading up to 40kg BOD/ha day. Silva’s work increased the loadings to 220kg BOD/ha day.
D:\Documents and Settings\m2g\Local Settings\Temporary Internet Files\OLK2E\Waste Stabilisation Pond Design Manual Equations 22Nov11.doc
per day
1.01 )20(k
T is pond temperature, oC 25002.0107.1350 TTs ff 3.01/3.0100
25002.0107.1350 TTs ff 1.01/1.0100
Notes: T is the mean air temperature in the design month, oC; f is pond retention time in days.
TEXT BELOW IT SHOULD BE “..equations in Table 5.2 for..” NOT ABLE 2
Source: Mara 2003
DAM: INAT
)(1 TB
ie k
NN
is E coli pond influent, per 100ml;
;
eN is E coli pond effluent, per 100ml;
fN
20( 19.16.2 TTBk )
)(T is first order constant, per dayBkT is pond design temperature, oC.
nmTBfTBaTB )()()(
ie kkk
NN 111
a is anaerobic pond retention time, days;
f is facultative pond retention time, days;
m is maturation pond retention time, days; n is number of maturation ponds in series.
D:\Documents and Settings\m2g\Local Settings\Temporary Internet Files\OLK2E\Waste Stabilisation Pond Design Manual Equations 22Nov11.doc
CT o20
6.6044.0041.1exp000134.00038.0/1
pHTTQACC i
e
CT o20
6.6540.1exp/001.0*035.51
pHQACC i
e
lkApH 0005.0exp3.7
eC is influent ammonia, mg N/L;
i is effluent ammonia, mg N/L;CA is pond mid depth area, m2; Q is flow, m3/d; T is temperature, oC; lkA is alkalinity, mg CaCO3/L.
6.6727.1exp/001.0*65.81
pHQACC i
c
sampled from the middle of the pond, mg N/L and includes
lgal nitrogen.
cC is ammonia a
6.66.60039.10064.0exp 20 pHC Tie C
is pond retention time in days
is g N/L;
is the TKN loading, kg N/ha day.
063.0/19.0 TKNs
1cCcC the pond column sample as TKN, mTKNs
62
The Pano Middlebrooks equations may be better suited for the southern temperate and arid zone winter temperatures, while the Silva equations are more suited to the tropics.
Ammonia removal in facultative and maturation ponds by the Silva equation:
It is suggested that for ammonia removal, including algal nitrogen:• Below 20˚C, use the Pano Middlebrooks equation;• Above 20˚C, use the Silva equation.
This division has been used in the pond software program.
Total nitrogen removal in facultative and maturation ponds by Reed’s (1985) equation is:
Total Kjeldahl nitrogen (TKN) removal in facultative and maturation ponds was predicted by Silva (1995) using the following equation:
Inorganic nitrogen (ammonia + nitrate + nitrite) discharge to freshwater is the main eutrophication risk. Inorganic nitrogen is some 80% of the final effluent total nitrogen.
Methods to reduce nitrogen levels, such as aerated rock filters, are discussed in Section 5.7 and Section 5.7.3. Where possible nitrogen should remain “locked up” in algae to use it beneficially as an agriculture slow-release fertiliser.
Phosphorus removal in facultative and maturation ponds is mainly by precipitation at pH greater than 9. Phosphorus reduction is unlikely to be more than 50% unless coagulants such as aluminium sulphate or ferric chloride etc are added. However, this then leads to increased sludge volumes, the metal salts constituents of which are hard to dewater.
Worked examples are given in Appendix 1.
5.5 maturation Ponds
Maturation ponds’ sole function is pathogen removal. Viruses and bacteria do settle and are held by the sludge. Sunlight penetration to the first 50mm of the pond surface will kill both bacteria and viruses. But the full mechanism is still unclear.
The three main design parameters are:• The first maturation pond surface loading (BOD/ha day) to be no more than 70% of the
facultative pond surface loading;• The second and subsequent maturation ponds surface loading to be less than the first
maturation pond;• The minimum pond retention time is 3 days.• The maximum number of maturation ponds is 2 to reduce cyanobacterial prevalence at
low organic loading.
D:\Documents and Settings\m2g\Local Settings\Temporary Internet Files\OLK2E\Waste Stabilisation Pond Design Manual Equations 22Nov11.doc
CT o20
6.6044.0041.1exp000134.00038.0/1
pHTTQACC i
e
CT o20
6.6540.1exp/001.0*035.51
pHQACC i
e
lkApH 0005.0exp3.7
eC is influent ammonia, mg N/L;
i is effluent ammonia, mg N/L;CA is pond mid depth area, m2; Q is flow, m3/d; T is temperature, oC; lkA is alkalinity, mg CaCO3/L.
6.6727.1exp/001.0*65.81
pHQACC i
c
sampled from the middle of the pond, mg N/L and includes
lgal nitrogen.
cC is ammonia a
6.66.60039.10064.0exp 20 pHC Tie C
is pond retention time in days
is g N/L;
is the TKN loading, kg N/ha day.
063.0/19.0 TKNs
1cCcC the pond column sample as TKN, mTKNs
63power and water corporation waste stabilisation pond design manual
The calculations for pathogen, nitrogen and phosphorus reductions in maturation ponds are given in the previous Sections.
BOD removal in each maturation pond is taken as a nominal 25%. However, in secondary maturation ponds BOD is probably mostly attributable to the production of new micro-organisms and their own life cycle (Evans, 2010).
Worked examples of maturation pond design are given in Appendix 1.
5.6 sludge Production
Sludge accumulation in ponds is between 0.01 and 0.04m3/person year. It is mostly grit and sand that traps organic matter as it settles. More important is the sludge from algae in the last part of their life cycle. By drawing off effluent below 600mm from facultative pond surface, most algae are kept back in the pond to die, settle and over a long time to break down to add to organic and nitrogen loadings. Unlike activated sludge, sludge digestion takes place over several years, considerably reducing the organic content.
5.7 tertiary treatment
5.7.1 general
Tertiary treatment is additional treatment given to maturation pond effluent. Usually it is undertaken to improve a particular characteristic that will fail the discharge licence conditions or reuse standard - for instance ammonia levels that would cause toxicity to the receiving water invertebrate fauna.
The Northern Territory regulator does not permit the final pond effluent to be filtered before it is analysed for compliance. As algae contain 70% or more of the total BOD and nutrients, algae reduction will help to meet compliance. The high Northern Territory temperatures and low organic loading (Lawty, 1996) encourage cyanobacteria in the final ponds. Pond ecology, through mixing (see Section 6.3), should be changed to encourage green bacteria to dominate. Some parameters that may then provide a direction for reduction in algae in the final effluent are:• The diurnal variation in algae, as measured by chlorophyll a levels. The Figure below
shows the surface diurnal variations for a facultative pond effluent in northeast Brazil. On completing photosynthesis for the day, respiring algae tend to move lower in the pond, allowing “cleaner” effluent to discharge. Maturation ponds are likely to have diurnal algal level variations no greater than two to three times. The drop in algal levels may see E. coli rise. There will also be an increase in pond sludge from dead algae. If tests are satisfactory, discharging surface effluent between late afternoon and sun rise may be all that is necessary to meet the required discharge license levels;
• Algae give off carbon dioxide at night as part of their respiration. The carbon dioxide is mostly stored in the pond water and used the following day in building new algae cells. Mixing the ponds at night will reduce the carbon dioxide and lower the algae level in the final effluent;
• Algae grazers, such as rotifers, Daphnia, Branchionus spp, and certain species of fish, will reduce algae to help meet compliance. Maintaining viable rotifer populations or finding an indigenous fish species that will do this may not be possible;
• Intermittent sand and aerated rock filters (see Sections 5.7.3 and 5.7.4) are well tested and simpler to operate and maintain.
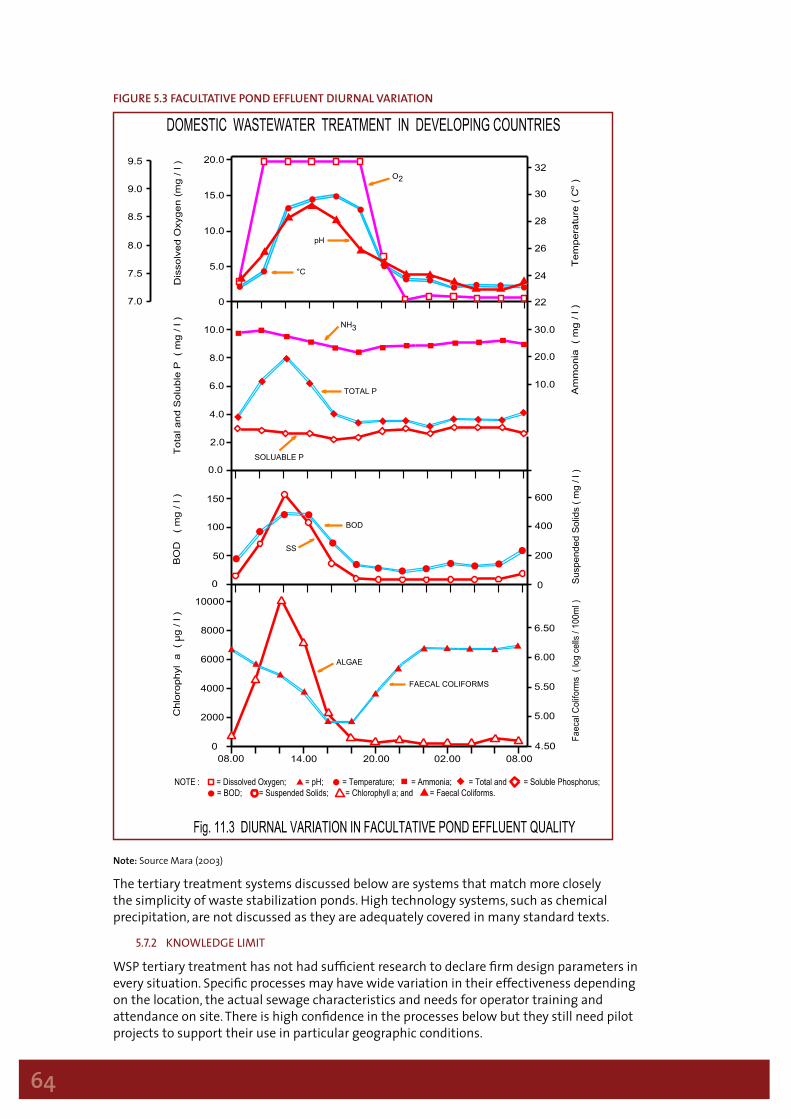
64
Figure 5.3 FacultatiVe Pond eFFluent diurnal Variation
Note: Source Mara (2003)
The tertiary treatment systems discussed below are systems that match more closely the simplicity of waste stabilization ponds. High technology systems, such as chemical precipitation, are not discussed as they are adequately covered in many standard texts.
5.7.2 knowledge lImIt
WSP tertiary treatment has not had sufficient research to declare firm design parameters in every situation. Specific processes may have wide variation in their effectiveness depending on the location, the actual sewage characteristics and needs for operator training and attendance on site. There is high confidence in the processes below but they still need pilot projects to support their use in particular geographic conditions.
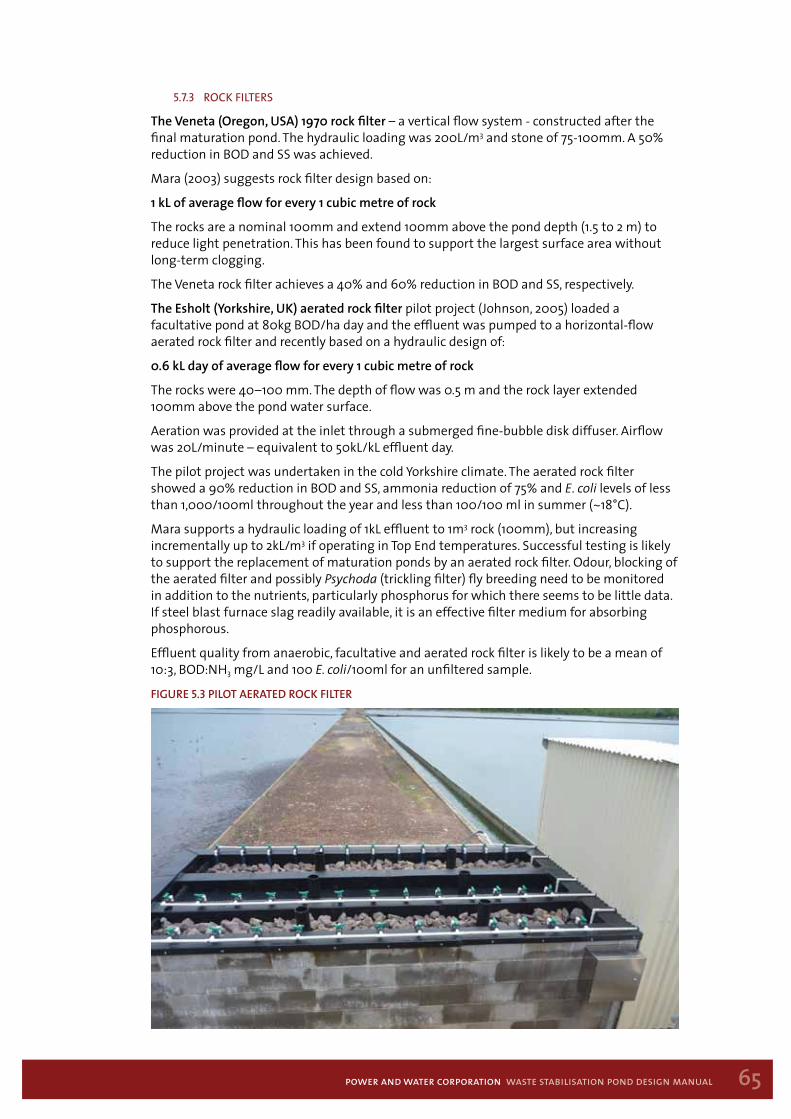
65power and water corporation waste stabilisation pond design manual
5.7.3 roCk fIlterS
The Veneta (Oregon, USA) 1970 rock filter – a vertical flow system - constructed after the final maturation pond. The hydraulic loading was 200L/m3 and stone of 75-100mm. A 50% reduction in BOD and SS was achieved.
Mara (2003) suggests rock filter design based on:
1 kL of average flow for every 1 cubic metre of rock
The rocks are a nominal 100mm and extend 100mm above the pond depth (1.5 to 2 m) to reduce light penetration. This has been found to support the largest surface area without long-term clogging.
The Veneta rock filter achieves a 40% and 60% reduction in BOD and SS, respectively.
The Esholt (Yorkshire, UK) aerated rock filter pilot project (Johnson, 2005) loaded a facultative pond at 80kg BOD/ha day and the effluent was pumped to a horizontal-flow aerated rock filter and recently based on a hydraulic design of:
0.6 kL day of average flow for every 1 cubic metre of rock
The rocks were 40–100 mm. The depth of flow was 0.5 m and the rock layer extended 100mm above the pond water surface.
Aeration was provided at the inlet through a submerged fine-bubble disk diffuser. Airflow was 20L/minute – equivalent to 50kL/kL effluent day.
The pilot project was undertaken in the cold Yorkshire climate. The aerated rock filter showed a 90% reduction in BOD and SS, ammonia reduction of 75% and E. coli levels of less than 1,000/100ml throughout the year and less than 100/100 ml in summer (~18°C).
Mara supports a hydraulic loading of 1kL effluent to 1m3 rock (100mm), but increasing incrementally up to 2kL/m3 if operating in Top End temperatures. Successful testing is likely to support the replacement of maturation ponds by an aerated rock filter. Odour, blocking of the aerated filter and possibly Psychoda (trickling filter) fly breeding need to be monitored in addition to the nutrients, particularly phosphorus for which there seems to be little data. If steel blast furnace slag readily available, it is an effective filter medium for absorbing phosphorous.
Effluent quality from anaerobic, facultative and aerated rock filter is likely to be a mean of 10:3, BOD:NH3 mg/L and 100 E. coli/100ml for an unfiltered sample.
Figure 5.3 Pilot aerated rocK Filter
66
5.7.4 Slow Sand fIlterS and varIantS
Small pond schemes in New Zealand have operated intermittent sand filters, using spray irrigation. The micro-organisms in the top band of the “slow sand filter” form a schmutzdecke and are able to remove algae without rapid clogging.
Work by Torrens (2009) in France on reducing algae in final pond effluent recommended the intermittent slow sand filter loading rate of:
0.8kL effluent per m2 day
The filter grading is based on 10% of the sand passing through a 0.25mm mesh (d10) (Torrens, 2009). Filter depths of:• 0.65m gave reductions in BOD:SS:NH4, 85%, 75%, 90%;• 0.25m the reductions were BOD:SS:NH4, 75%, 60%, 80%.
Two filters are provided for alternating wet and dry operation:• Filter is operated for 3.5 days continuously;• Filter is then rested for 7 days.
This allows the surface to dry out. It also is essential to ensure that mosquitoes do not breed in the pools that inevitably form on the surface of such filters. If the filters are allowed to dry out within the breeding cycle of the particular insect, eggs, which rely on water, desiccate and the breeding cycle is disrupted.
The alternating wetting and drying of the surface also means that there are both aerobic and anaerobic processes at work in the beds. These processes are quite separate from the physical filtering of the sand bed. Effectively, this is a soil aquifer treatment process where the soil is an artificially placed sand bed.
A small tractor periodically tills the beds and, occasionally, dried algae are removed. Column and pilot trials are essential as the bed performances vary significantly with sand grading and effluent loading.
5.7.5 wetlandS
Sub-surface wetlands have similar characteristics to rock filters. Planted sub-surface wetlands have been shown to have no advantage over unplanted for reduction in BOD (Tanner, 2001).
Sub-surface wetlands are designed on BOD removal:
D:\Documents and Settings\m2g\Local Settings\Temporary Internet Files\OLK2E\Waste Stabilisation Pond Design Manual Equations 22Nov11.doc
. Sec 5.7.5 Wetlands
3
QDA
QV w
cwcw *
i ;
m3; s the retention time in days
cwV is the gravel volume,
cwA is the bed area, m2;
w is the bed depth, m; D is gravel bed porosity, 0.4 for 25mm gravel;
is flow, m3/day. Q
cwicwcwie eAQDAkL 001.02/21expL
is net evaporation, mm/day
eL is effluent BOD, mg/L;
i is influent BOD, mg/L; Le
20172.41 06.16.68 T k
is 0.4; T is temperature, oC.
AHLRSSS ie 11.0106.0S
is ; eSS is effluent suspended solids, mg/L;
iSS influent suspended solids, mg/LAHLR is the aerial hydraulic loading cwAQ / m/day.
/L;
20008.1126.0exp Tie C C
eC is effluent ammonia, mg N/L;
i is influent ammonia, mg NC is retention time in days; T is temperature, oC.
67power and water corporation waste stabilisation pond design manual
The BOD effluent quality is calculated from:
Suspended solids removal is calculated from:
Ammonia removal is calculated from:
In considering the use of wetlands, their long term performance should be assessed against rock and aerated rock filters and intermittent sand filters. Wetlands initial discharge quality is not always maintained.
D:\Documents and Settings\m2g\Local Settings\Temporary Internet Files\OLK2E\Waste Stabilisation Pond Design Manual Equations 22Nov11.doc
. Sec 5.7.5 Wetlands
3
QDA
QV w
cwcw *
i ;
m3; s the retention time in days
cwV is the gravel volume,
cwA is the bed area, m2;
w is the bed depth, m; D is gravel bed porosity, 0.4 for 25mm gravel;
is flow, m3/day. Q
cwicwcwie eAQDAkL 001.02/21expL
is net evaporation, mm/day
eL is effluent BOD, mg/L;
i is influent BOD, mg/L; Le
20172.41 06.16.68 T k
is 0.4; T is temperature, oC.
AHLRSSS ie 11.0106.0S
is ; eSS is effluent suspended solids, mg/L;
iSS influent suspended solids, mg/LAHLR is the aerial hydraulic loading cwAQ / m/day.
/L;
20008.1126.0exp Tie C C
eC is effluent ammonia, mg N/L;
i is influent ammonia, mg NC is retention time in days; T is temperature, oC.

68
5.7.6 retrofIttIng of exIStIng pondS wIth proprIetary produCtS
It is sometimes possible to retrofit existing ponds with proprietary products that provide an increase in treatment capacity for both carbonaceous and nutrient reduction.
One example is the SolarBee (see also http://www.pondmill.com/en/products_electric.html) mixer that provides vertical mixing by bringing effluent up from the bottom. The nutrients released provide additional algal growth. The vertical mixer does not need to be solar powered. Mains electricity is more economic over the life of the asset.
A second example is membrane mats (AquaMats), which are a medium woven cloth that supports suspended growth (see Figure below). They have been used in America and New Zealand.
The media curtains are suspended by cable across facultative or a maturation pond in a similar fashion to lanes in a swimming pool. The “pressure differential piping” is laid on bed of the pond.
Figure 5.4 memBrane mats
Source: Meridian Aquatic Technology
BOD and SS reduction is reported as an 80% improvement. Nutrient levels can be as low as 2:3, Nitrogen:Phosphorus mg/L, but depend upon pre-treatment.
Another example of the use of proprietary products is duckweed in final ponds to remove nutrients and block sun light from algae. However with aquatic plant treatment, particular attention is required to achieve complete coverage of the surface by plants and the treatment areas are monitored for mosquito breeding. It is not clear if pathogen reduction is adversely affected by blocking sunlight.
There are various proprietary products in the market that can be retro-fitted to existing ponds to provide improvements in the various effluent parameters. Thus, designers should be aware of these products and consider the following:• Pilot work should be undertaken to ensure that the process works effectively in the pond
system under consideration:• How well does the process work under the varying temperatures and winds prevailing?• How well does the process work under varying loads both hydraulic and quality? • What are the cost implications of a proprietary system? Are there on-going licence
fees, or are they built into the capital cost? Is there a lock-in for ongoing technical and maintenance support?
• Are there operating plants with similar climate and influent characteristics that can be referred to or visited to confirm operating experience?
• Are there associated issues such as noise, odour or extra energy costs to take into account?
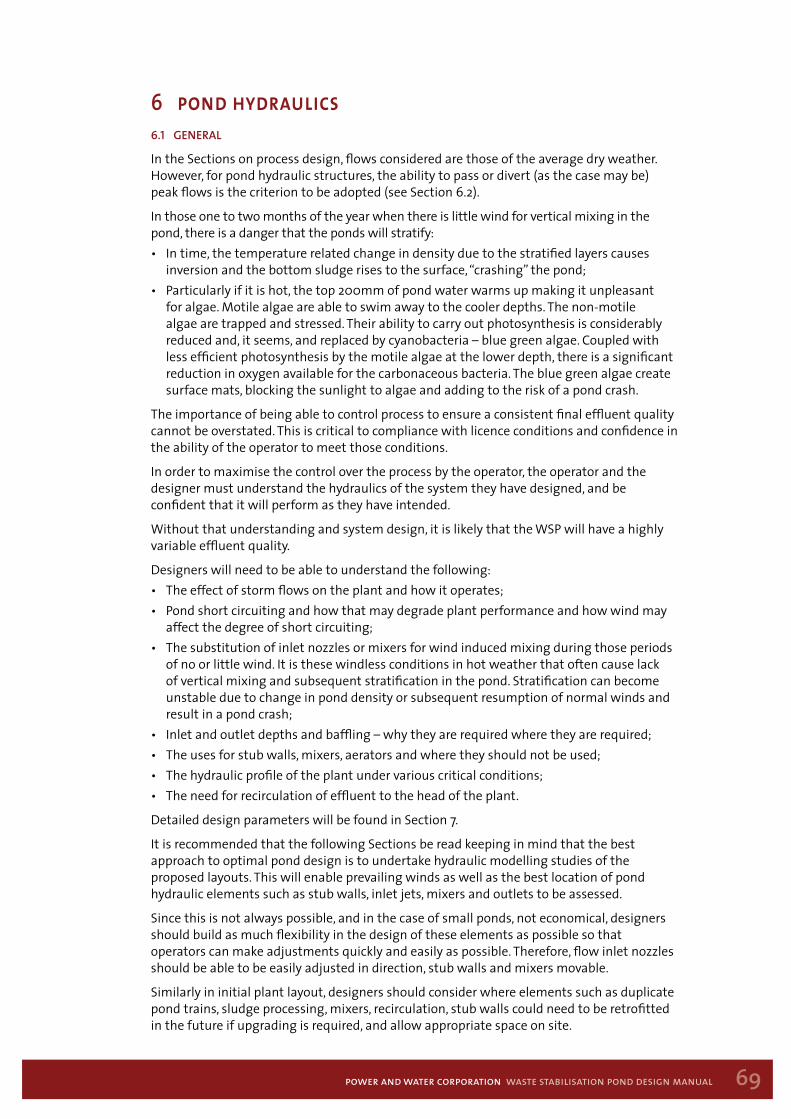
69power and water corporation waste stabilisation pond design manual
6 pond hydraulics6.1 general
In the Sections on process design, flows considered are those of the average dry weather. However, for pond hydraulic structures, the ability to pass or divert (as the case may be) peak flows is the criterion to be adopted (see Section 6.2).
In those one to two months of the year when there is little wind for vertical mixing in the pond, there is a danger that the ponds will stratify:• In time, the temperature related change in density due to the stratified layers causes
inversion and the bottom sludge rises to the surface, “crashing” the pond;• Particularly if it is hot, the top 200mm of pond water warms up making it unpleasant
for algae. Motile algae are able to swim away to the cooler depths. The non-motile algae are trapped and stressed. Their ability to carry out photosynthesis is considerably reduced and, it seems, and replaced by cyanobacteria – blue green algae. Coupled with less efficient photosynthesis by the motile algae at the lower depth, there is a significant reduction in oxygen available for the carbonaceous bacteria. The blue green algae create surface mats, blocking the sunlight to algae and adding to the risk of a pond crash.
The importance of being able to control process to ensure a consistent final effluent quality cannot be overstated. This is critical to compliance with licence conditions and confidence in the ability of the operator to meet those conditions.
In order to maximise the control over the process by the operator, the operator and the designer must understand the hydraulics of the system they have designed, and be confident that it will perform as they have intended.
Without that understanding and system design, it is likely that the WSP will have a highly variable effluent quality.
Designers will need to be able to understand the following:• The effect of storm flows on the plant and how it operates;• Pond short circuiting and how that may degrade plant performance and how wind may
affect the degree of short circuiting;• The substitution of inlet nozzles or mixers for wind induced mixing during those periods
of no or little wind. It is these windless conditions in hot weather that often cause lack of vertical mixing and subsequent stratification in the pond. Stratification can become unstable due to change in pond density or subsequent resumption of normal winds and result in a pond crash;
• Inlet and outlet depths and baffling – why they are required where they are required;• The uses for stub walls, mixers, aerators and where they should not be used;• The hydraulic profile of the plant under various critical conditions;• The need for recirculation of effluent to the head of the plant.
Detailed design parameters will be found in Section 7.
It is recommended that the following Sections be read keeping in mind that the best approach to optimal pond design is to undertake hydraulic modelling studies of the proposed layouts. This will enable prevailing winds as well as the best location of pond hydraulic elements such as stub walls, inlet jets, mixers and outlets to be assessed.
Since this is not always possible, and in the case of small ponds, not economical, designers should build as much flexibility in the design of these elements as possible so that operators can make adjustments quickly and easily as possible. Therefore, flow inlet nozzles should be able to be easily adjusted in direction, stub walls and mixers movable.
Similarly in initial plant layout, designers should consider where elements such as duplicate pond trains, sludge processing, mixers, recirculation, stub walls could need to be retrofitted in the future if upgrading is required, and allow appropriate space on site.

70
6.2 inlet WorKs and storm FloWs
The hydraulic design of the inlet works is to take account of diurnal variation of dry weather flows as well as storm flows.
Storm flows do wash out the biomass in ponds which supports the case for bypassing excess flows at the inlet works. Heavily diluted sewage and dilution from the rainfall direct onto the pond – 300mm in 24 hours - does not have the same risk to public health, or the environment, as raw sewage. Wash out of pond organic matter and over topping hydraulic structures, with possible embankment failure, pose unnecessary risks in comparison to the health and environmental benefits of trying to contain very dilute storm flows.
To divert storm flows direct to a storm tank of two hours minimum retention and then to the receiving water could be considered. However, designers should check that this is allowed within the licence or proposed licensing arrangements.
Regulators already require flow recording of the effluent discharge. Recording the raw sewage flow entering the WSPs provides help in resolving operational problems and the basis of future designs for upgrading or expansion.
The Figure below shows a typical arrangement for a storm bypass.
Figure 6.1 storm oVerFloW emBanKment sPillWays BetWeen tWo Ponds
The diurnal dry weather sewage flow entering the works is related to population and may be based on the equation below:
Power and Water Corporation Peak Wet Weather Flow =
Northern Australia has extremes in sewer flows. Flows can exceed twenty times the average dry weather flow during a tropical storm. Where flows are pumped to the sewage works, pumping station capacity is usually limited to 8ADWF in the Southern Region and 4ADWF for Darwin’s Leanyer and Sanderson WSPs. To cover for site specific peak storm flows, PWC should be consulted before undertaking the detailed hydraulic design.
Table 4.1 makes recommendations on screening raw sewage in relation to population served. Drum screens of 5mm or less do remove most cotton bud tips. Macerators have a poor reputation for reliability, frequently suffering from “stringing” problems when cutting rags. Munchers too can have difficulty with rags and sanitary towels, but are more reliable than comminutors. Removing screenings from the raw sewage reduces the level of scum development on the facultative pond. It also assists in compliance of sludge reuse, where farmers reject plastic contaminated sludge. The Figure below shows the position of screens, grit removal and bypass channels as recommended in Section 4.1.
D:\Documents and Settings\m2g\Local Settings\Temporary Internet Files\OLK2E\Waste Stabilisation Pond Design Manual Equations 22Nov11.doc
4. Sec 6.2 Inlet Works and Storm Flows
5.0
55.0 EP33074.1
PF
EP is equivalent population; PF is 3.8 for 10,000 population.
5. Sec 6.4 Pond Inlets
AVw
35.0 P1
1P is power in watts;
w is density of water, kg/m3: 1,000kg/m for sewage; is velocity of water leaving the nozzle, m/s;
3
VA is the nozzle cross section area, m2.
4
3
1811Q
is flow, m /s;
P
3Q is nozzle diameter, m.
P pwa AVk003.0 w
3
wP is wind power in watts;
a is air density, kg/m3 3: 1.274kg/m at normal temperature and pressure; is wind velocity, usually monthly average, m/s; is pond area, m2;
6. Sec 6.8 Recirculation
wV
pA
kADWFR
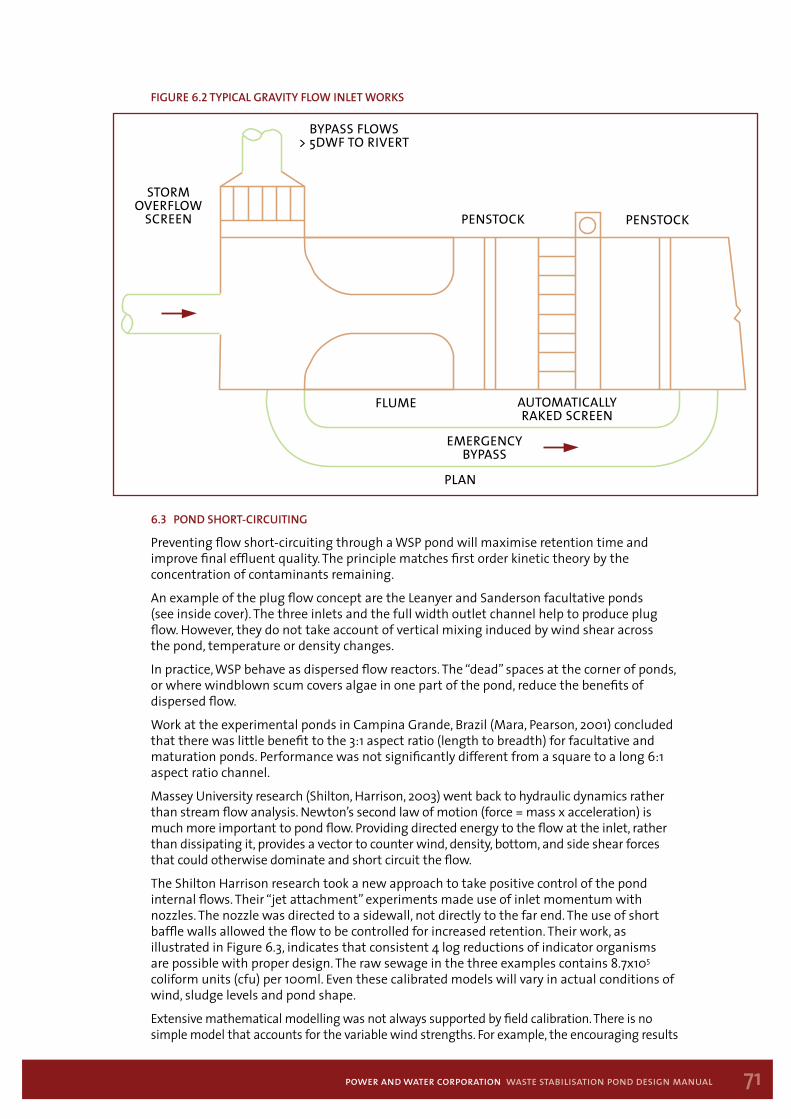
71power and water corporation waste stabilisation pond design manual
Figure 6.2 tyPical graVity FloW inlet WorKs
6.3 Pond sHort-circuiting
Preventing flow short-circuiting through a WSP pond will maximise retention time and improve final effluent quality. The principle matches first order kinetic theory by the concentration of contaminants remaining.
An example of the plug flow concept are the Leanyer and Sanderson facultative ponds (see inside cover). The three inlets and the full width outlet channel help to produce plug flow. However, they do not take account of vertical mixing induced by wind shear across the pond, temperature or density changes.
In practice, WSP behave as dispersed flow reactors. The “dead” spaces at the corner of ponds, or where windblown scum covers algae in one part of the pond, reduce the benefits of dispersed flow.
Work at the experimental ponds in Campina Grande, Brazil (Mara, Pearson, 2001) concluded that there was little benefit to the 3:1 aspect ratio (length to breadth) for facultative and maturation ponds. Performance was not significantly different from a square to a long 6:1 aspect ratio channel.
Massey University research (Shilton, Harrison, 2003) went back to hydraulic dynamics rather than stream flow analysis. Newton’s second law of motion (force = mass x acceleration) is much more important to pond flow. Providing directed energy to the flow at the inlet, rather than dissipating it, provides a vector to counter wind, density, bottom, and side shear forces that could otherwise dominate and short circuit the flow.
The Shilton Harrison research took a new approach to take positive control of the pond internal flows. Their “jet attachment” experiments made use of inlet momentum with nozzles. The nozzle was directed to a sidewall, not directly to the far end. The use of short baffle walls allowed the flow to be controlled for increased retention. Their work, as illustrated in Figure 6.3, indicates that consistent 4 log reductions of indicator organisms are possible with proper design. The raw sewage in the three examples contains 8.7x10⁵ coliform units (cfu) per 100ml. Even these calibrated models will vary in actual conditions of wind, sludge levels and pond shape.
Extensive mathematical modelling was not always supported by field calibration. There is no simple model that accounts for the variable wind strengths. For example, the encouraging results
BYPASS FLOWS> 5DWF TO RIVERT
PENSTOCK
EMERGENCY BYPASS
STORMOVERFLOW
SCREEN
AUTOMATICALLY RAKED SCREEN
FLUME
PLAN
PENSTOCK
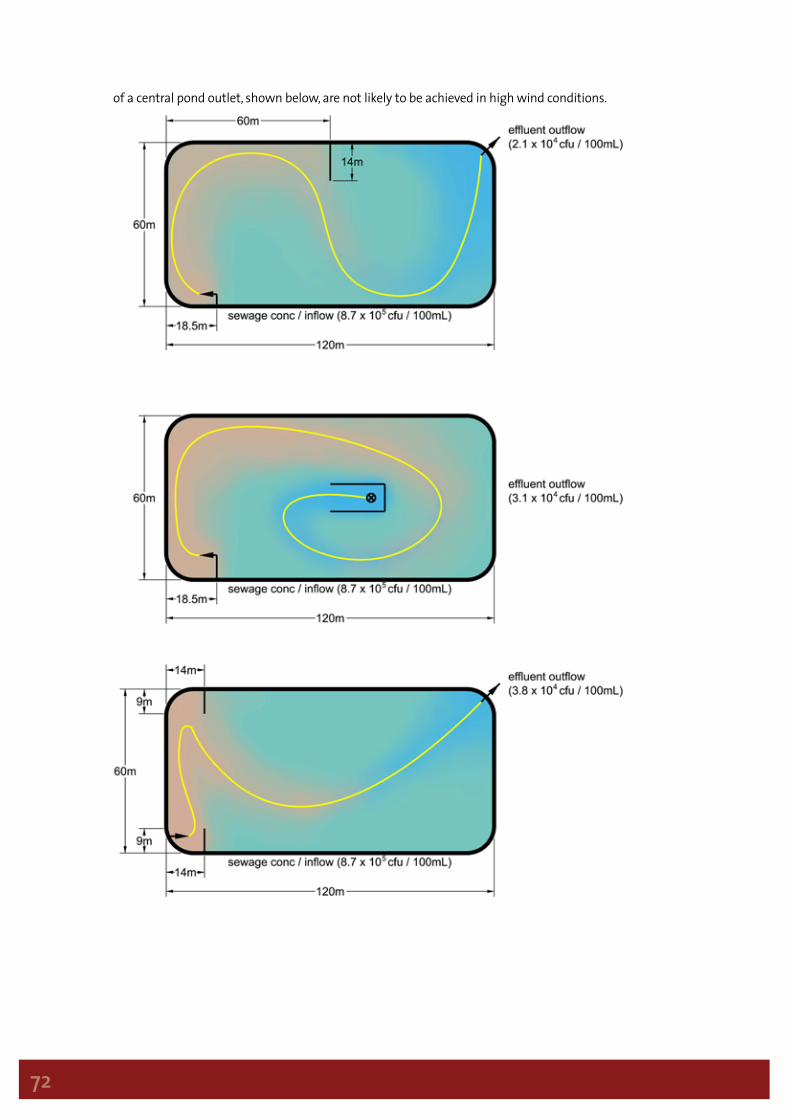
72
of a central pond outlet, shown below, are not likely to be achieved in high wind conditions.
Figure 6.3 noZZle inlet and Various discHarge conFigurationsNotes: Shilton Harrison (2003), but with dimensions and probable flow lines added
73power and water corporation waste stabilisation pond design manual
The Guidelines for the Hydraulic design of waste stabilisation ponds (Shilton, Harrison, 2003) provides many inlet and outlet configurations that suggest improvements in coliform reduction. Below, is one example that is simple and low cost to install. It provides a good “starting point” to consider designs that are more elaborate.
Figure 6.4a noZZle inlet and stuB BaFFle Pond Hydraulic design
Notes: Shilton Harrison (2003) but dimensions added
The long baffle wall shown below is recommended by Mara (2010) for facultative ponds.
Figure 6.4B noZZle inlet and long BaFFles
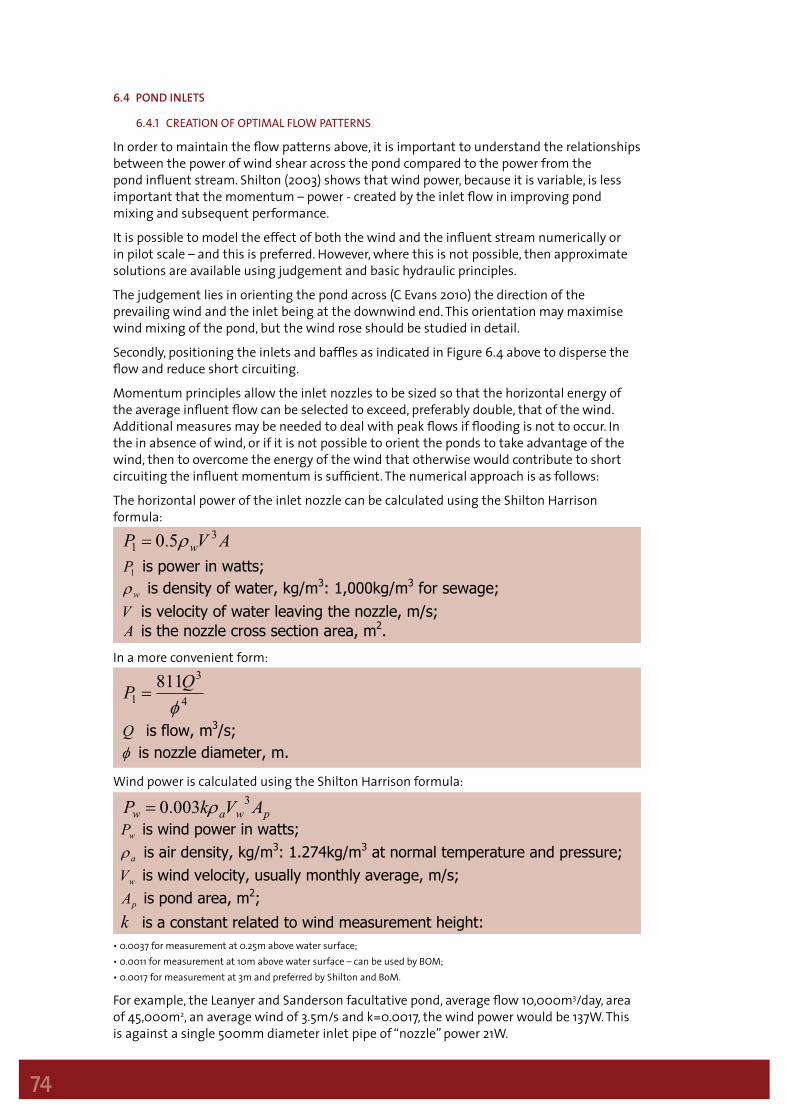
74
6.4 Pond inlets
6.4.1 CreatIon of optImal flow patternS
In order to maintain the flow patterns above, it is important to understand the relationships between the power of wind shear across the pond compared to the power from the pond influent stream. Shilton (2003) shows that wind power, because it is variable, is less important that the momentum – power - created by the inlet flow in improving pond mixing and subsequent performance.
It is possible to model the effect of both the wind and the influent stream numerically or in pilot scale – and this is preferred. However, where this is not possible, then approximate solutions are available using judgement and basic hydraulic principles.
The judgement lies in orienting the pond across (C Evans 2010) the direction of the prevailing wind and the inlet being at the downwind end. This orientation may maximise wind mixing of the pond, but the wind rose should be studied in detail.
Secondly, positioning the inlets and baffles as indicated in Figure 6.4 above to disperse the flow and reduce short circuiting.
Momentum principles allow the inlet nozzles to be sized so that the horizontal energy of the average influent flow can be selected to exceed, preferably double, that of the wind. Additional measures may be needed to deal with peak flows if flooding is not to occur. In the in absence of wind, or if it is not possible to orient the ponds to take advantage of the wind, then to overcome the energy of the wind that otherwise would contribute to short circuiting the influent momentum is sufficient. The numerical approach is as follows:
The horizontal power of the inlet nozzle can be calculated using the Shilton Harrison formula:
In a more convenient form:
Wind power is calculated using the Shilton Harrison formula:
• 0.0037 for measurement at 0.25m above water surface;• 0.0011 for measurement at 10m above water surface – can be used by BOM;• 0.0017 for measurement at 3m and preferred by Shilton and BoM.
For example, the Leanyer and Sanderson facultative pond, average flow 10,000m3/day, area of 45,000m2, an average wind of 3.5m/s and k=0.0017, the wind power would be 137W. This is against a single 500mm diameter inlet pipe of “nozzle” power 21W.
D:\Documents and Settings\m2g\Local Settings\Temporary Internet Files\OLK2E\Waste Stabilisation Pond Design Manual Equations 22Nov11.doc
4. Sec 6.2 Inlet Works and Storm Flows
5.0
55.0 EP33074.1
PF
EP is equivalent population; PF is 3.8 for 10,000 population.
5. Sec 6.4 Pond Inlets
AVw
35.0 P1
1P is power in watts;
w is density of water, kg/m3: 1,000kg/m for sewage; is velocity of water leaving the nozzle, m/s;
3
VA is the nozzle cross section area, m2.
4
3
1811Q
is flow, m /s;
P
3Q is nozzle diameter, m.
P pwa AVk003.0 w
3
wP is wind power in watts;
a is air density, kg/m3 3: 1.274kg/m at normal temperature and pressure; is wind velocity, usually monthly average, m/s; is pond area, m2;
6. Sec 6.8 Recirculation
wV
pA
kADWFR
1. Sec 6.4 Pond Inlets
AVP w3
1 5.0 1P is power in watts;
w is density of water, kg/m3: 1,000kg/m3 for sewage; V is velocity of water leaving the nozzle, m/s; A is the nozzle cross section area, m2.
4
3
1811QP
Q is flow, m3/s; is nozzle diameter, m.
pwaw AVkP 3003.0
wP is wind power in watts;
a is air density, kg/m3: 1.274kg/m3 at normal temperature and pressure;
wV is wind velocity, usually monthly average, m/s;
pA is pond area, m2;
k is a constant related to wind measurement height: 0.0037 for measurement at 0.25m above water surface 0.0011 for measurement at 10m above water surface – can be used
by BoM 0.0017 for measurement at 3m and preferred by Shilton and BoM
D:\Documents and Settings\m2g\Desktop\Waste Stabilisation Pond Design Manual Equations 29Nov11.doc
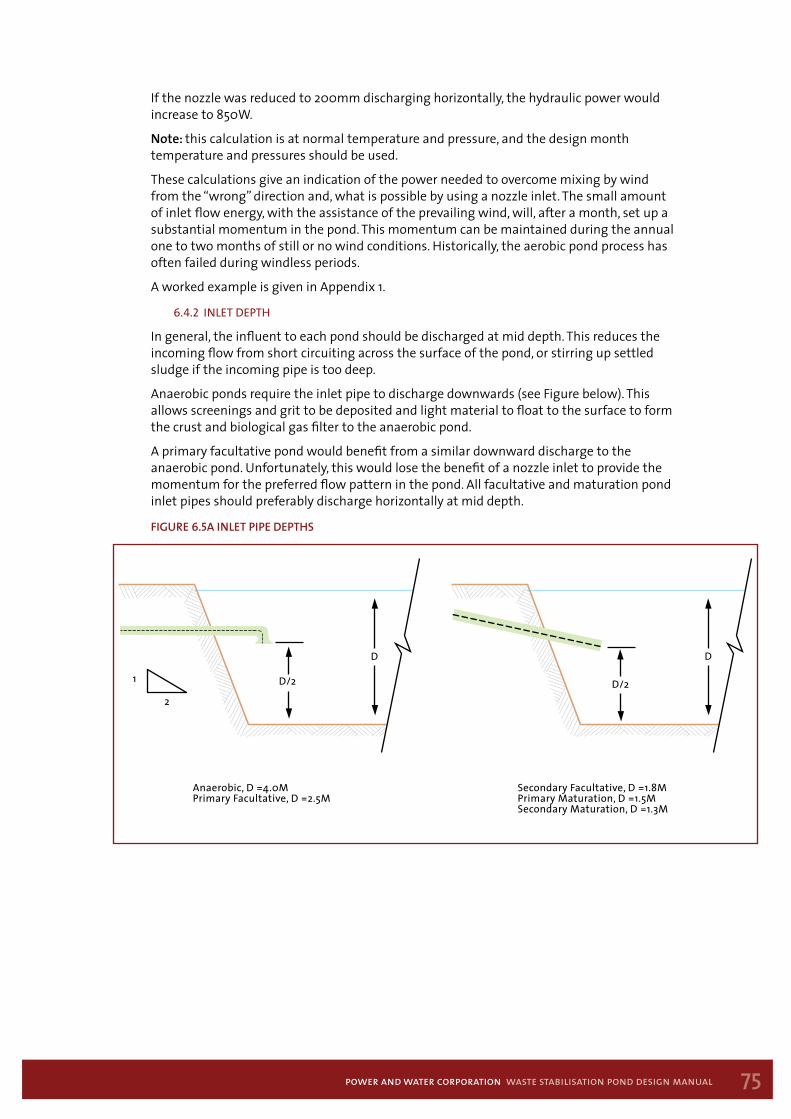
75power and water corporation waste stabilisation pond design manual
If the nozzle was reduced to 200mm discharging horizontally, the hydraulic power would increase to 850W.
Note: this calculation is at normal temperature and pressure, and the design month temperature and pressures should be used.
These calculations give an indication of the power needed to overcome mixing by wind from the “wrong” direction and, what is possible by using a nozzle inlet. The small amount of inlet flow energy, with the assistance of the prevailing wind, will, after a month, set up a substantial momentum in the pond. This momentum can be maintained during the annual one to two months of still or no wind conditions. Historically, the aerobic pond process has often failed during windless periods.
A worked example is given in Appendix 1.
6.4.2 Inlet depth
In general, the influent to each pond should be discharged at mid depth. This reduces the incoming flow from short circuiting across the surface of the pond, or stirring up settled sludge if the incoming pipe is too deep.
Anaerobic ponds require the inlet pipe to discharge downwards (see Figure below). This allows screenings and grit to be deposited and light material to float to the surface to form the crust and biological gas filter to the anaerobic pond.
A primary facultative pond would benefit from a similar downward discharge to the anaerobic pond. Unfortunately, this would lose the benefit of a nozzle inlet to provide the momentum for the preferred flow pattern in the pond. All facultative and maturation pond inlet pipes should preferably discharge horizontally at mid depth.
Figure 6.5a inlet PiPe dePtHs
Anaerobic, D =4.0MPrimary Facultative, D =2.5M
Secondary Facultative, D =1.8MPrimary Maturation, D =1.5MSecondary Maturation, D =1.3M
2
1
D
D/2 D/2
D
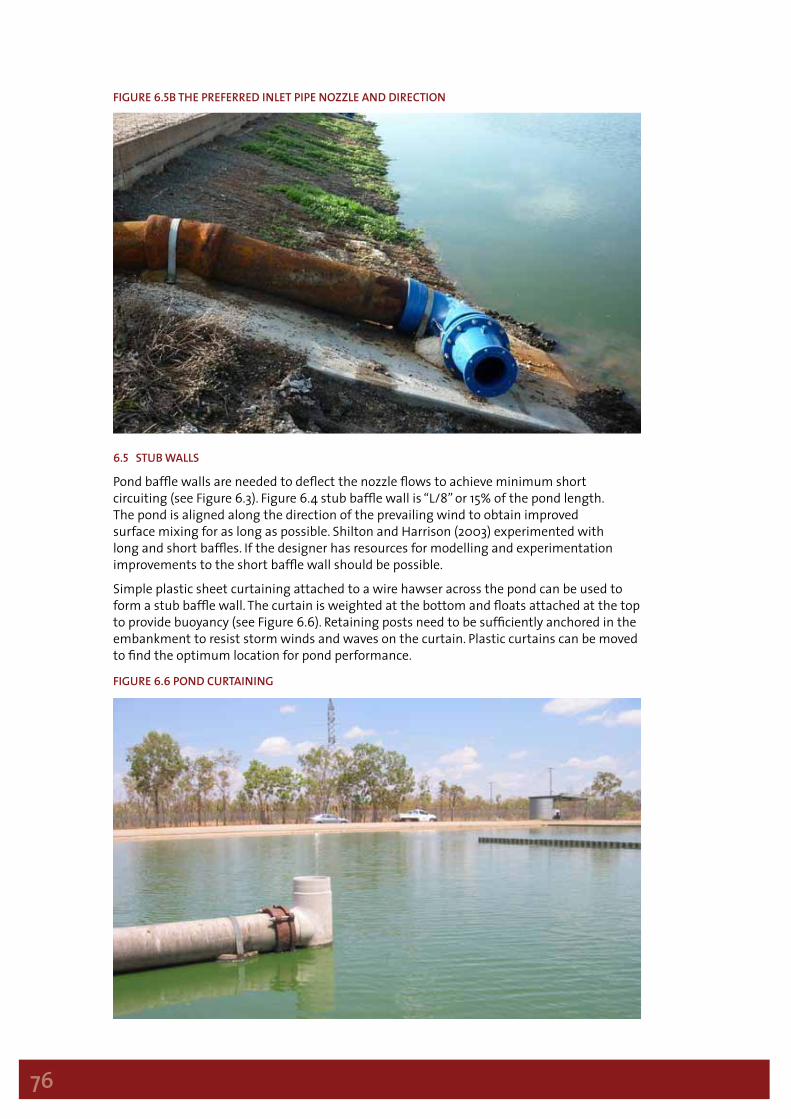
76
Figure 6.5B tHe PreFerred inlet PiPe noZZle and direction
6.5 stuB Walls
Pond baffle walls are needed to deflect the nozzle flows to achieve minimum short circuiting (see Figure 6.3). Figure 6.4 stub baffle wall is “L/8” or 15% of the pond length. The pond is aligned along the direction of the prevailing wind to obtain improved surface mixing for as long as possible. Shilton and Harrison (2003) experimented with long and short baffles. If the designer has resources for modelling and experimentation improvements to the short baffle wall should be possible.
Simple plastic sheet curtaining attached to a wire hawser across the pond can be used to form a stub baffle wall. The curtain is weighted at the bottom and floats attached at the top to provide buoyancy (see Figure 6.6). Retaining posts need to be sufficiently anchored in the embankment to resist storm winds and waves on the curtain. Plastic curtains can be moved to find the optimum location for pond performance.
Figure 6.6 Pond curtaining
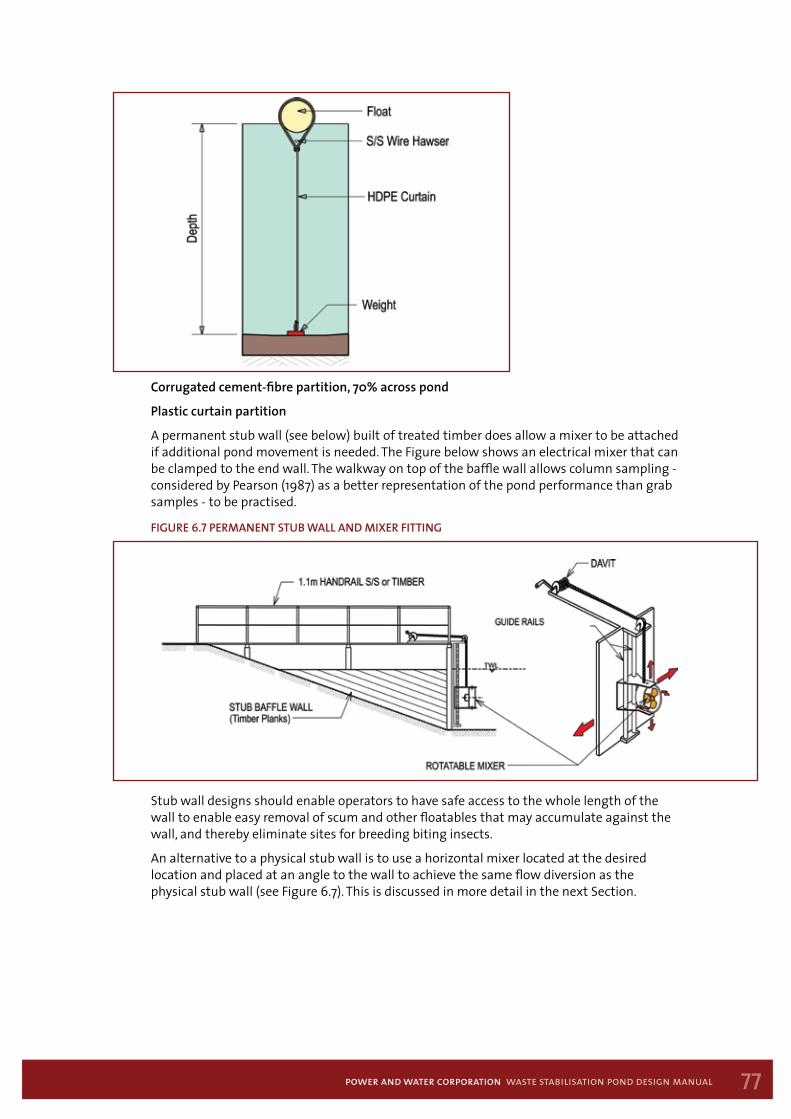
77power and water corporation waste stabilisation pond design manual
Corrugated cement-fibre partition, 70% across pond
Plastic curtain partition
A permanent stub wall (see below) built of treated timber does allow a mixer to be attached if additional pond movement is needed. The Figure below shows an electrical mixer that can be clamped to the end wall. The walkway on top of the baffle wall allows column sampling - considered by Pearson (1987) as a better representation of the pond performance than grab samples - to be practised.
Figure 6.7 Permanent stuB Wall and miXer Fitting
Stub wall designs should enable operators to have safe access to the whole length of the wall to enable easy removal of scum and other floatables that may accumulate against the wall, and thereby eliminate sites for breeding biting insects.
An alternative to a physical stub wall is to use a horizontal mixer located at the desired location and placed at an angle to the wall to achieve the same flow diversion as the physical stub wall (see Figure 6.7). This is discussed in more detail in the next Section.
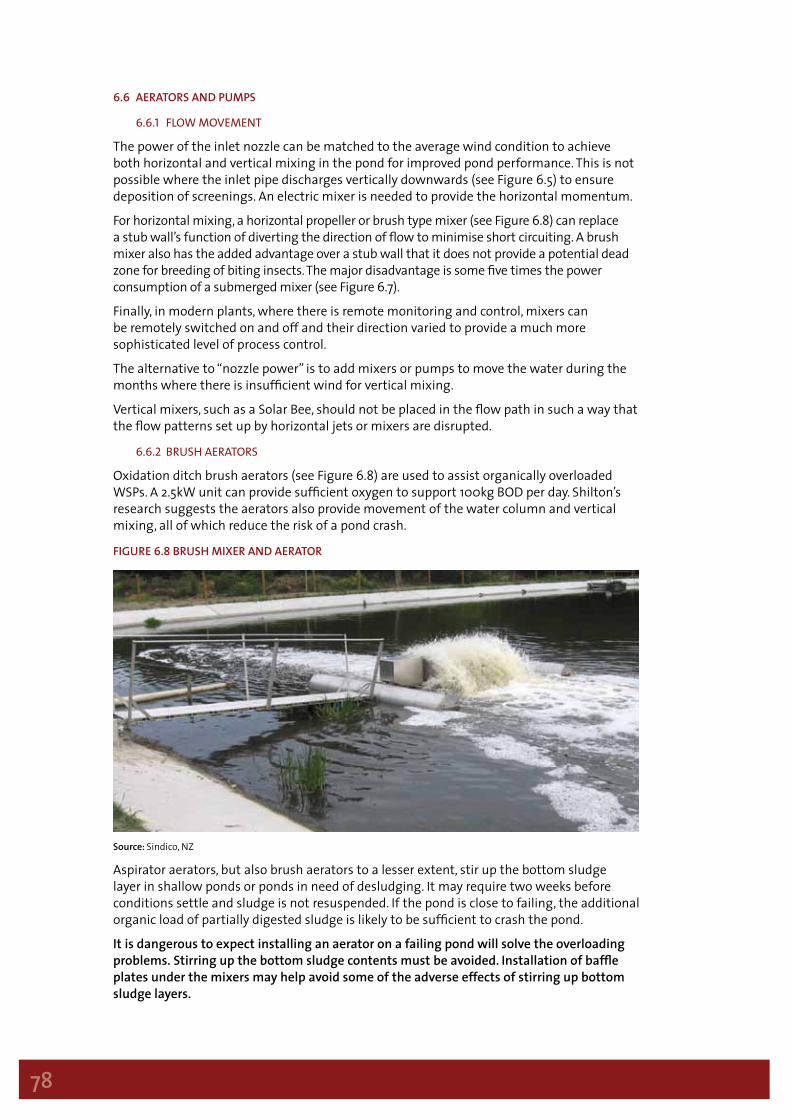
78
6.6 aerators and PumPs
6.6.1 flow movement
The power of the inlet nozzle can be matched to the average wind condition to achieve both horizontal and vertical mixing in the pond for improved pond performance. This is not possible where the inlet pipe discharges vertically downwards (see Figure 6.5) to ensure deposition of screenings. An electric mixer is needed to provide the horizontal momentum.
For horizontal mixing, a horizontal propeller or brush type mixer (see Figure 6.8) can replace a stub wall’s function of diverting the direction of flow to minimise short circuiting. A brush mixer also has the added advantage over a stub wall that it does not provide a potential dead zone for breeding of biting insects. The major disadvantage is some five times the power consumption of a submerged mixer (see Figure 6.7).
Finally, in modern plants, where there is remote monitoring and control, mixers can be remotely switched on and off and their direction varied to provide a much more sophisticated level of process control.
The alternative to “nozzle power” is to add mixers or pumps to move the water during the months where there is insufficient wind for vertical mixing.
Vertical mixers, such as a Solar Bee, should not be placed in the flow path in such a way that the flow patterns set up by horizontal jets or mixers are disrupted.
6.6.2 bruSh aeratorS
Oxidation ditch brush aerators (see Figure 6.8) are used to assist organically overloaded WSPs. A 2.5kW unit can provide sufficient oxygen to support 100kg BOD per day. Shilton’s research suggests the aerators also provide movement of the water column and vertical mixing, all of which reduce the risk of a pond crash.
Figure 6.8 BrusH miXer and aerator
Source: Sindico, NZ
Aspirator aerators, but also brush aerators to a lesser extent, stir up the bottom sludge layer in shallow ponds or ponds in need of desludging. It may require two weeks before conditions settle and sludge is not resuspended. If the pond is close to failing, the additional organic load of partially digested sludge is likely to be sufficient to crash the pond.
It is dangerous to expect installing an aerator on a failing pond will solve the overloading problems. Stirring up the bottom sludge contents must be avoided. Installation of baffle plates under the mixers may help avoid some of the adverse effects of stirring up bottom sludge layers.
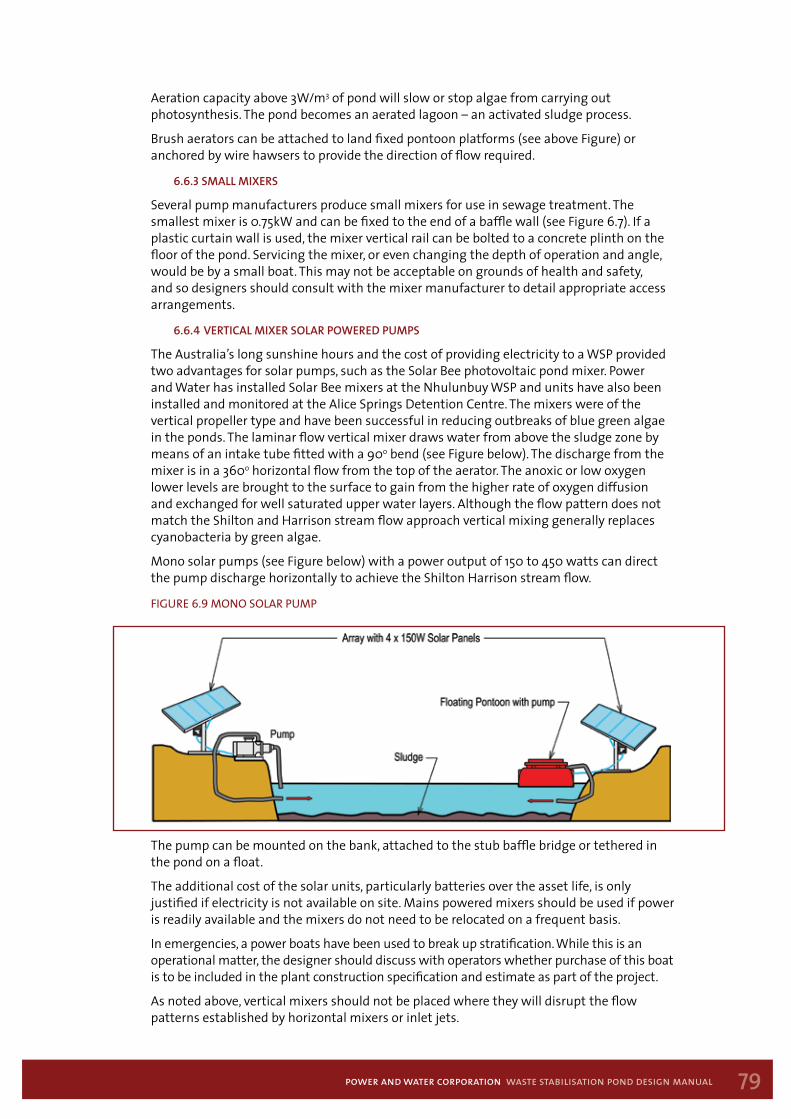
79power and water corporation waste stabilisation pond design manual
Aeration capacity above 3W/m3 of pond will slow or stop algae from carrying out photosynthesis. The pond becomes an aerated lagoon – an activated sludge process.
Brush aerators can be attached to land fixed pontoon platforms (see above Figure) or anchored by wire hawsers to provide the direction of flow required.
6.6.3 small miXers
Several pump manufacturers produce small mixers for use in sewage treatment. The smallest mixer is 0.75kW and can be fixed to the end of a baffle wall (see Figure 6.7). If a plastic curtain wall is used, the mixer vertical rail can be bolted to a concrete plinth on the floor of the pond. Servicing the mixer, or even changing the depth of operation and angle, would be by a small boat. This may not be acceptable on grounds of health and safety, and so designers should consult with the mixer manufacturer to detail appropriate access arrangements.
6.6.4 Vertical miXer solar PoWered PumPs
The Australia’s long sunshine hours and the cost of providing electricity to a WSP provided two advantages for solar pumps, such as the Solar Bee photovoltaic pond mixer. Power and Water has installed Solar Bee mixers at the Nhulunbuy WSP and units have also been installed and monitored at the Alice Springs Detention Centre. The mixers were of the vertical propeller type and have been successful in reducing outbreaks of blue green algae in the ponds. The laminar flow vertical mixer draws water from above the sludge zone by means of an intake tube fitted with a 90o bend (see Figure below). The discharge from the mixer is in a 360o horizontal flow from the top of the aerator. The anoxic or low oxygen lower levels are brought to the surface to gain from the higher rate of oxygen diffusion and exchanged for well saturated upper water layers. Although the flow pattern does not match the Shilton and Harrison stream flow approach vertical mixing generally replaces cyanobacteria by green algae.
Mono solar pumps (see Figure below) with a power output of 150 to 450 watts can direct the pump discharge horizontally to achieve the Shilton Harrison stream flow.
fIgure 6.9 mono Solar pump
The pump can be mounted on the bank, attached to the stub baffle bridge or tethered in the pond on a float.
The additional cost of the solar units, particularly batteries over the asset life, is only justified if electricity is not available on site. Mains powered mixers should be used if power is readily available and the mixers do not need to be relocated on a frequent basis.
In emergencies, a power boats have been used to break up stratification. While this is an operational matter, the designer should discuss with operators whether purchase of this boat is to be included in the plant construction specification and estimate as part of the project.
As noted above, vertical mixers should not be placed where they will disrupt the flow patterns established by horizontal mixers or inlet jets.
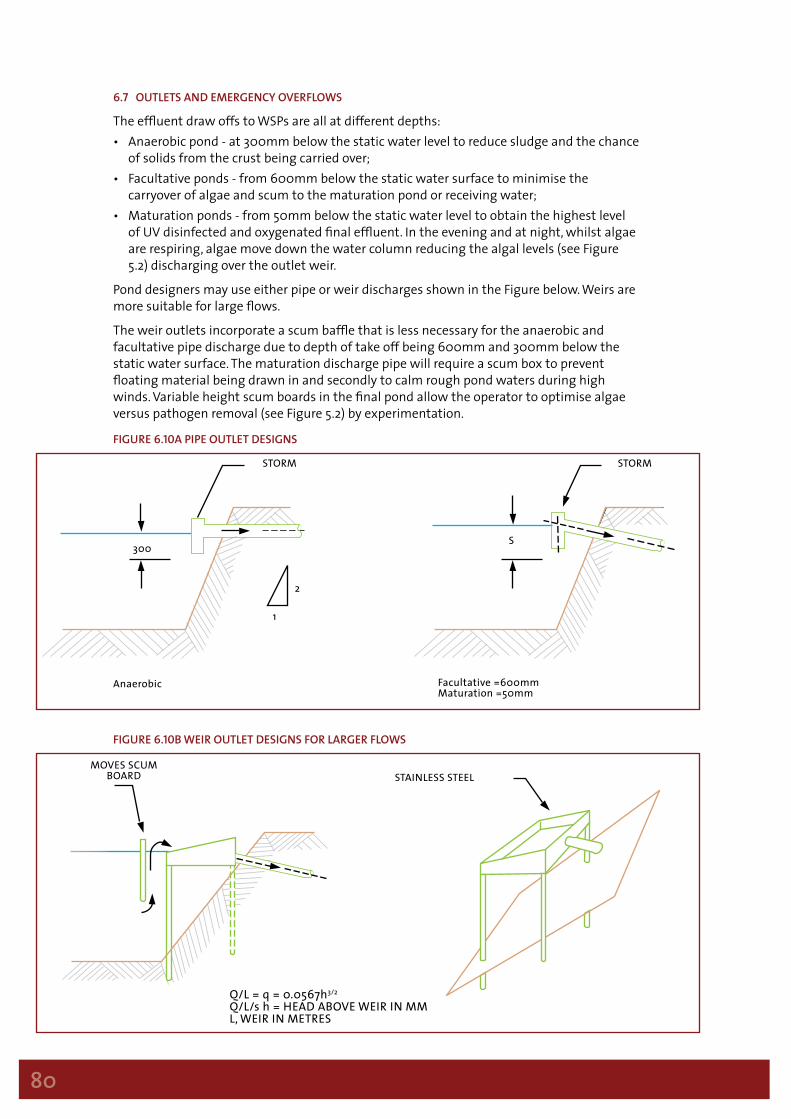
80
6.7 outlets and emergency oVerFloWs
The effluent draw offs to WSPs are all at different depths:• Anaerobic pond - at 300mm below the static water level to reduce sludge and the chance
of solids from the crust being carried over;• Facultative ponds - from 600mm below the static water surface to minimise the
carryover of algae and scum to the maturation pond or receiving water;• Maturation ponds - from 50mm below the static water level to obtain the highest level
of UV disinfected and oxygenated final effluent. In the evening and at night, whilst algae are respiring, algae move down the water column reducing the algal levels (see Figure 5.2) discharging over the outlet weir.
Pond designers may use either pipe or weir discharges shown in the Figure below. Weirs are more suitable for large flows.
The weir outlets incorporate a scum baffle that is less necessary for the anaerobic and facultative pipe discharge due to depth of take off being 600mm and 300mm below the static water surface. The maturation discharge pipe will require a scum box to prevent floating material being drawn in and secondly to calm rough pond waters during high winds. Variable height scum boards in the final pond allow the operator to optimise algae versus pathogen removal (see Figure 5.2) by experimentation.
Figure 6.10a PiPe outlet designs
Figure 6.10B Weir outlet designs For larger FloWs
STORM STORM
1
300S
2
STAINLESS STEEL
Q/L = q = 0.0567h3/2
Q/L/s h = HEAD ABOVE WEIR IN MML, WEIR IN METRES
MOVES SCUMBOARD
Anaerobic Facultative =600mmMaturation =50mm

81power and water corporation waste stabilisation pond design manual
D:\Documents and Settings\m2g\Local Settings\Temporary Internet Files\OLK2E\Waste Stabilisation Pond Design Manual Equations 22Nov11.doc
4. Sec 6.2 Inlet Works and Storm Flows
5.0
55.0 EP33074.1
PF
EP is equivalent population; PF is 3.8 for 10,000 population.
5. Sec 6.4 Pond Inlets
AVw
35.0 P1
1P is power in watts;
w is density of water, kg/m3: 1,000kg/m for sewage; is velocity of water leaving the nozzle, m/s;
3
VA is the nozzle cross section area, m2.
4
3
1811Q
is flow, m /s;
P
3Q is nozzle diameter, m.
P pwa AVk003.0 w
3
wP is wind power in watts;
a is air density, kg/m3 3: 1.274kg/m at normal temperature and pressure; is wind velocity, usually monthly average, m/s; is pond area, m2;
6. Sec 6.8 Recirculation
wV
pA
kADWFR
R is re is factor, 0.15 to 1.5;
is average dry weather flow
. Sec 7.3 Pond Geometry Soils & Wave Action
circulation rate; kADWF
7 1log 5.0
10 AF
F is freeboard, m; A is pond area, m2.
D:\Documents and Settings\m2g\Local Settings\Temporary Internet Files\OLK2E\Waste Stabilisation Pond Design Manual Equations 22Nov11.doc
In the case of excessive inflows during storm events and to ensure that overtopping does not cause catastrophic pond failure, ponds shall have overflow points capable of passing ten times dry weather flow. These will be broad crested weirs based on water flowing over slightly lower pond walls which have been designed to take flow at that point. The designer may use concrete, spray tar seal, or stabilised cement fill for smaller ponds (less than 1,000 EP).
The designer shall identify flow paths for such flows to the nearest low point from the overflow point. Note that this is an emergency condition, not normally expected to be used.
Plant overflows of greater than six times dry weather flow should be designed to be routed through the final maturation pond before discharge to the environment.
6.8 recirculation
Recirculation is sometimes used to help organically overloaded primary facultative ponds. However, fungal parasite and rotifer consuming algae have been linked to the recirculation of pond final effluent. The final effluent is low in organic material and usually well oxygenated, but due to reduced effective detention times, may be higher in pathogens. Thus, for short-term needs pending pond upgrading, recirculation is beneficial. It provides time to review the process design and approve plans for additional or alternative treatment.
The risk of a fungal parasite, such as Pseudosphaerita euglenai (Lawty, 1996), increases with the recirculation of the final effluent. The New Zealand WSP experience suggests late spring is the most likely time for the parasite to occur. Recirculation does not allow a disease to be washed out of the pond system.
The algae-devouring rotifer, Brachionus spp, is active in well oxygenated ponds using effluent recirculation (Lawty, 1996).
There is yet no proof that either the algae devouring rotifer or the fungal parasite are linked to pond loading (see Figure 3.5, Pond Organic Loading vs. Midges and Blue Green Algae). Pond recirculation is the only common element.
Pond final effluent could be effective in reducing incoming sewage odours. Pumping the final effluent to the sewer upstream of the WSPs would reduce the risk of septicity and hydrogen sulphide released at the inlet works, particularly during a hot dry season. Any existing pond effluent recirculation pumping stations could be moth balled against such a need.
Design – if the planning manual indicates that recirculation is required, or the Power and Water planning officer dictates a recirculation system is necessary, the following procedure is to be used:
Use a variable recirculation flow rate within these limits.
The recirculation is to be introduced to the surface of the primary pond in parallel to but independent of the incoming raw sewage inlets. One recirculation entry point per raw sewage inlet point is required.
Recirculation is to take place from the end of the final maturation pond into the primary pond.
Recirculation should be able to run on a timer, typically 8-10 hours per day (day light hours) so it is suitable for solar powered pumps.
6.9 Pond Hydraulic grade
All pond designs must include a hydraulic grade line calculation and Section for use of operators, designers and planners.
For operators, the ability to compare actual pond levels with the calculated levels will provide them with early warning of plant malfunction and possible overflows.
82
For designers, it will confirm whether the calculated flows are able to be passed through the various critical conditions.
For planners it will enable comparison of present conditions with design conditions and provide a good rule of thumb against which to judge plant capacity against its normal design capacity.
For control and communications people setting up pond controls, it provides the essential information for setting up of level and flow controls.
The hydraulic grade line is to be supported by process diagram and Pipe and Instrument Diagram (P&ID).
7 pond parameters & structures7.1 guidance
Pond Parameters and Structures provide guidance to the designer for new and upgrading WSP schemes. The Planning Manual and previous technical design chapters support the information in this Section. For instance, today planners and engineers cannot ignore public opinion regarding odour and aesthetics. Public comment on the location and setting of WSPs is important to secure the goodwill for a successful project. The process and engineering design of WSP is flexible and public opinion can usually be accommodated in terms of improving pond aesthetics. The guidance in this manual is to help designers overcome these deficiencies.
7.2 location, drainage & mid dePtH area
Odour buffer distances are to comply with Power and Water’s Buffer Zone Policy (Section 5.5 and Power and Water Corporation (2008). Odour modelling will be necessary if the policy requirements cannot be met.
Facultative and maturation ponds are preferably to be aligned cross ways to the line of the prevailing wind to gain the most from vertical mixing within the pond. Traditionally it was believed longitudinal alignment was better, but Water Corporation experience supports cross wind alignment (Evans, 2010)
As a rule of thumb and in the absence of other master planning, WSP land area should be triple the plant footprint to allow for expansion, sludge drying and stockpiling and future undefined services and buffer distances. The total pond area will be considerably greater than the process mid depth area, as pond embankments are typically 1:3 slope. Pond freeboard of 0.3 to 0.75m is also required. Tops of embankments should be 4m or 6m wide to allow for vehicular access. All of these considerations will add to the total pond area.
Tree lines should be set back from ponds to encourage wind shear. However, trees could provide shade to the operator’s building to reduce air-conditioning loads.
Site plans for contours and Australian Rainfall and Runoff should be used to identify drainage paths. This should then be used to position drainage to divert runoff round the plant and back to those drainage lines. Site drainage should not be allowed to concentrate drainage flow intensity.
7.3 Pond geometry, soils & WaVe action
Note that soils investigations should have been undertaken in the planning phase before design. However, if those investigations have not been undertaken during the planning phase, allowance must be made in design for those investigations.
Pond geometry should conform, as much as possible, to the topography. The contours should be used to provide inter-pond hydraulic head to minimise the use of pumping and to minimise earthworks.
The use of contours should reduce construction and operational costs and make ponds aesthetically more acceptable to the public. Should public and regulatory opinion support or require it, a small island within a pond, to encourage migratory birds, might be possible and support bird watching at the WSPs. However, the more wildlife, the greater the pathogens excreted into the ponds that risk effluent quality.

83power and water corporation waste stabilisation pond design manual
Figure 7.1 alice sPrings WsP and Bird Hide
Sharp corners provide hydraulic dead areas and are to be avoided. They are harder to construct and desludge, and therefore more expensive. Figure 7.9 shows rounded corners to the ponds.
Pond hydraulics design in accordance to Shilton and Harrison parameters are required. Facultative and maturation ponds with an aspect ratio of 3:1 are preferable even though evidence suggests nominal advantages to square ponds (see Section 6) due to the benefit from “jet attachment” to the pond wall. The Shilton Harrison recommendations support horizontally angled inlet nozzles and stub baffle walls to reduce short circuiting. Electrical mixers may be necessary to overcome stratification during periods of no wind.
Nominally square (i.e. with rounded corners of >10m radius) or round anaerobic ponds are preferred to support the stilling basin hydraulics of a downward discharge pipe.
Twin process streams for WSPs greater than 1,000 population are recommended. This will allow the closure in the dry season of one stream for maintenance. Should the designer not provide twin process streams, then the design should include direction on the strategy to be employed to bypass or otherwise the single pond and undertake maintenance while still treating incoming sewage – and provide a design of those services required to implement the strategy. This is particularly critical for the sludge removal process.
Blasting in rock has been done (Half Tree Hollow, St Helena). Ponds have also been constructed in a mangrove swamp (Palmerston; Negril, Jamaica) and sand (Guyabal, Colombia). These are unusual schemes and expensive.
Lining ponds to reduce infiltration into ground water is also expensive. General guidance on the lining requirements for different soil permeabilities (k) is:• k< 1x10⁻⁹m/s, pond may be unlined;• k= 1x10⁻⁸m/s, pond will seal during operation;• k= 1x10⁻⁷m/s, lining of the pond is required.
Regulators may not accept the self-sealing soil without a liner. Tar seal bitumen spray has been used on sandy soils to change the soil permeability to the unlined category. It may be effective for cohesive soils that should self seal.
Unlike septic tanks, where the drainage field is to infiltrate effluent into the soil, ponds should contain the sewage, avoiding possible faecal and organic contamination of any local ground water sources. Leakage from ponds may also raise local groundwater tables altering the natural groundwater flow patterns in the area. This could cause downstream salinisation, which is potentially serious.
Pond floors should be designed to avoid pooling of water during maintenance periods when the ponds are drained, for example when desludging. This is a requirement of the DHF (2009) for evaporation ponds to minimise breeding of biting insects.
Wave action (concrete margin) slabs – see Figure 7.3 – are necessary to stop embankment erosion and prevent mosquito breeding conditions.
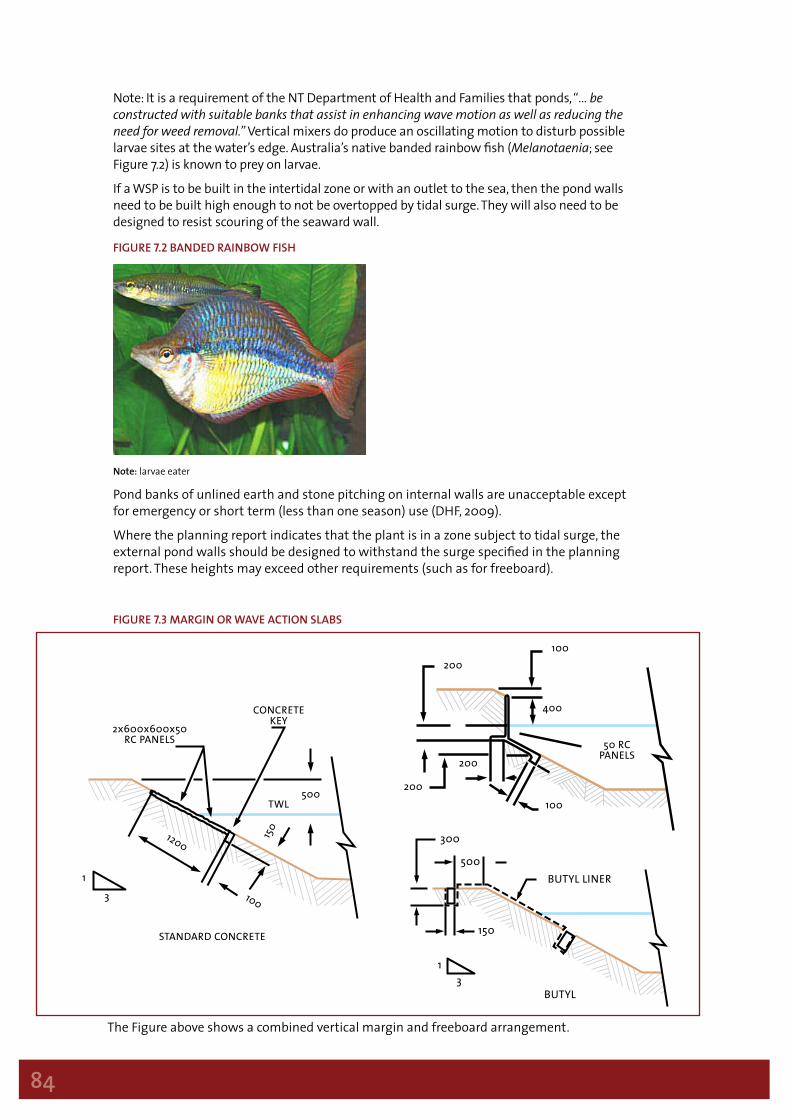
84
Note: It is a requirement of the NT Department of Health and Families that ponds, “… be constructed with suitable banks that assist in enhancing wave motion as well as reducing the need for weed removal.” Vertical mixers do produce an oscillating motion to disturb possible larvae sites at the water’s edge. Australia’s native banded rainbow fish (Melanotaenia; see Figure 7.2) is known to prey on larvae.
If a WSP is to be built in the intertidal zone or with an outlet to the sea, then the pond walls need to be built high enough to not be overtopped by tidal surge. They will also need to be designed to resist scouring of the seaward wall.
Figure 7.2 Banded rainBoW FisH
Note: larvae eater
Pond banks of unlined earth and stone pitching on internal walls are unacceptable except for emergency or short term (less than one season) use (DHF, 2009).
Where the planning report indicates that the plant is in a zone subject to tidal surge, the external pond walls should be designed to withstand the surge specified in the planning report. These heights may exceed other requirements (such as for freeboard).
Figure 7.3 margin or WaVe action slaBs
The Figure above shows a combined vertical margin and freeboard arrangement.
50 RCPANELS
200
200
200
100
100
400
3
1
STANDARD CONCRETE
CONCRETEKEY
2x600x600x50RC PANELS
TWL500
1200
100
150
31
BUTYL
BUTYL LINER
300
500
150
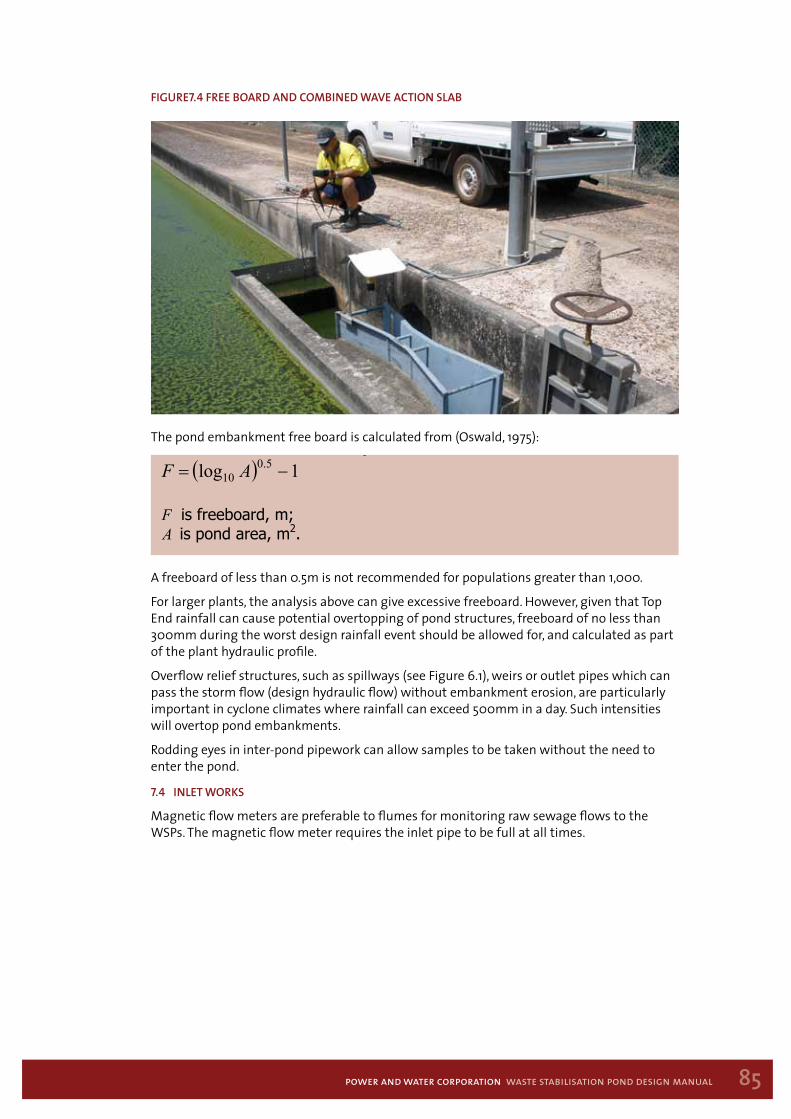
85power and water corporation waste stabilisation pond design manual
R is re is factor, 0.15 to 1.5;
is average dry weather flow
. Sec 7.3 Pond Geometry Soils & Wave Action
circulation rate; kADWF
7 1log 5.0
10 AF
F is freeboard, m; A is pond area, m2.
D:\Documents and Settings\m2g\Local Settings\Temporary Internet Files\OLK2E\Waste Stabilisation Pond Design Manual Equations 22Nov11.doc
Figure7.4 Free Board and comBined WaVe action slaB
The pond embankment free board is calculated from (Oswald, 1975):
A freeboard of less than 0.5m is not recommended for populations greater than 1,000.
For larger plants, the analysis above can give excessive freeboard. However, given that Top End rainfall can cause potential overtopping of pond structures, freeboard of no less than 300mm during the worst design rainfall event should be allowed for, and calculated as part of the plant hydraulic profile.
Overflow relief structures, such as spillways (see Figure 6.1), weirs or outlet pipes which can pass the storm flow (design hydraulic flow) without embankment erosion, are particularly important in cyclone climates where rainfall can exceed 500mm in a day. Such intensities will overtop pond embankments.
Rodding eyes in inter-pond pipework can allow samples to be taken without the need to enter the pond.
7.4 inlet WorKs
Magnetic flow meters are preferable to flumes for monitoring raw sewage flows to the WSPs. The magnetic flow meter requires the inlet pipe to be full at all times.
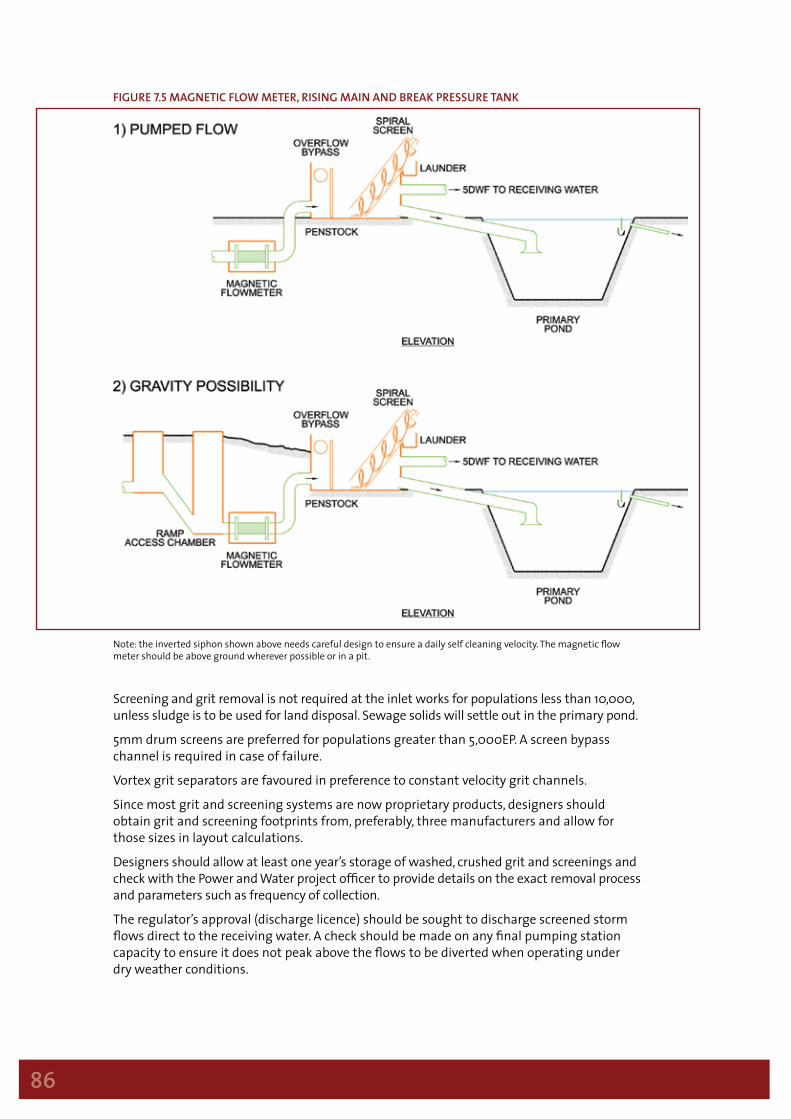
86
Figure 7.5 magnetic FloW meter, rising main and BreaK Pressure tanK
Note: the inverted siphon shown above needs careful design to ensure a daily self cleaning velocity. The magnetic flow meter should be above ground wherever possible or in a pit.
Screening and grit removal is not required at the inlet works for populations less than 10,000, unless sludge is to be used for land disposal. Sewage solids will settle out in the primary pond.
5mm drum screens are preferred for populations greater than 5,000EP. A screen bypass channel is required in case of failure.
Vortex grit separators are favoured in preference to constant velocity grit channels.
Since most grit and screening systems are now proprietary products, designers should obtain grit and screening footprints from, preferably, three manufacturers and allow for those sizes in layout calculations.
Designers should allow at least one year’s storage of washed, crushed grit and screenings and check with the Power and Water project officer to provide details on the exact removal process and parameters such as frequency of collection.
The regulator’s approval (discharge licence) should be sought to discharge screened storm flows direct to the receiving water. A check should be made on any final pumping station capacity to ensure it does not peak above the flows to be diverted when operating under dry weather conditions.
87power and water corporation waste stabilisation pond design manual
7.5 anaeroBic Ponds
Twin anaerobic ponds (see Section 4.2 for depths) are required to allow for one pond to be taken out of operation for desludging. Each pond is to be sized for 50% of the design flow. If a designer wishes to use a single pond, then the design must address how the pond is to be desludged and how other maintenance can be undertaken with only one pond train.
The raw sewage inlet pipe is to discharge downwards and at mid depth. The pipe is to be readily remountable to assist desludging.
The pond outlet scum board to be set 300mm below static water level (see Figure 6.10A).
A concrete ring beam is to be incorporated in the pond bund to allow for future securing of a cover for methane gas collection. The beam therefore should be designed to be gas tight and integral with the liner and margin. The type of cover and ring beam allowed for should be a membrane type as used for gas tight seals for grain silos. Non-flexible conventional roofs are unlikely to be economical given wind loads in cyclone areas. Should a flexible cover be even severely damaged during a cyclone, there is unlikely to be any lasting adverse effect on process.
7.6 FacultatiVe Ponds
A primary facultative pond inlet depth of 2.5m (see Section 4.2 for depths) is the preferred to provide additional sludge storage. The pond depth should then be reduced to 1.8m (see Section 4.2).
Secondary facultative pond depth is to be 1.5m.
Facultative ponds serving less than 10,000 equivalent population (EP) would preferably have a single inlet and outlet pipe, following Shilton’s hydraulic recommendations.
Pond inlet pipes are to discharge at mid depth.
Weir outlets, rather than pipes, should be considered for facultative ponds with populations greater than 5,000.
A pond outlet scum board depth should be located 600mm below the static water level.
Pond free board height is to be determined by calculation based on pond surface area (see Section 7.3).
Wave protection is to be provided to the pond embankments and the design to discourage mosquito breeding at the water’s edge. Storm overflow provision to be considered: spillway is shown in Figure 6.1.
7.7 maturation Ponds
Primary maturation pond depth is to be 1.3m. For secondary maturation ponds, the depth could be reduced to 1.0m if weed control is likely. Experience has shown that pathogen destruction is better with shallow ponds. Taking a maturation pond off line for three months to dry and remove sludge (see Figure 4.3A) could be a weed control operation.
Ponds serving less than 10,000 equivalent population would preferably have a single inlet and outlet pipe, following Shilton and Harrison hydraulic recommendations (see Figure 6.4).
Weir outlets should be considered for maturation ponds with populations >5,000EP.
Pond inlet pipes to discharge at mid depth.
Pond outlet scum board depth is to be 50mm below the static water level. The depth of the scum board is to be able to be easily varied by the operator for optimum performance.
Pond free board height is to be determined by calculation based on wind and pond surface area (see Section 7.3). Wave protection is to be provided to the pond embankments and the design to discourage mosquito breeding at the water’s edge.
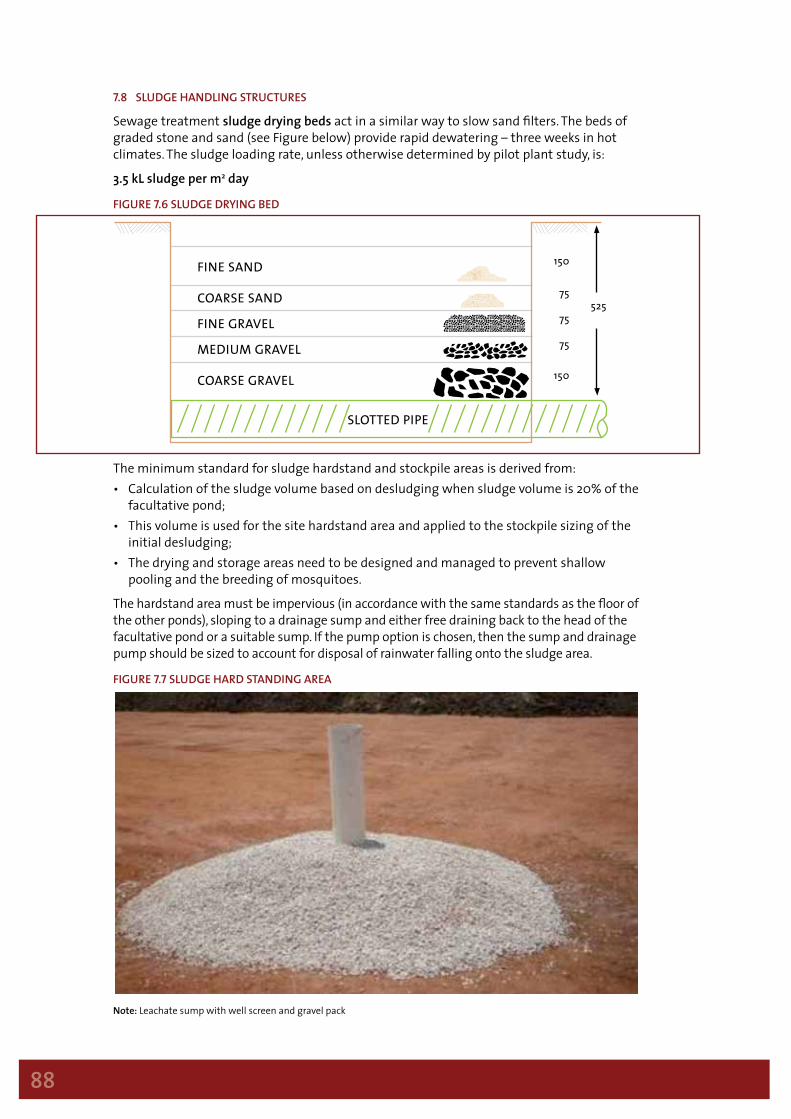
88
7.8 sludge Handling structures
Sewage treatment sludge drying beds act in a similar way to slow sand filters. The beds of graded stone and sand (see Figure below) provide rapid dewatering – three weeks in hot climates. The sludge loading rate, unless otherwise determined by pilot plant study, is:
3.5 kL sludge per m2 day
Figure 7.6 sludge drying Bed
The minimum standard for sludge hardstand and stockpile areas is derived from:• Calculation of the sludge volume based on desludging when sludge volume is 20% of the
facultative pond;• This volume is used for the site hardstand area and applied to the stockpile sizing of the
initial desludging;• The drying and storage areas need to be designed and managed to prevent shallow
pooling and the breeding of mosquitoes.
The hardstand area must be impervious (in accordance with the same standards as the floor of the other ponds), sloping to a drainage sump and either free draining back to the head of the facultative pond or a suitable sump. If the pump option is chosen, then the sump and drainage pump should be sized to account for disposal of rainwater falling onto the sludge area.
Figure 7.7 sludge Hard standing area
Note: Leachate sump with well screen and gravel pack
SLOTTED PIPE
COARSE GRAVEL
MEDIUM GRAVEL
FINE GRAVEL
COARSE SAND
FINE SAND
525
150
75
75
75
150
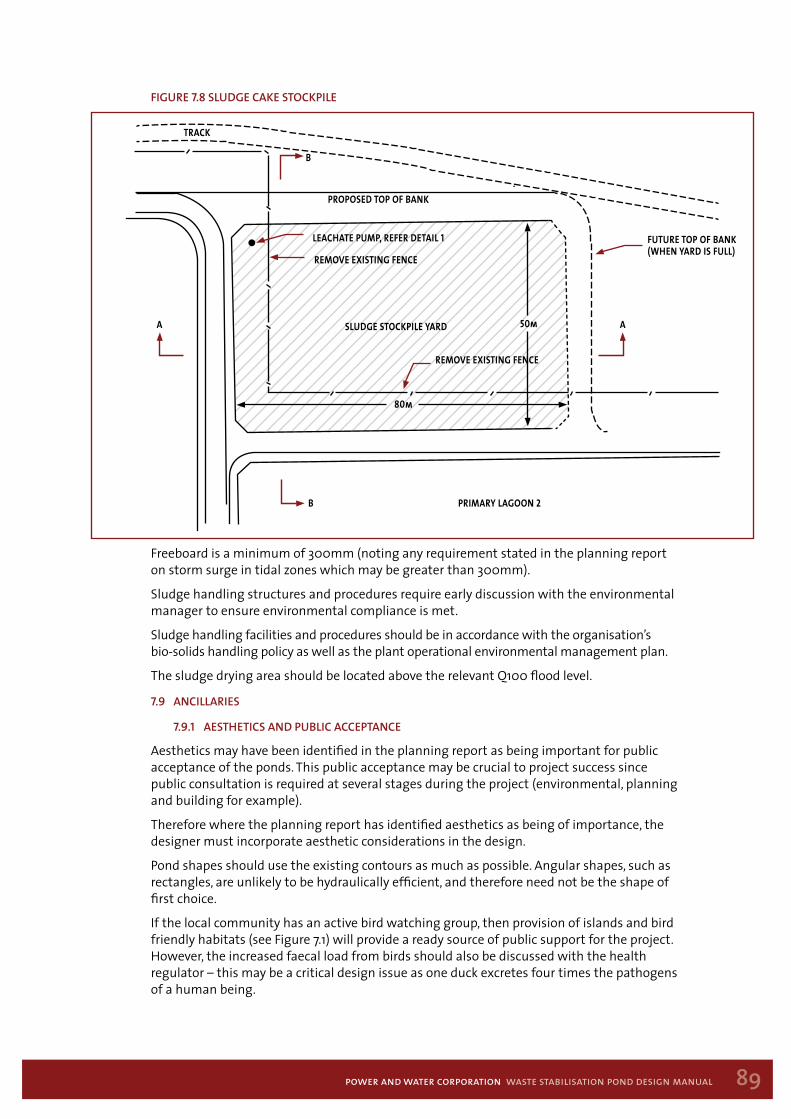
89power and water corporation waste stabilisation pond design manual
Figure 7.8 sludge caKe stocKPile
Freeboard is a minimum of 300mm (noting any requirement stated in the planning report on storm surge in tidal zones which may be greater than 300mm).
Sludge handling structures and procedures require early discussion with the environmental manager to ensure environmental compliance is met.
Sludge handling facilities and procedures should be in accordance with the organisation’s bio-solids handling policy as well as the plant operational environmental management plan.
The sludge drying area should be located above the relevant Q100 flood level.
7.9 ancillaries
7.9.1 aestHetics and PuBlic accePtance
Aesthetics may have been identified in the planning report as being important for public acceptance of the ponds. This public acceptance may be crucial to project success since public consultation is required at several stages during the project (environmental, planning and building for example).
Therefore where the planning report has identified aesthetics as being of importance, the designer must incorporate aesthetic considerations in the design.
Pond shapes should use the existing contours as much as possible. Angular shapes, such as rectangles, are unlikely to be hydraulically efficient, and therefore need not be the shape of first choice.
If the local community has an active bird watching group, then provision of islands and bird friendly habitats (see Figure 7.1) will provide a ready source of public support for the project. However, the increased faecal load from birds should also be discussed with the health regulator – this may be a critical design issue as one duck excretes four times the pathogens of a human being.
PROPOSED TOP OF BANK
TRACK
REMOVE EXISTING FENCE
LEACHATE PUMP, REFER DETAIL 1 FUTURE TOP OF BANK(WHEN YARD IS FULL)
80m
AA SLUDGE STOCKPILE YARD
REMOVE EXISTING FENCE
PRIMARY LAGOON 2B
50m
B
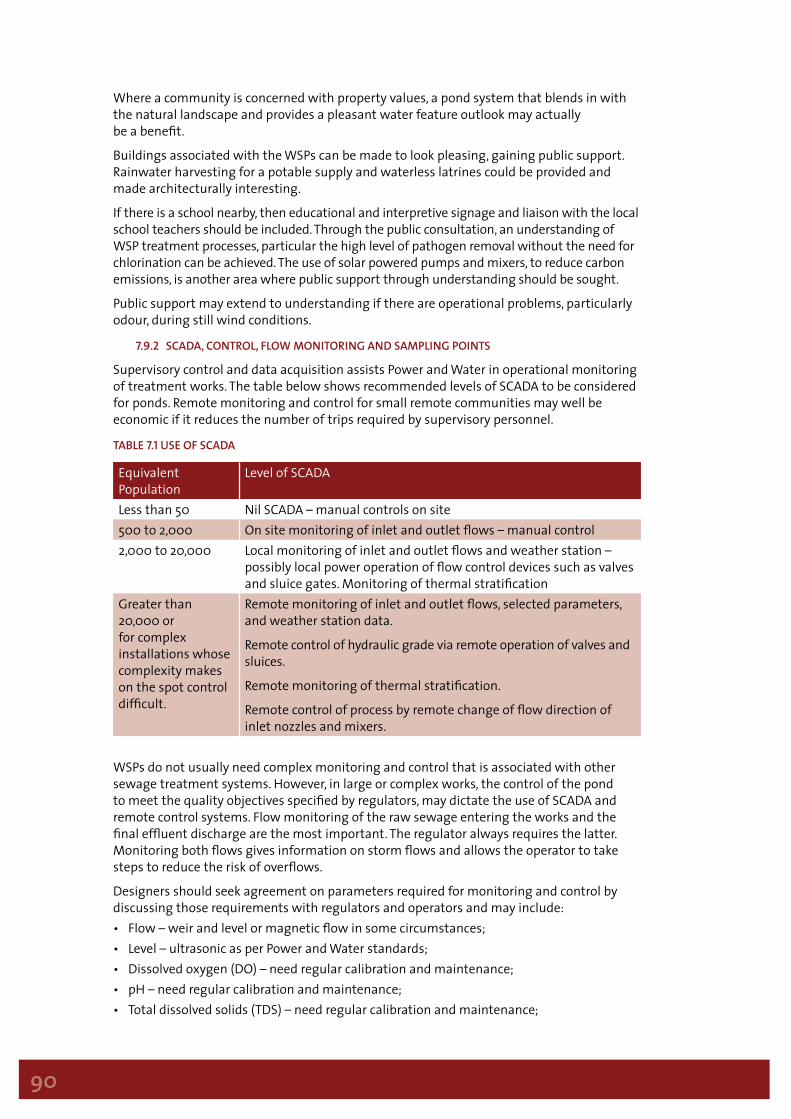
90
Where a community is concerned with property values, a pond system that blends in with the natural landscape and provides a pleasant water feature outlook may actually be a benefit.
Buildings associated with the WSPs can be made to look pleasing, gaining public support. Rainwater harvesting for a potable supply and waterless latrines could be provided and made architecturally interesting.
If there is a school nearby, then educational and interpretive signage and liaison with the local school teachers should be included. Through the public consultation, an understanding of WSP treatment processes, particular the high level of pathogen removal without the need for chlorination can be achieved. The use of solar powered pumps and mixers, to reduce carbon emissions, is another area where public support through understanding should be sought.
Public support may extend to understanding if there are operational problems, particularly odour, during still wind conditions.
7.9.2 scada, control, FloW monitoring and samPling Points
Supervisory control and data acquisition assists Power and Water in operational monitoring of treatment works. The table below shows recommended levels of SCADA to be considered for ponds. Remote monitoring and control for small remote communities may well be economic if it reduces the number of trips required by supervisory personnel.
taBle 7.1 use oF scada
Equivalent Population
Level of SCADA
Less than 50 Nil SCADA – manual controls on site500 to 2,000 On site monitoring of inlet and outlet flows – manual control2,000 to 20,000 Local monitoring of inlet and outlet flows and weather station –
possibly local power operation of flow control devices such as valves and sluice gates. Monitoring of thermal stratification
Greater than 20,000 or for complex installations whose complexity makes on the spot control difficult.
Remote monitoring of inlet and outlet flows, selected parameters, and weather station data.
Remote control of hydraulic grade via remote operation of valves and sluices.
Remote monitoring of thermal stratification.
Remote control of process by remote change of flow direction of inlet nozzles and mixers.
WSPs do not usually need complex monitoring and control that is associated with other sewage treatment systems. However, in large or complex works, the control of the pond to meet the quality objectives specified by regulators, may dictate the use of SCADA and remote control systems. Flow monitoring of the raw sewage entering the works and the final effluent discharge are the most important. The regulator always requires the latter. Monitoring both flows gives information on storm flows and allows the operator to take steps to reduce the risk of overflows.
Designers should seek agreement on parameters required for monitoring and control by discussing those requirements with regulators and operators and may include:• Flow – weir and level or magnetic flow in some circumstances;• Level – ultrasonic as per Power and Water standards;• Dissolved oxygen (DO) – need regular calibration and maintenance;• pH – need regular calibration and maintenance;• Total dissolved solids (TDS) – need regular calibration and maintenance;

91power and water corporation waste stabilisation pond design manual
• Wind speed and direction – important for determining pond operational changes and likely odour complaints;
• Video to monitor the formation of weed and sludge mats, and growth of weeds on pond margins. These growths are often sources of insect breeding;
• Sensors for odour, dissolved oxygen and pH - note instrument accuracy is not reliable so these are not recommended.
• Thermistor chains to enable monitoring of thermal stratification in the facultative pond that will be the most heavily organically loaded and cause the greatest odour if it inverts and crashes.
Flow-measuring flumes (see Figure 7.4) are the only practical alternative to magnetic flow meters.
SCADA and control equipment design and specification must be approved by Power and Water as being compatible with Power and Water’s systems.
7.9.3 samPling and FloW monitoring
Sampling points are set by the regulator to confirm that the effluent quality and quantity meet the discharge licence conditions. Similar parameters should be recorded at the inlet to the WSP to assist in assessing pond performance. The table below summarises the analyses to be performed.
taBle 7.2 samPling and FloW measurements
Raw Sewage or Final Effluent Inlet and Outlet Flow MeasurementsPhysical and chemical: • pH • temperature • alkalinity • BOD5 • Suspended solids (SS)
Flows: • Peak instantaneous • Daily • Monthly • Seasonal • Annual
Pathogens: • E. coli • Helminth eggsNitrogen: • Total • TKN • Ammonia • Inorganic nitrogenPhosphorus: • Total • Reactive (PO4)
Designers should note that at sampling points, personnel who undertake sampling are able to access the water surface. Steps, ladders, ramps or other access methods must be provided. In the areas of Katherine and Darwin ponds, crocodiles are likely to inhabit ponds and structures and cages to prevent attack should be considered.
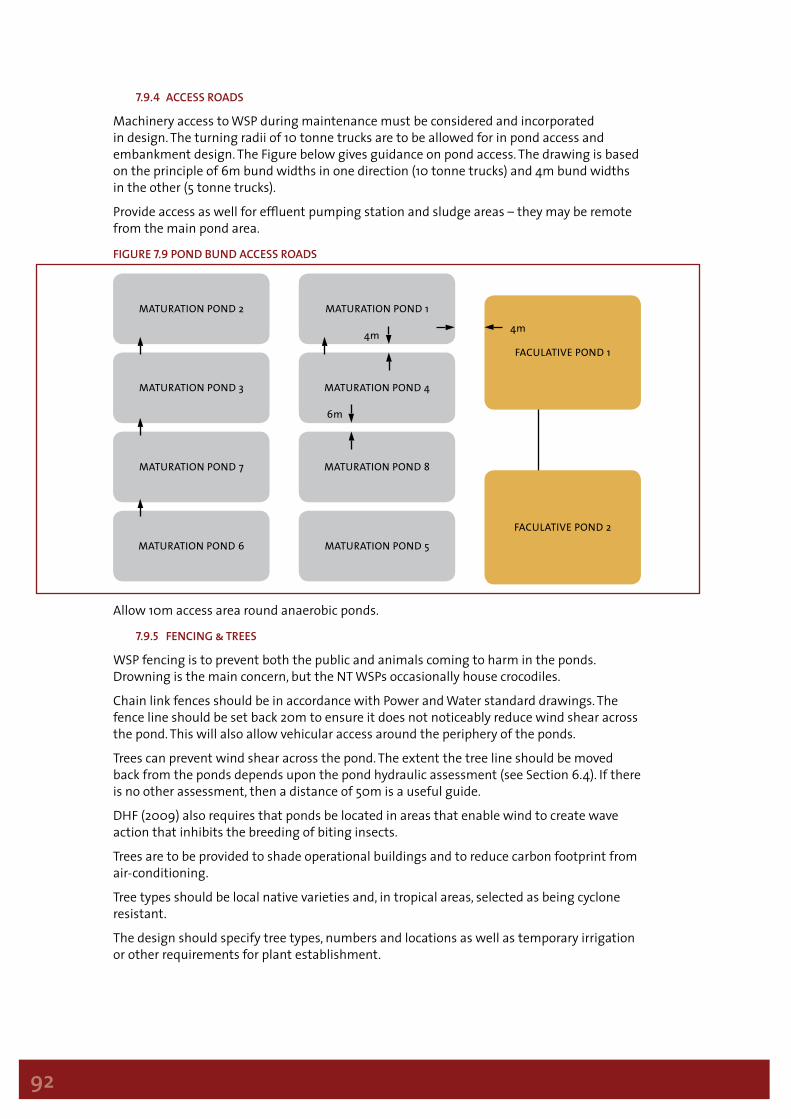
92
7.9.4 access roads
Machinery access to WSP during maintenance must be considered and incorporated in design. The turning radii of 10 tonne trucks are to be allowed for in pond access and embankment design. The Figure below gives guidance on pond access. The drawing is based on the principle of 6m bund widths in one direction (10 tonne trucks) and 4m bund widths in the other (5 tonne trucks).
Provide access as well for effluent pumping station and sludge areas – they may be remote from the main pond area.
Figure 7.9 Pond Bund access roads
Allow 10m access area round anaerobic ponds.
7.9.5 Fencing & trees
WSP fencing is to prevent both the public and animals coming to harm in the ponds. Drowning is the main concern, but the NT WSPs occasionally house crocodiles.
Chain link fences should be in accordance with Power and Water standard drawings. The fence line should be set back 20m to ensure it does not noticeably reduce wind shear across the pond. This will also allow vehicular access around the periphery of the ponds.
Trees can prevent wind shear across the pond. The extent the tree line should be moved back from the ponds depends upon the pond hydraulic assessment (see Section 6.4). If there is no other assessment, then a distance of 50m is a useful guide.
DHF (2009) also requires that ponds be located in areas that enable wind to create wave action that inhibits the breeding of biting insects.
Trees are to be provided to shade operational buildings and to reduce carbon footprint from air-conditioning.
Tree types should be local native varieties and, in tropical areas, selected as being cyclone resistant.
The design should specify tree types, numbers and locations as well as temporary irrigation or other requirements for plant establishment.
MATURATION POND 2
MATURATION POND 3
MATURATION POND 7
MATURATION POND 6 MATURATION POND 5
FACULATIVE POND 2
MATURATION POND 4
6m
MATURATION POND 8
FACULATIVE POND 1
MATURATION POND 1
4m 4m

93power and water corporation waste stabilisation pond design manual
7.9.6 oHs and signage
Occupational health and safety (OHS) require siting of warning signs on all sides of the pond. Typical signs are given in the Figure below.
Figure 7.10 Warning signs
Lifebuoys should be provided on all four sides of the ponds and housed against sun and storm.
Shelter for operators, containment of chemicals, washing and first aid kits are to be provided (see Section below).
Confined spaces of all types should be designed out of the WSP as a matter of course. By their nature, space is plentiful at WSP sites. Wherever possible maintainable items should be located above ground or where they can be accessed at ground level - mixers should be on guide rails for winching to ground level for maintenance.
7.9.7 Building, ligHting and Water suPPly
Encouragement to the operator can create a lifetime interest in the WSP site. An operator’s building is essential for the extremes of climate of the Northern Territory and from OHS perspective.
In the heat of the summer, air conditioning is necessary. In the wet season shelter from the heavy rain and relief from humidity is also required.
An operator’s building is used for storing operational equipment, SCADA and control equipment, engineering drawings and for reception and induction of visitors.
The building should be provided with water for washing and hosing down, a latrine or flush lavatory and electricity for lighting and fans or air-conditioning as well as locations for first aid kits.
Rainwater harvesting and photovoltaic cells make the basic of these services possible in isolated areas.
Figure 7.11 oPerators’ Building and serVices, toWn location
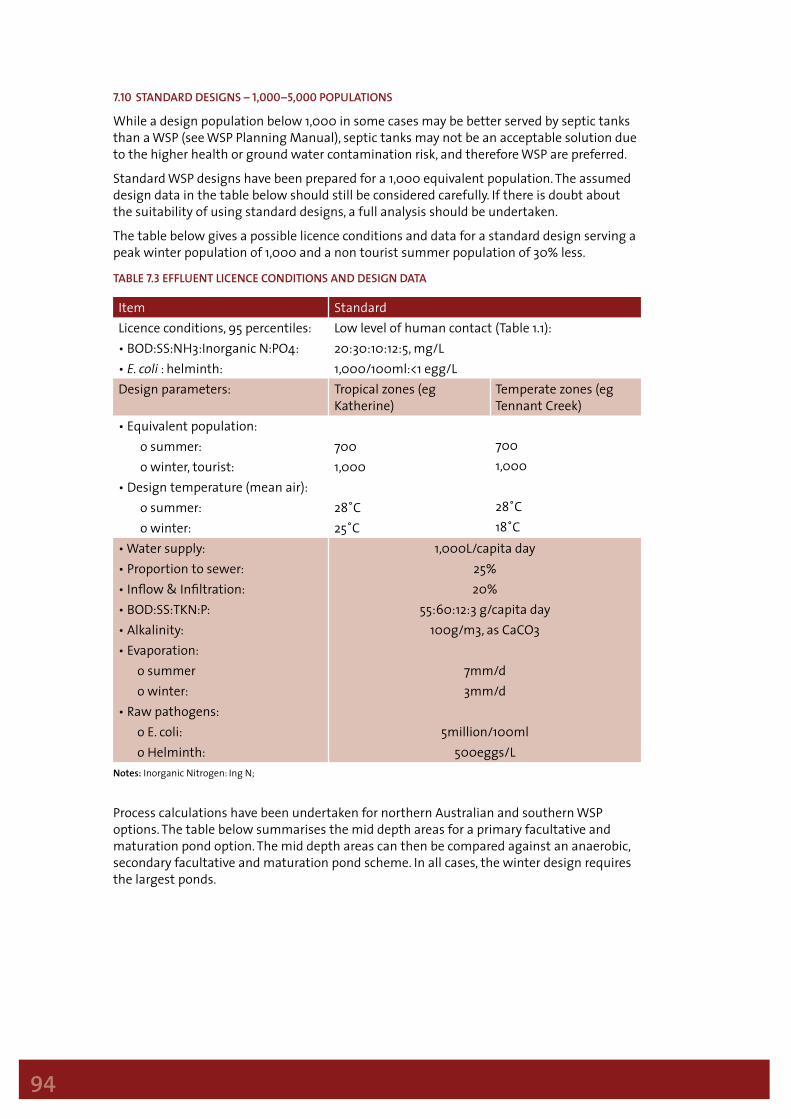
94
7.10 standard designs – 1,000–5,000 PoPulations
While a design population below 1,000 in some cases may be better served by septic tanks than a WSP (see WSP Planning Manual), septic tanks may not be an acceptable solution due to the higher health or ground water contamination risk, and therefore WSP are preferred.
Standard WSP designs have been prepared for a 1,000 equivalent population. The assumed design data in the table below should still be considered carefully. If there is doubt about the suitability of using standard designs, a full analysis should be undertaken.
The table below gives a possible licence conditions and data for a standard design serving a peak winter population of 1,000 and a non tourist summer population of 30% less.
taBle 7.3 eFFluent licence conditions and design data
Item StandardLicence conditions, 95 percentiles:• BOD:SS:NH3:Inorganic N:PO4:• E. coli : helminth:
Low level of human contact (Table 1.1):20:30:10:12:5, mg/L1,000/100ml:<1 egg/L
Design parameters: Tropical zones (eg Katherine)
Temperate zones (eg Tennant Creek)
• Equivalent population: o summer: o winter, tourist:
• Design temperature (mean air): o summer: o winter:
7001,000
28˚C25˚C
7001,000
28˚C18˚C
• Water supply:• Proportion to sewer:• Inflow & Infiltration:• BOD:SS:TKN:P:• Alkalinity:• Evaporation:
o summero winter:
• Raw pathogens:o E. coli:o Helminth:
1,000L/capita day25%20%
55:60:12:3 g/capita day100g/m3, as CaCO3
7mm/d3mm/d
5million/100ml500eggs/L
Notes: Inorganic Nitrogen: Ing N;
Process calculations have been undertaken for northern Australian and southern WSP options. The table below summarises the mid depth areas for a primary facultative and maturation pond option. The mid depth areas can then be compared against an anaerobic, secondary facultative and maturation pond scheme. In all cases, the winter design requires the largest ponds.
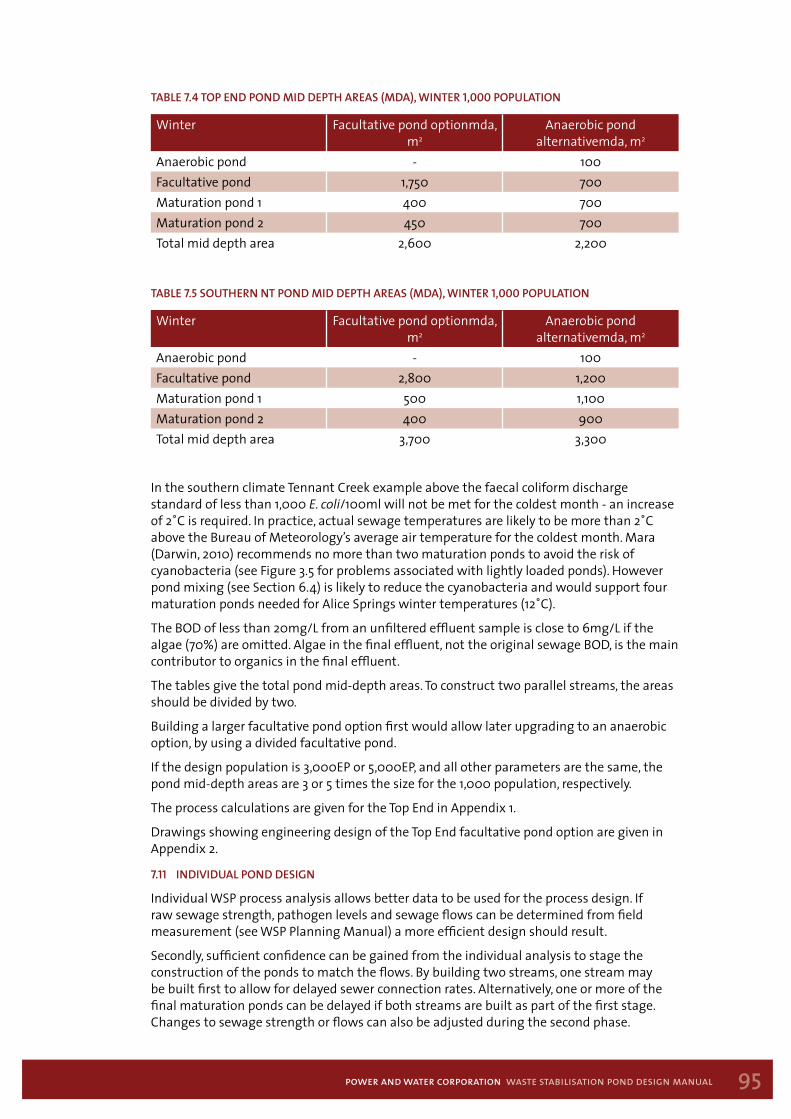
95power and water corporation waste stabilisation pond design manual
taBle 7.4 toP end Pond mid dePtH areas (mda), Winter 1,000 PoPulation
Winter Facultative pond optionmda, m2
Anaerobic pond alternativemda, m2
Anaerobic pond - 100Facultative pond 1,750 700Maturation pond 1 400 700Maturation pond 2 450 700Total mid depth area 2,600 2,200
taBle 7.5 soutHern nt Pond mid dePtH areas (mda), Winter 1,000 PoPulation
Winter Facultative pond optionmda, m2
Anaerobic pond alternativemda, m2
Anaerobic pond - 100Facultative pond 2,800 1,200Maturation pond 1 500 1,100Maturation pond 2 400 900Total mid depth area 3,700 3,300
In the southern climate Tennant Creek example above the faecal coliform discharge standard of less than 1,000 E. coli/100ml will not be met for the coldest month - an increase of 2˚C is required. In practice, actual sewage temperatures are likely to be more than 2˚C above the Bureau of Meteorology’s average air temperature for the coldest month. Mara (Darwin, 2010) recommends no more than two maturation ponds to avoid the risk of cyanobacteria (see Figure 3.5 for problems associated with lightly loaded ponds). However pond mixing (see Section 6.4) is likely to reduce the cyanobacteria and would support four maturation ponds needed for Alice Springs winter temperatures (12˚C).
The BOD of less than 20mg/L from an unfiltered effluent sample is close to 6mg/L if the algae (70%) are omitted. Algae in the final effluent, not the original sewage BOD, is the main contributor to organics in the final effluent.
The tables give the total pond mid-depth areas. To construct two parallel streams, the areas should be divided by two.
Building a larger facultative pond option first would allow later upgrading to an anaerobic option, by using a divided facultative pond.
If the design population is 3,000EP or 5,000EP, and all other parameters are the same, the pond mid-depth areas are 3 or 5 times the size for the 1,000 population, respectively.
The process calculations are given for the Top End in Appendix 1.
Drawings showing engineering design of the Top End facultative pond option are given in Appendix 2.
7.11 indiVidual Pond design
Individual WSP process analysis allows better data to be used for the process design. If raw sewage strength, pathogen levels and sewage flows can be determined from field measurement (see WSP Planning Manual) a more efficient design should result.
Secondly, sufficient confidence can be gained from the individual analysis to stage the construction of the ponds to match the flows. By building two streams, one stream may be built first to allow for delayed sewer connection rates. Alternatively, one or more of the final maturation ponds can be delayed if both streams are built as part of the first stage. Changes to sewage strength or flows can also be adjusted during the second phase.
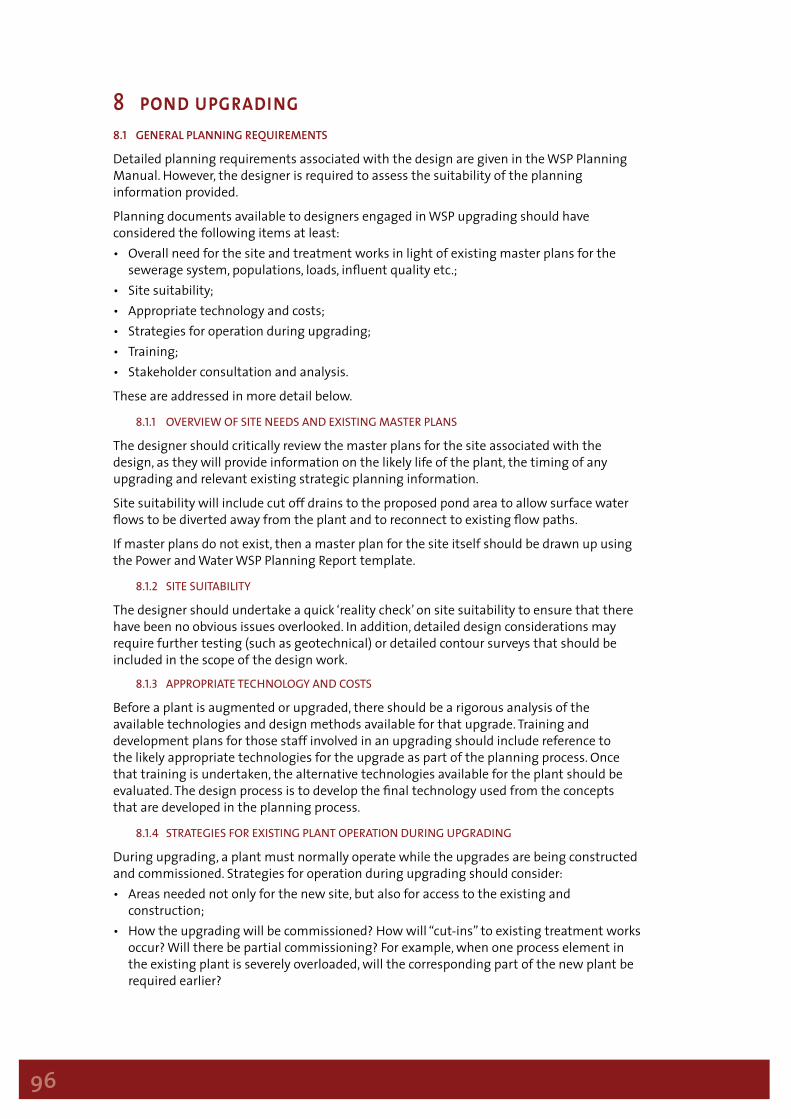
96
8 pond upgrading8.1 general Planning reQuirements
Detailed planning requirements associated with the design are given in the WSP Planning Manual. However, the designer is required to assess the suitability of the planning information provided.
Planning documents available to designers engaged in WSP upgrading should have considered the following items at least:• Overall need for the site and treatment works in light of existing master plans for the
sewerage system, populations, loads, influent quality etc.;• Site suitability;• Appropriate technology and costs;• Strategies for operation during upgrading;• Training;• Stakeholder consultation and analysis.
These are addressed in more detail below.
8.1.1 overvIew of SIte needS and exIStIng maSter planS
The designer should critically review the master plans for the site associated with the design, as they will provide information on the likely life of the plant, the timing of any upgrading and relevant existing strategic planning information.
Site suitability will include cut off drains to the proposed pond area to allow surface water flows to be diverted away from the plant and to reconnect to existing flow paths.
If master plans do not exist, then a master plan for the site itself should be drawn up using the Power and Water WSP Planning Report template.
8.1.2 SIte SuItabIlIty
The designer should undertake a quick ‘reality check’ on site suitability to ensure that there have been no obvious issues overlooked. In addition, detailed design considerations may require further testing (such as geotechnical) or detailed contour surveys that should be included in the scope of the design work.
8.1.3 approprIate teChnology and CoStS
Before a plant is augmented or upgraded, there should be a rigorous analysis of the available technologies and design methods available for that upgrade. Training and development plans for those staff involved in an upgrading should include reference to the likely appropriate technologies for the upgrade as part of the planning process. Once that training is undertaken, the alternative technologies available for the plant should be evaluated. The design process is to develop the final technology used from the concepts that are developed in the planning process.
8.1.4 StrategIeS for exIStIng plant operatIon durIng upgradIng
During upgrading, a plant must normally operate while the upgrades are being constructed and commissioned. Strategies for operation during upgrading should consider: • Areas needed not only for the new site, but also for access to the existing and
construction;• How the upgrading will be commissioned? How will “cut-ins” to existing treatment works
occur? Will there be partial commissioning? For example, when one process element in the existing plant is severely overloaded, will the corresponding part of the new plant be required earlier?
97power and water corporation waste stabilisation pond design manual
• Is there a seasonal difference in the performance of the ponds (such as between summer and winter and tourism). It is possible that during the summer period, there will not only be less inflow, due to inflow and infiltration, but also a much smaller pond area required due to the hotter temperatures. This should be checked by using the process assessment methods in Section 8. The analysis may well show that one or more parallel pond treatment trains can be taken out of service with no detrimental effect on pond performance. This makes upgrading works associated with that part of the plant simpler.
Involvement of operators is necessary for these questions to be answered during design.
8.1.5 traInIng
An outline training plan for both designers and operators should have been developed as part of the master-planning process. The designer is to develop this training plan to the point where it is able to provide a specification for the training provider to tender for. It should include training in the process, commissioning, operating, health (OH&S) and environmental responsibilities.
Where a training plan has not been developed, the designer should ascertain training requirements from the project officer.
8.2 data & PerFormance VeriFication
Pond upgrading frequently is undertaken under conditions of urgency. However, it is still essential to carry out influent and effluent sampling and flow monitoring to confirm actual flows and loads. The efficiency of the upgrading proposal depends upon factual data. The minimum data that should be obtained is:• 24 hour composite sampling over two working days and one at the weekend. The
optimum would be composite sampling over both seasons to build up reliable data;• Continuous influent and effluent flow monitoring for a month. The optimum would
be flow monitoring for two years to cover both seasons and the tourist and resident absentee populations.
Reduction in short circuiting from applying Shilton and Harrison inlet nozzle design may extend pond life to allow an optimum sampling programme to be undertaken.
Flow monitoring and sampling provide the support for decision making. The failure to sample and analyse raw sewage, when there is a detailed history of the final effluent, does not allow a process assessment to be completed.
Flow monitoring may show excess inflow and infiltration. Alternatively, a stronger sewage and lower flows may support pre-treatment by anaerobic ponds – generally a low cost and simple upgrade.
Failure to desludge when ponds are one quarter full often overloads the primary pond. Desludging a full primary pond may be sufficient to extend the capacity of the existing WSPs. Section 4.5 outlines desludging options.
8.3 Pond Hydraulic imProVements
Short circuiting from poor pond hydraulics or accumulation of excess sludge reduces the treatment capacity.
GPS drogues (see Appendix 4) are a low cost way to confirm flow patterns within the pond. The drogue float elevation should be 1/40th of the sock to reduce the influence of wind during the test. They can also be used to test the benefit of changes to the inlet and outlet hydraulic structures. Applying the Shilton and Harrison flow principles may provide sufficient performance improvement to allow time to implement an orderly upgrade programme.

98
Adjusting outlet weirs to the preferred levels (see Section 6.7) can reduce the carryover of solids and algae to the next pond and the final effluent. Scum boards provide protection from waves, calming the final effluent before discharge. This simple measure may be sufficient to meet the discharge licence conditions.
Trials to improve pond hydraulics will give confidence to any planned new structures.
Pond Hydraulics, Section 6, details other hydraulic improvements using baffle walls and mixers. These low cost solutions may be all that is necessary to meet discharge licence conditions.
8.4 additional Process caPacity
8.4.1 anaerobIC pond
Population projections beyond five years are little more than a guess. Upgrading of a pond scheme should be phased and in steps no more than seven years ahead.
Population data should be available from the Planning Report. If no such report has been commissioned, then the processes outlined in Power and Water’s WSP Planning Manual should be used.
Anaerobic pre-treatment (see Section 5.3) can provide, at low cost and in short time, relief to overloaded facultative ponds. Twin anaerobic ponds in parallel allow desludging to be undertaken without loss of treatment.
Public support for anaerobic ponds and methane collection is more likely with the current world climate change awareness. Mara (Darwin, 2010) states anaerobic ponds should always be used unless there are valid arguments not to.
8.4.2 pond CurtaInIng
Quite often facultative ponds have been oversized. Curtaining, to partition the pond into a facultative and maturation, will not increase the organic treatment capacity. However, it will improve the effluent quality, particularly that of the pathogens.
Curtaining can be undertaken without closing ponds using hawsers, floats and weighted plastic sheet (see Figure 6.6).
8.4.3 roCk fIlter
WSPs that are efficient but not in compliance with pathogen and nutrient discharge requirements can be helped by rock filters. Aerated rock filters, constructed in the final maturation pond, do require a power supply for the air compressors. Without aeration the filters are similar in performance to submerged wetlands (see Figure 4.2).
If it is not possible to place a filter in the final pond, then consideration of land purchases is required.
Rock filters should have a bypass mechanism for use when replacing the rock media.
The blocking of sunlight by the rock above the pond level reduces photosynthesis and lowers algae in the discharge. Pathogen and nutrient improvements in the order of 50% are likely.
Aerated rock filter design is given in Section 5.7.3.
8.4.4 wetlandS
Submerged wetlands are very similar to rock filters. Tanner (2006) has demonstrated that planted submerged wetlands have little long-term benefit to unplanted.
Submerged wetland design is given in Section 5.7.5.
Wetlands may require land acquisition. This is often a drawn out process, so it should be covered in the planning process. However, it may well be a significant portion of the project price and should be included in the project estimate.
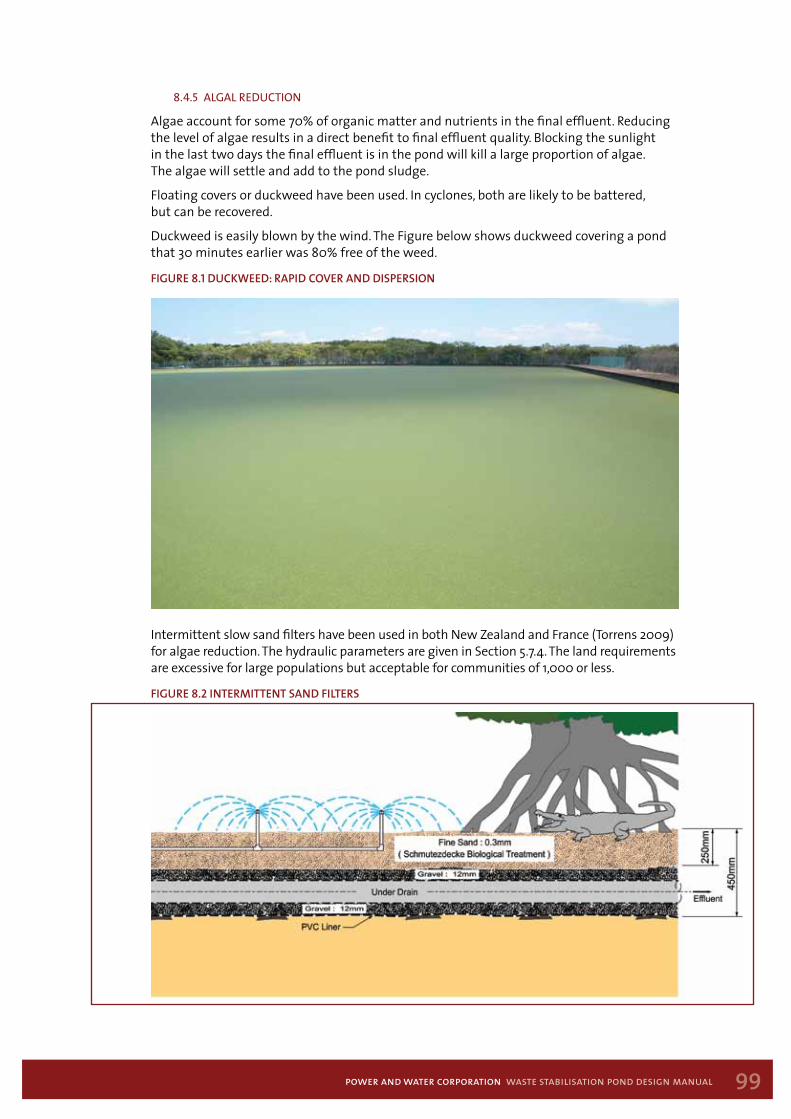
99power and water corporation waste stabilisation pond design manual
8.4.5 algal reduCtIon
Algae account for some 70% of organic matter and nutrients in the final effluent. Reducing the level of algae results in a direct benefit to final effluent quality. Blocking the sunlight in the last two days the final effluent is in the pond will kill a large proportion of algae. The algae will settle and add to the pond sludge.
Floating covers or duckweed have been used. In cyclones, both are likely to be battered, but can be recovered.
Duckweed is easily blown by the wind. The Figure below shows duckweed covering a pond that 30 minutes earlier was 80% free of the weed.
Figure 8.1 ducKWeed: raPid coVer and disPersion
Intermittent slow sand filters have been used in both New Zealand and France (Torrens 2009) for algae reduction. The hydraulic parameters are given in Section 5.7.4. The land requirements are excessive for large populations but acceptable for communities of 1,000 or less.
Figure 8.2 intermittent sand Filters
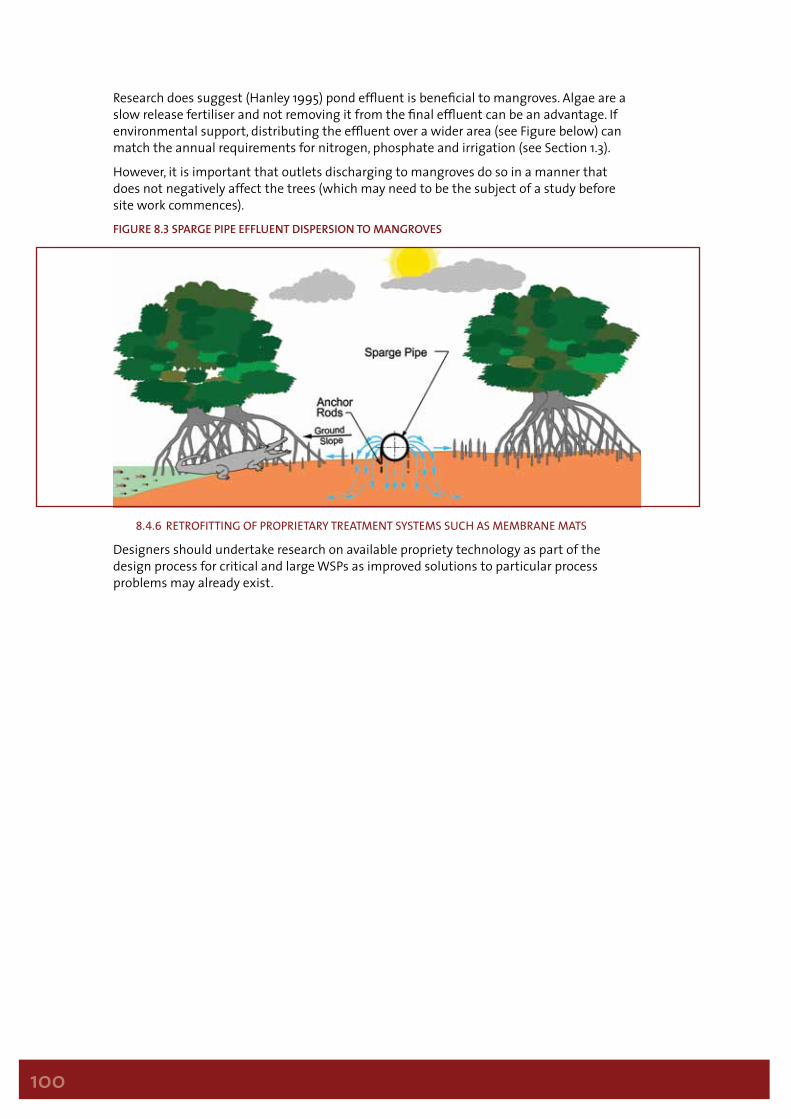
100
Research does suggest (Hanley 1995) pond effluent is beneficial to mangroves. Algae are a slow release fertiliser and not removing it from the final effluent can be an advantage. If environmental support, distributing the effluent over a wider area (see Figure below) can match the annual requirements for nitrogen, phosphate and irrigation (see Section 1.3).
However, it is important that outlets discharging to mangroves do so in a manner that does not negatively affect the trees (which may need to be the subject of a study before site work commences).
Figure 8.3 sParge PiPe eFFluent disPersion to mangroVes
8.4.6 retrofIttIng of proprIetary treatment SyStemS SuCh aS membrane matS
Designers should undertake research on available propriety technology as part of the design process for critical and large WSPs as improved solutions to particular process problems may already exist.
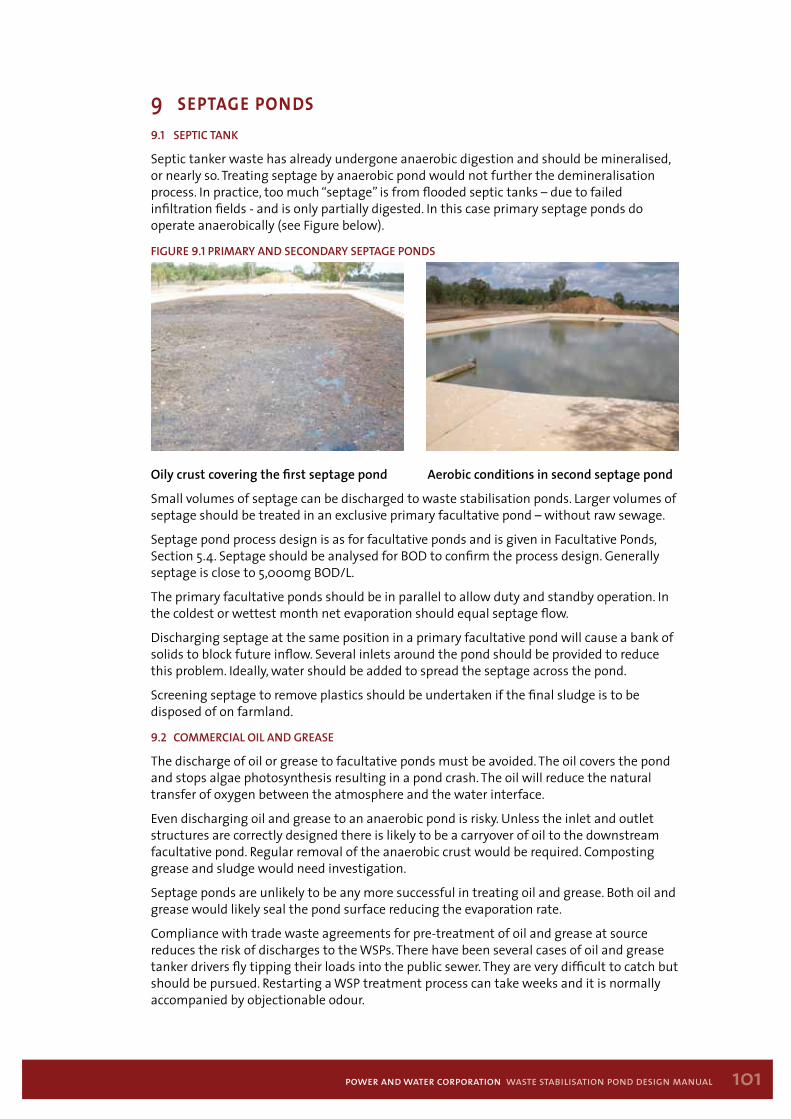
101power and water corporation waste stabilisation pond design manual
9 septage ponds9.1 sePtic tanK
Septic tanker waste has already undergone anaerobic digestion and should be mineralised, or nearly so. Treating septage by anaerobic pond would not further the demineralisation process. In practice, too much “septage” is from flooded septic tanks – due to failed infiltration fields - and is only partially digested. In this case primary septage ponds do operate anaerobically (see Figure below).
Figure 9.1 Primary and secondary sePtage Ponds
Oily crust covering the first septage pond Aerobic conditions in second septage pond
Small volumes of septage can be discharged to waste stabilisation ponds. Larger volumes of septage should be treated in an exclusive primary facultative pond – without raw sewage.
Septage pond process design is as for facultative ponds and is given in Facultative Ponds, Section 5.4. Septage should be analysed for BOD to confirm the process design. Generally septage is close to 5,000mg BOD/L.
The primary facultative ponds should be in parallel to allow duty and standby operation. In the coldest or wettest month net evaporation should equal septage flow.
Discharging septage at the same position in a primary facultative pond will cause a bank of solids to block future inflow. Several inlets around the pond should be provided to reduce this problem. Ideally, water should be added to spread the septage across the pond.
Screening septage to remove plastics should be undertaken if the final sludge is to be disposed of on farmland.
9.2 commercial oil and grease
The discharge of oil or grease to facultative ponds must be avoided. The oil covers the pond and stops algae photosynthesis resulting in a pond crash. The oil will reduce the natural transfer of oxygen between the atmosphere and the water interface.
Even discharging oil and grease to an anaerobic pond is risky. Unless the inlet and outlet structures are correctly designed there is likely to be a carryover of oil to the downstream facultative pond. Regular removal of the anaerobic crust would be required. Composting grease and sludge would need investigation.
Septage ponds are unlikely to be any more successful in treating oil and grease. Both oil and grease would likely seal the pond surface reducing the evaporation rate.
Compliance with trade waste agreements for pre-treatment of oil and grease at source reduces the risk of discharges to the WSPs. There have been several cases of oil and grease tanker drivers fly tipping their loads into the public sewer. They are very difficult to catch but should be pursued. Restarting a WSP treatment process can take weeks and it is normally accompanied by objectionable odour.
102
10 effluent reuse10.1 eFFluent reuse
Climate change has focused public opinion on the environment that they live in. In response, federal and state environmental regulators are encouraging water recycling schemes.
Water recycled from ponds is a valuable source of water and contains nutrients that have considerable benefit to farmers during the dry season. During the wet season, receiving waters can provide sufficient dilution to relax effluent discharge standards. However, the regulator may not agree to this.
The main financial limitations to water recycling in the north of Australia are:• Transferring the pond effluent to the farmer, or industry, at an economic price;• Persuading the farmers and industry to grow their produce or locate their industry
adjacent to the sewage works.
Alice Springs has in part overcome these limitations by pioneering aquifer recharge. Although using expensive tertiary treatment, dissolved air floatation (DAF), aquifer recharge overcomes the cost of transporting the effluent to farms if there is common access to the aquifer. There are less expensive tertiary treatment methods, such as intermittent slow sand filtration, that require trials to give confidence to the regulator.
10.2 eFFluent reuse standards
Effluent and Odour Standards, Section 1, prescribes effluent reuse parameters and monitoring requirements. Waste stabilisation ponds have the ability to reduce pathogen levels to log orders lower than activated sludge plants. Pond effluent often meets pathogen levels required for reuse (see Table 1.1) without further treatment.
10.3 agriculture
Farmers can save more than the required annual fertiliser quota by changing to WSP sewage effluent (Mara, 2003). Sewage effluent, compared to clean water plus fertilizer, can increase crop yield by 25% (see table below).
In addition, phosphorus is becoming increasingly scarce and costly. As the price of phosphorus increases, the value of pond effluent recycled with nutrients increases as well.
taBle 10.1 comParison oF croP Production By seWage eFFluent
Crop yield in tons per hectareWheat Moong Beans Potato
WSP effluent 3.45 0.78 22.31Water + NPK 2.70 0.72 17.16Yield increase 25% 8% 30%
Note: Source, Shende 1985.
Pond effluent for horticulture may prove more profitable than agriculture.
Application rates for three categories of soils are given in Section 1.3. The common failure of sewage effluent irrigation schemes are:• Over irrigation. Not allowing the crop to rest resulting in lower yield or even die back;• Excess nutrients. There is a limit to nutrient uptake before a crop is spoiled. Trees receiving
excess nitrogen produce additional branches that downgrade the timber to firewood;• Salinity, sodium absorption ratio (SAR), boron, pH and heavy metals are all factors that
can prevent a successful effluent reuse scheme and should be measured.
An approximate guide to effluent capital piping and pumping cost is $150,000/km of 100mm diameter main which will transfer some 1,000kL of effluent a day.

103power and water corporation waste stabilisation pond design manual
10.4 aQuaculture
Sewage ponds overseas are successfully used for fish farming and provide over 20% of demand in Calcutta. Fish yields range from 4 to 8 tons per hectare year.Human consumption of pond raised fish in Australia is very unlikely to receive public support but there may be acceptance of using pond-raised fish for animal feed. Fish raised in the ponds transfer nutrients locked up in the algae to the fish. The fish are removed from the ponds depleting the nutrients in the final effluent.The DHF has yet to set an effluent quality standard for aquaculture. Section 1.1 suggests WHO standard of zero trematode eggs per litre of effluent might be appropriate.The Department of Fisheries would need to be consulted for approved species that will not become a pest in Australian waters.
11 operations & maintenance11.1 Pond site oPerational manual
Designers should refer to pond operational manuals, where available, to ensure that designs are compatible with existing practices. Where differing work practices are foreshadowed in a design, the designer must discuss those differences with the project officer.This Section of the WSP Design Manual will highlight operational points. Detail is covered in PWC Waste Stabilisation Ponds Site Operational Manual.
11.2 asset condition and PerFormance
Designers need to be aware that many operational and maintenance problems stem from inadequate budgeting at the design stage. Inaccurate asset data on WSPs is common. As constructed drawings frequently do not report correct pond depths. The mid depth areas – the basis of pond process design - are not reported at all. The result often is poor pond operation and maintenance. Therefore, the design report should be as comprehensive as possible to enable operators to usefully compare the plant output with the design.
11.3 oPerational data
Asset management planning (AMP) is based on knowledge information. If flows and level of organic loads to a sewage works are not known, guesses are made in design, operations and for emergency action. Mostly, guesses result in excess capital expenditure or increased risk of failure. The capital and operational budgets are normally isolated and the benefit of spending on one cannot be reflected in the other. The WSP Planning Manual places importance on establishing flows, organic loads and other design data at the start of the project. The data allows the designer to reduce the operational and maintenance difficulties that would otherwise occur.
11.4 oPerational ProBlems
Consultation by the designer with operators at an early stage will avoid long standing operational problems, such as scum removal (see Figure below).
Figure 11.1 Pond scum remoVal ProBlems
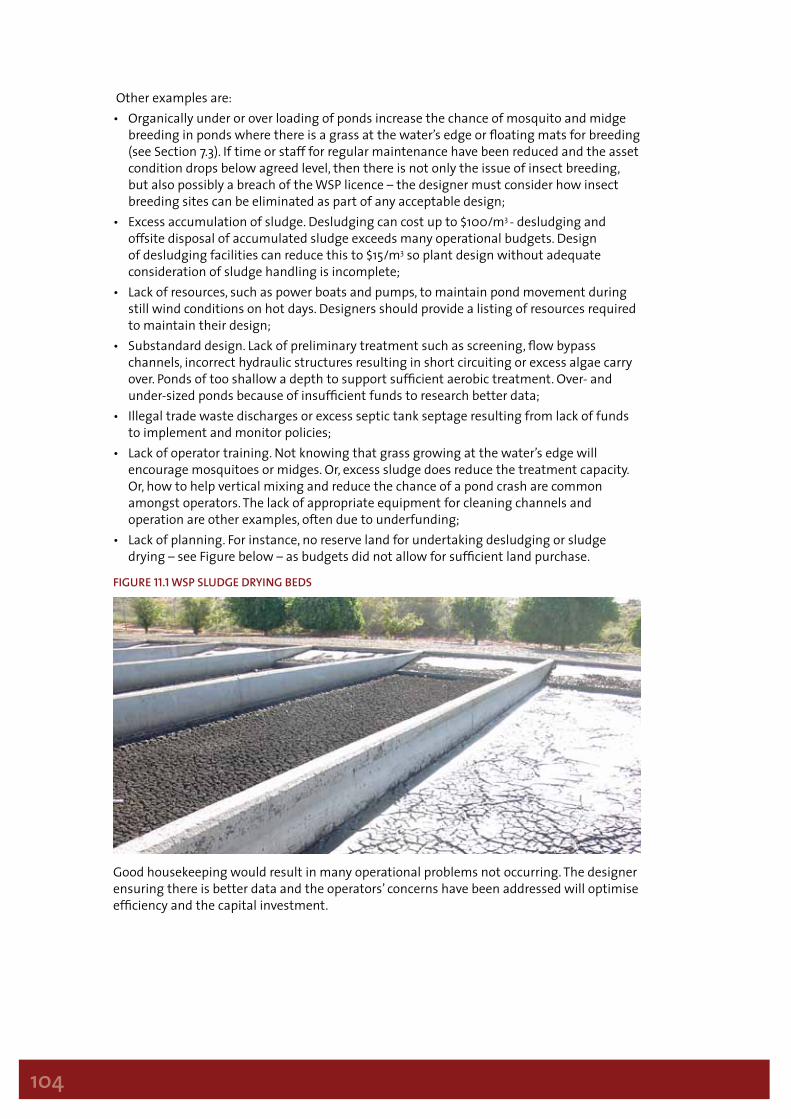
104
Other examples are:• Organically under or over loading of ponds increase the chance of mosquito and midge
breeding in ponds where there is a grass at the water’s edge or floating mats for breeding (see Section 7.3). If time or staff for regular maintenance have been reduced and the asset condition drops below agreed level, then there is not only the issue of insect breeding, but also possibly a breach of the WSP licence – the designer must consider how insect breeding sites can be eliminated as part of any acceptable design;
• Excess accumulation of sludge. Desludging can cost up to $100/m3 - desludging and offsite disposal of accumulated sludge exceeds many operational budgets. Design of desludging facilities can reduce this to $15/m3 so plant design without adequate consideration of sludge handling is incomplete;
• Lack of resources, such as power boats and pumps, to maintain pond movement during still wind conditions on hot days. Designers should provide a listing of resources required to maintain their design;
• Substandard design. Lack of preliminary treatment such as screening, flow bypass channels, incorrect hydraulic structures resulting in short circuiting or excess algae carry over. Ponds of too shallow a depth to support sufficient aerobic treatment. Over- and under-sized ponds because of insufficient funds to research better data;
• Illegal trade waste discharges or excess septic tank septage resulting from lack of funds to implement and monitor policies;
• Lack of operator training. Not knowing that grass growing at the water’s edge will encourage mosquitoes or midges. Or, excess sludge does reduce the treatment capacity. Or, how to help vertical mixing and reduce the chance of a pond crash are common amongst operators. The lack of appropriate equipment for cleaning channels and operation are other examples, often due to underfunding;
• Lack of planning. For instance, no reserve land for undertaking desludging or sludge drying – see Figure below – as budgets did not allow for sufficient land purchase.
Figure 11.1 WsP sludge drying Beds
Good housekeeping would result in many operational problems not occurring. The designer ensuring there is better data and the operators’ concerns have been addressed will optimise efficiency and the capital investment.
105power and water corporation waste stabilisation pond design manual
12 pilot pond projects12.1 PHilosoPHy and Planning
It is very difficult to have confidence in new ideas without direct experience. The theory of pond desludging is clear, but pond hydraulics requires more work. Implementing theory sometimes leads to project failure unless backed with practical pilot plant results. Personal experience in using pilot plants enables designers to explore better ways and establish firmer costs to support efficient use of money.
Large WSPs are critical assets. For critical assets, it is not acceptable to temporarily decommission a pond for desludging without being confident that the action is manageable. Without experience, desludging a live pond can lead to a “crash”.
Some of the necessary steps in considering, implanting and undertaking a pilot project are:• Decide on the matter under investigation that is to be piloted;• Consult with all parties from the regulator to the public;• Undertake a publication search to confirm what has already be achieved or may prejudice
the proposed pilot project results;• Specifically design the experimental program that will answer the questions raised in the
first step above;• Design the pilot plant and seek approvals not covered by the existing discharge licence;• Verify that the pilot plant will do the experimental work required - this may involve a
third party review, computer modelling or in the worst case, trial and error;• Estimate costs, time and other resources to undertake and review the final results from
the pilot project. Laboratory tests can be extensive and expensive when personnel time is included;
• Obtain formal approvals and budgets;• Run the experimental program;• Assess and repeat as necessary to obtain confidence in outputs;• Report and recommend;• Dismantle pilot equipment and restore site.
12.2 eFFluent imProVement
Failure of discharge licence conditions is the most common reason for pilot projects – that is, to find a solution to the failure. Improving the final effluent quality may be achieved by:• Additional primary treatment: this might be an anaerobic pond;• Introducing tertiary treatment: reducing the level of algae entering the receiving water
may be sufficient to achieve this. Section 5.7 outlines various possibilities, such as rock filters that may provided the necessary improvement;
• Improving pond hydraulics: to improve the efficiency of the expensive asset. This is discussed further below;
• Effluent reuse: to divert the effluent from the receiving water.
The pilot trials may need to extend to two seasons to ensure results are well correlated for temperature and wet weather conditions.
A frequent root cause of failure of pond improvement projects is not undertaking a pilot project to confirm manufacturers’ claims. There are many examples of claimed quality improvement technology that have been expensive or not even worked.

106
12.3 Hydraulic eFFiciency
Recent advances by Drs Shilton and Harrison have shown short circuiting is common in WSPs. Studies of several Australian ponds suggest no more than 30% of the pond’s area is supporting the treatment process. Simple methods of nozzle inlets, stub baffle walls and mixers can reduce short circuiting, stratification, blue green algae and lower effluent pathogen levels by more than one log order.
To improve pond hydraulics, pilot projects should use GPS drogues (see Appendix 4) to confirm flow patterns before and after pond modifications. Two dimensional mathematical modelling has been shown to be unpredictable for WSP hydraulics (Shilton 2003). More recent models have been developed by Professor Howard Fallowfield of Flinders University, Adelaide.
12.4 Pond desludging
WSP desludging may not occur for 5-10 years. When desludging is required, the costs can far exceed the previous years’ operation and maintenance costs combined.
Invariably, information is required on the extent of accumulated pond sludge, the most efficient methods of removal, dewatering and disposal and for formulating a desludging pilot project.
Possible desludging methods are discussed in Section 4.5. Costs of one tenth of conventional dredger and dewatering operations may be possible.
12.5 metHane collection
Gas collection can be undertaken by the simple addition of a cover over an anaerobic pond. Flaring the methane gas results in a less damaging green house gas. A successful pilot trial would give support to the use of anaerobic ponds at other WSPs.
Section 3.2.1 sets out the order of methane production and power available for heating or electricity generation.
12.6 collaBoration
Too often, the wheel is re-invented. Collaboration through the Australian Water Association, university research Departments and Co-operative Research Centres (CRCs) will often result in better solutions and understanding.
Channel Island Aquaculture could provide support to undertake trials in pond fish farming. Private companies engaged in horticulture or agriculture might be willing to support trial irrigation to support effluent reuse.
The research Departments in bodies such as the Arid Zone Research Institute and universities have repetitive experience in running pilot projects and, where needed, supported by cohort studies. Providing wide publicity of results through the Water Services Association of Australia benefits the country and encourages others to offer up their own experience.
107power and water corporation waste stabilisation pond design manual
13 monitoring and controlSection 11 on operations and maintenance, explains the importance of data to make decisions on pond operation, trouble shooting and process design.
The investment in ponds is often considerable. Running the ponds at less than optimal efficiency means that capital is sitting idle – with not only interest and depreciation costs, but also on-going maintenance of the unused portion of the plant.
Proposed investment programmes may add a similar amount, which may or may not be necessary if the data to support better design were available.
Monitoring all Power and Water WSPs influent and effluent, as tabled below, will provide information for better decisions and eventually more efficient ponds. Secondly, it will provide warning of operational problems and may give time to avoid pond failure.
It is also a requirement of most discharge licences that specific monitoring takes place, and reports submitted periodically to the regulator.
In addition, apart from planning and regulatory reasons for monitoring, operational control of WSPs is supported by monitoring of hydraulic, quality and weather data.
Monitoring of pond hydraulic and many of the process parameters is now possible even in remote communities via satellite. In fact, the ability to monitor and assess remotely will enable operators to tailor their expensive maintenance visits to these sites only when necessary, rather than on a time basis. This means that maintenance can be much more effective, as well as cheaper.
Similarly, control of the WSP processes can be achieved via satellite enabled Supervisory Control and Data Acquisition (SCADA).
The following parameters should be considered for monitoring at WSP:• Hydraulic grade line – the various pond outlet weir heights (or degree of outlet valve
opening) can be lowered or raised should there be a storm requiring higher than normal discharge, or should the regulator stipulate a time or tide height based discharge. Waste stabilisation ponds, because of their large relative storage, can discharge on high tides to maximise dilution and flushing, should that be required – something not available to other processes without further expensive storage;
• Inlet jet direction – controlling the inlet jet direction is one of the means of counteracting the effects of an adverse wind. Should the wind change, then the direction of the inlet jet may change so that short circuiting in the pond is stopped. The inlet jet also may be changed in direction periodically to remove the build up of scum or sludge in the pond – and hence to eliminate a potential source of mosquito breeding;
• Hydraulic mixer jet direction – If the design shows that there is significant wind and temperature effect on the pond, then in addition to the inlet jet, a horizontal hydraulic mixer (of the propeller variety) can be substituted for a baffle wall. (ie where a baffle wall can be placed using the Shilton – Harrison models, one can substitute a horizontally directed jet from a mixer). By varying the angle of the horizontal mixer, a very precise control of the pond hydraulics can be achieved. The second use of the horizontal mixer is to use a variable speed drive to vary the “length” of the horizontal plume. This has the same effect as varying the length of the pond baffle;
• Weather parameters such as rainfall, wind speed and direction and temperature;• Flows as per previous discussions;• Quality parameters on inlet and outlets.
Ideally, the design brief will detail which of these are required. However, if not, then the designer should consult with operators and planners to ascertain their requirements.
108
taBle 13.1 WsP control and monitoring Parameters
Parameter Control or Monitoring
Remote or Manual
Frequency
Video Camera MInflow MOutflow MLevel in primary pond MLevel in final maturation pond MTemperature MWind direction MWind velocity MRain MInlet SS MInlet BOD MInlet DO MInlet pH MInlet Chemical MInlet Bacteriological MOutlet SS MOutlet BOD MOutlet DO MOutlet pH MInlet jet angle C MInlet weir height/inlet valve opening percentage
C M
Horizontal mixer angle C MHorizontal mixer speed C MOutlet weir height/outlet valve opening percentage
C M
Note: the blank columns will be filled in based on the requirements of operators, planners and regulators. M: monitoring; C: control
In formulating the design brief, it is also essential that the monitoring and control system must be compatible, if not identical, with the existing system used by the pond operator.
In considering sampling at an early stage, the designer may be able to:• Avoid sampling in confined spaces;• Provide easy access, whether for vehicles or ramps instead of ladders for sampling;• Standardisation of equipment and procedures to reduce confusion and error in sampling
and monitoring. If a procedure does not already exist, justification should be provided;• Automate monitoring through SCADA.
109power and water corporation waste stabilisation pond design manual
The table below lists raw sewage sampling that should be undertaken for all WSPs.
taBle 13.2 WsP raW seWage samPling
Physical/chemical, monthly Microbiological, six monthlyImportant Used for design or
Lake NumberImportant Helpful
pH Conductivity Escherichia coli CyanobacteriaBOD COD HelminthTotal SS Volatile SSTemperature Dissolved SSContaminants Total dissolved
solidsAlkalinity HardnessTotal PReactive PTotal N Oxidised NAmmonia
Notes: BOD: biological oxygen demand; SS: suspended solids; N: Nitrogen
Constant raw sewage flow monitoring should be undertaken at all WSPs. Wet weather sampling, particularly in the Top End, currently shows raw sewage flows of one third strength (50mg BOD/L) of the dry season values. Understanding the seasonal variation in flows and strengths is essential to designing for the critical season.
Monitoring all PWC WSPs influent and effluent would provide information for better decisions and eventually more efficient ponds. Secondly, it would provide warning of operational problems and may give time to avoid pond failure.
It is also a requirement of most discharge licences that certain monitoring take place, and reports submitted periodically to the regulator.
110
14 cost estimates14.1 general
Pond project cost estimation should be based on an established method, such as that outlined in Rawlinson’s, or by the engagement of a quantity surveyor. The individual parts of the estimate which are specific to pond design can be obtained by comparison to similar projects elsewhere in Australia, suitably factored for the different locations (using a location index of the type employed by Rawlinson’s for example).
14.2 Financial and Programme Planning
Lack of budgeted funds or cost overruns compromise many WSP projects. To help with more reliable budgeting and programming a Check List (see Appendix 2) and WSP Design Report Template (see Appendix 3) have been prepared. Each project is different but all projects require a budget and programme.
Below are stage summary points that will assist in improving project costing and programming.
14.3 inVestigations and Planning
The early steps to a pond project cover:• Investigations, planning and internal costs;• Environmental Impact Statement (EIS) and Public Environmental Review (PER);• Consultancy services;• Research and Development (R&D) studies and reports;• Land surveys and sampling programmes.
These points are covered in more detail in the WSP Planning Manual.
14.4 Procurement oF contract serVices
The lead time and cost of consultancy services to take the outline of the project through discharge regulation and on to process design is often noticeably under estimated. If not otherwise able to be specified allow $5,000 or 1.0% of construction cost – whichever is the greater.
14.5 detailed design
Detailed design and preparation of tender documents leading to tendering is normally expensive, and repetitive when the client’s requirements are not followed. Better costing and programming will reduce the project completion time and within budget. If not otherwise able to be specified, allow $25,000 or 6% of construction cost – whichever is the greater.
14.6 construction & suPerVision
Attention is given to the construction programme and final costs. Variations to the contract should be limited to less than the provided contingency.
Budget constraints often do not allow adequate construction supervision. Compaction of soil embankments and installation of hydraulic structures are the most important construction items for WSPs. The integrity of the contractor may allow less daily supervision. If not otherwise able to be estimated, use $12,000 or 3% of construction cost – whichever is the greater.
14.7 oPerations
14.7.1 CoSt of operatIonS
Providing sufficient information on operational costs will confirm financial support for pond works. Budgets for operators to undertake monitoring and sampling should also be supported by provision of additional equipment. Small submersible pumps and GPS drogues for improved hydraulic performance, physical and chemical test kits, scum skimming bucket, screening skips, grass cutting tractors are prime items to support operations.
111power and water corporation waste stabilisation pond design manual
14.7.2 Staff traInIng
Generally, if operational staff does not receive sufficient training in the WSP process, the operational needs and problem solving required will not be achieved.
Designers should allow at least $1,500 per operator to be trained and $1,000 for ancillary personnel such as supervising engineers, and $2,000 for any laboratory training per technical officer undertaking laboratory work, if no better information is available.
14.7.3 aS ConStruCted drawIngS
Each operator should have his own set of A1 sized engineering drawings for each WSP scheme. Remote from an office, paper copies are still preferred on site for problem solving. Copies should be kept on site and electronic copies updated and made available to the operator. Without the drawings to refer to unnecessary and expensive mistakes will be made.
Marked up as-constructed drawings should be referred to designers to allow for feedback of design problems and areas where original designs needed to be changed. This assists the continuous improvement process.
Door stopper operation and maintenance manuals are discarded by operators. Developing an operations manual with the operators, secures their trust and interest. Therefore allow at least one meeting with operators for every six weeks of construction and every two weeks of commissioning time.
Allow $500 per drawing requiring modification for as-constructed information.
14.7.4 amp aSSet regIStratIon
Asset management planning (AMP) is the backbone of all budgeting and programming. AMP establishes the level of service to be met, the deficit in performance or condition on which to build remedial or new works. AMP justifies operational costs and reflects discharge licence conditions compliance or failure.
New WSP schemes require full registration with the asset register and AMP system. Often it is an expensive exercise in setting up the data. When delayed, weekly operational sampling data can be forgotten reducing the reliability.
A budget of $5,000 should be allowed for.
14.8 Post commissioning reVieW
Confirming the original design has worked in practice gives support for using the process again. If it has not worked in some respect, then designers need to be informed so that future designs can incorporate any lessons learned. A post commissioning review enables continuous improvement of the design of WSPs.
During the first year of operation, if sewage flows and loads are sufficient, quarterly reviews should confirm the success of the project. Notes can be drawn on cost saving measures for use in new schemes.
The following items are suggested for inclusion in a post commissioning review of WSPs:• Follow up GPS drogue study of hydraulic design;• Review of inflow quantity and quality;• Review of effluent quality against design;• Review of reliability of effluent quality;• Review of public and regulator issues:
o Insect breeding; o Odour problems; o Other issues as identified in the planning report;• Identify operational problems;• Review of operational costs.
Allow $10,000 for post-commissioning review if undertaken with local resources – add travel and accommodation costs if the review is to be undertaken by external reviewers.

112
15 referencesAyres, RM, Alabaster, GP, Mara, DD and Lee, DL (1992) A Design Equation for Human Intestinal Nematode Egg Removal in Waste Stabilisation Ponds, Water Research, vol 26, no 6, pp863-865
Council of the European Communities (1991a) Council Directive 91/271/EEC of 21 May 1991 Concerning Urban Waste Water Treatment, Official Journal of the European Communities, no L135, pp 40-52 (30 May)
Crites, RW, Middlebrooks, JE, Reed, CC, (2005), Natural Wastewater Treatment Systems, CRC Press
Curtis, TP, Mara, DD, Dixo, NGH, Silva SA, (1994), Light Penetration in Waste Stabilisation Ponds, Water Research, vol 28, no 5, pp1031-1038
The Department of the Environment, 2001, The Environmental guidelines for the establishment and maintenance of turf and grassed areas
Department of Health and Families, Northern Territory Government (2009a), DHF Requirements for the Design of Waste Stabilisation Ponds and the Associated Disposal or Recycling of Sewage Effluent. Environmental Health Fact Sheet 511
Department of Health and Families Northern Territory Government (2009b). Mosquito breeding and sewage pond treatment in the Northern Territory, Medical Entomology, Centre for Disease Control
Department of Health Western Australia (2006) Guidelines for the Use of Recycled Water in Western Australia
Department of Water, Government of Western Australia (2006), Water Quality Protection Note, Irrigation with nutrient-rich wastewater
Environment Protection Agency (2002) Wastewater Lagoon Construction, Environment Protection Agency of South Australia, Adelaide, SA
Environmental Protection Authority (2004) Guidance for the Assessment of Environmental Factors (in accordance with the Environmental Protection Act 1986), Separation Distances between Industrial and Sensitive Land Uses, Western Australia
Evans, C (2010) Unpublished work on pathogen die off
Feachem, R, Bradley, D, Garelick, H and Mara DD (1983) Sanitation and Disease: Health Aspects of Excreta and Wastewater Management, Chichester: John Wiley & Sons
Gray, NF (2004) Biology of Wastewater Treatment, Technology Engineering, pp1421
Hanley, R (1995) Environmental Monitoring of Effluent Disposal Systems Mangrove Productivity and Benthic Fauna First Year Report (1995), Museum Ecology Unit Museum and Art Gallery of the Northern Territory
Johnson, ML (2005) Aerated Rock Filters for Enhanced Ammonia and Faecal Coliform Removal from Facultative Pond Effluent, Journal of the Chartered Institution of Water and Environmental Management, vol 19, no 2, pp143-146
Kehl, O, Wichern, M, Lubken, M and Horn, H (2009) Analysis of design approaches for stabilisation ponds under different boundary conditions – A comparison, Ecological Engineering
Lawty, R, Ashworth J deB and Mara, DD (1996) Waste Stabilisation Pond Decommissioning: A painful but necessary decision, Water Science and Technology, vol 33, no 7, pp107-115
Mara, DD (1976) Sewage Treatment in Hot Climates, Chichester: John Wiley
Mara, DD and Cairncross, S (1989) Guidelines for the safe use of wastewater and excreta in agriculture and aquaculture, Geneva: The World Health Organization
Mara, DD and Pearson, HW (1998) Design Manual for Waste Stabilisation Ponds in Mediterranean Countries, Leeds: Lagoon Technology International

113power and water corporation waste stabilisation pond design manual
Mara, DD, Alabaster, GP, Pearson, HW and Mills, SW (1992) Waste Stabilisation Ponds: A Design Manual for Eastern Africa. Leeds: Lagoon Technology International
Mara, DD (2003) Domestic Wastewater Treatment in Developing Countries, London: Earthscan
Mara, DD, Pearson, HW, Oragui, J, Arridge, H and Silva, SA (2001), Development of a new approach to waste stabilisation pond design, Research Monograph No 5, School of Civil Engineering, University of Leeds
Marais, GvR (1974) Faecal bacterial kinetics in waste stabilisation ponds, Journal of the Environmental Engineering Division, American Society of Civil Engineers, vol 100, no EE1, pp119-13
Maynard HE, Ouki SK, Williams SC (1999), Tertiary lagoons: a review of removal mechanisms and performance, Water Research, 33 (1), pp1-13
McGarry, MG and Pescod, MB (1970) Stabilisation Pond Design Criteria for Tropical Asia, in McKinney, RE Proceedings of the Second International Symposium for Waste Treatment Lagoons, pp114-132, University of Kansas, Lawrence, KS
Melbourne Water (2002) Western Treatment Plant
Middlebrooks, EJ (1988) Review of Rock Filters for the Upgrade of Lagoon Effluents, Journal of the Water Pollution Control Federation, vol 60, no 9, pp1657-1662
Greenhouse Gases Continue to climb despite economic slump (2009), National Oceanic and Atmosphere Administration (2009), USA
Northern Territory Government, (2005) Department of Natural Resources, Environment and Arts, Environmental Guidelines for Locating New Wastewater Treatment Plant Outfalls
Oragui, JI, Arridge, H, Mara, DD, Pearson, HW and Silva, SA (1995) Vibrio cholerae O1 (El Tor) Removal in Waste Stabilisation Ponds in Northeast Brazil, Water Research, vol 27, no 4, pp727-728
Oswald, WJ, (1975) Waste Pond Fundamentals, unpublished paper, The World Bank Washington, DC
Oswald, WJ (1995) Introduction to Advanced Integrated Wastewater Ponding Systems, Water Science and Technology, vol 24, no 5, pp1-7
Pano, A and Middlebrooks, EJ (1982) Ammonia Nitrogen Removal in Facultative Waste Stabilisation Ponds, Journal of the Water Pollution Control Federation, vol 54, no 4, pp344-351
Penrose, H (2001) Werribee Farm: A History, 1892-2000, Melbourne Water, Melbourne
Pomeroy, D (1981), The problem of hydrogen sulphide in sewers, Clay Pipe Development Association Ltd, London
Power and Water Corporation (2008) Guidelines for Buffer Distances, Sewage Pumping, Treatment, Sludge Management, Effluent Reuse Schemes, Water Supply, Wellhead Protection and Chlorine Gas Installations
Ray, J (1678), English Proverbs
Reed, SC (1985) Nitrogen Removal in Wastewater Stabilisation Ponds, Journal of the Water Pollution Control Federation, vol 57, no 1, pp39-45
Sawyer, CN, McCarty, PL and Parkin, GF (2002) Chemistry for Environmental Engineering and Science, 4th ed, New York: McGraw-Hill
Shilton, AN, Harrison, J (2003b) Guidelines for the Hydraulic Design of Waste Stabilisation Ponds, Massey University, Palmerston North
Shuval, HI, Adin, A, Fattal, B, Rawitz, E and Yekutiel, P (1986) Wastewater Irrigation in Developing Countries: Health Effects and Technical Solutions, Technical Paper no 51, The World Bank, Washington DC

114
Silva, SA, de Oliveira, R, Soares, Mara, DD and Pearson HW (1995) Nitrogen removal in pond systems with different configurations and geometries, Water Science and Technology, vol 33, no 12, pp321-330
Sleigh, PA and Mara, DD (2003a) Monte Carlo Program for Facultative Pond Design, Leeds University
Sleigh, PA and Mara, DD (2003b) Monte Carlo Program for Estimating Disease Risks in Wastewater Reuse, Leeds University
Sweeney, DG, Nixon, JB, Cromar, NJ, Fallowfield, HJ (2005), Profiling and modelling of thermal changes in a large waste stabilisation pond,
Tanner, CC (2001) Plants as Ecosystems Engineers in Subsurface-flow Treatment Wetlands, Water Science and Technology, vol 44, no 11-12, pp9-17
Taylor, HD, Bastos RKX, Pearson, HW and Mara DD (1995) Drip Irrigation with Wastewater Pond Effluents: Solving the problem of Emitter Fouling, Water Science Technology, vol 31, no 12, pp417-424
Torrens, A, Molle, P, Boutin, C, Salgot M, (2009) Impact of design and operation variables on the performance of vertical flow constructed wetlands and intermittent sand filters treating pond effluent, Water Research 43, pp1851-1858
Toumi, A, Nejmeddine, A and El Hamouri, B (2000) Heavy Metal Removal in Waste Stabilisation Ponds and High Rate Ponds, Water Science and Technology, vol 42, no 10, pp17-21
US Environmental Protection Agency (1983) Municipal Wastewater Stabilisation Ponds. EPA-625/1-83-015
US Environmental Protection Agency (2004) Rock Media Polishing Filter for Lagoons,
Vaz da Costa Vargas, S and Mara, DD (1998) The Bacterial Quality of Lettuce and Alfalfa Spray-irrigation with Trickling Effluent, in Proceedings of Water Reuse Symposium IV: Implementing Water Reuse, pp739-801, AWWA Research Foundation, Denver, CO
von Sperling, M, (1999) Performance Evaluation and Mathematical Modelling of Coliform Die-off in Tropical and Subtropical Waste Stabilisation Ponds, Water Research, vol 33, no 6, pp1435-1448
von Sperling, M, Chernicharo, CAL, Soares, AME and Zerbini, AM (2002b) Coliform and Helminth Eggs Removal in a combined UASB Reactor – Baffled Pond System in Brazil: Performance evaluation and mathematical modelling, Water Science and Technology, vol 45, no 10, pp237-242
von Sperling, M, Chernicharo, CAL, Soares, AME and Zerbini, AM (2002b) Coliform and Helminth Eggs Removal in a combined UASB Reactor – Baffled Pond System in Brazil: Performance evaluation and mathematical modelling, Water Science and Technology, vol 45, no 10, pp237-242
Wildrig, DL, Peeples, JA, Manci, KM (1996), Intermittent Sand Filtration for Domestic Wastewater Treatment: Effects of filter depth and hydraulic parameters, American Society of Agriculture and Biological Engineers
World Health Organization (2006), Volume 2, Health Guidelines for the Use of Wastewater in Agriculture, Geneva: World Health Organization
Water Services Association of Australia (2002), Sewerage Code of Australia, Water Services Association of Australia.
World Health Organization (2006) Guidelines for the Safe Use of Wastewater, Excreta and Greywater. Volume 2: Wastewater use in Agriculture, Geneva: World Health Organization
Yadav, RK, Goyal, B, Sharma, RK, Dubey, SK and Minhas, PS (2002) Post Irrigation Impact of Domestic Sewage Effluent on Composition of Soils, Crops and Ground Water – a Case Study, Environmental International, vol 28, no 6, pp481-486
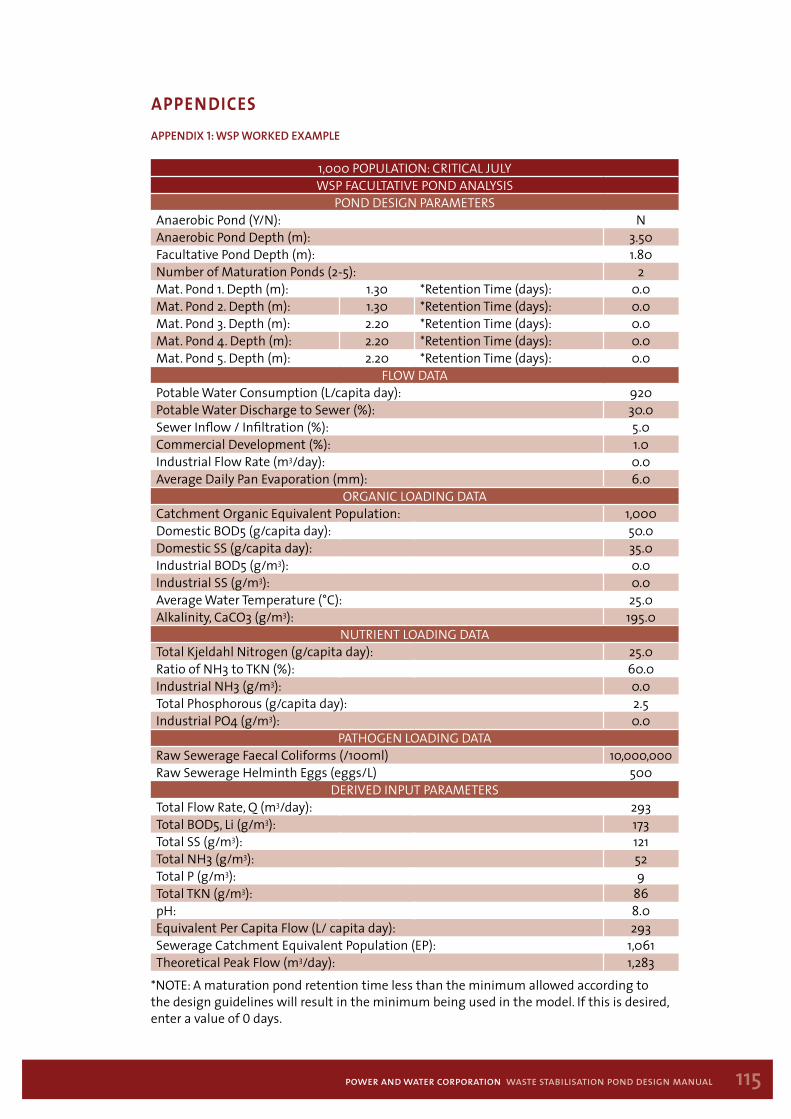
115power and water corporation waste stabilisation pond design manual
appendicesaPPendiX 1: WsP WorKed eXamPle
1,000 POPULATION: CRITICAL JULYWSP FACULTATIVE POND ANALYSIS
POND DESIGN PARAMETERSAnaerobic Pond (Y/N): NAnaerobic Pond Depth (m): 3.50Facultative Pond Depth (m): 1.80Number of Maturation Ponds (2-5): 2Mat. Pond 1. Depth (m): 1.30 *Retention Time (days): 0.0Mat. Pond 2. Depth (m): 1.30 *Retention Time (days): 0.0Mat. Pond 3. Depth (m): 2.20 *Retention Time (days): 0.0Mat. Pond 4. Depth (m): 2.20 *Retention Time (days): 0.0Mat. Pond 5. Depth (m): 2.20 *Retention Time (days): 0.0
FLOW DATAPotable Water Consumption (L/capita day): 920Potable Water Discharge to Sewer (%): 30.0Sewer Inflow / Infiltration (%): 5.0Commercial Development (%): 1.0Industrial Flow Rate (m3/day): 0.0Average Daily Pan Evaporation (mm): 6.0
ORGANIC LOADING DATACatchment Organic Equivalent Population: 1,000Domestic BOD5 (g/capita day): 50.0Domestic SS (g/capita day): 35.0Industrial BOD5 (g/m3): 0.0Industrial SS (g/m3): 0.0Average Water Temperature (°C): 25.0Alkalinity, CaCO3 (g/m3): 195.0
NUTRIENT LOADING DATATotal Kjeldahl Nitrogen (g/capita day): 25.0Ratio of NH3 to TKN (%): 60.0Industrial NH3 (g/m3): 0.0Total Phosphorous (g/capita day): 2.5Industrial PO4 (g/m3): 0.0
PATHOGEN LOADING DATARaw Sewerage Faecal Coliforms (/100ml) 10,000,000Raw Sewerage Helminth Eggs (eggs/L) 500
DERIVED INPUT PARAMETERSTotal Flow Rate, Q (m3/day): 293Total BOD5, Li (g/m3): 173Total SS (g/m3): 121Total NH3 (g/m3): 52Total P (g/m3): 9Total TKN (g/m3): 86pH: 8.0Equivalent Per Capita Flow (L/ capita day): 293Sewerage Catchment Equivalent Population (EP): 1,061Theoretical Peak Flow (m3/day): 1,283
*NOTE: A maturation pond retention time less than the minimum allowed according to the design guidelines will result in the minimum being used in the model. If this is desired, enter a value of 0 days.

116
Facultative Pond (Primary)POND DESIGN PARAMETERS
Retention Time (days): 8.9Depth (m): 1.8Mid-Depth Area (m2): 1,422
FLOW DATAInflow (m3/day): 293Outflow (m3/day): 284
ORGANIC REMOVALBOD Surface Loading (kg/ha day): 350BOD Removal (%): 77Effluent Unfiltered BOD Concentration (mg/L): 39
NUTRIENT REMOVALNH3 Removal (%): 34Effluent NH3 Concentration (mg/L): 34Total Nitrogen Removal (%): 53Effluent Total Nitrogen Concentration (mg/L): 41
PATHOGEN REMOVALE. coli Removal (%): 98.2Effluent E. coli Concentration (/100ml): 178,401Helminth Removal (%): 99.0Effluent Helminth Concentration (egg/L): 5.2
CUMULATIVE TOTAL REMOVALTotal BOD5 Removal (%): 77Total NH3 Removal (%): 34Total Nitrogen Removal (%): 53Total P Removal (%): -Total E. coli Removal (%): 98.2Total Helminth Removal (%): 99

117power and water corporation waste stabilisation pond design manual
Maturation Pond 1POND DESIGN PARAMETERS
Retention Time (days): 3.0Depth (m): 1.3Mid-Depth Area (m2): 651
FLOW DATAInflow (m3/day): 284Outflow (m3/day): 280
ORGANIC REMOVALBOD Surface Loading (kg/ha day): 170BOD Removal (%): 25Effluent Unfiltered BOD Concentration (mg/L): 29
NUTRIENT REMOVALNH3 Removal (%): 20Effluent NH3 Concentration (mg/L): 27Total Nitrogen Removal (%): 50Effluent Total Nitrogen Concentration (mg/L): 20
PATHOGEN REMOVALE. coli Removal (%): 94.9Effluent E. coli Concentration (/100ml): 9,096Helminth Removal (%): 89.8Effluent Helminth Concentration (egg/L): 0.5
CUMULATIVE TOTAL REMOVALTotal BOD5 Removal (%): 83Total NH3 Removal (%): 47Total Nitrogen Removal (%): 77Total P Removal (%): -Total E. coli Removal (%): 99.91Total Helminth Removal (%): 99.9
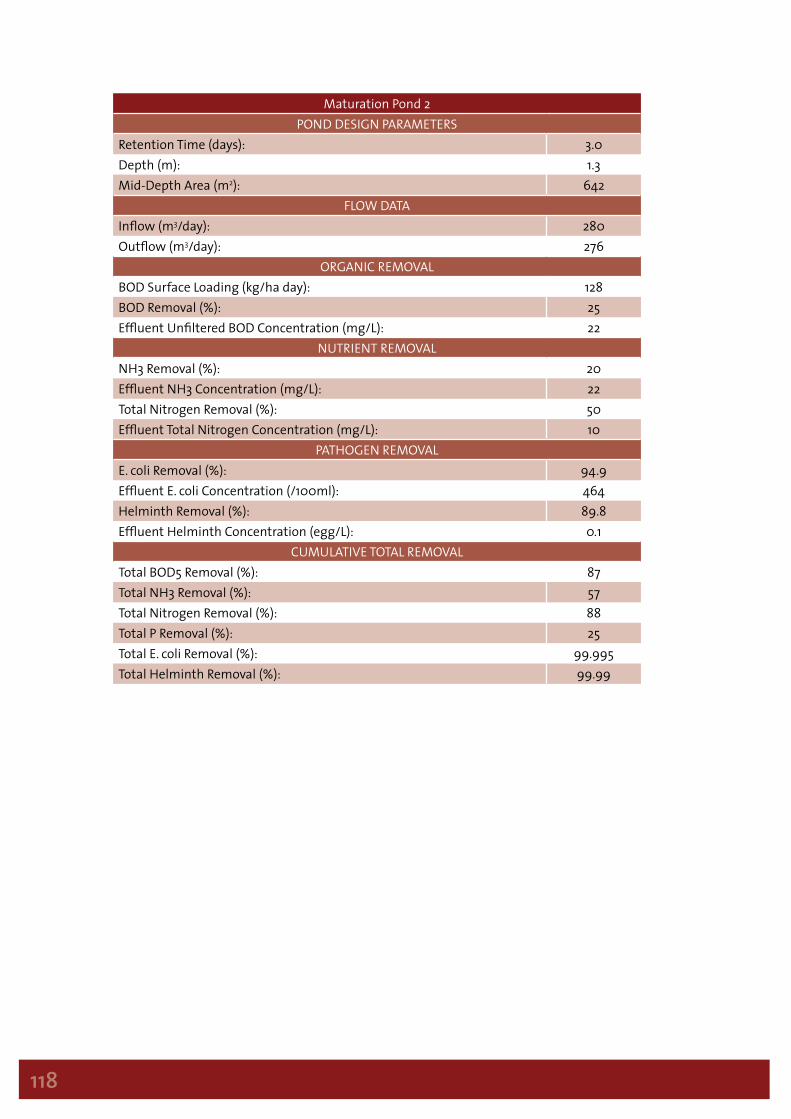
118
Maturation Pond 2POND DESIGN PARAMETERS
Retention Time (days): 3.0Depth (m): 1.3Mid-Depth Area (m2): 642
FLOW DATAInflow (m3/day): 280Outflow (m3/day): 276
ORGANIC REMOVALBOD Surface Loading (kg/ha day): 128BOD Removal (%): 25Effluent Unfiltered BOD Concentration (mg/L): 22
NUTRIENT REMOVALNH3 Removal (%): 20Effluent NH3 Concentration (mg/L): 22Total Nitrogen Removal (%): 50Effluent Total Nitrogen Concentration (mg/L): 10
PATHOGEN REMOVALE. coli Removal (%): 94.9Effluent E. coli Concentration (/100ml): 464Helminth Removal (%): 89.8Effluent Helminth Concentration (egg/L): 0.1
CUMULATIVE TOTAL REMOVALTotal BOD5 Removal (%): 87Total NH3 Removal (%): 57Total Nitrogen Removal (%): 88Total P Removal (%): 25Total E. coli Removal (%): 99.995Total Helminth Removal (%): 99.99
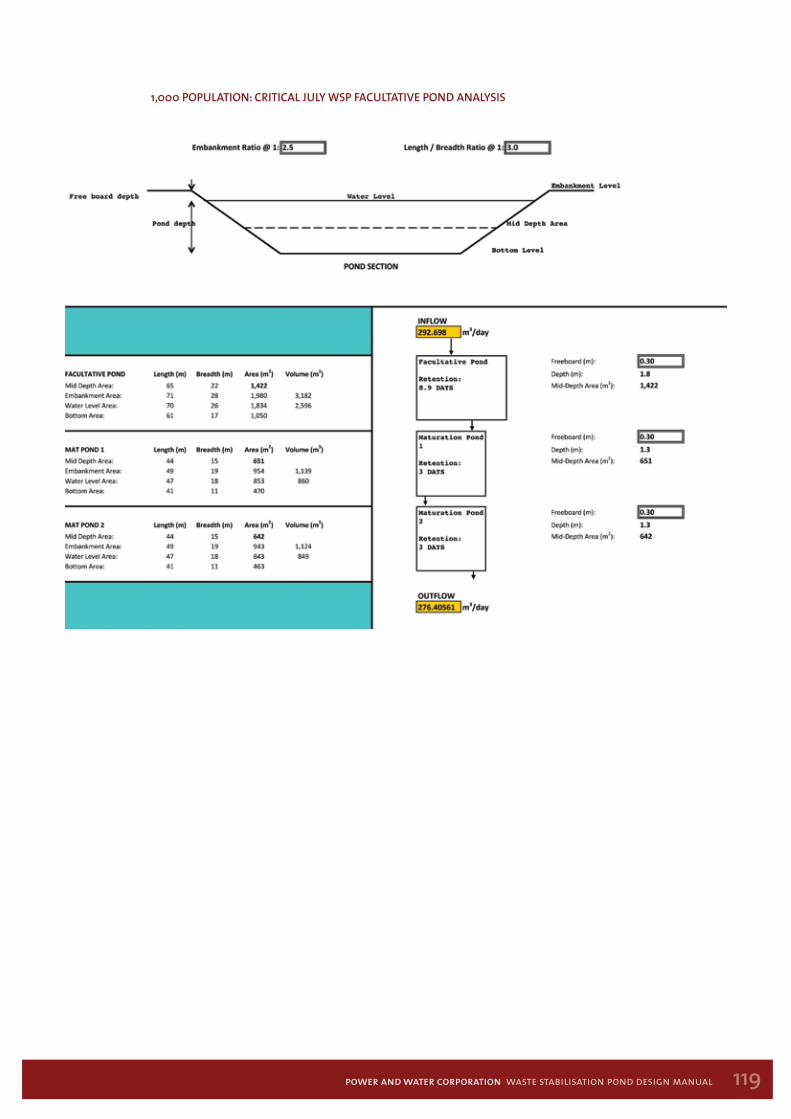
119power and water corporation waste stabilisation pond design manual
1,000 POPULATION: CRITICAL JULY WSP FACULTATIVE POND ANALYSIS
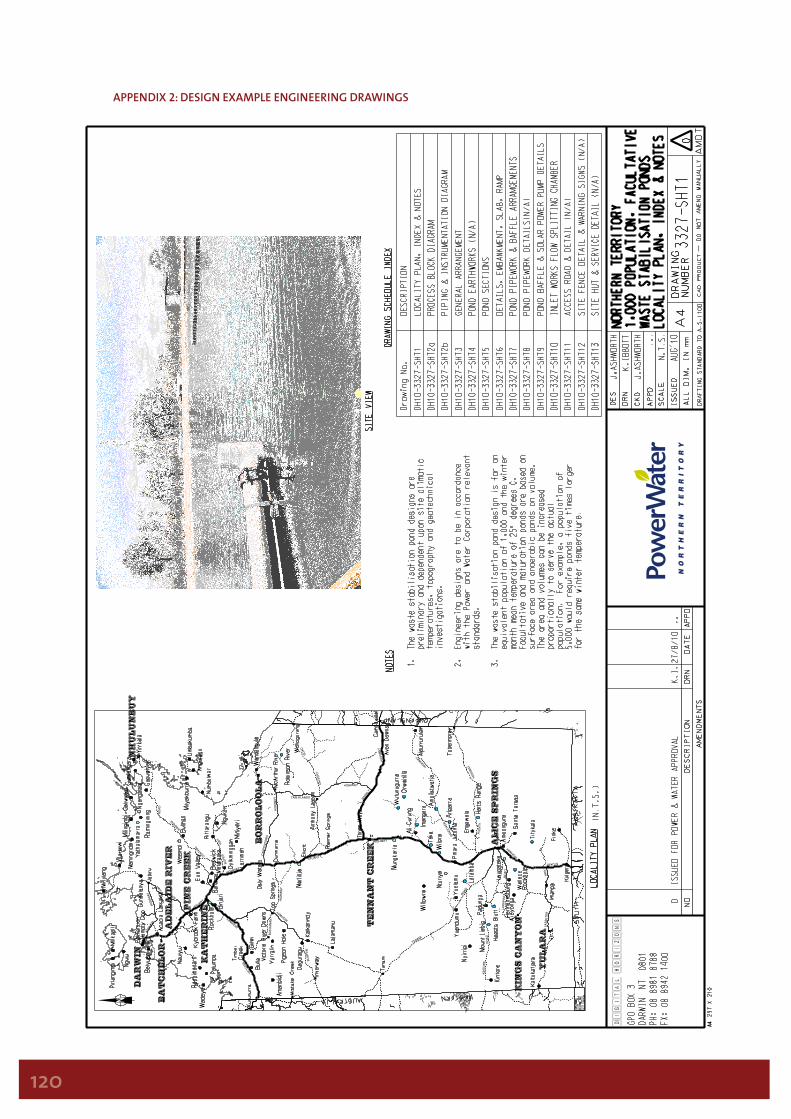
120
aPPendiX 2: design eXamPle engineering draWings
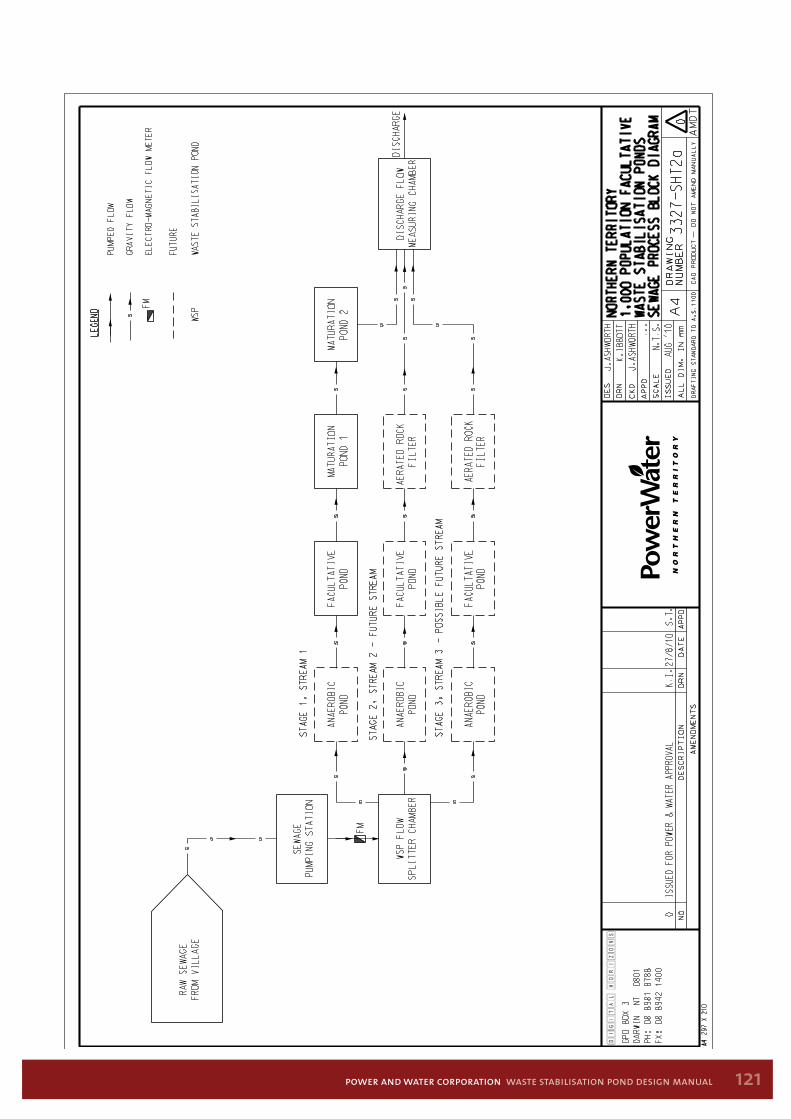
121power and water corporation waste stabilisation pond design manual
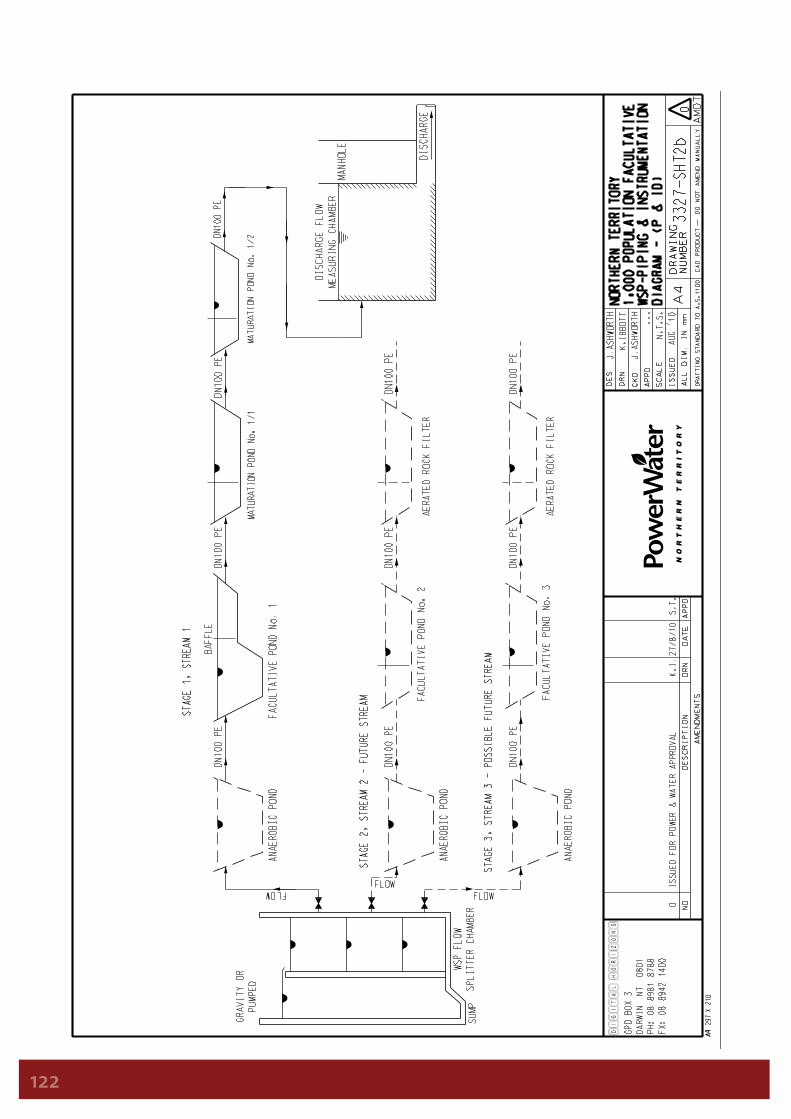
122
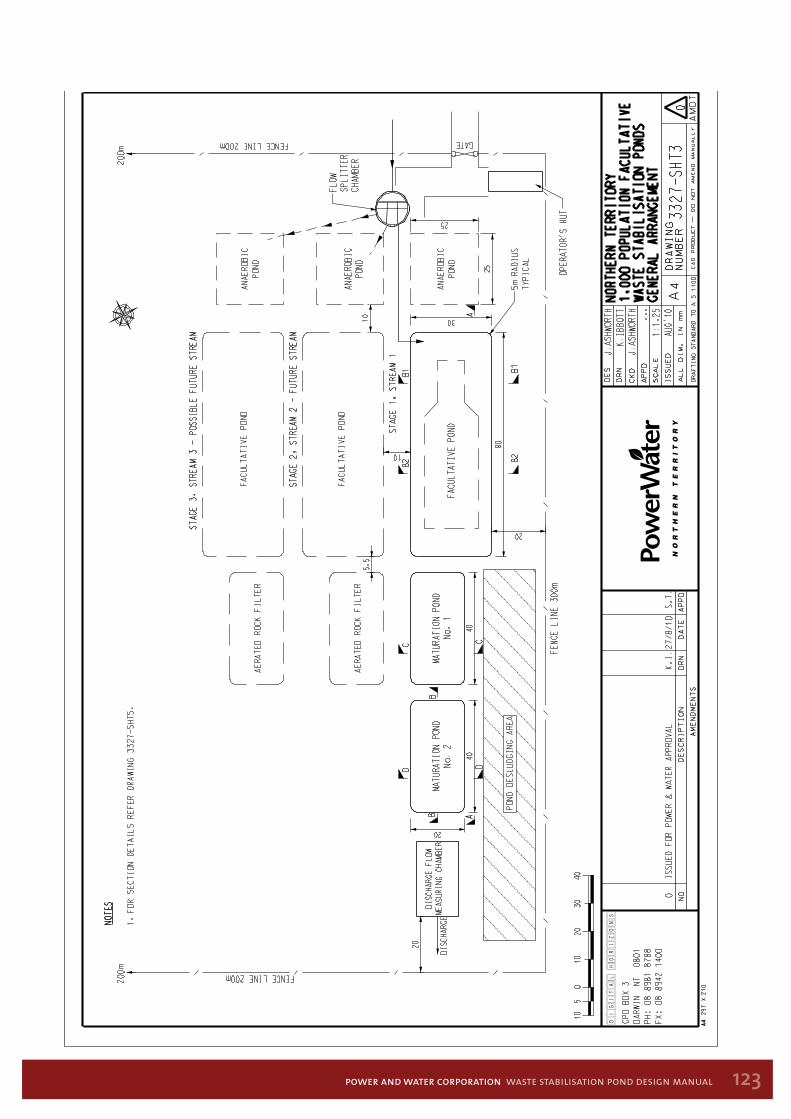
123power and water corporation waste stabilisation pond design manual
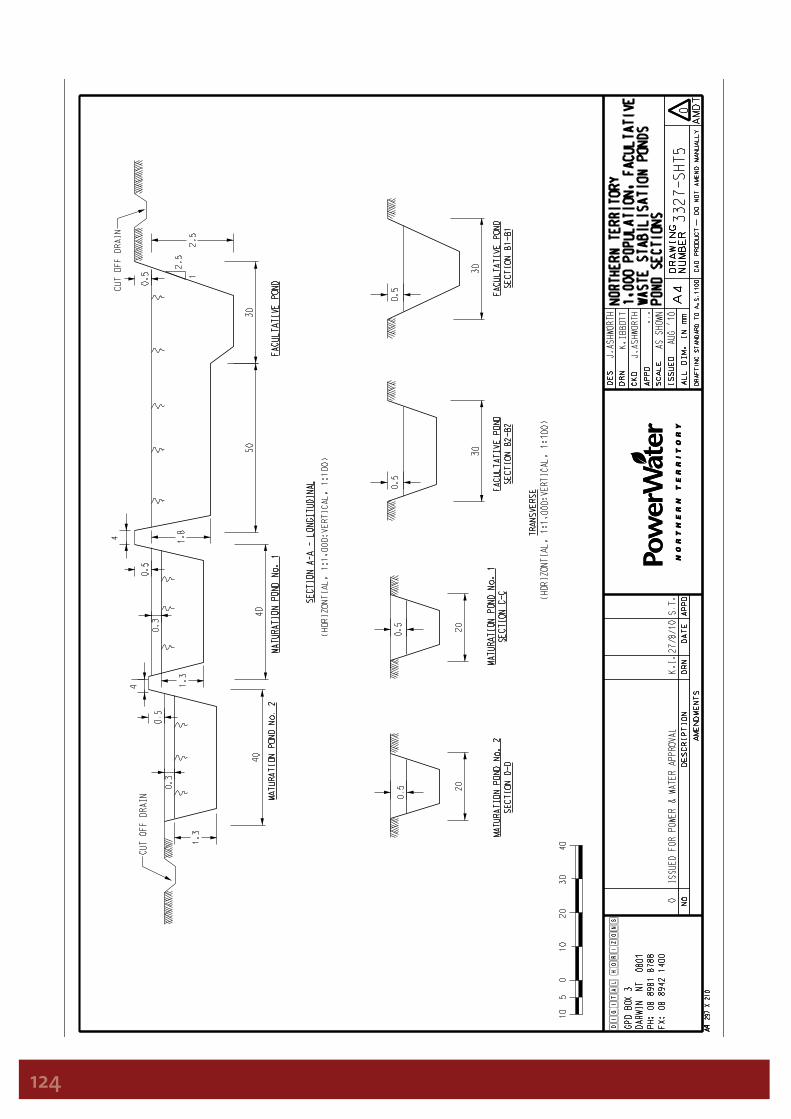
124
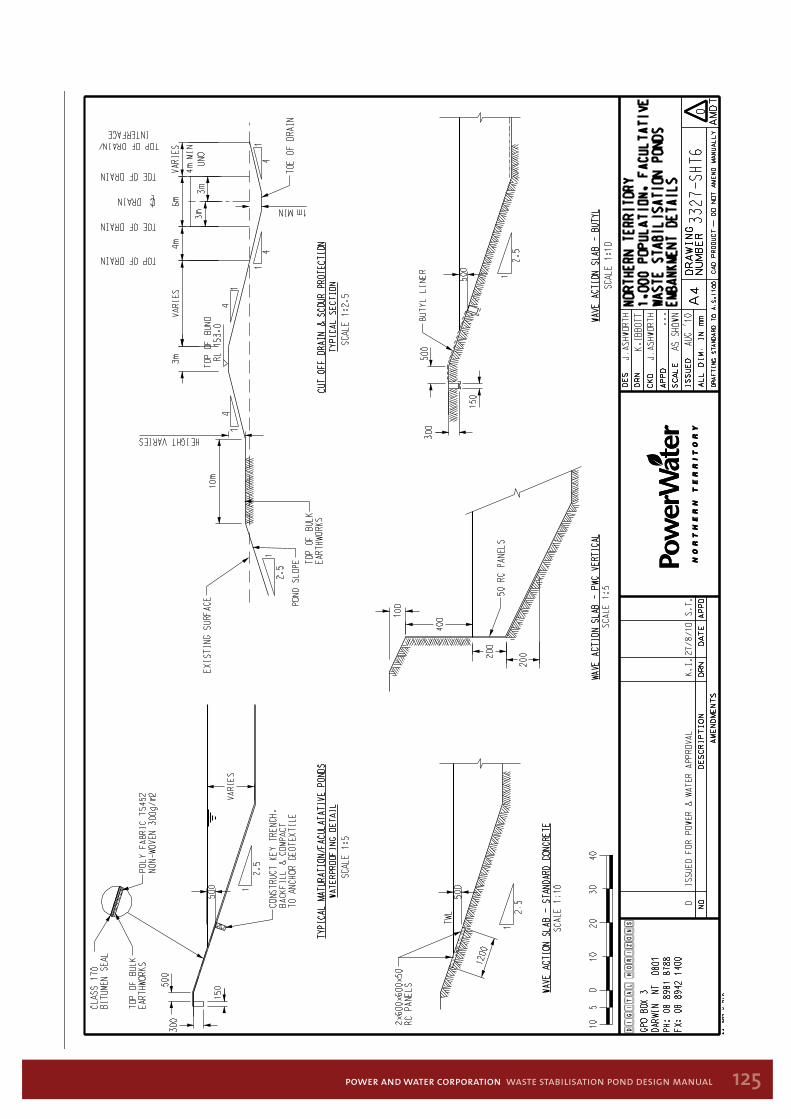
125power and water corporation waste stabilisation pond design manual

126
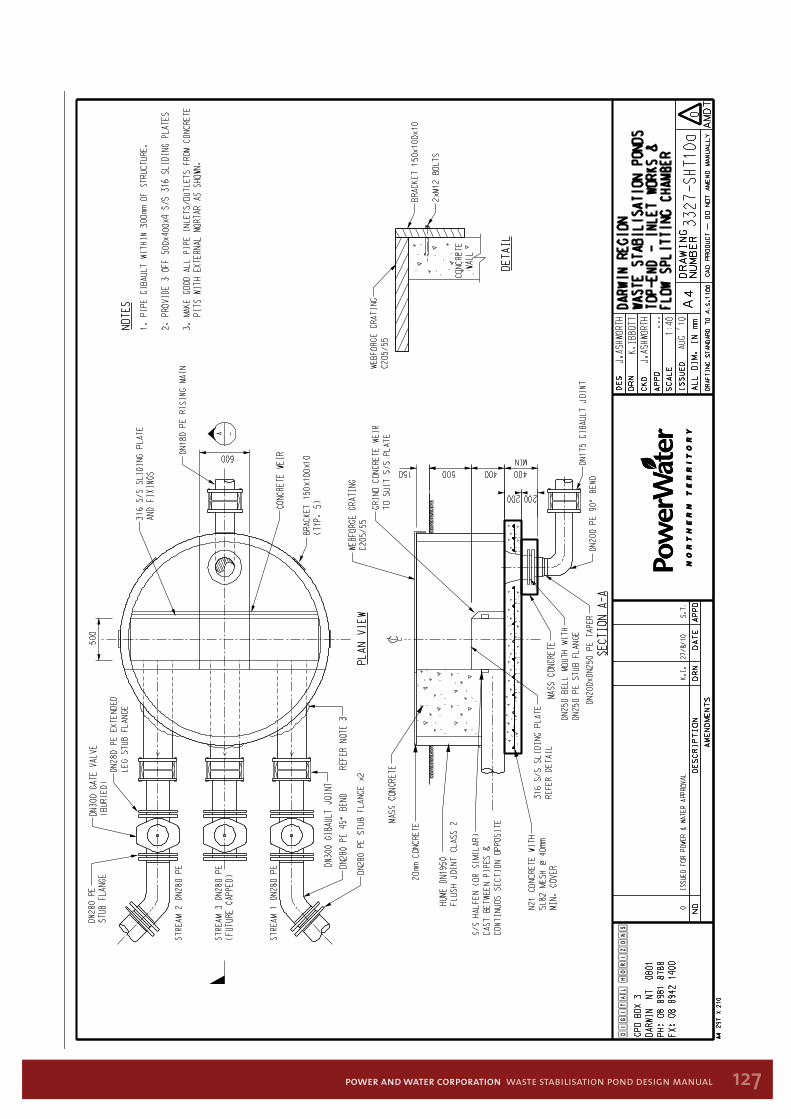
127power and water corporation waste stabilisation pond design manual
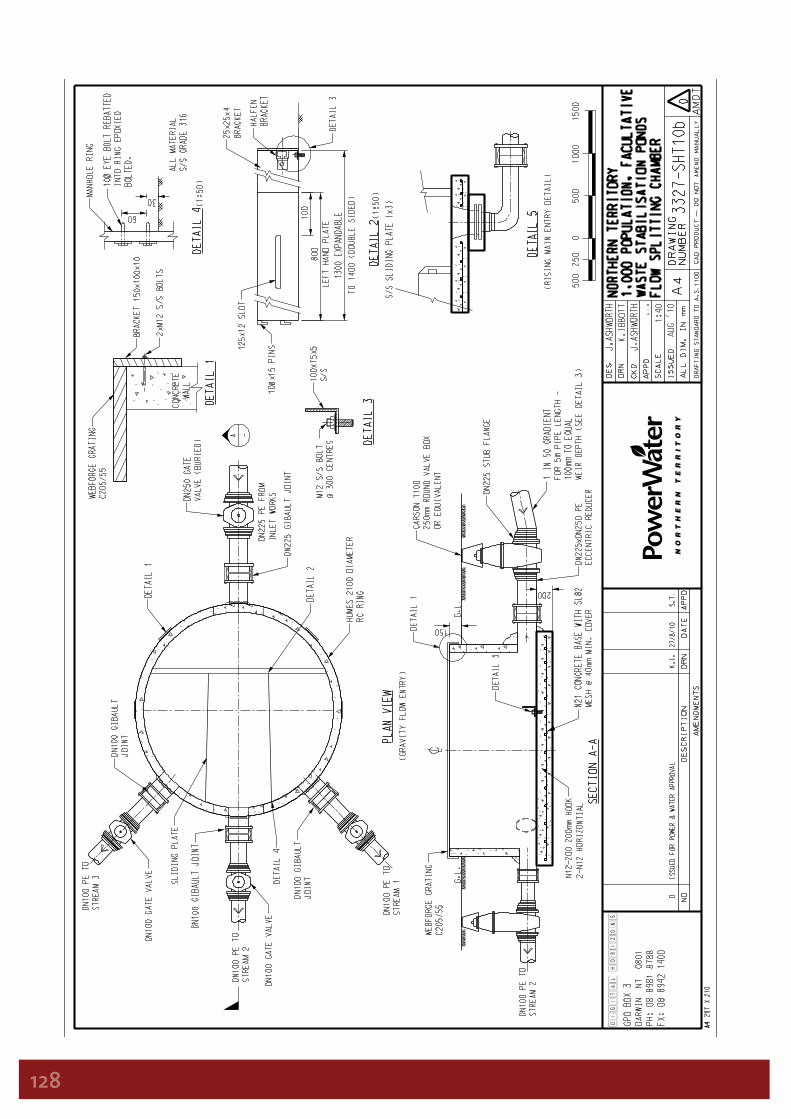
128
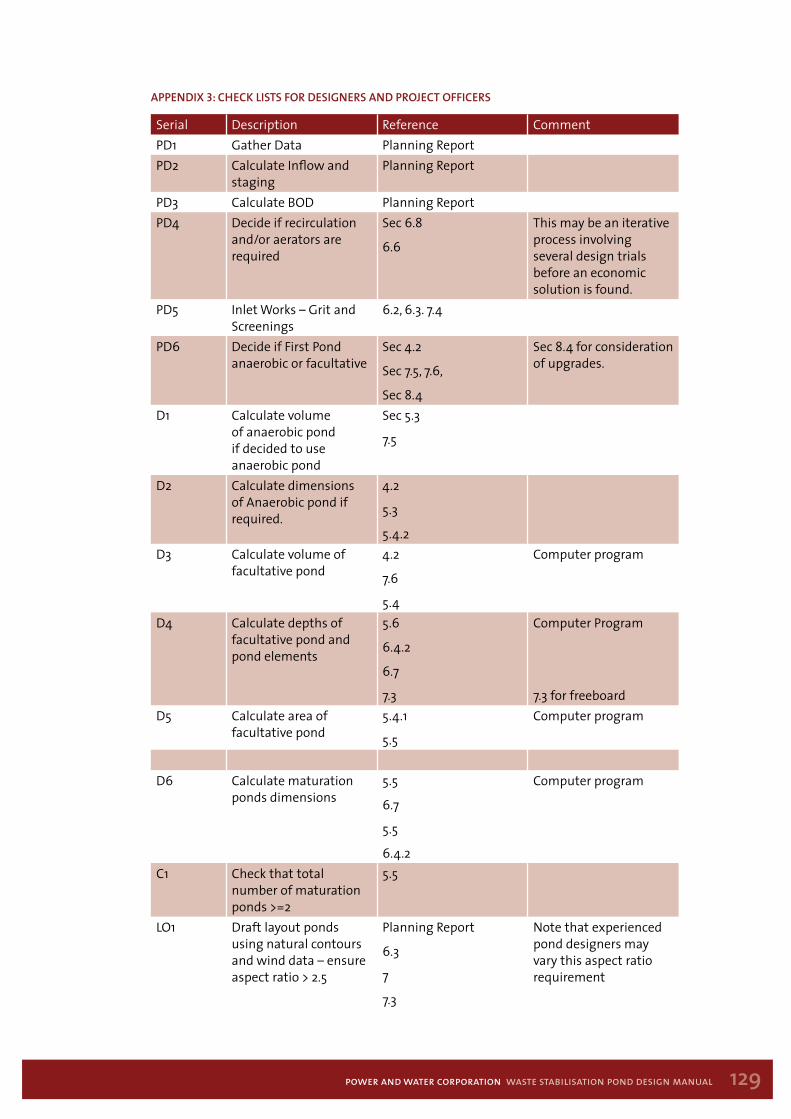
129power and water corporation waste stabilisation pond design manual
aPPendiX 3: cHecK lists For designers and Project oFFicers
Serial Description Reference CommentPD1 Gather Data Planning ReportPD2 Calculate Inflow and
stagingPlanning Report
PD3 Calculate BOD Planning ReportPD4 Decide if recirculation
and/or aerators are required
Sec 6.8
6.6
This may be an iterative process involving several design trials before an economic solution is found.
PD5 Inlet Works – Grit and Screenings
6.2, 6.3. 7.4
PD6 Decide if First Pond anaerobic or facultative
Sec 4.2
Sec 7.5, 7.6,
Sec 8.4
Sec 8.4 for consideration of upgrades.
D1 Calculate volume of anaerobic pond if decided to use anaerobic pond
Sec 5.3
7.5
D2 Calculate dimensions of Anaerobic pond if required.
4.2
5.3
5.4.2D3 Calculate volume of
facultative pond4.2
7.6
5.4
Computer program
D4 Calculate depths of facultative pond and pond elements
5.6
6.4.2
6.7
7.3
Computer Program
7.3 for freeboardD5 Calculate area of
facultative pond5.4.1
5.5
Computer program
D6 Calculate maturation ponds dimensions
5.5
6.7
5.5
6.4.2
Computer program
C1 Check that total number of maturation ponds >=2
5.5
LO1 Draft layout ponds using natural contours and wind data – ensure aspect ratio > 2.5
Planning Report
6.3
7
7.3
Note that experienced pond designers may vary this aspect ratio requirement
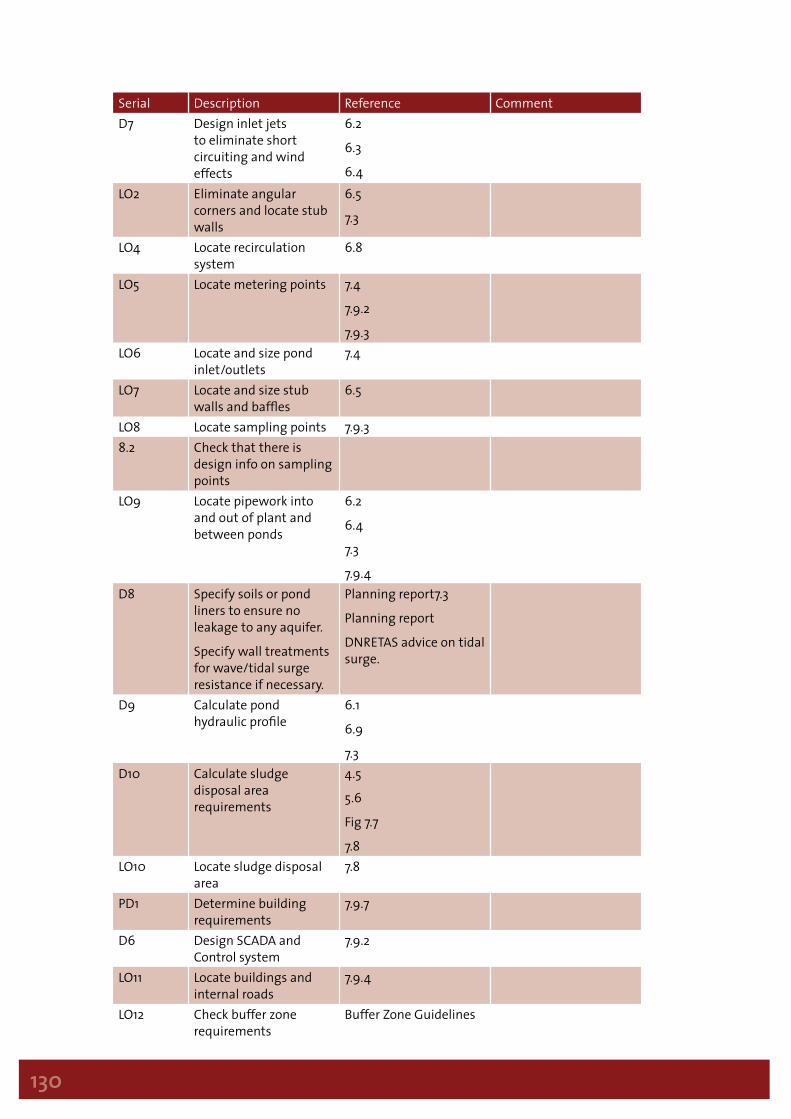
130
Serial Description Reference CommentD7 Design inlet jets
to eliminate short circuiting and wind effects
6.2
6.3
6.4LO2 Eliminate angular
corners and locate stub walls
6.5
7.3
LO4 Locate recirculation system
6.8
LO5 Locate metering points 7.4
7.9.2
7.9.3LO6 Locate and size pond
inlet/outlets7.4
LO7 Locate and size stub walls and baffles
6.5
LO8 Locate sampling points 7.9.38.2 Check that there is
design info on sampling points
LO9 Locate pipework into and out of plant and between ponds
6.2
6.4
7.3
7.9.4D8 Specify soils or pond
liners to ensure no leakage to any aquifer.
Specify wall treatments for wave/tidal surge resistance if necessary.
Planning report7.3
Planning report
DNRETAS advice on tidal surge.
D9 Calculate pond hydraulic profile
6.1
6.9
7.3D10 Calculate sludge
disposal area requirements
4.5
5.6
Fig 7.7
7.8LO10 Locate sludge disposal
area7.8
PD1 Determine building requirements
7.9.7
D6 Design SCADA and Control system
7.9.2
LO11 Locate buildings and internal roads
7.9.4
LO12 Check buffer zone requirements
Buffer Zone Guidelines

131power and water corporation waste stabilisation pond design manual
Serial Description Reference CommentLO13 Locate trees round
buildings and in relation to plant
7.9.5
LO14 Check that site aesthetics satisfy stakeholder requirements
7.9.1
LO15 Locate and specify fencing, external OH&S items (lifebuoys, hand rails, boats etc) and signage
7.9.5
7.9.6
LO16 Locate the SCADA and control system equipment and links
7.9.2
DOC1 Complete preliminary drawings
DOC2 Complete estimate 14DOC3 Complete design report
for approvalManual Part 1
DOC4 Complete final drawings other documentation including construction environmental management plan.
Construction mastertext specifications for concrete, earthworks.
Power and SCADA as per Power and Water Standards.
Typical documentation is construction and operational environmental management plans, AAPA approval applications, Waste Discharge Licence Applications
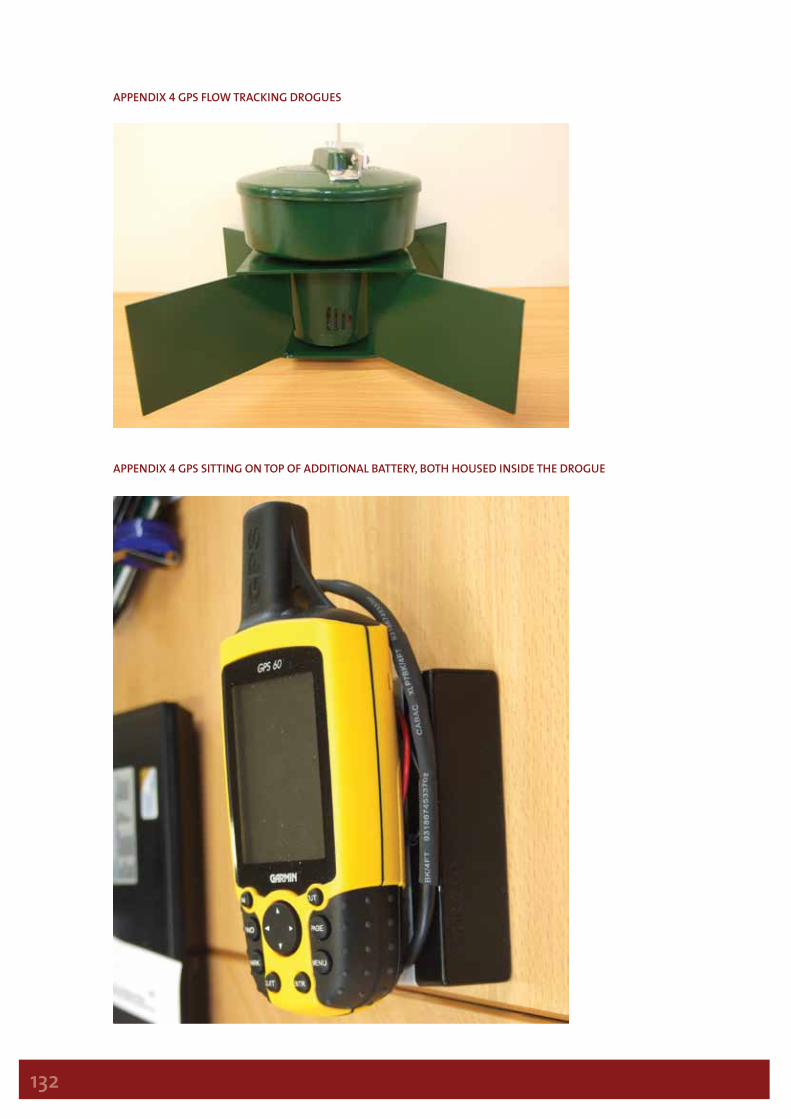
132
aPPendiX 4 gPs FloW tracKing drogues
aPPendiX 4 gPs sitting on toP oF additional Battery, BotH Housed inside tHe drogue

133power and water corporation waste stabilisation pond design manual
contact usCall 1800 245 092Email [email protected] powerwater.com.auFollow PowerWaterCorp on TwitterABN 15 947 352 360
Head oFFice
Level 2, Mitchell Centre55 Mitchell Street, Darwin
GPO Box 1921
Darwin NT 0801
customer serVice centres
Shop 28, Ground Floor, Mitchell Centre55 Mitchell Street, Darwin
Shop 21, Palmerston Shopping Centre10 Temple Terrace, Palmerston
Ground Floor, Government Centre5 First Street, Katherine
Ground Floor, Government Centre
Peko Road, Tennant Creek
Shop 8, Alice Plaza36 Todd Mall, Alice Springs

134


