36
1 Clean Environment Commission - January 2003 Wastewater Effluent License Limits Wastewater Effluent License Limits

1Clean Environment Commission - January 2003
Wastewater Effluent License Limits
Wastewater Effluent License Limits

2Clean Environment Commission - January 2003
Effluent License LimitsEffluent License Limits
OUTLINEWastewater Treatment
BackgroundLicensing Considerations
Typical Effluent ParametersManitoba Conservation Limits
Design and PerformanceBiochemical Oxygen Demand
Dr. J. Oleszkiewicz – parameter selectionPerformance HistoryRiver Monitoring
Total Suspended SolidsMicrobiological
Appropriate Limits for Winnipeg
3Clean Environment Commission - January 2003
Effluent License LimitsEffluent License Limits
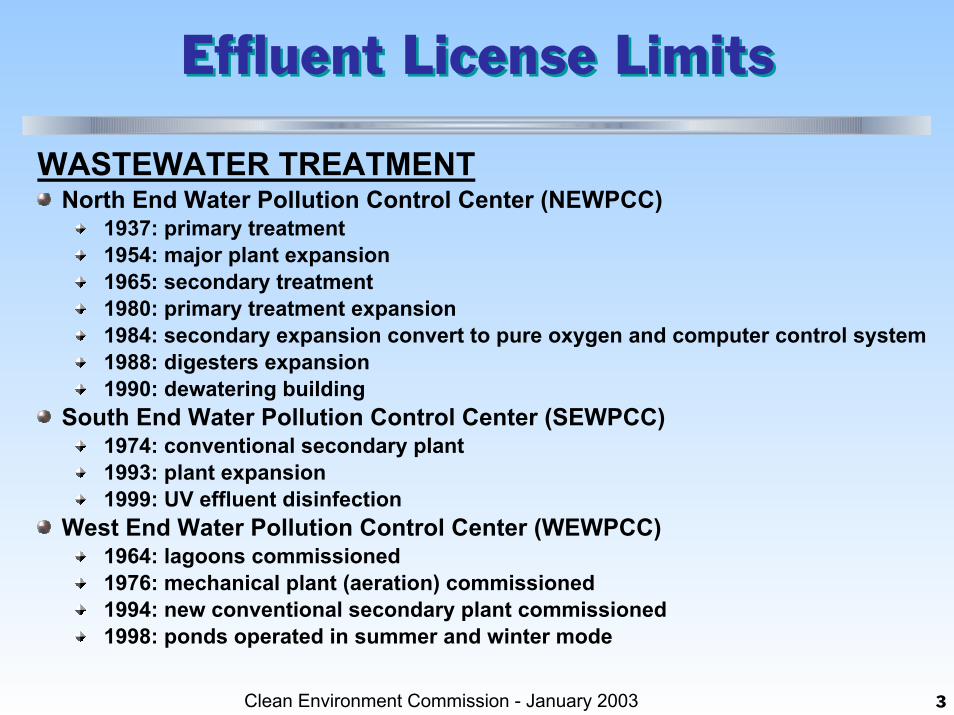
WASTEWATER TREATMENTNorth End Water Pollution Control Center (NEWPCC)
1937: primary treatment1954: major plant expansion1965: secondary treatment1980: primary treatment expansion1984: secondary expansion convert to pure oxygen and computer control system1988: digesters expansion 1990: dewatering building
South End Water Pollution Control Center (SEWPCC)1974: conventional secondary plant1993: plant expansion1999: UV effluent disinfection
West End Water Pollution Control Center (WEWPCC)1964: lagoons commissioned1976: mechanical plant (aeration) commissioned1994: new conventional secondary plant commissioned1998: ponds operated in summer and winter mode

4Clean Environment Commission - January 2003
Effluent License LimitsEffluent License Limits
WASTEWATER TREATMENTInvested more than $200 Million since 1978 in wastewater treatment
Modern state-of-the-art facilities Almost entirely funded by sewer charges

5Clean Environment Commission - January 2003
Effluent License LimitsEffluent License Limits
WASTEWATER TREATMENTAll three Water Pollution Control Centers provide conventional secondary treatment
Provides best practical secondary treatmentDesigned to remove the carbonaceous content90 to 95 % removal of contaminants100% of dry weather flowsNatural physical and biological processes used in treatment
Disinfection of final effluentUltraviolet disinfection in place at SEWPCCExisting WEWPCC polishing ponds provide disinfectionNEWPCC planned for 2005

6Clean Environment Commission - January 2003
Effluent License LimitsEffluent License Limits
86,000160,000374,000Population Served
32
27
WEWPCC
59
50
SEWPCC
160ADWF Recorded in 2002
302ADWF Design Capacities
NEWPCC
ADWF = Average Dry Weather Flow (ML/d)

7Clean Environment Commission - January 2003
Effluent License LimitsEffluent License Limits
photo: In Fisherman Magazine, Brainerd MNphoto: In Fisherman Magazine, Brainerd MN
LICENSING CONSIDERATIONSProtect River’s health and beneficial uses
Aquatic lifeDissolved Oxygen (DO),
Relates to biochemical oxygen demand (BOD)
Other constituents, Ammonia (NH3 )Total suspended solids (TSS)Nutrients Nitrogen (N) and Phosphorus (P)
RecreationMicrobiological, Fecal coliforms (FC)
8Clean Environment Commission - January 2003
Effluent License LimitsEffluent License Limits
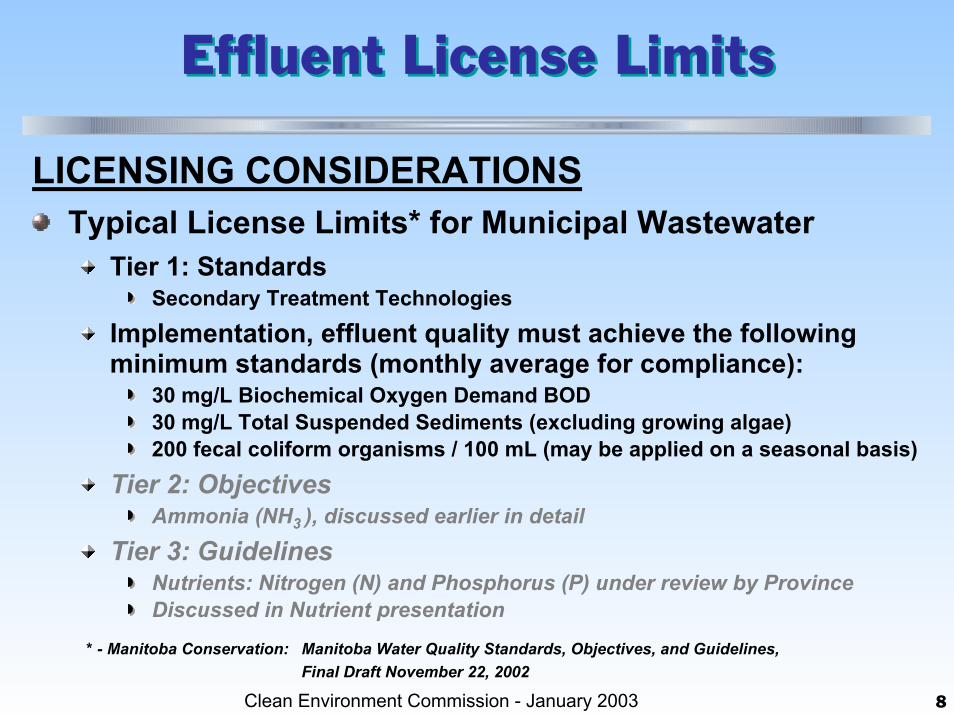
LICENSING CONSIDERATIONSTypical License Limits* for Municipal Wastewater
Tier 1: Standards Secondary Treatment Technologies
Implementation, effluent quality must achieve the following minimum standards (monthly average for compliance):
30 mg/L Biochemical Oxygen Demand BOD 30 mg/L Total Suspended Sediments (excluding growing algae)200 fecal coliform organisms / 100 mL (may be applied on a seasonal basis)
Tier 2: Objectives Ammonia (NH3 ), discussed earlier in detail
Tier 3: GuidelinesNutrients: Nitrogen (N) and Phosphorus (P) under review by ProvinceDiscussed in Nutrient presentation
* - Manitoba Conservation: Manitoba Water Quality Standards, Objectives, and Guidelines, Final Draft November 22, 2002
9Clean Environment Commission - January 2003
Effluent License LimitsEffluent License Limits
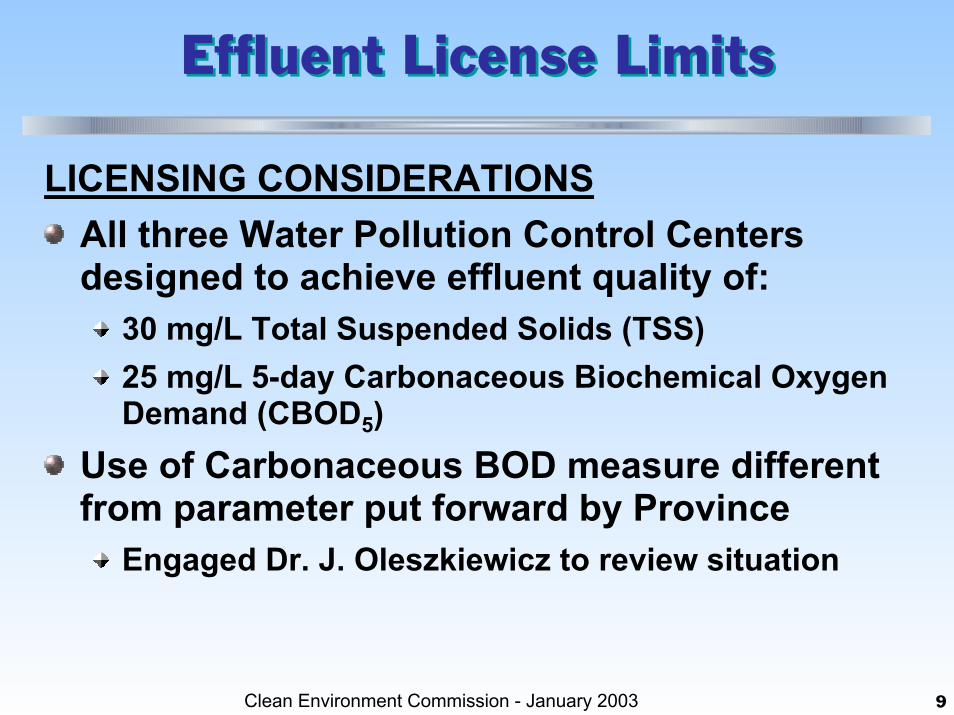
LICENSING CONSIDERATIONSAll three Water Pollution Control Centers designed to achieve effluent quality of:
30 mg/L Total Suspended Solids (TSS)25 mg/L 5-day Carbonaceous Biochemical Oxygen Demand (CBOD5)
Use of Carbonaceous BOD measure different from parameter put forward by Province
Engaged Dr. J. Oleszkiewicz to review situation
10Clean Environment Commission - January 2003
Effluent License LimitsEffluent License Limits
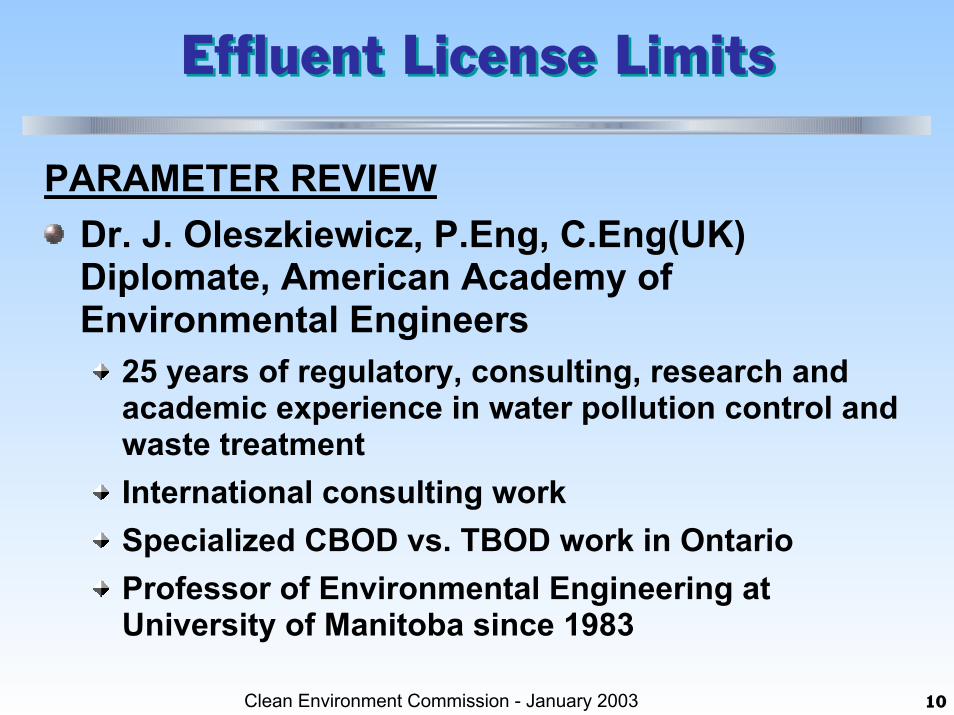
PARAMETER REVIEWDr. J. Oleszkiewicz, P.Eng, C.Eng(UK)Diplomate, American Academy of Environmental Engineers
25 years of regulatory, consulting, research and academic experience in water pollution control and waste treatmentInternational consulting work Specialized CBOD vs. TBOD work in OntarioProfessor of Environmental Engineering at University of Manitoba since 1983

11Clean Environment Commission - January 2003
Effluent License LimitsEffluent License Limits
LICENSING OF DISCHARGES
Manitoba Conservation historically used TBOD (Total BOD without inhibition of nitrification)
Plant operation and design based on CBOD (Carbonaceous BOD with inhibited nitrification)
Most provinces use CBOD
The need for License based on CBOD warrants discussion

12Clean Environment Commission - January 2003
Effluent License Limits
CBOD represents the actual performance of a plant and its
true impact on the river
CBOD represents the actual performance of a plant and its
true impact on the river
BODtotal = BODCarbon in organics + BODNitrogen
TBOD = CBOD + NBOD

13Clean Environment Commission - January 2003
Effluent License LimitsEffluent License Limits
WHAT IS BOD?BOD: Biochemical Oxygen Demand was developed over a century ago* to measure the ability of bacteria to degrade organic matter in sewage and river waters after 5 day incubation at 20°CIt measures the consumption of dissolved oxygen by bacteria
Introduced as seed with dilution water containing ammonia and nutrients Does not measure the organic pollutants directly
Why 5 days? Rivers in England reached the sea in 5 days or less
* Baird & Smith: “Third century of biochemical oxygen demand”, WEF 2002

14Clean Environment Commission - January 2003
Effluent License LimitsEffluent License Limits
EFFLUENT BOD: HISTORYUS EPA set up 30 mg/L TBOD effluent limit in late 70’s; based on 85% removal requirement for the secondary plants
Non-compliance was reported for 60% of plantsEPA found that non-compliance was:
artifact of the testing method,artifact of the testing method, and recommended recommended CBOD of 25 mg/L for all wastewater plants with secondary treatment
CBOD test was developed that inhibits ammonia nitrogen oxidation:
“ inclusion of ammonia in dilution water, demonstrates that BOD test is not intended to include oxygen demand of nitrogen in the BOD test ”

15Clean Environment Commission - January 2003
Effluent License LimitsEffluent License Limits
USAUSAMost states e.g., IN, IL, MN, NJ, PA, FL and other converted to CBOD by the early 1990’s (effluent permits of 20-25 mg/L CBOD)
N. Dakota still uses TBOD but considers the switch to CBOD, to be in line with Minnesota which uses CBOD.
E. Grand Forks, Moorhead use CBOD
NPDES (1972)- National Pollution Discharge Elimination System

16Clean Environment Commission - January 2003
Effluent License LimitsEffluent License Limits
EUROPEAN UNIONEUROPEAN UNIONStarted with TBOD (1991 Wastewater Directive) and ran into problems1998 European Union bannedbanned the use of TBOD, allowingallowing the use of CBOD
ISO 5815 NormSome countries (e.g. France, UK, Poland) allow the use of an instrumental rapid biosensor method which registers CBOD** Marty et al: Measurement of BOD:correlation between 5-day BOD and commercial
BOD biosensor values. Environm. Technol., 18: 333-337, 1997

17Clean Environment Commission - January 2003
Effluent License Limits
CANADACANADAMost provinces switched to CBOD (e.g. Ontario 1996) or used it all along (e.g. Alberta)BC still uses TBOD but will be switching to CBOD shortlyOntario Ministry of Environment recommended:
“ 25 mg/L CBOD; measure TAN, TKN and address ammonia toxicity ”
18Clean Environment Commission - January 2003
Effluent License LimitsEffluent License Limits
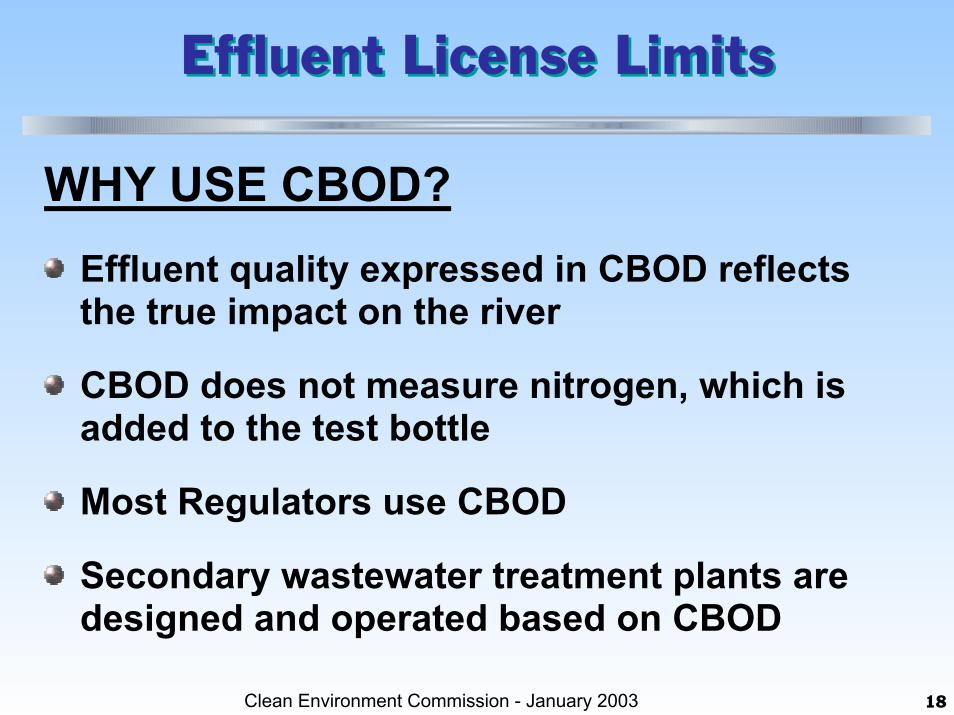
WHY USE CBOD?Effluent quality expressed in CBOD reflects the true impact on the river
CBOD does not measure nitrogen, which is added to the test bottle
Most Regulators use CBOD
Secondary wastewater treatment plants are designed and operated based on CBOD
19Clean Environment Commission - January 2003
Effluent License LimitsEffluent License Limits
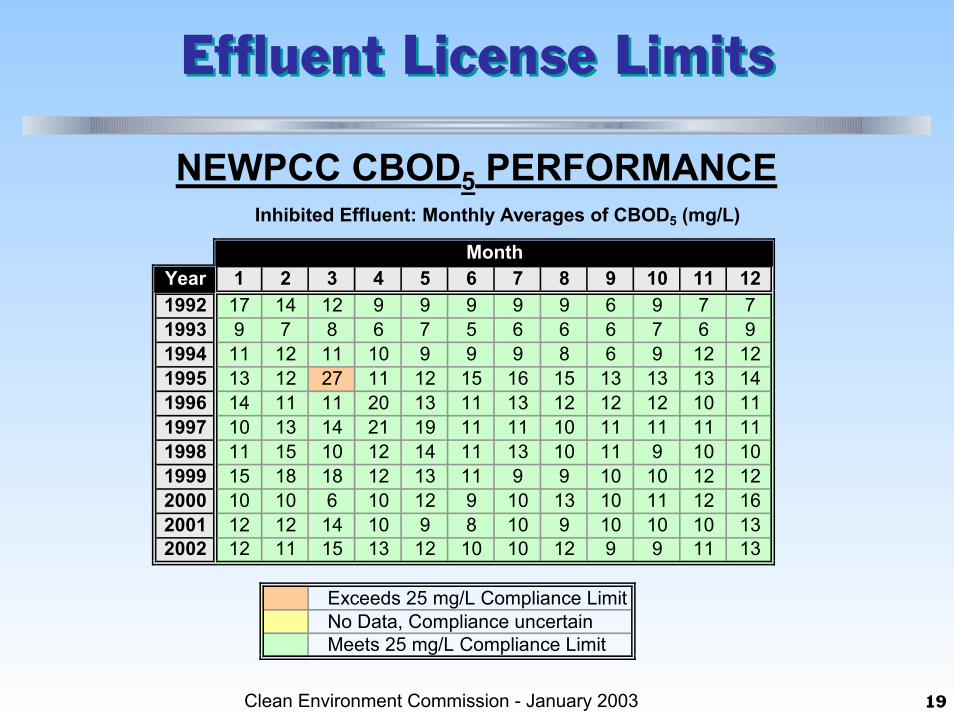
NEWPCC CBOD5 PERFORMANCE
Year 1 2 3 4 5 6 7 8 9 10 11 121992 17 14 12 9 9 9 9 9 6 9 7 71993 9 7 8 6 7 5 6 6 6 7 6 91994 11 12 11 10 9 9 9 8 6 9 12 121995 13 12 27 11 12 15 16 15 13 13 13 141996 14 11 11 20 13 11 13 12 12 12 10 111997 10 13 14 21 19 11 11 10 11 11 11 111998 11 15 10 12 14 11 13 10 11 9 10 101999 15 18 18 12 13 11 9 9 10 10 12 122000 10 10 6 10 12 9 10 13 10 11 12 162001 12 12 14 10 9 8 10 9 10 10 10 132002 12 11 15 13 12 10 10 12 9 9 11 13
Exceeds 25 mg/L Compliance LimitNo Data, Compliance uncertainMeets 25 mg/L Compliance Limit
Inhibited Effluent: Monthly Averages of CBOD5 (mg/L)
Month

20Clean Environment Commission - January 2003
Effluent License LimitsEffluent License Limits
SEWPCC CBOD5 PERFORMANCE
Year 1 2 3 4 5 6 7 8 9 10 11 121992 9 17 14 13 11 10 12 16 11 141993 23 10 11 10 11 11 10 11 11 10 101994 12 10 15 11 15 10 10 10 11 12 10 111995 11 12 10 11 10 11 10 10 11 10 10 111996 19 21 11 10 10 10 12 10 10 10 11 111997 10 10 10 10 17 10 10 10 10 10 111998 13 14 13 11 13 12 14 12 7 6 6 61999 32 41 23 10 8 5 5 6 7 9 9 132000 9 10 6 7 6 8 6 5 6 6 7 82001 6 8 12 8 7 10 7 6 6 6 7 72002 9 6 6 8 10 6 5 4 5 5 6 4
Exceeds 25 mg/L Compliance LimitNo Data, Compliance uncertainMeets 25 mg/L Compliance Limit
Inhibited Effluent: Monthly Averages of CBOD5 (mg/L)
Month

21Clean Environment Commission - January 2003
Effluent License LimitsEffluent License Limits
WEWPCC CBOD5 PERFORMANCE
Year 1 2 3 4 5 6 7 8 9 10 11 121998 15 17 14 14 12 6 5 6 71999 12 9 13 13 14 11 11 8 11 12 18 192000 12 11 15 21 13 7 8 8 6 12 10 92001 6 6 13 11 17 9 7 8 6 11 11 82002 8 6 9 6 17 8 6 10 8 11 11 10
Exceeds 25 mg/L Compliance LimitNo Data, Compliance uncertainMeets 25 mg/L Compliance Limit
Month
Inhibited Pond Effluent: Monthly Averages of CBOD5 (mg/L)
Winter Operation Summer Operation Winter Operation
22Clean Environment Commission - January 2003
Effluent License LimitsEffluent License Limits
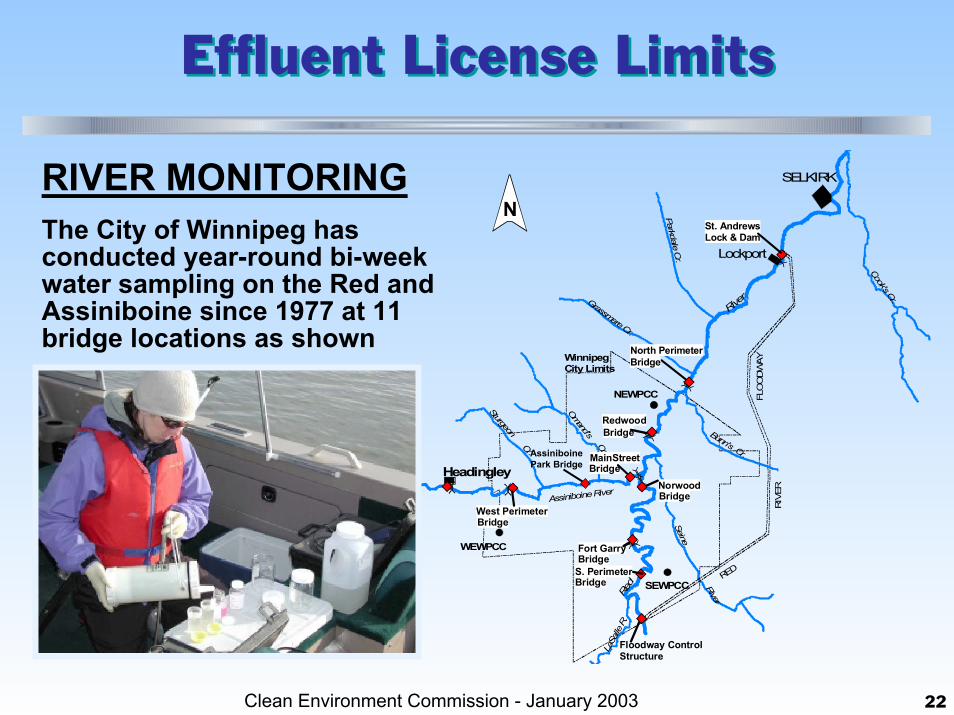
RIVER MONITORINGThe City of Winnipeg has conducted year-round bi-week water sampling on the Red and Assiniboine since 1977 at 11 bridge locations as shown
N
Cook's Cr.
Parkdale Cr. Lockport
RiverGrassmere Cr.
RED
RIV
ER
River
FLO
ODW
AY
Assiniboine River
Headingley
WinnipegCity Limits
WEWPCC
SEWPCC
NEWPCC
SturgeonCr.
Omand'sCr.
Bunn's Cr.
Seine
Red
LaSa
lle R
.
SELKIRK
0 10
Approximate Scale
km
RedwoodBridge
NorwoodBridge
Fort GarryBridge
West PerimeterBridge
MainStreetBridge
Floodway ControlStructure
Sampling Location
North PerimeterBridge
St. AndrewsLock & Dam
S. PerimeterBridge
AssiniboinePark Bridge

23Clean Environment Commission - January 2003
Effluent License LimitsEffluent License Limits
MONITORED DO LEVELS – ASSINIBOINE RIVERAssiniboine River - Headingley Bridge (1977-2002)
0
2
4
6
8
10
12
14
16
18
20
1 2 3 4 5 6 7 8 9 10 11 12
Month
Diss
olve
d O
xyge
n (m
g/L)
MonitoredInstantaneous Min. MBWQSOG
Assiniboine River - Main St. Bridge (1977-2002)
0
2
4
6
8
10
12
14
16
18
20
1 2 3 4 5 6 7 8 9 10 11 12
Month
Diss
olve
d O
xyge
n (m
g/L)
MonitoredInstantaneous Min. MBWQSOG
Assiniboine River - Assiniboine Park Bridge (1977-2002)
0
2
4
6
8
10
12
14
16
18
20
1 2 3 4 5 6 7 8 9 10 11 12
Month
Diss
olve
d O
xyge
n (m
g/L)
MonitoredInstantaneous Min. MBWQSOG
2
1 3

24Clean Environment Commission - January 2003
Effluent License LimitsEffluent License Limits
MONITORED DO LEVELS – RED RiverRed River - Floodway Control Structure (1977-2002)
02468
101214161820
1 2 3 4 5 6 7 8 9 10 11 12
Month
Dis
solv
ed O
xyge
n (m
g/L)
MonitoredInstantaneous Min. MBWQSOG
Red River - Fort Garry Bridge (1977-2002)
Red River - Redwood Bridge (1977-2002)
02468
101214161820
1 2 3 4 5 6 7 8 9 10 11 12
Month
Dis
solv
ed O
xyge
n (m
g/L)
MonitoredInstantaneous Min. MBWQSOG
Red River - North Perimeter/Chief Peguis Bridges (1977-2002)
1 3
02468
101214161820
1 2 3 4 5 6 7 8 9 10 11 12
Month
Dis
solv
ed O
xyge
n (m
g/L)
MonitoredInstantaneous Min. MBWQSOG
02468
101214161820
1 2 3 4 5 6 7 8 9 10 11 12
Month
Dis
solv
ed O
xyge
n (m
g/L)
Monitored
Instantaneous Min. MBWQSOG
2 4

25Clean Environment Commission - January 2003
Effluent License LimitsEffluent License Limits
MONITORED DO LEVELS – RED RIVERRed River - North Perimeter/Chief Peguis Bridges (1977-2002)
02468
101214161820
1 2 3 4 5 6 7 8 9 10 11 12
Month
Dis
solv
ed O
xyge
n (m
g/L)
Monitored
Instantaneous Min. MBWQSOG
Red River - St Andrews Lock and Dam (1977-2002)
0
2
4
6
8
10
12
14
16
18
20
1 2 3 4 5 6 7 8 9 10 11 12
MonthDi
ssol
ved
Oxy
gen
(mg/
L)
MonitoredInstantaneous Min. MBWQSOG
4 5
26Clean Environment Commission - January 2003
Effluent License LimitsEffluent License Limits
HEALTHY DO LEVELSExisting design and operational performance of the WPCCs are adequately protecting dissolved oxygen resources of the RiversA limit of 25 mg/L as measure by effluentCBOD5 on a monthly average basis is an appropriate License compliance condition for Winnipeg’s wastewater treatment plants
Consistent with other jurisdictions
27Clean Environment Commission - January 2003
Effluent License LimitsEffluent License Limits
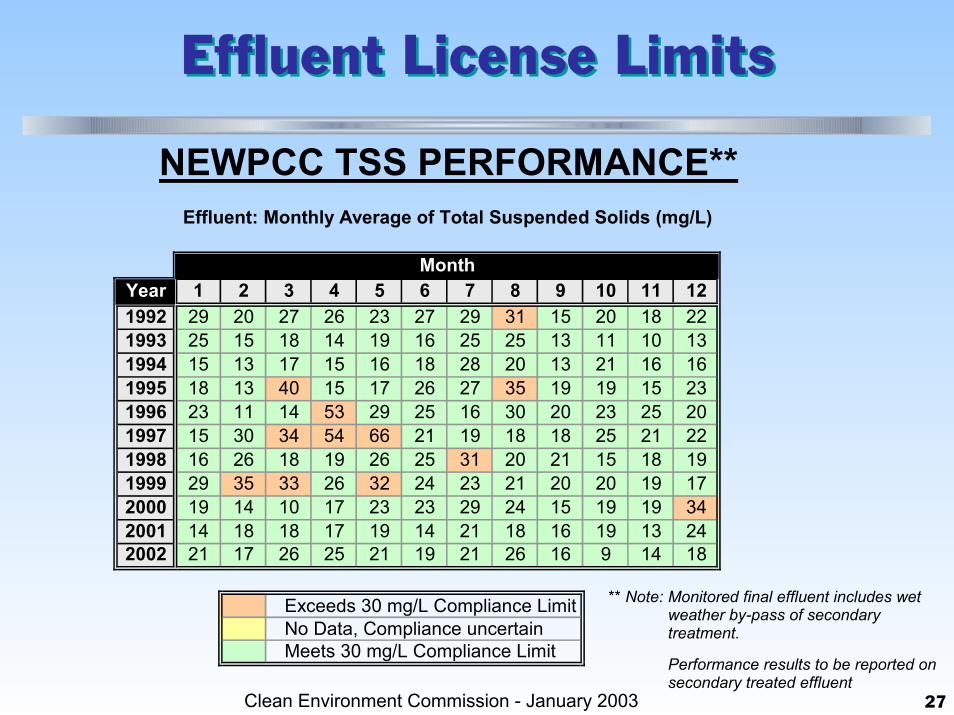
NEWPCC TSS PERFORMANCE**
** Note: Monitored final effluent includes wet weather by-pass of secondary treatment.
Performance results to be reported on secondary treated effluent
Year 1 2 3 4 5 6 7 8 9 10 11 121992 29 20 27 26 23 27 29 31 15 20 18 221993 25 15 18 14 19 16 25 25 13 11 10 131994 15 13 17 15 16 18 28 20 13 21 16 161995 18 13 40 15 17 26 27 35 19 19 15 231996 23 11 14 53 29 25 16 30 20 23 25 201997 15 30 34 54 66 21 19 18 18 25 21 221998 16 26 18 19 26 25 31 20 21 15 18 191999 29 35 33 26 32 24 23 21 20 20 19 172000 19 14 10 17 23 23 29 24 15 19 19 342001 14 18 18 17 19 14 21 18 16 19 13 242002 21 17 26 25 21 19 21 26 16 9 14 18
Exceeds 30 mg/L Compliance LimitNo Data, Compliance uncertainMeets 30 mg/L Compliance Limit
Month
Effluent: Monthly Average of Total Suspended Solids (mg/L)
28Clean Environment Commission - January 2003
Effluent License LimitsEffluent License Limits
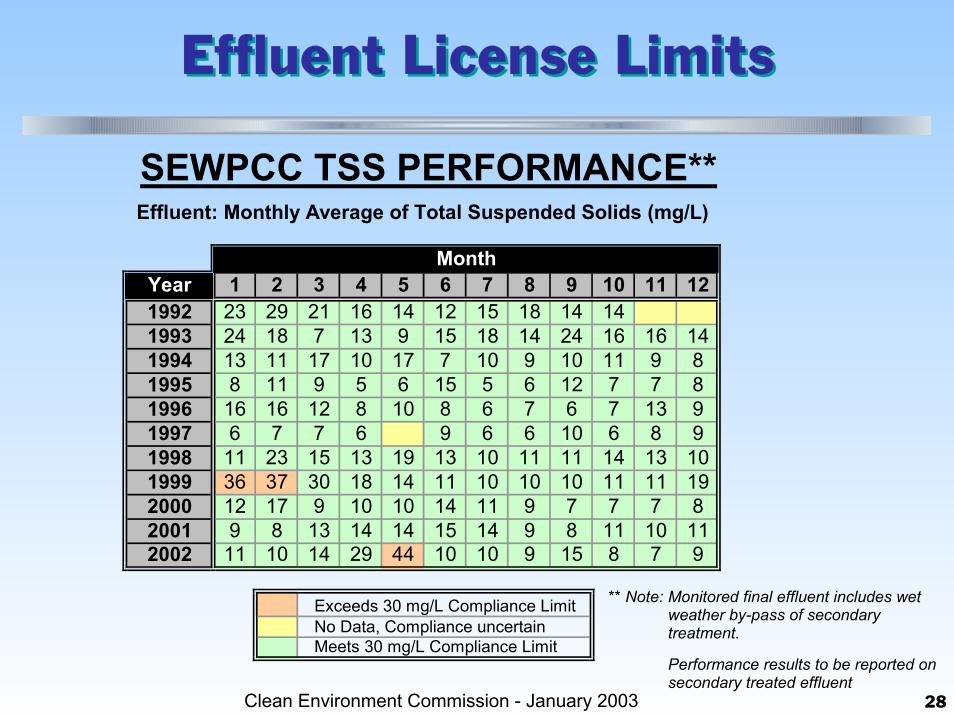
SEWPCC TSS PERFORMANCE**
** Note: Monitored final effluent includes wet weather by-pass of secondary treatment.
Performance results to be reported on secondary treated effluent
Year 1 2 3 4 5 6 7 8 9 10 11 121992 23 29 21 16 14 12 15 18 14 141993 24 18 7 13 9 15 18 14 24 16 16 141994 13 11 17 10 17 7 10 9 10 11 9 81995 8 11 9 5 6 15 5 6 12 7 7 81996 16 16 12 8 10 8 6 7 6 7 13 91997 6 7 7 6 9 6 6 10 6 8 91998 11 23 15 13 19 13 10 11 11 14 13 101999 36 37 30 18 14 11 10 10 10 11 11 192000 12 17 9 10 10 14 11 9 7 7 7 82001 9 8 13 14 14 15 14 9 8 11 10 112002 11 10 14 29 44 10 10 9 15 8 7 9
Exceeds 30 mg/L Compliance LimitNo Data, Compliance uncertainMeets 30 mg/L Compliance Limit
Month
Effluent: Monthly Average of Total Suspended Solids (mg/L)

29Clean Environment Commission - January 2003
Effluent License LimitsEffluent License Limits
WEWPCC TSS PERFORMANCE**
year 1 2 3 4 5 6 7 8 9 10 11 121998 15 49 47 31 34 21 12 13 81999 16 13 17 31 43 44 29 21 12 24 30 242000 10 12 19 34 23 20 26 37 27 26 22 142001 7 8 15 19 29 21 17 11 12 20 15 92002 8 14 11 12 28 19 18 30 22 22 16 8
Exceeds 30 mg/L Compliance LimitNo Data, Compliance uncertainMeets 30 mg/L Compliance Limit
Pond Effluent: Monthly Average of Total Suspended Solids (mg/L)
Winter Operation Winter OperationSummer Operation
Month
** Note: Monitored final effluent may include algae and/or re-suspended solids from spring melt conditions
Performance results to be reported on secondary treated effluent

30Clean Environment Commission - January 2003
Effluent License LimitsEffluent License Limits
Minor exceedance of Total Suspended Solids limit of 30 mg/L, as measure on a monthly average, does not adversely affect aquatic life in local rivers. River has a naturally high sediment concentration, which is much greater than effluent discharge concentrates
Typical local river concentrations, 85 to over 200 mg/L, during open water entering Winnipeg

31Clean Environment Commission - January 2003
Effluent License LimitsEffluent License Limits
SEWPCC EFFLUENT DISINFECTIONDisinfection implemented at SEWPCC to achieve substantial compliance with Manitoba's Surface Water Microbiological Objective under normal operating conditions:
Using Ultraviolet technologyCompliance target of 200 FC/100mL up to 100 ML/d Compliance based on end-of-pipe effluent qualitySeasonal operation, May 1 to Sept 30 inclusiveWet weather and high river level exclusionsIn operation since July 1999Detailed reporting provided to MB conservation

32Clean Environment Commission - January 2003
Effluent License LimitsEffluent License Limits
SEWPCC EFFLUENT SUMMARY: FECAL COLIFORMS
Year 2002 2001 2000 1999
Month Fecal Coliform²
Fecal Coliform²
Fecal Coliform²
Fecal Coliform²
May 39 41 14June 31 419 81July 175 972 89 62
August 63 208 32 73September 304 425 61 39
(1) Geometric mean(2) Most Probable Number (MPN) per 100 mL
Exceeds 200 FC/100 mL Compliance LimitNo Data, Compliance uncertainMeets 200 FC/100 mL Compliance Limit
SEWPCC Average¹ Monthly Effluent Bacteriological Quality
Problem related to premature UV lamp failure

33Clean Environment Commission - January 2003
Effluent License LimitsEffluent License Limits
WEWPCC EFFLUENT DISINFECTIONWEWPCC operation different than NEWPCC and SEWPCC
Plant design and operation similar to SEWPCCRetained the use of polishing ponds as storage cells
Continues to polish wastewater and improve effluent quality, especially fecal coliform levels
Need for additional disinfection of WEWPCC effluent unlikelyModifications made to treatment train has resulted in effluent quality that achieves significant compliance with fecal coliform objectiveNeed for additional disinfection to be assessed through continued effluent monitoring and compliance reporting

34Clean Environment Commission - January 2003
Effluent License LimitsEffluent License Limits
WEWPCC EFFLUENT SUMMARY: FECAL COLIFORMS
Year 2002 2001 2000 1999 1998
Month Fecal Coliform²
Fecal Coliform²
Fecal Coliform²
Fecal Coliform²
Fecal Coliform²
May 116 11 6 25June 6 2 10 8July 11 15 5 8 11
August 54 57 146 25 59September 74 27 174 210 285
(1) Geometric mean(2) Most Probable Number (MPN) per 100 mL
Exceeds 200 FC/100 mL Compliance LimitNo Data, Compliance uncertainMeets 200 FC/100 mL Compliance Limit
WEWPCC Average¹ Monthly Effluent Bacteriological Quality

35Clean Environment Commission - January 2003
Effluent License LimitsEffluent License Limits
NEWPCC EFFLUENT DISINFECTIONDisinfection to be implemented at NEWPCC:
Existing plant reduces Fecal coliform (FC) significantly, but doesn’t meet microbiological objective
“Raw”, typical Influent: ~ 10,000,000 FC/100 mL“Treated”, typical effluent: ~ 250,000 FC/100 mL
Disinfected effluent: ~ 200 FC/100mL or lessWill be designed to achieve significant compliance with microbiological objective under normal operating conditions, similar to SEWPCC.
Compliance with 200 FC/100mL will be assessedCSO plans will influence design requirements and operationSeasonal operation, May 1 to Sept 30 inclusive
Will be in operation for 2005 summer recreation season.City has committed $15 Million for facility

36Clean Environment Commission - January 2003
Effluent License LimitsEffluent License Limits
LICENSING CONSIDERATIONSRecommended License limits and conditions for treated secondary effluent:
Carbonaceous BOD Standard, Tier 1Base on protecting river Dissolved Oxygen contentMonthly average to achieve 25 mg/L with excursions to be addressed
Total Suspended Solids Objective, Tier 2 Monthly average to achieve target of 30 mg/L Excursions in accordance with MWQSOG (final draft +/- 25 mg/L)Exclude algae from ponds
Fecal ColiformsGenerally consistent with current SEWPCC License conditionsSpecifics to be review as part of disinfection project for NEWPCC
NutrientsPremature to establish limits at this time


