Date post: | 31-Aug-2018 |
Category: |
Documents |
Upload: | truonglien |
View: | 217 times |
Download: | 0 times |
Water accounting for conjunctive groundwater/surface
water management: case of the Singkarak–Ombilin
River basin, Indonesia
Natalia Peranginangina, Ramaswamy Sakthivadivelb, Norman R. Scotta,Eloise Kendya, Tammo S. Steenhuisa,*
aDepartment of Biological and Environmental Engineering, Cornell University, 216 Riley-Robb Hall, Ithaca, NY 14853-5701, USAbInternational Water Management Institute, P.O. Box 2075, Colombo, Sri Lanka
Received 17 March 2003; revised 10 November 2003; accepted 12 December 2003
Abstract
Because water shortages limit development in many parts of the world, a systematic approach is needed to use water more
productively. To address this need, Molden and Sakthivadivel [Water Resour. Dev. 15 (1999) 55-71] developed a water-
accounting procedure for analyzing water use patterns and tradeoffs between users. Their procedure treats groundwater and
surface water as a single domain. We adapted this procedure to account for groundwater and surface water components separately,
and applied the adapted procedure to the Singkarak–Ombilin River basin, Indonesia, where groundwater is a significant part of
the overall water balance. Since 1998, a substantial proportion of water has been withdrawn from Singkarak Lake and diverted out
of the basin, resulting in significant impacts on downstream water users and the lake ecosystem. Based on 15–20 years
(1980–1999) of hydrometeorological, land use, soil, and other relevant data, a simple groundwater balance model was developed
to generate the hydrogeologic information needed for the water-accounting procedure. The water-accounting procedure was then
used to evaluate present and potential future water use performance in the basin. By considering groundwater and surface water
components separately, a more realistic estimate of water availability was calculated than could be obtained by lumping these
components together. Results show that the diversion of 37 m3/s from Singkarak Lake increases the amount of water that is not
available for other uses, such as for irrigation, from 57–81 to 81–95% of total water available in the basin. The new water
accounting procedure also demonstrates the viability of increasing downstream water supply and water use performance during
the dry months (June–September). For example, by increasing irrigation during the wet months (January–April) or tapping water
from a shallow, unconfined aquifer during the dry months, while keep maintaining sustainable groundwater levels.
q 2004 Elsevier B.V. All rights reserved.
Keywords: Water accounting; Water balance; Recharge; Baseflow; Vadose zone; Water depletion
1. Introduction
Water is becoming the limiting factor for develop-
ment in many parts of the world. A systematic
approach is needed to communicate how water is
0022-1694/$ - see front matter q 2004 Elsevier B.V. All rights reserved.
doi:10.1016/j.jhydrol.2003.12.018
Journal of Hydrology 292 (2004) 1–22
www.elsevier.com/locate/jhydrol
* Corresponding author. Tel.: þ1-607-255-2489; fax: þ1-607-
255-4080.
E-mail address: [email protected] (T.S. Steenhuis).
being used and how water resource developments will
affect present use patterns. A water-accounting pro-
cedure was introduced by Molden (1997) and devel-
oped by Molden and Sakthivadivel (1999) to address
this need. The Molden and Sakthivadivel (M–S)
procedure provides terminology and measures to
describe the use and productivity of water resources.
It has proven useful to identify means for improving
water management and productivity while maintain-
ing environmental integrity, and is now being applied
in The Philippines, Nepal, Pakistan, India, Sri Lanka,
and China (IWMI, 1999; Molden et al., 2001; Renault
et al., 2001).
The M–S water-accounting procedure is based on
a water balance approach that combines groundwater
and surface water as a single domain. However, in
many cases, optimal water resource management and
conservation require that groundwater be distin-
guished from surface water. This is especially true
where groundwater plays a significant role in the
overall water balance, such as in central and northern
China, northwest and southern India, parts of Pakistan,
and much of the North Africa, Middle East, and the
glacial aquifers in the plains region of the United States
(Postel, 1999). For these cases, the original M–S
approach could potentially prove quite useful, but
needs further development to separate groundwater
from surface water.
In much of the world, surface water and rainfall
have traditionally supplied all water demands. But as
those demands increase, other sources are sought. A
viable option in many basins is groundwater.
However, if groundwater has not previously been
exploited, it is unlikely that local storage and flow
mechanisms are well understood. In these cases,
appropriate hydrogeologic data are unavailable for
water-accounting analysis, and must first be syn-
thesized from other hydrologic data before water
accounting can be applied. Consequently, a simple
method to estimate such hydrogeologic data with
minimal hydrologic inputs, such as the
Thornthwaite–Mather (T–M) water balance model
(Thornthwaite and Mather, 1955, 1957), is pivotal in
the overall water accounting procedure.
The Singkarak–Ombilin River basin in West
Sumatra Province, Indonesia, is a case in point.
This basin consists of two major sub-basins, the
Singkarak sub-basin in the upstream (western part)
and the Ombilin River basin in the downstream
(eastern part) (Fig. 1). All flows from the Singkarak
sub-basin drain into Singkarak Lake (106 km2, 365
m.a.s.l.), the largest lake in the basin (Fig. 1).
There are two major rivers flowing into the lake,
the Sumpur River from the northwest and the
Sumani/Lembang River from the southeast in
which water supply for the latter was largely
determined by the supply from Dibawah Lake
(106 km2, 1400 m.a.s.l.) (Fig. 1). The only outlet
from Singkarak Lake is the Ombilin River, which
flows eastward to the Inderagiri River in the plains
of Rian Province. Until recently, sufficient surface
and rainwater were available to meet all water
needs within the basin. However, demands for
surface water diversions to the Singkarak Hydro-
electric Power Plant (HEPP), which began oper-
ation in May 1998, have stressed the available
supply to the extent that the largest lake in the
basin has begun to recede, and have caused
significant outflow reduction to the Ombilin River
(downstream). Conflicts between the management
of the HEPP and other water users have ensued
downstream of the lake. Development of additional
available water sources could potentially supply
some of the increased demands. Although a
shallow aquifer underlies the basin, it has never
been exploited and little is known about its
capacity to help meet the increasing water
demands. Yet its potential to store water during
wet periods for later use could prove pivotal in
circumventing water shortages. As a precursor to
planning and implementing mitigative water man-
agement strategies, the potential for groundwater to
increase overall water availability in the basin
needs to be quantified.
The objectives of this study were to: (1) modify the
M–S water-accounting procedure to account for
groundwater separately; (2) use a modified
Thornthwaite–Mather water balance model to gen-
erate groundwater data for the modified water-
accounting procedure; (3) apply the modified water-
accounting procedure to evaluate past water use
(1985–1998) and provide opportunities for improving
future water management of the Singkarak–Ombilin
River basin, emphasizing the potential role of
groundwater in augmenting current water supplies in
the downstream.
N. Peranginangin et al. / Journal of Hydrology 292 (2004) 1–222
2. Study area
The 2210 km2 Singkarak–Ombilin River basin (Fig.
1) located in the West Sumatra Province, Indonesia, is a
hilly, dendritic drainage basin located at latitude
0080003000– 0180204000S, longitude 10082204500 –
10085100000E, and altitude 240–2760 m.a.s.l.
The Singkarak sub-basin (1096 km2) in the
upstream is primarily mountainous and hilly, while
the Ombilin River sub-basin (1114 km2) in
Fig. 1. The Singkarak–Ombilin River Basin.
N. Peranginangin et al. / Journal of Hydrology 292 (2004) 1–22 3
the downstream is a relatively flat, undulating plateau
(Center for Soil and Agroclimate Research Agency,
1990). Geologically, the Singkarak sub-basin consists
of Quaternary-age volcanoes and the Ombilin River
sub-basin consists of Tertiary-age volcanoes. The soil
in the basin is deep, porous, and highly permeable
(soil permeability is 10–75 cm/h) (Saidi, 1995), with
the top 30 cm typically characterized as silty clay
loam, silty clay, and clay (Saidi, 1995; Imbang et al.,
1996). Land use is largely agricultural (Table 1). The
villages are considered to be 85 and 15% rural and
urban, respectively. Farm households compose
around 70% of the total households. As a major
cultural center of eastern West Sumatra, the area
around Solok is the most rapidly growing part of the
basin (229 and 283 inhabitants/km2 in 1985 and 1998,
respectively).
The humid, tropical climate is characterized by
high temperature throughout the year and heavy
rainfall (Scholz, 1983). Based on 1980–1999 data
published by local and national Meteorological and
Geophysical Agencies, average annual precipitation
ranges from 1.7 to 2.9 m, with peaks at the end and
beginning of each year (Fig. 2). Mean monthly
rainy days range from 5 to 24 days, while mean
annual pan evaporation and temperature range from
3.9 to 5.3 mm/day and 22.5 to 26.2 8C,
respectively.
A shallow, unconfined aquifer underlies the
majority of the basin. The water table ranges from
about 0.3–15 m below the land surface (Sudadi, 1983;
Arief and Ruchijat, 1990). The aquifer is locally
recharged by infiltrated precipitation. However,
although monthly precipitation is the lowest in June,
minimum streamflow does not occur until August
(Fig. 2). The delayed low flow is caused by baseflow,
or groundwater discharge to stream channels from the
slowly declining water levels in the aquifer.
Surface water in the Singkarak–Ombilin River
basin is used for irrigation, domestic activities,
commercial and home industrial uses, the Sing-
karak HEPP, fish culture, livestock, and recreation.
In the downstream (Ombilin River sub-basin) water
is also consumed for coal washing and electricity
generation by thermal power plants. Pumps and
waterwheels are used for irrigation in the down-
stream while pumps and gravity are used in the
upstream. Since beginning operation in May 1998,
the Singkarak HEPP has diverted a substantial
proportion of water from Singkarak Lake to outside
the basin, the west coast of Sumatra, which
receives a high amount of rainfall. The diversion
reduced discharge to the Ombilin River (east coast
of Sumatra), which receives a lesser amount of
rainfall than the west coast, from an average
discharge of 53 to 2–6 m3/s. The reduced flow
has seriously affected the lake level and down-
stream water users, leading to water use conflicts.
Table 1
Land use changes
Land use Singkarak (%) Ombilin (%) Total (%)
Irrigated rice field
1985 14.1 5.8 10.0
1998 12.9 4.4 8.7
Change 21.2 21.4 21.3
Rainfed rice field
1985 2.5 7.4 5.1
1998 1.6 7.0 4.4
Change 20.9 20.4 20.7
Other field cropsa
1985 11.7 18.3 15.0
1998 14.7 25.1 19.9
Change þ3 þ6.8 þ4.9
Plantationa
1985 6.4 10.3 8.4
1998 7.1 12.5 9.8
Change þ0.7 þ2.2 þ1.4
Forest
1985 29.7 20.6 25.1
1998 24.9 13.8 19.3
Change 24.8 26.8 25.8
Shrubs/bush
1985 15.0 19.5 17.3
1998 18.2 19.7 18.9
Change þ3.2 þ0.2 þ1.6
Water body
1985 10.6 0 5.3
1998 10.6 0 5.3
Change 0 0 0
Othersb
1985 9.9 17.8 13.9
1998 10.1 17.2 13.7
Change þ0.2 20.6 20.2
a Rainfed.b Fallow, homestead, pasture, open land, fish pond, and natural
springs.
N. Peranginangin et al. / Journal of Hydrology 292 (2004) 1–224
A survey conducted by the Center for Irrigation,
Land and Water Resources, and Development
Studies of Andalas University in 2000 found that
50% of the 366 bamboo waterwheels used for
irrigation downstream became inoperable after
reduced flow rendered the Ombilin River too
shallow for their intakes.
Increasing water demands by the hydropower
diversion from Singkarak Lake have increased
pressure on agricultural water management down-
stream of the lake. With nearly all surface water fully
utilized, groundwater exploitation is an appealing
option to meet the increased water demand. The time
lag between the lowest precipitation and streamflow
(Fig. 2) suggests the presence of a significant aquifer.
However, availability and reliability of the ground-
water resources are unknown, as are the potential
impacts of various conjunctive management
approaches.
3. Theory
3.1. The Molden and Sakthivadivel water-accounting
procedure
The Molden and Sakthivadivel (M–S) water-
accounting procedure has proven useful for helping
to understand the tradeoffs needed to improve water
use effectiveness in water scarce basins (Molden,
1997; Molden and Sakthivadivel, 1999; Molden et al.,
2001; Renault et al., 2001). The M–S procedure
applies a simple water balance to a given domain over
a given time period. A domain is delineated spatially,
both areal (i.e. river basin) and depth (i.e. root zone,
vadose zone, groundwater), and bounded in time (i.e.
annual water year, particular growing season). The
procedure can be applied to three spatial levels: macro
(basin or sub-basin), mezzo (service area within a
basin, such as a water supply or irrigation service),
and micro (i.e. the root zone of an irrigated field, or a
particular industrial process). For the Singkarak–
Ombilin River basin, our main emphasis is on the
basin level. At this level, the M–S water-accounting
procedure combines groundwater, soil water, and
surface water into a single domain, which extends
from the canopy surface to the aquifer bottom with an
overall water balance equation of
I ¼ D þ Q þ DS ð1Þ
and
I ¼ P þ Ss þ Sg ð2Þ
D ¼ ETa þ V þ U ð3Þ
Q ¼ Qs þ Qg ð4Þ
DS ¼ DSs þ DSsm þ DSg ð5Þ
where I is the inflow; D; the water depletion; Q; the
outflow; DS; the storage change; P; the precipitation;
Ss and Sg; the surface and sub-surface flow into the
basin, respectively; ETa; the actual evapotranspiration
from vegetation; V ; the evaporation from free water
surfaces and open land; U; the domestic and non-
domestic depletive uses; Qs; the surface runoff
(including interflow); Qg; the baseflow; DSs; the
change in surface water storage; DSsm; the change
in soil moisture content; DSg is the change in
groundwater storage. The units of all the parameters
are expressed as volumetric flow rates (m3/yr).
The unique feature of the M–S water accounting
procedure is its classification of each water balance
component into water use categories that reflect the
consequences of human interventions in the hydro-
logic cycle as summarized in Table 2. The most
important feature of the procedure is its detailed
categorization of water depletion, D; defined as a use
or removal of water from a domain of interest that
renders the water unavailable, or unsuitable for further
Fig. 2. Mean monthly precipitation and outflows in the Singkarak–
Ombilin River basin, 1980–1999. Precipitation data were collected
from five rainfall stations and five climatology stations located in
the basin (Fig. 1) and outflows were measured at the Tanjung
Ampalu river gauging station. Average precipitation depth was
calculated based on the Thiessen method.
N. Peranginangin et al. / Journal of Hydrology 292 (2004) 1–22 5
Table 2
Water accounting components of the Singkarak–Ombilin River basin
Water-accounting components Definition Water-accounting parameter
Singkarak sub-basin
(upstream)
Ombilin River sub-basin
(downstream)
Surface water accounting
Inflow ðIÞ
Gross inflow ðIgÞ Total amount of water flowing
into the domain
Precipitation Precipitation, outflow
from Singkarak Lake
Net inflow ðInÞ Gross inflow plus any
changes in storagea
Precipitation, soil
moisture change,
lake level changes
Precipitation, outflow
from Singkarak lake,
soil moist. change
Storage change ðDSÞ Soil moisture change Soil moisture change
Dibawah and Singkarak
Lakes level changes
Water depletion (D)
Process depletion ðDpÞ;
beneficial
Water depletion that produces
human-intended goods
ET from agricultural cropsb
Domestic, non-domesticc
livestock depletive uses
ET from agricultural cropsb
Domestic, non-domesticd
livestock depletive uses
Non-process depletion,
beneficial ðDnbÞ
Water depletion that is used
naturally or not for human
intended purposes
ET from natural forest ET from natural forest
Non-process depletion,
non-beneficial ðDnnÞ
Water depletion results in
a low or negative value
ET from free surface, shrubs/
bush, fallow, homesteadse
ET from free surface, shrubs/bush,
fallow, homesteadse
Outflow (Q)
Committed ðQcÞ Allocated to downstream process
or environmental uses within a domain
Downstream commitment
(2–6 m3/s) (as of May 1998)f
None
Uncommitted,
utilizable ðQuuÞ
Neither depleted nor committed, available
for use within the domain, but flows
out due to lack of storage or operational
measures. Infrastructure exists to
retain water in the domain.
Outflow from Singkarak Lakeg Surface runoff
Groundwater recharge
Uncommitted,
non-utilizable ðQunÞ
Same as above, however
infrastructure does not exist
None None
Groundwater accountingh
Inflow (I)
Gross inflow ðIgÞ See the definition above Groundwater recharge Groundwater recharge
Net inflow ðInÞ See the definition above Groundwater recharge,
groundwater storage change
Groundwater recharge,
groundwater storage change
Storage change (D) Groundwater storage change Groundwater storage change
Outflow (Q)
Utilizable uncommitted
outflow ðQuÞ
See the definition above Groundwater discharge
(baseflow)
Groundwater discharge
(baseflow)
a If water is removed from storage, then net inflow exceeds gross inflow; conversely, if water is added to storage, then net inflow is less than
gross inflow.b Evapotranspiration (ET) from irrigated and non-irrigated crops, plantations, and pasture.c Commercial and industrial depletive uses, including the uses for the Singkarak HEPP and AMIA bottled water industry since May 1998.d Commercial and industrial depletive uses, including the uses for the Ombilin coal-washing plant, Ombilin and Salak thermal power plants.e These uses were considered non-beneficial because of low value when compared to the forest, natural landscape, or agricultural uses.f Used for irrigation, domestic water supply, Ombilin coal-washing plant, Ombilin and Salak thermal power plants.g No uncommitted utlizable outflow after May 1998.h No groundwater depletion. Committed or uncommitted, non-utilizable groundwater discharge was not identified.
N. Peranginangin et al. / Journal of Hydrology 292 (2004) 1–226
use, either within the domain or downstream.
According to Keller and Keller (1995) and Seckler
(1996), water is depleted by four processes: evapor-
ation, flows to sinks, pollution, and incorporation into
a product.
The M–S water-accounting procedure produces
physically based water accounting indicators, which
will be described in more detail later. By comparing
water-accounting indicators, one can easily assess
relative water use performance either within a domain
or between domains, which is vital for identifying
opportunities for improving water management,
especially when all water supplies are fully utilized,
defining a closed basin (Seckler, 1996).
3.2. The modified water-accounting procedure
To rigorously apply the M–S procedure to the
Singkarak–Ombilin River basin, where groundwater
storage could potentially provide a new source of
available water during the dry part of the year,
groundwater and surface water clearly must be
analyzed as separate entities. Therefore, we modified
the M–S procedure by dividing the spatial domain of
analysis into above groundwater and groundwater
domains. The above groundwater domain extends
from the canopy surface to the water table, while the
groundwater domain extends from the water table to
the aquifer bottom. Consequently, the water balance
equation for the entire domain of analysis is divided
into separate water balances where the exchange term
between the two domains is recharge, R. For the above
groundwater domain
Is ¼ P þ Ss þ Irrg ð6Þ
Ds ¼ ETa þ V þ U ð7Þ
Qs ¼ Qs þ R ð8Þ
DSs ¼ DSs þ DSsm ð9Þ
and for the groundwater domain
Ig ¼ R þ Sg ð10Þ
Dg ¼ Irrg ð11Þ
Qg ¼ Qg ð12Þ
DSg ¼ DSg ð13Þ
where superscripts s and g represent parameters
for the above groundwater and groundwater
domains, respectively; Irrg; the groundwater irriga-
tion [L3/T], and R is the groundwater recharge
[L3/T].
The modified water-accounting approach is
depicted graphically in Fig. 3, which is divided
vertically into above groundwater and groundwater
domains, and horizontally into the upstream (includ-
ing Singkarak Lake) and downstream. Excess irriga-
tion water and infiltrated precipitation percolate
downward and recharge the shallow, unconfined
aquifer. Because some recharge stored in the wet
period can potentially be depleted for beneficial
purposes later during the drier period, we refer to
groundwater recharge as potential beneficial
depletion. The term potential indicates that some of
the recharge later discharges as groundwater to rivers,
where the discharge may not be depleted beneficially.
When irrigation increases during the wet season,
recharge to groundwater also increases. This
additional recharge leads to additional utilizable
outflow during low flow periods, which later can be
directly depleted for intended purposes.
To apply this modified accounting procedure,
groundwater recharge and baseflow must be quanti-
fied explicitly. These data are generally not available
and must be calculated. The procedure is detailed in
Section 3.3.
3.3. The modified Thornthwaite–Mather water
balance model
To estimate groundwater recharge and baseflow we
modified the Thornthwaite–Mather (T–M) monthly
time step water balance model (Thornthwaite and
Mather, 1955, 1957; Steenhuis and van der Molen,
1986) to account for the vadose and saturated zones
separately. The modified T–M model calculates
monthly groundwater recharge and discharge from
monthly climate data in one dimension. In addition,
the modified T–M monthly water balance model was
used to calculate soil moisture and groundwater
storage changes, and inflow to Singkarak Lake, as
needed for the water-accounting procedure.
3.3.1. Vadose zone
Most applications of the T–M procedure use a
monthly time step. Soil moisture either increases or
N. Peranginangin et al. / Journal of Hydrology 292 (2004) 1–22 7
decreases monthly, depending on whether precipi-
tation, Pt; is greater or less than potential evapotran-
spiration, ETpt: When Pt , ETp t; available water in
the root zone is in deficit and no water percolates from
the soil profile. Thus
Ssmt ¼ Ssmt21 exp½2ðETpt 2 PtÞ=ðSfc 2 SwpÞ� ð14Þ
where Ssmt and Ssmt21 are the available water stored
in the root zone at the end of the month ðtÞ and
previous month ðt 2 1Þ; respectively; and ðSfc 2 SwpÞ
is the effective water-holding capacity in the root zone
(soil moisture at field capacity, Sfc; minus soil
moisture at wilting point, Swp). All units are expressed
as length or volume. When ETp , Pt; water stored in
the root zone increases according to:
Ssmt ¼ min½Ssmt21 þ Pt 2 ETp tÞ; ðSfc 2 SwpÞ� ð15Þ
If the resulting Ssmt . Sfc 2 Swp; then deep
percolation (recharge), Rt; occurs, where
Rt ¼ Ssmt 2 ðSfc 2 SwpÞ ð16Þ
Further practical applications of the T–M model to
the root zone can be seen in Thornthwaite and Mather
(1955, 1957), Dunne and Leopold (1978), Alley
(1984) and Steenhuis and van der Molen (1986).
3.3.2. Saturated zone
Surface runoff is negligible in the Singkarak–
Ombilin River basin because the soils are highly
permeable. Therefore, irrigation water and infiltrated
precipitation in excess of the root zone water-holding
capacity is assumed to recharge groundwater. In
response to recharge, groundwater levels rise. The
resulting increase in hydraulic head induces lateral
sub-surface flow toward the drain (lake/river). Even-
tually, this flow becomes groundwater discharge,
which is assumed to be the only contributor to
baseflow. Assuming a linear baseflow recession curve,
aquifer drainage can be expressed as an exponential
decay process
Sg t ¼ Sg t2Dtexpð2aDtÞ ð17Þ
where Sg t2Dt and Sg t are the groundwater levels
(groundwater storage per unit area) above a reference
level at the beginning and end of each month,
respectively, units are expressed as length [L], and
Sg t2Dt equals the sum of the groundwater level at
the end of month t 2 1; Sg t21; and the average
Fig. 3. Modified water accounting of the Singkarak–Ombilin River basin. GI: gross inflow, ET: evapotranspiration, P: process, NP: non-
process, U: utilizable, B: beneficial, NB: non-beneficial, PBU: potential beneficial depletion. As of May 1998, outflow from Singkarak Lake is
regulated at 2–6 m3/s.
N. Peranginangin et al. / Journal of Hydrology 292 (2004) 1–228
groundwater recharge during month t; Rt; weighted by
land use; Dt is the number of days in the month; and a
is a constant, representing a characteristic storage
delay in the basin [L/T]. Factors controlling the delay
probably include perennial stream density and length,
basin slope, and aquifer hydraulic characteristics.
Finally, groundwater discharge, Qg; is determined as
Qg ¼ AðSg t 2 Sg t21Þ ð18Þ
where A is the catchment area in [L]2.
4. Applications
4.1. Application of the modified
Thornthwaite–Mather water balance model
4.1.1. Data and methods
The modified T–M model was tested on three river
sub-basins of the Singkarak–Ombilin River basin: the
Lembang (166 km2), Lembang/Sumani (515 km2),
and Selo (329 km2) (Fig. 1). Hydrologic, land use,
and soil data for the period 1985–1998 were obtained
or synthesized for each sub-basin/basin.
Daily (when available) and monthly precipitation
data from five rainfall stations (Padang Panjang, Batu
Sangkar, Solok, Muara Panas, and Padang Ganting)
(Fig. 1) were obtained from the Provincial Meteor-
ological and Geophysical Agency at Sicincin and the
Meteorological and Geophysical Agency Head Office
at Jakarta. Additional precipitation records from five
climatology stations (Koto Tinggi, Buo, Sijunjung,
Saning Bakar, and Danau Diatas) located within and
around the basin (Fig. 1) were obtained from the
Water Resources and Development Service of West
Sumatra. Average daily or monthly precipitation
falling into each sub-basin was calculated by the
Thiessen method (Linsley et al., 1982; Schwab et al.,
1993). Seven percent of the monthly data were
missing. Missing monthly data were estimated as
the mean of all measured monthly precipitation for
that particular station.
Daily maximum, minimum, and average values of
temperature, pan evaporation, relative humidity, wind
speed, and sunshine duration were obtained from the
five climatology stations. Eight percent of the pan
evaporation data were missing. Missing mean
monthly pan evaporation was estimated by adjusting
the mean monthly pan evaporation from the previous
year according to the difference in monthly precipi-
tation between years. Unweighted average pan
evaporation data from stations located within or
around each sub-basin were used for analysis.
Potential evapotranspiration, ETp; was obtained by
multiplying unweighted average class A pan evapor-
ation with a pan coefficient of 0.76. This coefficient
was obtained by calibrating the reference evapotran-
spiration, ET0; computed with CROPWAT 5.7 (Allen
et al., 1998) to pan evaporation. The coefficient
closely agrees with Allen et al. (1998), whose values
ranged between 0.75 and 0.85 for wind speeds of less
than 2 m/s and humidity greater than 70%.
Land use data were obtained from annual reports
published by the provincial and local offices of the
Food Crops Agricultural Extension Services, Bureau
of Statistics, and Plantation Services. The natural
forest area was cross-checked with data obtained from
the National Coordination Agency for Surveys and
Mapping and National Forest Inventory Project
(under the Ministry of Forestry and Plantation).
Land use changes from 1985 to 1998 period are
presented in Table 1.
Lacking local soil- and crop-physical data, effec-
tive water-holding capacity in root zones was
assumed to be 6 cm for rice (Oldeman et al., 1979;
Pramudia et al., 1998), 7.5 cm for ‘other field crops’
(Mock, 1973; Oldeman et al., 1979), 15 cm for ‘bush’,
‘shrubs’, ‘fallow’, and ‘homestead (mostly fallow)’
(Mock, 1973), 37.5 cm for forest, and 25 cm for
plantation crops (Thornthwaite and Mather, 1957).
Daily streamflow measurements were obtained
from the Research Institute for Water Development
(under the Ministry of Settlement and Regional
Infrastructure) and Water Resources and Development
Service of West Sumatra for four automated water
level recorder (AWLR) stations: Koto Baru, Bandar
Pandung, Saruaso, and Tanjung Ampalu (Fig. 1).
These stations are the outlet of the Lembang,
Lembang/Sumani, and Selo River sub-basins, and the
Singkarak–Ombilin River basin, respectively (Fig. 1).
The constant, a; was determined by plotting Qt2Dt
versus Qt (t in day) for available baseflow recessions,
as described in Linsley et al. (1982). It should be noted
that since the authors present a different form of
exponential outflow function, in this case the constant
a equals to 2 lnðKrÞ; where Kr is the slope of
N. Peranginangin et al. / Journal of Hydrology 292 (2004) 1–22 9
the lowest envelope of the recession flow data. As the
modified T–M model would be tested to three sub-
basins (the Lembang, Lembang/Sumani, and Selo
sub-basins), Kr was derived for these three sub-basins.
Fig. 4 shows how Kr was obtained for the Lembang
River sub-basin based on daily recession flow data
from the Koto Baru gauging station for 1992–1998.
The resulting values of a are 0.018, 0.008, and 0.015,
for the Lembang, Lembang/Sumani, and Selo sub-
basins, respectively. The straight line of the slope Kr
demonstrates that the baseflow recession curve of this
basin was linear ðdQ=dt ¼ 2aQÞ; where a is constant
and equal to 2ln½Kr� and, therefore, Eq. (17) is valid
(Zecharias and Brutsaert, 1988; Brutsaert and Lopez,
1998).
4.1.2. Results
The modified T–M model was run for a monthly
time step from January 1985 to December 1998 and
was initiated by specifying the starting amount of
water stored in the root zone ðSsm0Þ of each
crop/vegetation, which was assumed to be equal
with its effective water-holding capacity. The assump-
tion was based on the fact that the average
precipitation peaks at the end and beginning of each
year (Fig. 2). Groundwater exploitation in the basin
was negligible, therefore, it was assumed that the
long-term change in groundwater storage equalled
zero, resulting in Sg0 ¼ Sg final (the end of the running
period, December 1998).
To test the modified T–M model, the monthly
calculated outflow was compared to the monthly
observed outflow at three gauging stations (Koto
Baru, Bandar Pandung, and Saruaso) (Fig. 1) for the
1985–1998 period. Fair agreement between the
calculated and observed outflows (Fig. 5) indicates
that the modified T–M model on a monthly basis is
appropriate for this basin. Annual water balance
presented in Table 3 reveals that the estimated
outflows (baseflows) differed 2 – 25% (absolute
values) from observed outflows with the average
absolute difference of 9, 10, and 16% at the Koto
Baru, Bandar Pandung, and Saruaso gauging stations,
respectively. Moreover, the cumulative estimated and
observed outflows at the Koto Baru and Saruaso
stations for the period of 1992–1998 differed by 4%,
while those at the Bandar Pandung station for the
period of 1990–1998 differed by 6%. These results
show that even though other studies suggest that in
order to reduce water balance errors, an accounting
period of less than 10 days should be used (Sophocl-
eous, 1991), our modified T–M water balance model
performed well with a monthly accounting period
(Fig. 5, Table 3) and demonstrated that it was good
enough given the simplicity of the model.
Table 3 confirms that areal recharge plays an
important role in the overall water balance com-
ponents as the annual recharge accounts for 13–59%
of the total annual precipitation (the only inflow to the
system) with a 14 year (1985–1998) arithmetic
average of 40%. Simulated recharge patterns (Fig. 6)
agree with observations that during most of the
year, precipitation exceeds potential evapotranspira-
tion, filling the root zone to capacity and generating
groundwater recharge. The recharge varies annually
and spatially (Table 3), depending on the history of
soil moisture and the timing and amount of precipi-
tation. During relatively wet years (i.e. 1990, 1993,
and 1998) the recharge may represent more than 50%
of annual precipitation. In contrast, the drought of
1997 resulted in the lowest overall amount of recharge
during the study period, which was 13–27% of the
total annual precipitation.
4.2. Application of the modified
water-accounting procedure
4.2.1. Data and methods
We applied the modified M–S water-accounting
procedure (Eqs. (6)–(13)) to the Singkarak–Ombilin
River basin using annual (calendar year) time steps for
Fig. 4. Determination of Kr as the lowest envelope of recession flow
data. Qt2Dt and Qt are successive daily outflows obtained from the
Koto Baru River gauging station (the outlet of the Lembang River
sub-basin) following at least two successive days without rain.
N. Peranginangin et al. / Journal of Hydrology 292 (2004) 1–2210
the period of 1985–1998. Local parameters of each
water-accounting component are presented in Table 2,
which include annual groundwater recharge and
discharge quantities calculated above. Data sources
not described previously are given below.
Actual crop and non-crop evapotranspiration was
calculated according to the T – M procedure
(Thornthwaite and Mather, 1955, 1957). Annual
evaporation from free water surfaces (m3/yr) is a
product of the annual pan evaporation rate, a pan
coefficient of 0.9, and the surface water area, which is
a function of the lake level. Lake areas corresponding
to different levels were interpolated from
a topographic map with a scale of 1:20,000. When
the lake level was not available, a normal lake level
was used. Class A pan evaporation from the Danau
Diatas and Saning Bakar climatology stations (Fig. 1)
were used for Dibawah and Singkarak Lakes,
respectively. Evaporation from springs and ponds
was assumed to be negligible because their surface
areas are less than 0.05% of the areas of Singkarak
and Dibawah Lakes.
Daily Singkarak Lake levels, withdrawals from
Singkarak Lake for hydropower, and discharge to the
Ombilin River, obtained from the State Electrical
Power Company, Division III, West Sumatra, were
Fig. 5. Observed and calculated outflows at three river gauging stations determined by the modified T–M water balance model.
N. Peranginangin et al. / Journal of Hydrology 292 (2004) 1–22 11
Table 3
Annual modified Thornthwaite–Mather water balance
Gauging
station
Year Vadose zonea Saturated zonea Observed
outflow
(mm)
Differenceb
(%)
Recharge
as % of
Prec. (%)
Precipitation
(mm)
Actual ET
(mm)
Recharge
(mm)
DSsm
(mm)
Recharge
(mm)
Baseflow
(mm)
DSg
(mm)
Koto Baru 1985 2288 1363 939 214 939 837 101 41
1986 1722 1038 672 13 672 548 124 39
1987 2440 1117 1324 21 1324 1341 217 54
1988 1814 972 875 233 875 970 295 48
1989 1916 1107 778 31 778 516 262 41
1990 2530 1171 1362 23 1362 1303 58 54
1991 2046 1077 970 0 970 920 49 47
1992 2027 1051 986 211 986 1101 2115 972 13 49
1993 2988 1216 1773 21 1773 1672 100 1699 22 59
1994 2502 1497 1007 23 1007 1023 215 874 17 40
1995 2277 1239 1039 0 1039 1082 243 1064 2 46
1996 1869 1110 788 230 788 837 248 817 2 42
1997 1560 1120 416 24 416 373 43 471 221 27
1998 2740 1525 1219 23 1219 1203 16 1138 6 44
Bd. Pandung 1985 2139 1320 819 0 819 940 2121 1071 212 38
1986 1762 1114 649 21 649 623 26 37
1987 2156 1115 1043 21 1043 993 50 48
1988 1833 987 867 221 867 981 2114 47
1989 1881 1174 689 19 689 517 172 37
1990 2346 1206 1144 23 1144 1029 115 1067 24 49
1991 2109 1099 1012 22 1012 963 49 1091 212 48
1992 1967 1236 732 21 732 984 2252 1071 28 37
1993 2733 1340 1394 21 1394 1219 175 1267 24 51
1994 2020 1307 713 0 713 877 2163 858 2 35
1995 2670 1476 1196 21 1196 1159 37 945 23 45
1996 2167 1076 1092 22 1092 1186 294 1460 219 50
1997 1510 1309 202 21 202 309 2108 297 4 13
1998 2474 1089 1385 1 1385 1156 228 1357 215 56
Saruaso 1985 2116 1327 789 0 789 753 36 648 16 37
1986 1783 1126 660 23 660 619 41 37
1987 1957 1082 913 237 913 944 232 47
1988 2082 1185 873 23 873 899 225 42
1989 1743 948 785 10 785 607 177 45
1990 1756 1169 589 21 589 662 274 34
1991 1805 1251 556 23 556 441 116 31
1992 1798 1327 487 216 487 626 2140 728 214 27
1993 1721 1193 542 214 542 556 215 718 223 31
1994 1629 1099 511 19 511 481 30 552 213 31
1995 1849 1489 363 23 363 463 2101 457 2 20
1996 2003 1242 761 21 761 784 223 689 14 38
1997 1665 1426 243 24 243 248 25 314 221 15
1998 2069 1425 648 23 648 635 14 507 25 31
Years begin on January 1 and end on December 31. Precipitation and evapotranspiration were measured; groundwater recharge, DSsm (soil
moisture changes), baseflow, and DSg (groundwater storage changes) were model calculated.a Due to rounding, total inflows may not equal the sums of outflows and storage changes.b The difference of estimated outflows (baseflows) with respect to observed outflows.
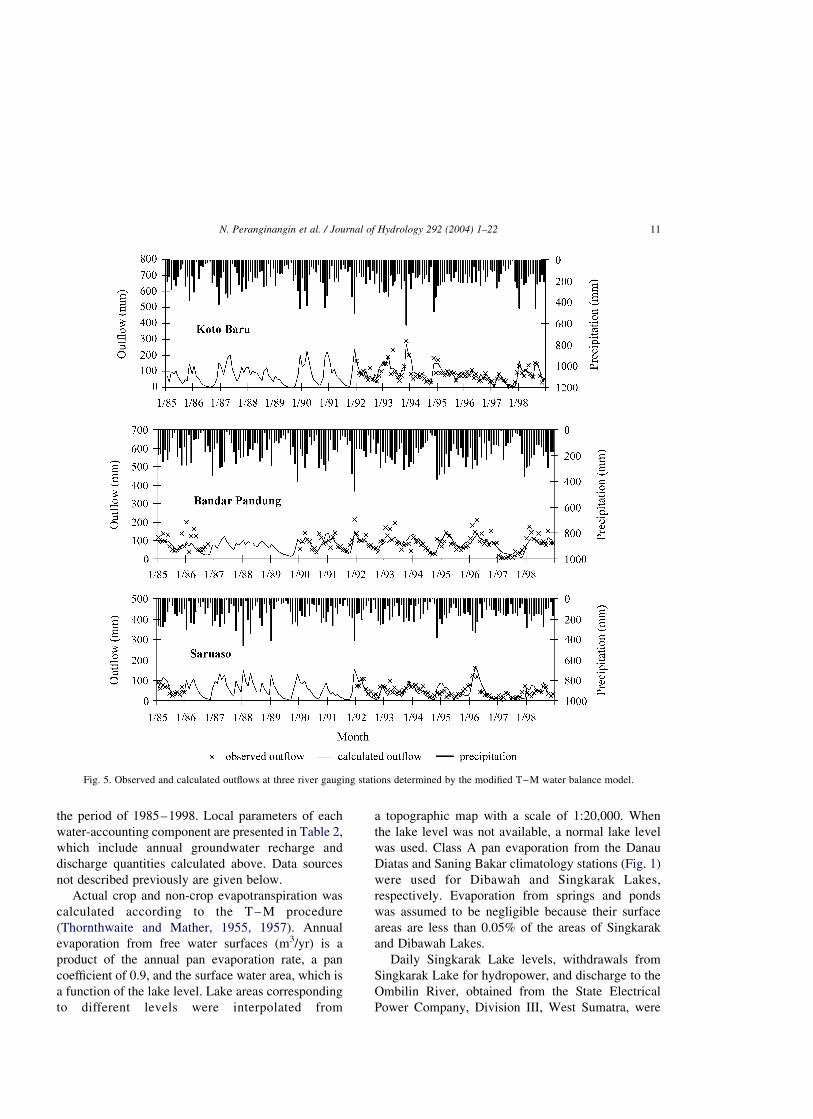
N. Peranginangin et al. / Journal of Hydrology 292 (2004) 1–2212
available for June 1998–November 1999. The lake
level data indicate insignificant changes from the
beginning of a year to the beginning of the next year,
and over a long term the changes in the lake level are
insignificant compared to the overall water balance
components. Therefore, it was assumed that during
the period 1985–1998 annual changes in the Sing-
karak Lake level were negligible in the overall water
balance components. No data were available for
changes in the Dibawah Lake levels, which were
assumed to be insignificant.
Livestock and domestic water consumption was
based on national per capita consumption rates.
According to the Directorate General of Human
Settlements, Ministry of Public Works, Provincial
Planning and Development Board, and local and
provincial water supply enterprises, average non-
domestic water consumption (commercial and
small-scale industrial uses) ranged from 13 to 21%
of the total domestic water consumption. Water
consumption by large-scale industries, such as the
Ombilin coal-washing plant, the Ombilin and Salak
thermal power plants, and the AMIA bottled water
industry, was obtained directly from industry
officials. Based on a local survey, livestock,
domestic (household activities), and non-domestic
Fig. 6. Estimated groundwater discharge and groundwater recharge in three river sub-basins determined by the modified T–M water balance
model.
N. Peranginangin et al. / Journal of Hydrology 292 (2004) 1–22 13
(commercial and industrial activities) water
depletion was assumed to be 10, 10, and 20%,
respectively, of total water consumption of each use.
The rest was returned as wastewater.
Outflow from Singkarak Lake was calculated by
subtracting the lake evaporation from the sum of
inflows and precipitation to the lake. Since the
Singkarak HEPP began diverting water in May
1998, outflow from the lake has been regulated at 2,
2, and 6 m3/s during the wet, normal, and dry months,
respectively (West Sumatra Governor Decree No.
SK.669.1-565-1998). This regulated outflow was used
downstream (Ombilin River sub-basin) for irrigation,
domestic water supply, the Ombilin coal-washing
plant, and the Ombilin and Salak thermal power
plants. Since there was no information available about
downstream environmental requirements, committed
outflow from the Singkarak sub-basin was calculated
based on the need for regulated outflow only and no
committed outflow from the Ombilin River sub-basin
was assumed. Non-utilizable outflow was not
identified.
4.2.2. Results
Water use patterns and indicators were determined
for three different periods: 1985–1996 (‘normal’
conditions with the average of 214 cm of precipi-
tation), 1997 (extremely dry year with 174 cm of
precipitation), and 1998 (onset of withdrawals for the
Singkarak HEPP) and the wettest year, with 286 cm of
precipitation). Four scenarios were analyzed for
1985–1998. The first scenario is the actual condition
for 1985–1998, in which the Singkarak HEPP
diverted 682 million m3 from the basin, beginning in
May 1998. The second represents a possible future
scenario by duplicating 1985–1998 climatic con-
ditions, but assuming that hydropower diversions
began in 1985. For this scenario, we assumed that the
average discharge from Singkarak Lake to the
Ombilin River was 6 m3/s from June to September
(dry months) and 2 m3/s for other months and that
average withdrawal for hydropower was at its
guaranteed discharge of 37.2 m3/s (State Electrical
Power Company, 1998). The third scenario is similar
to the second one with the addition that downstream
field irrigation was increased during the wet months
(January–April), which consequently enhanced flows
during the dry months (June–September) as explained
earlier. The last scenario is similar to the second one
with the addition that the downstream irrigated area
during the dry months (June – September) was
increased to increase or maximize beneficial
utilization.
We calculated five water-accounting indicators to
help identify opportunities for improving water
management. The first four were adopted from
Molden and Sakthivadivel (1999); the fifth indicator
was developed for this study. The selected indicators
are
† Depleted fraction of gross inflow
DFgross ¼ D=Ig ¼ ðDp þ Dnb þ DnnÞ=Ig ð19Þ
† Depleted fraction of available water
DFavailable ¼ D=A ¼ ðDp þ Dnb þ DnnÞ=A ð20Þ
† Process fraction of available water
PFavailable ¼ Dp=A ð21Þ
† Beneficial utilization of available water
BUavailable ¼ Db=A ¼ ðDp þ DnbÞ=A ð22Þ
† Potential beneficial utilization of available water
PBUavailable ¼ Dpb=A ¼ R=A ð23Þ
where Ig is the gross inflow; D; the water depletion;
Dp; the process depletion; Dnb; the non-process,
beneficial depletion; Dnn; the non-process, non-
beneficial depletion; A; the available water; Db, the
beneficial depletion; Dpb is the potential beneficial
depletion, which in this basin is the amount of
groundwater recharge, R:
Depleted fraction indicates the fraction of either
inflow or available water that is depleted. Beneficial
utilization indicates the fraction of available water
that is beneficially depleted, where beneficial
depletion produces a good or fulfills a beneficial
need and is either process or non-process depletion,
and available water is defined as net inflow less non-
utilizable outflow and the amount of water set aside
for committed uses outside of the domain. Net inflow
is gross inflow plus any changes in storage. The
distinction between non-beneficial and beneficial
depletion is critical. For example, evapotranspiration
N. Peranginangin et al. / Journal of Hydrology 292 (2004) 1–2214
from phreatophytes might be beneficial if they serve
as a buffer zone around a lake, but non-beneficial if
the depletion does not meet environmental needs.
PBUavailable indicates how much available, but cur-
rently unused, water can potentially be depleted
beneficially. In this basin, PBUavailable represents
how much groundwater recharge is potential for use.
All indicators are expressed as fractions.
4.2.3. Scenario 1: water accounting
of the Singkarak–Ombilin river basin, 1985–1998
Table 4 summarizes water use and indicators for
1985–1998. The indicator of DFavailable shows that
even during the drought of 1997, some excess water
was available for further uses. Specifically, DFavailable
indicates that 57–81% of the available water in the
Singkarak–Ombilin River basin was depleted, leav-
ing 19–43% for further use. Hence, the Singkarak–
Ombilin River basin and its sub-basins were open
basin/sub-basins (Molden, 1997; Molden and Sakthi-
vadivel, 1999), meaning an uncommitted utilizable
flow existed that can be depleted within the domain.
The amount of available water that was depleted by
process uses, PFavailable; in the entire basin ranged
from 0.24 to 0.38, indicating water depleted by
process uses was low. Water use effectiveness in the
basin was low, as indicated by BUavailable ranging from
0.37 to 0.52, meaning that only about 37–52% of the
available water was beneficially depleted. The other
48–63% was depleted mostly by evapotranspiration
from shrubs/bush and fallow. Economic and popu-
lation pressures (population density in the basin was
about 2.5 times that of the West Sumatra Province)
have led to extensive areas of fallow associated with
slash-and-burn practices and shifting cultivation.
PBUavailable indicates that 19–41% of total avail-
able water recharges the aquifer. Before discharging
to rivers as baseflow, this recharge is stored in the
aquifer and can be potentially depleted for beneficial
purposes. Under current conditions, all of the
groundwater eventually discharges to rivers, which
flow out of the basin, becoming unutilized outflow
within the basin (utilizable for downstream users out
of the basin). However, some of the stored ground-
water can be potentially exploited for irrigation within
the basin. This water, which previously discharged
from the basin, would now be depleted beneficially
within the basin, as evapotranspiration from crops. In
this way, water would be used more productively
within the basin, and unutilized outflow would be
reduced. This option is especially attractive for the
Ombilin River sub-basin after the start of the
Singkarak HEPP because, in contrast to surface
water, which is fully utilized, groundwater is still
available during the dry period (see Scenario 4). It
should be noted that the groundwater recharge could
also be potentially used for other beneficial uses
within the basin as well as for environmental
commitment downstream outside the basin (i.e. to
maintain fisheries, prevent the river from carrying out
pollutants that would otherwise concentrate in the
stream). However, lack of definition and information
regarding these uses made it impossible to take the
uses into account.
4.2.4. Scenario 2: predicted water accounting of the
Singkarak–Ombilin river basin after diversion to the
Singkarak HEPP
Table 5 summarizes predicted future water use and
indicators, assuming 37.2 m3/s of water is diverted
annually to the Singkarak HEPP under 1985–1998
climate conditions. In this scenario, during an
extremely dry year like 1997, depletion would exceed
gross inflow, as indicated by DFgross of 1.12 and 1.25
for the entire basin and for the Singkarak sub-basin,
respectively. This overdraft was not permanent since
it would be made up in the next year, as shown by
DFgross of 0.77 and 0.81 for the respective basins in
1998. Water depletion in excess of gross inflow would
come from unsustainable water withdrawal from
Singkarak Lake. Recently, conflicts between the
local community and government have arisen over
the use of additional land exposed by the declining
lake level.
Under the predicted future scenario, available
water in the Singkarak–Ombilin River basin would
be nearly depleted, as indicated by DFavailable of 0.81–
0.95 (Table 5). Thus, overall the basin would be in
transition from an open to a closing basin. Looking
into the sub-basin level, water resources in the
Singkarak sub-basin would be fully utilized
ðDFavailable ¼ 1Þ; as all excess flow to Singkarak Lake
was withdrawn for the Singkarak HEPP. Clearly,
there would no scope for increased depletion
N. Peranginangin et al. / Journal of Hydrology 292 (2004) 1–22 15
and reduced outflow to Singkarak Lake, as that would
cause unsustainable lake level changes. Although
there is no clear water allocation rule in the upstream,
higher priority was given to hydropower than to
agriculture. Therefore, an opportunity for increasing
water productivity in the agricultural sector could be
by regenerating soil fertility and controlling weeds,
thus reducing non-beneficial evaporative depletion by
converting fallow, bush, and shrubs to cropland. Other
options are to switch to less water-demanding crops or
to cultivate fewer but economically more valuable
crops.
In contrast to the Singkarak sub-basin, the
Ombilin River sub-basin (downstream) would
remain open, even if the Singkarak HEPP continues
to divert 37.2 m3/s outside the basin (Table 5). Thus,
opportunities for more water supplies could be
safely developed without harm to downstream uses.
For example, by utilizing excess surface water to
reduce outflow downstream (Scenario 3), or tapping
into groundwater storage (Scenario 4), as
PBUavailable indicates about 5–37% of available
water is recharge (Table 5), which can be retained
in the aquifer for months (Fig. 6), during which it
Table 4
Water accounting of the Singkarak–Ombilin River basin, 1985–1998 (Scenario 1)
Components Singkarak sub-basin Ombilin River sub-basin Singkarak–Ombilin River basin
1985–1996 1997 1998 1985–1996 1997 1998 1985–1996 1997 1998
Inflow Water use (million m3/year)
Gross inflow 2612 2065 3926 3366 2423 3534 4739 3855 6320
Precipitation 2612 2065 3926 2127 1790 2394 4739 3855 6320
Surface flow 0 0 0 1239 633 1141 0 0 0
Storage changea 211 26 91 25 240 64 216 214 155
Soil moisture change 21 21 0 23 234 28 24 235 28
Lake storage change 0 0 0 0 0 0 0 0 0
Groundwater storage change 210 27 91 22 26 36 212 21 126
Net Inflow 2623 2039 3835 3371 2463 3470 4755 3869 6165
Depletion 1384 1406 2695 1312 1719 1695 2696 3125 4389
Processa 503 494 1435 638 909 893 1141 1403 2328
ET from agricultural crops 502 493 752 636 906 891 1138 1399 1643
Dom. non-dom. livestockb 1 1 683 2 2 2 3 4 685
Non-process beneficial (forest) 370 350 483 234 250 236 604 600 719
Non-process non-beneficial 511 561 777 439 560 565 950 1122 1342
Total beneficial 873 845 1918 873 1159 1130 1746 2003 3047
Outflow 1239 633 1221 2059 744 1776 2059 744 1776
Committed 0 0 80 0 0 0 0 0 80
Uncommitted utilizable 1239 633 1141 2059 744 1776 2059 744 1695
Uncommitted non-utilizable 0 0 0 0 0 0 0 0 0
Groundwater recharge 1118 611 1684 818 104 671 1936 716 2356
Available water 2623 2039 3755 3371 2463 3470 4755 3869 6085
Indicators
DFgross 0.54 0.68 0.69 0.39 0.71 0.48 0.57 0.81 0.69
DFavailable 0.54 0.69 0.72 0.39 0.70 0.49 0.57 0.81 0.72
PFavailable 0.19 0.24 0.38 0.19 0.37 0.26 0.24 0.36 0.38
BUavailable 0.34 0.41 0.51 0.26 0.47 0.33 0.37 0.52 0.50
PBUavailable 0.43 0.30 0.45 0.25 0.04 0.19 0.41 0.19 0.39
a Due to rounding, totals may not equal sums of values.b Livestock depletive use ranged from 0.03 to 0.012 million m3/yr.
N. Peranginangin et al. / Journal of Hydrology 292 (2004) 1–2216
can be potentially used beneficially. Both options
are explored below.
4.2.5. Scenario 3: increasing downstream irrigation
during the wet months (January–April)
The unique advantage of the shallow aquifer in the
Ombilin River sub-basin offers an alternative of using
groundwater and surface water conjunctively by
expanding the irrigated area to utilize excess surface
water during the wet months (January–April). Instead
of immediately draining from the basin, the excess
irrigation water would infiltrate through irrigated
fields to the aquifer, resulting in increased ground-
water recharge. Eventually, this groundwater would
discharge to rivers, increase the river water level
during the dry months (June – September), and
potentially be used for irrigating dry season crops
and have other beneficial uses. We will examine this
alternative and evaluate its performance with respect
to its final outflows.
The modified T–M monthly time step water
balance model was used to simulate the above
alternative. It was assumed that the hydropower
has taken place since 1985. Therefore, in addition to
Table 5
Water accounting of the Singkarak–Ombilin River basin, after assuming 37.2 m3/s diverted annually from Singkarak Lake to the Singkarak
HEPP (Scenario 2)
Components Singkarak sub-basin Ombilin river-basin Singkarak–Ombilin river basin
1985–1996 1997 1998 1985–1996 1997 1998 1985–1996 1997 1998
Inflow Water use (million m3/year)
Gross inflow 2612 2065 3926 2232 1895 2499 4739 3855 6320
Precipitation 2612 2065 3926 2127 1790 2394 4739 3855 6320
Surface flow 0 0 0 105 105 105 0 0 0
Storage changea 250 2619 634 25 240 64 255 2659 698
Soil moisture change 21 21 0 23 234 28 24 235 28
Lake storage change 239 2645 544 0 0 0 239 2645 544
Groundwater storage change 210 27 91 22 26 36 212 21 126
Net Inflow 2663 2684 3292 2237 1935 2435 4795 4514 5622
Depletion 2557 2579 3186 1312 1719 1695 3869 4298 4881
Processa 1676 1667 1926 638 909 893 2315 2576 2819
ET from agricultural crops 502 493 752 636 906 891 1138 1399 1643
Dom. non-dom. livestockb 1174 1174 1174 2 2 2 1176 1177 1177
Non-process beneficial (forest) 370 350 483 234 250 236 604 600 719
Non-process non-beneficial 511 561 777 439 560 565 950 1122 1342
Total beneficial 2046 2018 2409 873 1159 1130 2919 3177 3539
Outflow 105 105 105 926 216 740 926 216 740
Committed 105 105 105 0 0 0 0 0 80
Uncommitted utilizable 0 0 0 926 216 740 926 216 660
Uncommitted non-utilizable 0 0 0 0 0 0 0 0 0
Groundwater recharge 1118 611 1684 818 104 671 1968 673 2245
Available water 2557 2579 3186 2237 1935 2435 4795 4514 5541
Indicators
DFgross 1.00 1.25 0.81 0.59 0.91 0.68 0.82 1.12 0.77
DFavailable 1.00 1.00 1.00 0.59 0.89 0.70 0.81 0.95 0.88
PFavailable 0.66 0.65 0.60 0.28 0.47 0.37 0.48 0.57 0.51
BUavailable 0.80 0.78 0.76 0.39 0.60 0.46 0.61 0.70 0.64
PBUavailable 0.44 0.24 0.53 0.37 0.05 0.28 0.41 0.15 0.41
a Due to rounding, totals may not equal sums of values.b Livestock depletive use ranged from 0.03 to 0.012 million m3/yr.
N. Peranginangin et al. / Journal of Hydrology 292 (2004) 1–22 17
the assumptions made in Scenario 2, during the wet
months (January–April) of each simulated year
(1985–1998), the irrigated area was expanded from
an existing average of 5% (Table 1) to 34% of the total
downstream area, simulated by irrigating not only a
‘dry land rice field’, but also a ‘rainfed rice field’ and
‘other field crops’. Increased irrigation water demand
was supplied by the excess surface flows that were
always available during the wet months of January–
April. The irrigation water requirement for all crops
was based on the local standard, which was 1.1 l/ha/s
(Sugianto, 2000, personal communication). Total
outflow was the sum of groundwater discharge
(baseflow) calculated from the modified T–M model
and regulated surface flow from Singkarak Lake (2–
6 m3/s).
The groundwater balance presented in Table 6
indicates that the recharge, which is the potential for
beneficial depletion, during the wet months (Janu-
ary–April) would rise by 108, 300, and 140% for
1985–1996, 1997, and 1998, respectively, from that
of Scenario 2. The results show that groundwater
discharge during the dry months (June–September)
would increase by 73, 195, and 36% for 1985–
1996, 1997, and 1998, respectively, from that of
Scenario 2, and total outflow at the downstream
outlet during the dry months would increase by 49,
54, and 29% for 1985–1996, 1997, and 1998,
respectively.
4.2.6. Scenario 4: increasing irrigation downstream
during the dry months (June–September)
After the Singkarak HEPP began operation, it was
predicted that only limited excess surface flow would
be available downstream during the dry months
(June– September), as described in Scenario 2.
Given land use and its cultivated crops remain
unchanged, an option to increase water beneficial
utilization during the dry months is by tapping into
groundwater storage and using the groundwater
supply for irrigating more dry season crops.
The modified T–M monthly water balance model
was used for the 1985–1998 period to simulate the
above option. As mentioned in Scenario 3, it was
assumed that the hydropower has taken place since
1985. During the dry months of June–September, the
irrigated area was expanded from the original 5–34%
of the total downstream land with an irrigation water
requirement of 1.1 l/ha/s (Sugianto, 2000, personal
communication). The irrigated fields were a ‘dry land
rice field’, ‘rainfed rice field’, and ‘other field crops’
with an average percentage of total land available
Table 6
Downstream groundwater balance for wet (January–April) and dry (June–September) months of Scenarios 2 and 3 (million m3)
Scenarioa Recharge Groundwater discharge Groundwater
Storage change
Outflowb
Wet Dry Irrigation Net dischargec Wet Dry Wet Dry
Wet Dry Wet Dry
1985–1996(2) 456.6 32.0 0.0 0.0 423.7 132.1 33.0 2100.1 444.5 195.4
1985–1996(3) 948.8 32.0 483.7 0.0 253.9 228.4 211.2 2196.3 274.7 291.6
Change (%) 107.8 0.0 240.1 72.9 541.0 296.2 238.2 49.3
1997(2) 75.8 0.7 0.0 0.0 65.7 24.2 10.1 223.5 86.4 87.5
1997(3) 303.5 0.7 229.2 0.0 0.0 71.6 74.3 270.9 0.0 134.8
Change (%) 300.4 0.0 2100.0 195.2 632.8 2201.0 2100.0 54.1
1998(2) 327.4 343.2 0.0 0.0 211.6 270.8 115.8 72.4 232.3 334.0
1998(3) 785.5 343.2 457.6 0.0 39.7 368.3 288.2 225.1 50.2 431.5
Change (%) 139.9 0.0 281.2 36.0 148.9 2134.7 278.4 29.2
Scenario 2 is a possible future scenario after diversion to the Singkarak HEPP. Scenario 3 is similar to Scenario 2 with the addition of
increased irrigation during the wet months.a Numbers in brackets indicate scenario.b Outflow is the sum of groundwater discharge and regulated surface flow from Singkarak Lake at 2 and 6 m3/s for wet and dry years,
respectively.c Net discharge is total groundwater discharge minus withdrawal for irrigation.
N. Peranginangin et al. / Journal of Hydrology 292 (2004) 1–2218
downstream as 5, 7, and 22%, respectively (Table 1).
In order to avoid long-term overdraft, it was assumed
that the volume of groundwater storage could not be
withdrawn below the naturally occurring dry month
storage volume (i.e. the height of the water table
above a reference level, ht; could not be negative after
groundwater withdrawal).
Results indicate that by expanding the irrigated
area during the dry months, beneficial utilization
downstream would increase by 7% from Scenario 2
(Table 7). In an exceptionally dry year like 1997,
this scenario demonstrates that it remained viable to
increase beneficial utilization by irrigating more dry
season crops. During the dry months, the given
groundwater discharge is insignificant compared to
the overall water balance components (Table 7). The
outflow in the river would largely depend on the
supply from Singkarak Lake (6 m3/s), as total
outflow to the river downstream is the sum of
groundwater discharge and surface flow from the
lake.
An overall summary of downstream water
accounting indicators and outflow for Ombilin
River sub-basin across all scenarios is presented in
Table 8. In terms of relative water use performance,
results show that, in general, Scenario 4 contributes
to the highest indicator performance and the least
unutilized (within the basin) outflow among all the
scenarios.
5. Discussion
Clearly, water should not be depleted beyond the
limit set by the available water. The reliability of
water availability estimates depends on the accuracy
of individual water balance components. In the
original M–S water-accounting examples, ground-
water levels are known, or groundwater storage
change can be assumed negligible (Molden, 1997;
Molden et al., 2001). Combining groundwater and
surface water into a single domain may provide a
good estimate of available water; however, the
importance of groundwater cannot be identified, and
this can only be ignored if groundwater exploitation
is negligible. In cases where it is known that
Table 7
Downstream water balance for dry months (June–September) of Scenarios 2 and 4 (million m3): (a) vadose zone, (b) above groundwater zone
(a) Vadose zone
Scenarioa Inflow Depletion Outflow
Recharge
Soil moisture
storage change
Precipitation Surface flow Groundwater
irrigation
Beneficial Non-beneficial
1985–1996 (2) 431 57 0 287 145 32 2 34
1985–1996 (4) 431 57 558 307 145 563 2 26
1997 (2) 457 57 0 355 172 1 2 71
1997 (4) 457 57 227 372 172 205 2 66
1998 (2) 913 57 0 377 188 343 5
1998 (4) 913 57 648 378 188 990 5
(b) Above groundwater zone
Scenarioa Recharge Groundwater
pumping
Groundwater
discharge
Storage
change
1985–1996 (2) 32 0 132 2100
1985–1996 (4) 563 558 110 2106
1997 (2) 1 0 24 224
1997 (4) 205 227 5 227
1998 (2) 343 0 271 72
1998 (4) 990 648 269 73
Scenario 2 is a possible future scenario after diversion to the Singkarak HEPP. Scenario 4 is similar to Scenario 2 with the addition of
increased irrigation during the dry months.a Numbers in brackets indicate scenario.
N. Peranginangin et al. / Journal of Hydrology 292 (2004) 1–22 19
groundwater components play an important role in the
overall water balance, such as in this basin, explicit
analysis of groundwater is critical. In the Singkarak–
Ombilin River basin, groundwater storage could
supplement the current water supply. Our separation
of groundwater and surface water in the water-
accounting procedure, involving a simple monthly
groundwater balance model, offers a more realistic
estimate of water availability and a more realistic
approach in saving water from discharging outside the
basin as revealed in Scenarios 3 and 4 (Tables 6 and 7).
Given the minimal hydrogeologic data available, the
groundwater balance model itself could provide
useful insights on groundwater flow mechanism in
the basin.
As found in many other basins, there are
uncertainties in the water accounting computations
of this basin. For example, errors in the measurement
of precipitation and evaporation, missing data, and
there may be minor groundwater exploitation and lake
level changes which we have assumed to be
negligible. In our case, outflow was the closure of
water balance, calculated by subtracting total water
depletion from the net inflow. Consequently, the
accuracy of the closure term is associated with the
accuracy of other terms entering the water balance.
We carefully tried to estimate the accuracy of the
closure term presented in Table 4 by following the
methodology proposed by Clemmens and Burt
(1997). Precipitation was assumed with 10% confi-
dence interval, evaporation with 15%, and other
components and coefficients with 10%. The confi-
dence interval equalled twice the coefficient of
variation of a normal (Gaussian) distribution. Under
these assumptions, the average confidence interval of
the outflow was estimated to be ^21%. Despite this
accuracy level, the finding remains that outflow is a
major component in the overall water balance and,
accordingly, a similar finding also holds for ground-
water recharge, as it is the key contributor to the
outflow in this basin.
6. Conclusions
The Molden and Sakthivadivel water accounting
procedure has proven very useful for analyzing
water use patterns and identifying opportunities forTab
le8
Do
wn
stre
amw
ater
-acc
ou
nti
ng
ind
icat
ors
and
ou
tflow
for
all
scen
ario
s
Com
po
nen
tsS
cen
ario
1S
cen
ario
2S
cen
ario
3S
cen
ario
4
19
85
–1
99
61
99
71
99
81
98
5–
19
96
19
97
19
98
19
85
–1
99
61
99
71
99
81
98
5–
19
96
19
97
19
98
DF
gro
ss0
.39
0.7
10
.48
0.5
90
.91
0.6
80
.60
0.9
20
.69
0.6
10
.94
0.6
9
DF
avail
able
0.3
90
.70
0.4
90
.59
0.8
90
.70
0.6
00
.90
0.7
00
.60
0.9
20
.70
PF
avail
able
0.1
90
.37
0.2
60
.28
0.4
70
.37
0.2
90
.48
0.3
80
.30
0.5
00
.37
BU
avail
able
0.2
60
.47
0.3
30
.39
0.6
00
.46
0.4
00
.61
0.4
70
.41
0.6
30
.47
PB
Uavail
able
0.2
50
.04
0.1
90
.37
0.0
50
.28
0.5
90
.17
0.4
60
.61
0.1
60
.54
Ou
tflo
w(£
10
6m
3/y
r)2
05
9.3
77
43
.53
17
75.7
69
25
.56
21
5.5
87
40
.41
90
5.9
51
96
.55
71
8.3
48
86
.46
16
2.2
47
21
.99
Sce
nar
io1
isth
eac
tual
con
dit
ion
of
19
85
–1
99
8,
inw
hic
h6
82
mil
lion
m3
of
wat
erw
asd
iver
ted
from
the
up
per
sub
-bas
into
the
Sin
gkar
akH
EP
P,
beg
inn
ing
inM
ay1
99
8.
Sce
nar
io2
isa
po
ssib
lefu
ture
scen
ario
by
du
pli
cati
ng
19
85
–1
99
8cl
imat
icco
nd
itio
ns,
bu
tas
sum
ing
that
the
div
ersi
on
of
37
.2m
3/s
toth
eS
ing
kar
akH
EP
Pb
egan
in1
98
5.S
cen
ario
3is
sim
ilar
toS
cen
ario
2w
ith
the
add
itio
no
fin
crea
sed
irri
gat
ion
do
wn
stre
amd
uri
ng
the
wet
mo
nth
s(J
anu
ary
–A
pri
l).
Sce
nar
io4
issi
mil
arto
Sce
nar
io2
wit
hth
ead
dit
ion
of
incr
ease
dir
rig
atio
nd
ow
nst
ream
du
rin
gth
ed
rym
on
ths
(Ju
ne
–S
epte
mb
er).
N. Peranginangin et al. / Journal of Hydrology 292 (2004) 1–2220
improving water management within a basin. When
groundwater is an important component of the overall
water balance, ground and surface water separation can
improve water availability estimation and provide a
more realistic approach for water savings. Although
the precise mechanisms of groundwater flow through
the Singkarak–Ombilin River basin are not clearly
understood, our modified Thornthwaite–Mather water
balance model generated plausible groundwater
recharge and discharge data for explicit water-
accounting analysis. Results of the water-accounting
analysis show that the basin is in transition from an
open basin (additional water is available for use) to a
closing basin (nearly no more water is available for
use). After diversions to the Singkarak Hydro Electric
Power Plant (HEPP) began in 1998, the amount of
water that was not available for other uses, such as for
irrigation, was envisaged to increase from 57–81 to
81–95% of water available for use in the basin. In the
downstream, with nearly all water supplies fully
utilized during the dry months (June–September),
the modified water accounting demonstrates that
tapping water from a shallow, unconfined aquifer
during the dry months is an appealing way for
increasing water beneficial utilization, while the use
of groundwater and surface water conjunctively during
the wet months (January–April) reveals an attractive
approach for increasing water supply and beneficial
utilization.
Acknowledgements
This research was supported and financed by the
International Water Management Institute (IMWI)
and the Department of Biological and Environmental
Engineering at Cornell University. Special thanks to
the Center for Irrigation, Land and Water Resources,
and Development Studies of Andalas University,
Indonesia, for the opportunity to conduct this
research. Special appreciation is extended to Pierre
Gerard-Marchant for helpful discussion with the
model development.
References
Allen, R.G., Pereira, L.S., Raes, D., Smith, M., 1998. Crop
Evapotranspiration, Guidelines for Computing Crop Water
Requirement. FAO Irrigation and Drainage Paper No. 56,
FAO, Rome, Italy.
Alley, W.M., 1984. On the treatment of evapotranspiration, soil
moisture accounting, and aquifer recharge in monthly water-
balance models. Water Resour. Res. 20, 1137–1149.
Arief, S., Ruchijat, S., 1990. Peta Hidrogeologi Indonesia 1:250,
000: Catatan Penerangan Lembar 0715, Padang, Sumatra Barat.
Departement Pertambangan dan Energi, Ditjen, Geologi dan
Sumberdaya Minereal, Direktorat Geologi Tata Lingkungan,
Bandung, Indonesia.
Brutsaert, W., Lopez, J.P., 1998. Basin-scale geohydrologic drought
flow features of riparian aquifers in the southern Great Plains.
Water Resour. Res. 34, 233–240.
Center for Soil and Agroclimate Research Agency, 1990. Land Unit
and Soil Map. Center for Soil and Agroclimate Research
Agency, Bogor, Indonesia.
Clemmens, A.J., Burt, C.M., 1997. Accuracy of irrigation efficiency
estimates. J. Irrig. Drain. Engng 123, 443–453.
Dunne, T., Leopold, L.B., 1978. Water in Environmental Planning.
W.H. Freeman, San Francisco, CA.
Imbang, I.N.D.R., Rasyidin, R., Armon, N., 1996. Corak and Sifat
Tanah Desa Berlahan Kritis Kecamatan Batipuh, Rambatan, and
X Koto Singkarak. ProRLK, Padang, Indonesia.
IWMI, 1999. Development of Effective Water Management
Institutions. Inception Report and Work Plan. International
Water Management Institute, Colombo, Sri Lanka.
Keller, A., Keller, J., 1995. Effective Efficiency: A Water Use
Concept for Allocating Freshwater Resources, Water Resources
and Irrigation Division Discussion Paper 22, Winrock Inter-
national, Arlington, VA.
Linsley, R.K., Kohler, M.A., Paulhus, J.L.H., 1982. Hydrology for
Engineers. McGraw-Hill, New York.
Mock, F.J., 1973. Land Capability Appraisal Indonesia: Water
Availability Appraisal, Basic study prepared for the FAO/
UNDP Land Capability Appraisal Project, Bogor, Indonesia,.
Molden, D., 1997. Accounting for Water Use and Productivity,
SWIM Paper 1, International Water Management Institute,
Colombo, Sri Lanka.
Molden, D., Sakthivadivel, R., 1999. Water accounting to assess use
and productivity of water. Water Resour. Dev. 15, 55–71.
Molden, D., Sakthivadivel, R., Habib, Z., 2001. Basin-level use and
productivity of water: examples from South Asia, Research
Report 49, International Water Management Institute, Colombo,
Sri Lanka.
Oldeman, L.R., Las, I., Darwis, S.N., 1979. An Agroclimate Map of
Sumatera, No. 52. Central Research Institute of Agriculture,
Bogor, Indonesia.
Postel, S., 1999. Pillar of Sand: Can an Irrigation Miracle Last?
W.W. Norton, London.
Pramudia, A., Estiningtyas, W., Susanti, E., 1998. Prosiding
pertemuan pembahasan dan komunikasi hasil penetlitian tanah
dan agroklimat. Pusat Penelitian Tanah dan Agroklimat,
Prosiding pertemuan pembahasan dan komunikasi hasil pene-
tlitian tanah dan agroklimat. Pusat Penelitian Tanah dan
Agroklimat, Departemen pertanian, Indonesia, pp. 157–174.
Renault, D., Hemakumara, M., Molden, D., 2001. Importance of
water consumption by perennial vegetation in irrigated areas of
N. Peranginangin et al. / Journal of Hydrology 292 (2004) 1–22 21
the humid tropics: evidence from Sri Lanka. Agric. Water Mgmt
46, 215–230.
Saidi, A., 1995. The affecting factors of runoff, sedimentation, and
their impacts on land degradation in Sumani subwatershed,
Solok, West Sumatera. PhD Thesis. Padjajaran University,
Bandung, Indonesia.
Scholz, U., 1983. The Natural Regions of Sumatra and Their
Agricultural Production Pattern: A Regional Analysis, vol. I.
Ministry of Agriculture, Republic of Indonesia.
Schwab, G.O., Fangmeier, D.D., Elliot, W.J., Frevert, R.K., 1993.
Soil and Water Conservation Engineering. Wiley, Hoboken, NJ.
Seckler, D., 1996. The New Era of Water Resources Management:
From Dry to Wet Water Savings, Research Report 1, Inter-
national Irrigation Management Institute, Colombo, Sri Lanka.
Sophocleous, M.A., 1991. Combining the soil water balance and
water-level fluctuation methods to estimate natural groundwater
recharge: practical aspects. J. Hydrol. 124, 229–241.
State Electrical Power Company, 1998. Brief description of
Singkarak Hydro Electric Power Plant. State Electrical Power
Company, Bukit Tinggi, West Sumatra.
Steenhuis, T.S., van der Molen, W.H., 1986. The Thornthwaite–
Mather procedure as a simple engineering method to predict
recharge. J. Hydrol. 84, 221–229.
Sudadi, P., 1983. Hidrogeologi lembar Solok (0815), Sumatera
Barat. Proyek Hidrogeologi dan Konservasi Tanah, Direktorat
Geologi Tata Lingkungan, Bandung, Indonesia.
Thornthwaite, C.W., Mather, J.R., 1955. The water balance. Publ.
Climatol. 8, 1–104.
Thornthwaite, C.W., Mather, J.R., 1957. Instructions and tables for
computing potential evapotranspiration and the water balance.
Publ. Climatol. 10, 181–311.
Zecharias, Y.B., Brutsaert, W., 1988. The influence of basin
morphology on groundwater outflow. Water Resour. Res. 24,
1645–1650.
N. Peranginangin et al. / Journal of Hydrology 292 (2004) 1–2222