Page 1
Aus dem Institut für Tierzucht und Tierhaltung
der Agrar- und Ernährungswissenschaftlichen Fakultät
der Christian-Albrechts-Universität zu Kiel
WATER AND FEED INTAKE IN DAIRY COWS –
MODEL EVALUATION AND POTENTIAL FOR
HEALTH MONITORING
Dissertation
zur Erlangung des Doktorgrades
der Agrar- und Ernährungswissenschaftlichen Fakultät
der Christian-Albrechts-Universität zu Kiel
vorgelegt von
Master of Science
EWALD KRAMER
aus Dorenborg, Ostfriesland
Dekan: Prof. Dr. Uwe Latacz-Lohmann
Erster Berichterstatter: Prof. Dr. J. Krieter
Zweiter Berichterstatter: Prof. Dr. G. Thaller
Tag der mündlichen Prüfung: 09. Februar 2009
Die Dissertation wurde mit dankeswerter finanzieller Unterstützung der Stiftung Schleswig-
Holsteinische Landschaft angefertigt.
Page 3
Table of contents:
General Introduction ............................................................................................................... 1
CHAPTER ONE:
Relationship between water intake, dry matter intake and daily milk yield on a
German research farm............................................................................................................. 5
CHAPTER TWO:
Analysis of water intake, dry matter intake and daily milk yield using different error
covariance structures ............................................................................................................. 17
CHAPTER THREE:
Analysis of water intake and dry matter intake using different lactation curve models
.................................................................................................................................................. 39
CHAPTER FOUR:
Lameness and mastitis detection in dairy cows by application of Fuzzy Logic
.................................................................................................................................................. 59
General Discussion ................................................................................................................. 75
General Summary .................................................................................................................. 83
Zusammenfassung.................................................................................................................. 87
Page 4
1
General Introduction
Water is one of the most important foodstuffs of a dairy cow – the average amount of 87%
water in 1 kg of milk may confirm this thesis (Winchester and Morris, 1956). To ensure good
animal health, performance and welfare status, a sufficient supply of water is essential
(Murphy et al., 1983). Furthermore, automatical measuring of water intake and also feed
intake has started to be established in diverse test stations and dairy research farms (Coffey et
al., 2002, Hüttmann, 2007), whereas the trait milk yield has already been recorded
automatically on the majority of farms.
In the future, water and feed intake will become more important for dairy management due to
their link to the health status of the cow (Lukas et al., 2008) as well as for dairy breeding
because of their relationship to the energy status of the cow (Coffey et al., 2002). In addition,
in times of increasing costs for feed concentrates it is imaginable to include the trait feed
intake into future dairy breeding programmes. Nevertheless, there are only a few sources
published in the literature regarding the relationship between water intake, feed intake and
milk yield. Generally, random regression models have been postulated to analyse daily yield
traits such as milk yield or dry matter intake in order to detect the potential change in the
dependencies of these traits within the course of lactation (Koenen and Veerkamp, 1998,
Veerkamp and Thompson, 1999). Thus, the aim of Chapter One was to analyse the general
relationship between the traits water intake, feed intake and milk yield and to establish
whether the relationships remained constant during the course of lactation. To do this, fixed
and random regression models were used.
Furthermore, the model analysis of daily and hence repeated measures of traits in cows such
as milk yield, milk ingredients, water intake and feed intake are becoming more important,
since repeated measures are assumed not to be independent and thus they are considered to be
autocorrelated (Littell et al., 1998, Littell et al., 2006). According to this, Stamer (1995) found
moderate autocorrelations between repeated measures of daily yields of dry matter intake.
However, in order to obtain valid statistical inference and correct variance components, the
use of applicable error covariance structures is necessary to achieve the best model fit
(Bonham and Reich, 1999, Sawalha et al., 2005, König et al., 2006, Rosário et al., 2007). For
this purpose, the aim of the Chapter Two was to compare fixed and random regression models
with several error covariance structures. Different model fit statistics were used to select an
appropriate covariance model best matching the autocorrelation pattern. Finally, the effect of
Page 5
2
model choice on statistical inference was illustrated on the basis of two model variants with
the best and inferior fit, respectively.
With regard to correct statistical inference, the use of a proper lactation curve model is also
crucial (van der Werf, 2001). Generally, modelling lactation curves has been a frequently
discussed topic in the literature for the trait milk yield in contrast to water or feed intake (e.g.
Wood, 1967, Guo and Swalve, 1995, van der Werf, 2001, Silvestre et al., 2006). Accordingly,
the aim of the Chapter Three was to analyse daily water and feed intake measurements with
different lactation curve models. In a first step, the best function for the average lactation
curve was evaluated and chosen as the basis for the second step, the evaluation of the best
function to model the cow-specific lactation curve.
After the evaluation of the correct model for the analysis of water and feed intake the aim of
the last chapter was to establish a relationship between amongst others water and feed intake
and the cow’s health status. According to this, Lukas et al. (2008) reported that a case of
mastitis or lameness significantly reduces a cow’s water and dry matter intake. Furthermore,
González et al. (2008) indicated differences in feeding behaviour between healthy cows and
cows with lameness within the 30 days before the disease occurred. Hence, in Chapter Four a
fuzzy logic model was developed to detect lameness and mastitis automatically. For this
purpose, amongst others the potential input variables water and dry matter intake and also
certain parameters regarding the animals’ behaviour – such as number of visits at the feeding
troughs and feeding time – were used in order to assess whether they could serve as
alternative input parameters for disease detection models in contrast to parameters obtained
from established sensor technologies.
References
Bonham, C.D., Reich, R.M., 1999. Influence of spatial autocorrelation on a fixed-effect
model used to evaluate treatment of oil spills. Appl. Math. Comput. 106, 149-162.
Coffey, M.P., Simm, G., Brotherstone, S., 2002. Energy balance profiles for the first three
lactations of dairy cows estimated using random regression. J. Dairy Sci. 85, 2669-
2678.
González, L.A., Tolkamp, B.J., Coffey, M.P., Ferret, A., Kyriazakis, I., 2008. Changes in
feeding behaviour as possible indicators for the automatic monitoring of health
disorders in dairy cows. J. Dairy Sci. 91, 1017-1028.
Page 6
3
Guo, Z., Swalve, H.H., 1995. Modelling of the lactation curve as a sub-model in the
evaluation of test day records. In: Proc. Interbull Mtg. Prague, Czechoslovakia.
International Bull Evaluation Service, Uppsala, Sweden. Interbull Bull. No. 11., pp. 4-7.
Hüttmann, H., 2007. Analyse der Futteraufnahme und der Energiebilanzmerkmale bei
hochleistenden, erstlaktierenden Milchkühen. Schriftenreihe des Instituts für Tierzucht
und Tierhaltung der Christian-Albrechts-Universität zu Kiel. Band 164.
Koenen, E.P.C., Veerkamp, R.F., 1998. Genetic covariance functions for live weight,
condition score, and dry-matter intake measured at different lactation stages of Holstein
Friesian heifers. Livest. Prod. Sci. 57, 67-77.
König, S., Köhn, F., Kuwan, K., Simianer, H., Gauly, M., 2006. Use of repeated measures
analysis for evaluation of genetic background of dairy cattle behavior in automatic
milking systems. J. Dairy Sci. 89, 3636-3644.
Littell, R.C., Henry, P.R., Ammerman, C.B., 1998. Statistical analysis of repeated measures
data using SAS procedures. J. Anim. Sci. 76, 1216-1231.
Littell, R.C., Milliken, G.A., Stroup, W.W., Wolfinger, R.D., Schabenberger, O., 2006. SAS
for mixed models, users manual. SAS Inc., Cary, NC, USA, pp. 174-203.
Lukas, J.M., Reneau, J.K., Linn, J.G., 2008. Water intake and dry matter intake changes as a
feeding management tool and indicator of health and estrus status in dairy cows. J.
Dairy Sci. 91, 3385-3394.
Murphy, M.R., Davis, C.L., McCoy, G.C., 1983. Factors affecting water consumption by
Holstein cows in early lactation. J. Dairy Sci. 66, 35-38.
Rosário, M.F., Silva, M.A.N., Coelho, A.A.D., Savino, V.J.M., 2007. Estimating and
predicting feed conversion in broiler chickens by modeling covariance structure. Int. J.
Poult. Sci. 6, 508-514.
Sawalha, R.M., Keown, J.F., Kachman, S.D., van Vleck, L.D., 2005. Evaluation of
autoregressive covariance structures for test-day records of Holstein cows: estimates of
parameters. J. Dairy Sci. 88, 2632-2642.
Silvestre, A.M., Petim-Batista, F., Colaco, J., 2006. The accuracy of seven mathematical
functions in modeling dairy cattle lactation curves based on test-day records from
varying sample schemes. J. Dairy Sci. 89, 1813-1821.
Stamer, E., 1995. Futteraufnahmeverhalten von Milchkühen – Analyse der Zeitstruktur und
Nutzungsmöglichkeiten. Schriftenreihe des Institutes für Tierzucht und Tierhaltung der
Christian-Albrechts-Universität zu Kiel, Band 85.
Page 7
4
van der Werf, J., 2001. Random regression in animal breeding. Course notes. Jaboticabal, SP
Brazil, November 2001. Retrieved November 28, 2008, from http://www-
personal.une.edu.au/~jvanderw/CFcoursenotes.pdf.
Veerkamp, R.F., Thompson, R., 1999. A covariance function for feed intake, live weight, and
milk yield estimated using a random regression model. J. Dairy Sci. 82, 1565-1573.
Winchester, C.F., Morris, M. J., 1956. Water intake rates of cattle. J. Anim. Sci. 15, 722-740.
Wood, P.D.P., 1967. Algebraic model of the lactation curve in cattle. Nature 216, 164-165.
Page 8
5
Chapter One:
Relationship between water intake, dry matter intake and
daily milk yield on a German research farm
E. Kramer1, E. Stamer2, K. Mahlkow3, W. Lüpping3, J. Krieter1
1Institute of Animal Breeding and Husbandry
Christian-Albrechts-University
D-24118 Kiel, Germany 2 TiDa Tier und Daten GmbH, D-24259 Westensee/Brux, Germany
3 Chamber of Agriculture Schleswig-Holstein, D-24327 Blekendorf, Germany
Published in Livestock Science 115: 99-104
Page 9
6
Abstract
The aim of the present study was to investigate the relationship between milk yield, water and
dry matter intake and to clarify whether these relationships remained constant over the stages
of lactation. Data recording was performed on the dairy research farm Futterkamp of the
Chamber of Agriculture Schleswig-Holstein. A dataset of about 39,000 observations from 225
Holstein cows was used. Average milk yield, water and dry matter intake were 34.9, 84.3 and
20.3 kg, respectively. Estimations of variance components were accomplished by applying
linear mixed Fixed Regression (FR) and Random Regression (RR) models. Repeatabilities
with the FR Model were assessed at 0.76 for milk yield, 0.41 and 0.34 for water and dry
matter intake and after applying the RR Model they changed during the lactation to 0.79 -
0.92, 0.46 - 0.52 and 0.43 - 0.50, respectively. Correlations with the FR Model between milk
yield and water and dry matter intake and between water and dry matter intake were 0.73,
0.59 and 0.73 respectively, and after applying the RR Model they ranged in the course of
lactation between 0.13 and 0.84, 0.48 and 0.93, and 0.76 and 0.82, respectively. Hence,
variance components of these traits differed during lactation. Thus the use of RR models must
be emphasised to analyse these traits.
Keywords: dairy cow, water intake, dry matter intake, correlation, Fixed Regression, Random
Regression
Introduction
Water is well known as a dairy cow’s most important foodstuff – this fact being not least
confirmed by an average amount of 87% of water in 1 kg of milk (Winchester and Morris,
1956). A sufficient supply of water is essential to avoid negative effects on animal health,
performance and welfare (Murphy, 1992). Despite this there are only a few sources published
in literature regarding the relationship between water intake, dry matter intake and milk yield,
respectively. Several authors (Koenen and Veerkamp, 1998, Veerkamp and Thompson, 1999)
have shown that traits which are related to the energy status of the cow, e.g. milk yield and
dry matter intake, should be investigated as a function of lactation stage. It was assumed that
the use of means over lactation might not accurately reflect all genetic (co)variation. These
authors postulated the use of Random Regression (RR) models to analyse test day yields such
as milk yield or dry matter intake in order to detect the potential change in the dependencies
of these traits within the course of lactation. The aim of this research was to analyse the
relationship of the traits water intake, dry matter intake and milk yield, respectively. The
Page 10
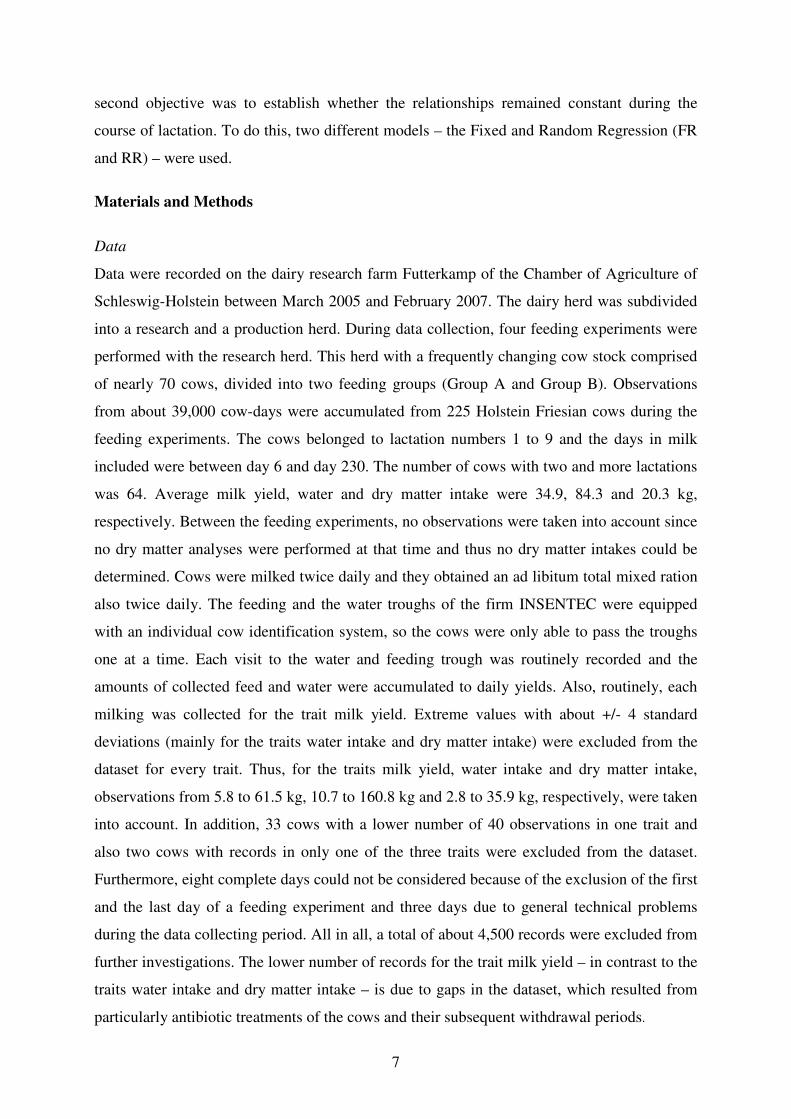
7
second objective was to establish whether the relationships remained constant during the
course of lactation. To do this, two different models – the Fixed and Random Regression (FR
and RR) – were used.
Materials and Methods
Data
Data were recorded on the dairy research farm Futterkamp of the Chamber of Agriculture of
Schleswig-Holstein between March 2005 and February 2007. The dairy herd was subdivided
into a research and a production herd. During data collection, four feeding experiments were
performed with the research herd. This herd with a frequently changing cow stock comprised
of nearly 70 cows, divided into two feeding groups (Group A and Group B). Observations
from about 39,000 cow-days were accumulated from 225 Holstein Friesian cows during the
feeding experiments. The cows belonged to lactation numbers 1 to 9 and the days in milk
included were between day 6 and day 230. The number of cows with two and more lactations
was 64. Average milk yield, water and dry matter intake were 34.9, 84.3 and 20.3 kg,
respectively. Between the feeding experiments, no observations were taken into account since
no dry matter analyses were performed at that time and thus no dry matter intakes could be
determined. Cows were milked twice daily and they obtained an ad libitum total mixed ration
also twice daily. The feeding and the water troughs of the firm INSENTEC were equipped
with an individual cow identification system, so the cows were only able to pass the troughs
one at a time. Each visit to the water and feeding trough was routinely recorded and the
amounts of collected feed and water were accumulated to daily yields. Also, routinely, each
milking was collected for the trait milk yield. Extreme values with about +/- 4 standard
deviations (mainly for the traits water intake and dry matter intake) were excluded from the
dataset for every trait. Thus, for the traits milk yield, water intake and dry matter intake,
observations from 5.8 to 61.5 kg, 10.7 to 160.8 kg and 2.8 to 35.9 kg, respectively, were taken
into account. In addition, 33 cows with a lower number of 40 observations in one trait and
also two cows with records in only one of the three traits were excluded from the dataset.
Furthermore, eight complete days could not be considered because of the exclusion of the first
and the last day of a feeding experiment and three days due to general technical problems
during the data collecting period. All in all, a total of about 4,500 records were excluded from
further investigations. The lower number of records for the trait milk yield – in contrast to the
traits water intake and dry matter intake – is due to gaps in the dataset, which resulted from
particularly antibiotic treatments of the cows and their subsequent withdrawal periods.
Page 11
8
Modelling data
Preliminary investigations were performed using the SAS (2005) software in order to analyse
the fixed effects. The FR basis Model contained the significant fixed effects lactation number,
group test day and lactation curve and the random effects animal and residual. The group test
day was included as a common test day and feeding group effect in order to consider the
possible influences of the different feeding rations. Lactations were divided into the three
classes: first lactation, second lactation, and third and higher lactations. The lactation curves
were modelled by the function according to Ali and Schaeffer (1987). The significance of
fixed effects was tested by the F-test implemented in the MIXED Procedure in SAS (2005).
The significance of differences in LSQ-means was adjusted with the Bonferroni-correction in
the MIXED procedure of SAS (2005). With regard to preconditions for linear models,
homogeneity of variance was checked by plots of the standardised residuals against the
predicted values. Furthermore, the test for normality was applied for the residuals with
frequency plots. All residuals were normally distributed and their variance was homogenous
over the whole range of the predicted estimates.
RR Model:
yijkl = LNRi + GTTj + ∑=
4
1mijklmim (DIM)x*b + ∑
=
4
0mijklmkm (DIM)x*c + eijkl
with: yijkl = observations of milk yield, dry matter intake and water intake
LNRi = fixed effect of the ith lactation (i = 1,...,3)
GTTj = fixed effect of the jth group test day (j = 1,...,1167 for milk yield),
(j = 1,...,1251 for dry matter intake), (j = 1,...,1253 for water intake)
bim = fixed regression effect of the ith lactation
ckm = RR coefficients for the cow effect of the kth cow (k = 1,...,225),
with xijkl0(DIM) = 1, xijkl1(DIM) = 305
DIM, xijkl2(DIM) =
2
305
DIM
,
xijkl3(DIM) = lnDIM
305 und xijkl4(DIM) =
2
DIM
305ln
,
where DIM = days in milk
eijkl = random error
Two different models – the FR and RR – were used. The FR Model did not include the
random regression coefficients for the cow effect of each cow in contrast to the above-
specified RR Model. To answer the question of whether the variance components varied
Page 12
9
depending on stage of lactation, the RR Model was used to model the cow-specific lactation
curves applying the function according to Ali and Schaeffer (1987). The lactation was divided
into seven sections. Lactation Section I included observations within a lactation number from
lactation day 6 to 30, the lactation days 31-60, 61-90, 91-120, 121-150, 151-180, 181-230
were chosen for Sections II, III, IV, V, VI, VII, respectively. Within the traits the
repeatabilities for every section and correlations between cow effects between the sections
were estimated univariately. The estimation of the correlations between cow effects within a
section and between the traits was performed bivariately.
For correlations between water and dry matter intake modelling the cow-specific lactation
curves using the function according to Ali and Schaeffer (1987) did not converge, instead a
polynomial of second degree was used. The formula for the RR polynomial of second degree
Model was similar to the above-specified RR Model, with the exception being that the
coefficients for the cow effect were monomials of second degree with
xijkl0(DIM) = 1, xijkl1(DIM) = 305
DIM, xijkl2(DIM) =
2
305
DIM
.
For the FR and the RR Model, the variance components were estimated by REML using the
software package VCE4 (Neumaier and Groeneveld, 1998) and VCE5 (Kovac et al., 2002),
respectively.
Results
Lactation curves
The lactation curves of first lactation cows for the three traits after modelling with the
parameter according to Ali and Schaeffer (1987) are shown in Figure
1.
Page 13
10
0
10
20
30
40
0 30 60 90 120 150 180 210
Days in milk
Mil
k y
ield
(k
g/d
),
Dry
ma
tter
in
tak
e (k
g/d
)
40
50
60
70
80
Wa
ter
inta
ke
(kg
/d)
Milk yield Dry matter intake Water intake
Figure 1
Lactation curves for milk yield, dry matter intake and water intake for first lactation cows
The curves for primiparous cows showed similar tendencies for the three traits. For milk
yield, the characteristic path of the curve with an increase – here to a maximum level of
almost 30 kg at lactation day 40 – and a following slight decline was obvious. The course for
water intake was similar, but at a higher level. In contrast to the trait milk yield, it took longer
to achieve the maximum level with intakes of about 70 kg, but it also declined slightly in the
further lactation. At lactation day 200, a moderate increase could be observed until lactation
end. The trait dry matter intake increased along the whole lactation, starting from nearly 10 kg
and ending at about 17 kg. The lactation curves of the multiparous cows differed from the
curves of the primiparous cows (not presented). All three traits showed a higher increase at
the beginning of lactation and also a greater decrease at the end of lactation and thus lower
persistence than primiparous cows.
Variance components estimation with the FR Model
The results of the variance component estimation with the FR Model are presented in Table 1.
The marginal number of animals (225 cows) allowed only the estimation of repeatabilities
and correlations between cow effects instead of genetic parameters.
Page 14
11
Table 1
Repeatabilities (diagonal) and correlations between cow effects for the traits milk yield, dry
matter intake and water intake (standard errors in parentheses)
Milk yield Dry matter intake Water intake
Milk yield (kg/d) 0.76 (0.01) 0.59 (0.03) 0.73 (0.02)
Dry matter intake (kg/d) 0.34 (0.02) 0.73 (0.02)
Water intake (kg/d) 0.41 (0.02)
Repeatabilities were between 0.34 and 0.76 for the three traits. The correlation between water
intake and milk yield was 0.73, i.e. the same correlation between water intake and dry matter
intake.
Page 15
12
Variance components in the course of lactation
The results of the variance components estimation with the RR models are given in Table 2.
Table 2
Repeatabilities (diagonal) and correlations between cow effects for the traits at different
stages of lactation
Lactation section I II III IV V VI VII
Milk yield (kg/d)
I 0.79 0.68 0.51 0.51 0.54 0.55 0.46
II 0.79 0.95 0.87 0.76 0.65 0.52
III 0.84 0.96 0.86 0.73 0.53
IV 0.85 0.95 0.85 0.62
V 0.88 0.96 0.75
VI 0.87 0.89
VII 0.92
Water intake (kg/d)
I 0.46 0.80 0.65 0.56 0.50 0.48 0.47
II 0.47 0.95 0.83 0.71 0.64 0.63
III 0.47 0.96 0.87 0.80 0.70
IV 0.49 0.97 0.92 0.76
V 0.51 0.98 0.82
VI 0.48 0.90
VII 0.52
Dry matter intake (kg/d)
I 0.49 0.71 0.52 0.43 0.39 0.40 0.43
II 0.46 0.93 0.78 0.62 0.55 0.60
III 0.44 0.94 0.82 0.73 0.65
IV 0.45 0.96 0.89 0.70
V 0.44 0.97 0.75
VI 0.43 0.86
VII 0.50
The repeatabilities estimated with the RR models at the different lactation sections were
slightly higher than the repeatabilities which resulted from the whole lactation with the FR
models (see above). For milk yield, repeatabilities increased continuously over the course of
Page 16
13
lactation, beginning with w = 0.79 in Section I and rising up to w = 0.92 in the last section.
For water intake and dry matter intake the repeatabilities were almost constant during the
lactation periods. For all three traits the correlations between adjacent lactation sections were
higher with rc = 0.86 and 0.98. In the later stage of lactation the correlations declined with
greater distance between the sections. The correlations between Section I and Section VII for
milk yield, water and dry matter intake were rc = 0.46, 0.47 and 0.43, respectively.
The results of the bivariate analysis for the correlations (cow effects) between the traits at the
different stages of lactation are presented in Table 3.
Table 3
Correlations between cow effects between the traits at different stages of lactation
Lactation section Traits
I II III IV V VI VII
Milk yield – water intake 0.13 0.62 0.76 0.79 0.80 0.81 0.84
Milk yield – dry matter intake 0.48 0.65 0.75 0.74 0.66 0.75 0.93
Water intake – dry matter intake 0.82 0.81 0.80 0.79 0.78 0.77 0.76
There were moderate to high differences between the correlations estimated for the different
lactation sections. The correlations between milk yield and water intake were small in the first
section (rc = 0.13) and increased over the course of lactation up to rc = 0.84 in Section VII.
Similar tendencies were found between milk yield and dry matter intake with a moderate
correlation of rc = 0.48 in the first section and a high value of rc = 0.93 in the last lactation
section. Almost constant correlations in a range of rc = 0.76 to 0.82 were estimated for water
intake and dry matter intake over the lactation period.
Discussion
Lactation curves
The lactation curve for water intake showed a similar path to the curve for milk yield with
only a shift in level, which was also observed by Murphy et al. (1983), who investigated
factors affecting water consumption of multiparous cows in the first 16 weeks of lactation.
The moderate increase in water intake at the end of lactation was not very meaningful since
most of the cows had left the research groups at the end of lactation and only a few records
entered the analyses at that time. For all traits, the curves of the multiparous cows differed
from the curves of the primiparous cows with a greater increase at the beginning of lactation
Page 17
14
and lower persistence at the end of lactation. The similar paths of water intake and milk yield
were again apparent and suggested an intense relationship between these traits.
Variance components estimation
Repeatabilities estimated with the FR Model ranged from w = 0.34 to 0.76 for the three traits.
The estimated repeatabilities for milk yield were in line with the results published by
Hüttmann et al. (2006). Lower repeatabilities for milk yield were found at w = 0.50 by van
Tassell et al. (1999) – their dataset was much larger and included data from different dairy
herds. For the repeatability of dry matter intake the results were in line with Hüttmann et al.
(2006) but lower than the value of w = 0.60 for the trait net energy intake from roughage
found by Svendsen et al. (1992). The lower values for the traits dry matter and water intake
showed the higher impact of temporary environmental variance on these traits in contrast to
the trait milk yield.
The correlations between cow effects estimated with the FR Model were between rc = 0.59
and 0.73. Between dry matter intake and milk yield the value was in line with the genetic
correlations given by Veerkamp (1998), on average at rg = 0.60 in a review of different
literature sources. The given correlation between water intake and dry matter intake of rc =
0.73 was in agreement with investigations carried out by Murphy et al. (1983), Murphy
(1992) and Meyer et al. (2004), who associated higher dry matter intake with increasing water
intake.
The repeatabilities estimated with the RR models at the different lactation sections were
slightly higher than the repeatabilities given by the FR models. For milk yield, repeatabilities
increased during lactation, whereas they were almost constant for water and dry matter intake
in the different lactation sections. Estimated repeatabilities in the course of lactation have
been seldom published in literature. Strabel and Misztal (1999) assessed milk yield in Polish
Black and White heifers and obtained a repeatability of w = 0.71, 0.62 and 0.61 at lactation
days 30, 150 and 250, respectively. Thus in contrast to this investigation they only found a
slight decrease in the repeatability during the course of lactation.
The correlations (cow effects) between Section I and Section VII for milk yield, water and dry
matter intake were rc = 0.46, 0.47 and 0.43, respectively. In the literature, no investigation
into the relationship between observations at different stages of lactation for the trait water
intake has been found. Our results for milk yield were lower than the genetic correlations of rg
= 0.78 and rg = 0.62 for observations between the start and the later lactation found by Rekaya
et al. (1999) and Veerkamp and Thompson (1999). For dry matter intake, our results were in
Page 18
15
line with the literature regarding the fast decline in the correlations, but they were not in line
with the level of the correlation between the beginning and end of lactation. Veerkamp and
Thompson (1999) found a genetic correlation of rg = 0.24 between the first and 15th week of
lactation. This fast decline was in line with our results, because the correlation (cow effects)
between the first section and Section IV had already been assessed at a moderate value of rc =
0.43. Koenen and Veerkamp (1998) even estimated a genetic correlation of rg =
-0.14 between the first and the 25th week of lactation.
The correlations (cow effects) between the traits depending on stage of lactation showed
moderate to great differences for the different lactation sections. Almost constant correlations
over the lactation sections were estimated for water intake and dry matter intake. For water
intake, no comparable values for the correlations between water intake and milk yield
respectively dry matter intake are available in the literature. Veerkamp and Thompson (1999)
assessed intensely altering genetic correlations between dry matter intake and milk yield in
the course of lactation. These correlations varied from rg = -0.77 in the first lactation week
until rg = 0.39 in the 15th lactation week. Hence, they assumed that the beginning and the end
of the lactation were influenced by different genes. Koenen and Veerkamp (1998) and
Veerkamp and Thompson (1999) emphasised using RR models since the time of the trait’s
measurement during the lactation must be considered and therefore this is very important for
the selection process. In addition, the results of this study showed changing correlations
between cow effects within and across traits during the lactation. Thus it must be postulated
that RR models should also be used for analyses of feeding experiments or generally for
investigations of traits such as water intake, dry matter intake or milk yield.
Conclusion
Repeatabilities and correlations between cow effects, within traits and across traits, clearly
changed during the different lactation stages. Thus it must be postulated that RR models
should be used for analyses of traits such as water intake, dry matter intake or milk yield.
References
Ali, T. E., Schaeffer, L.R., 1987. Accounting for covariances among test day milk yields in
dairy cows. Can. J. Anim. Sci. 67, 637-644.
Hüttmann, H., Stamer, E., Junge, W., Thaller, G., Kalm, E., 2006. Feed intake and energy
balance – investigations with intent to integrate the energy status of bull dams into the
performance test station. 57th EAAP, Book of abstracts No. 12, p. 308.
Page 19
16
Koenen, E.P.C., Veerkamp, R.F., 1998. Genetic covariance functions for live weight,
condition score, and dry-matter intake measured at different lactation stages of Holstein
Friesian heifers. Livest. Prod. Sci. 57, 67-77.
Kovac, M., Groeneveld, E., Garcia-Cortes, L.A., 2002. VCE-5. A package for estimation of
dispersion parameters. In: Proc. 7th WCGALP, CD ROM, Communication No. 28, p. 6.
Meyer, U., Everinghoff, M., Gädeken, D., Flachowski, G., 2004. Investigations on the water
intake of lactating dairy cows. Livest. Prod. Sci. 90, 117-121.
Murphy, M.R., Davis, C.L., McCoy, G.C., 1983, Factors affecting water consumption by
Holstein cows in early lactation. J. Dairy Sci. 66, 35.
Murphy, M.R., 1992. Water metabolism of dairy cattle. J. Dairy Sci. 75, 326-333.
Neumaier, A., Groeneveld, E., 1998. Restricted maximum likelihood estimation of
covariances in sparse linear models. Genet. Sel. Evol. 30, 3-26.
Rekaya, R., Carabaño, M.J., Toro, M.A., 1999. Use of test day yields for the genetic
evaluation of production traits in Holstein-Friesian cattle. Livest. Prod. Sci. 57, 203-
217.
SAS Institute Inc., 2005. SAS/STAT User’s Guide, Version 9.0.
Strabel, T., Misztal, I., 1999. Genetic parameters for first and second lactation milk yields
of Polish Black and White cattle with random regression test-day models. J. Dairy Sci .
82, 2805-2810.
Svendsen, M., Skipenes, P., Mao, I.L., 1992. Genetic parameters in the feed conversion
complex of primiparous cows in the first two trimesters. J. Anim. Sci. 71, 1721-1729.
van Tassell, C.P., Wiggans, G.R., Norman, H.D., 1999. Method R estimates of heritability for
milk, fat, and protein yields of United States dairy cattle. J Dairy Sci. 82, 2231-2237.
Veerkamp, R.F., 1998. Selection for economic efficiency of dairy cattle using information on
live weight and feed intake: a review. J. Dairy Sci. 81, 1109-1119.
Veerkamp, R.F., Thompson, R., 1999. A covariance function for feed intake, live weight, and
milk yield estimated using a random regression model. J. Dairy Sci. 82, 1565-1573.
Winchester, C.F., Morris, M.J., 1956. Water intake rates of cattle. J. Anim. Sci. 15, 722.
Page 20
17
Chapter Two:
Analysis of water intake, dry matter intake and daily milk
yield using different error covariance structures
E. Kramer1, E. Stamer2, J. Spilke3 and J. Krieter1
1Institute of Animal Breeding and Husbandry, Christian-Albrechts-University,
D-24118 Kiel, Germany 2 TiDa Tier und Daten GmbH, D-24259 Westensee/Brux, Germany
3Biometrics and Informatics in Agriculture Group, Martin-Luther-University,
D-06108 Halle/Saale, Germany
Published in Animal 2: 1585-1594
Page 21
18
Abstract
The aim of the present study was to investigate the daily measured traits milk yield, water and
dry matter intake with fixed and random regression models added with different error
covariance structures. It was analysed whether these models deliver better model fitting in
contrast to conventional fixed and random regression models. Furthermore, possible
autocorrelation between repeated measures was investigated. The effect of model choice on
statistical inference was also tested. Data recording was performed on the Futterkamp dairy
research farm of the Chamber of Agriculture of Schleswig-Holstein. A dataset of about
21,000 observations from 178 Holstein cows was used. Average milk yield, water and dry
matter intake were 34.9, 82.4 and 19.8 kg, respectively. Statistical analysis was performed
using different linear mixed models. Lactation number, test day and the parameters to model
the function of lactation day were included as fixed effects. Different structures were tested
for the residuals; they were compared for their ability to fit the model using the likelihood
ratio test, Akaike’s and Bayesian’s information criteria.
Different autocorrelation patterns were found. Adjacent repeated measures of daily milk yield
were highest correlated (p1 = 0.32) in contrast to measures further apart, while for water
intake and dry matter intake, the measurements with a lag of two units had the highest
correlations with p2 = 0.11 and 0.12. The covariance structure of TOEPLITZ was most
suitable to indicate the dependencies of the repeated measures for all traits. Generally the
most complex model, random regression with the additional covariance structure TOEPLITZ
(4), provided the lowest information criteria. Furthermore, the model choice influenced the
significance values of one fixed effect and therefore the general inference of the data analysis.
Thus, the random regression + TOEPLITZ (4) model is recommended for use for the analysis
of equally spaced datasets of milk yield, water intake and dry matter intake.
Keywords: dairy cow, error covariance structure, model fit
Introduction
Today on many farms, automatically recording reliable milk yields from each milking is well-
established. Furthermore, in diverse test stations or dairy research farms, water intake and
feed intake are measured automatically and completely (e.g. Coffey et al., 2002, Hüttmann,
2007, Kramer et al., 2008). In the future, it is imaginable that cost-efficient and reliable sensor
technology will automatically measure traits such as somatic cell score or fat and protein
content of milk on practical dairy farms (Ordolff, 2005, Svennersten-Sjaunja et al., 2005,
Page 22
19
DeLaval, 2008). For such datasets with repeated daily measures within cow it is assumed that
the repeated measures are not independent and thus autocorrelated (Littell et al., 1998, Littell
et al., 2006). Thus, for valid statistical inference and correct variance components, it is
necessary to achieve the best model fit by using applicable error covariance structures
(Bonham and Reich, 1999, Sawalha et al., 2005a, König et al., 2006, Rosário et al., 2007).
Taking different covariance structures for the residuals of repeated measures into account
Bonham and Reich (1999) estimated different variance components and found varying
significances of least square means. Generally, it is assumed for repeated measures that
measurements closer together have higher correlations than measurements with longer time
between them (Littell et al., 2006). In the literature, there are only few results concerning
existing autocorrelations and correlation patterns of daily milk yield, feed intake and water
intake. Stamer (1995) found moderate autocorrelations between adjacent measures of daily
yields of dry matter intake with p1 = 0.02, but for measurements two units apart the author
found a correlation of p2 = 0.10. Hüttmann (2007) assessed the autocorrelation between
adjacent milk yield measures on p1 = 0.30 and for p2 a correlation of 0.26 was found.
According to this, it is assumed that random regression models, estimating covariance
functions for the additive genetic and permanent environmental effect, but not accounting for
a relationship between errors, are not yet adequate to analyse daily yields and thus, covariance
structures for the residuals have to be applied (Littell et al., 2006, Mielenz et al., 2006). For
this purpose fixed regression (FR) and random regression (RR) models with several candidate
covariance structures were compared using different model fit statistics to select an
appropriate covariance model. Fortunately, access to daily measurements of a dairy research
farm enabled us to look at the suitability of such models. Thus, the daily measured traits milk
yield, water and dry matter intake were analysed to find possible error covariance patterns.
Finally, significance results for an included fixed effect are illustrated for different model
variants in order to point up the consequences of considering a proper covariance structure.
Materials and Methods
Data
Data were recorded on the Futterkamp dairy research farm of the Chamber of Agriculture of
Schleswig-Holstein. Period of recording was between March 2005 and April 2006. The dairy
herd was subdivided into a research and a production herd. During data collection, three
feeding experiments were performed with the research herd. This herd with a frequently
changing cow stock comprising nearly 70 cows, divided into two feeding groups (Group A
Page 23
20
and Group B). Observations from about 21000 cow-days were accumulated from 178
Holstein cows during the feeding experiments. Between the feeding experiments dry matter
intake was not recorded. Cows were milked twice daily and they were fed an ad libitum total
mixed ration also twice daily. The feeding and the water troughs developed and installed by
the company INSENTEC were equipped with an individual cow identification system; hence
the cows were only able to pass the troughs one at a time. Each visit to the water and feeding
trough was routinely recorded and the amounts of collected feed and water were accumulated
to daily yields. Furthermore, each milking for the trait milk yield was recorded with the milk
meters technology of the company DeLaval. Extreme values (mainly for the traits water
intake and dry matter intake) that deviated more than ±4 s.d. were excluded from the dataset.
Thus, for the traits milk yield, water intake and dry matter intake observations from 7.9 to
58.5 kg, 10.7 to 149.5 kg and 3.6 to 34.8 kg, respectively, were taken into account (Table 1),
while the average amount of dry matter was about 45% during the data collecting period. In
addition, 25 cows with less than 40 daily observations per trait and also two cows with
records in only one of the three traits were excluded from the dataset. Furthermore, six
complete days could not be considered because of the exclusion of the first and the last day of
each feeding experiment and three days due to general technical problems during the data
collecting period. A total of about 3500 records was excluded from further investigations. The
lower number of records for the trait milk yield – in contrast to the traits water intake and dry
matter intake – is due to gaps in the dataset, which resulted particularly from antibiotic
treatments of the cows and their subsequent withdrawal periods.
The cows belonged to parities 1 to 9 and lactation days were between 6 and 230. The number
of cows with observations from two lactations was 24.
Table 1
Means (x̄), standard deviations (s) and range (minimum, maximum) of the three analysed
traits
Trait n x̄ s Minimum Maximum
Milk yield (kg/d) 19,453 34.9 7.9 7.9 58.5
Water intake (kg/d) 21,285 82.4 18.8 10.7 149.5
Dry matter intake (kg/d) 21,282 19.8 3.9 3.6 34.8
Page 24
21
Data analysis - Modelling of expected value structure
Preliminary investigations were performed using the SAS (2005) software in order to identify
relevant fixed effects. Two different models – FR and RR – were used. Both model variants
contained the fixed effect of lactation curve, which was calculated by average regression
coefficients universally valid for all cows. Due to the fact that the coefficients are constant
and fixed for all animals, the corresponding models are called FR models. In contrast, the RR
models include additional regression coefficients. These are computed for every animal,
which is usually considered as a random effect in the mixed model (van der Werf, 2001).
These coefficients are therefore indicated as random regression coefficients and the
corresponding models as RR models. Thus, RR models allow the estimation of cow-specific
lactation curves (Schaeffer and Dekkers, 1994, Schaeffer, 2004). RR models are increasingly
used for estimation of breeding values and commonly recommended for statistical analysis in
this area (e.g. Koenen and Veerkamp, 1998, Veerkamp and Thompson, 1999). In addition, FR
models were used to allow comparison of our results to results reported by others, that are
mainly based on FR models. Both alternatives (FR, RR) contained the fixed effects parity,
group test day and (as described) a function of the day of lactation and the random effects cow
and error term. The group test day was included as a common test day within feeding group
effect in order to consider the possible influences of the different feeding rations. Parities
were divided into three classes: first lactation, second lactation, and third and higher
lactations.
Model I (FR):
yijkl = µ + LNRi + GTDj + ∑=
4
1mijklmim (DIM)x*b + ck + eijkl,
where yijkl are the observations of milk yield, dry matter intake or water intake, µ is the
overall mean, LNRi is the fixed effect of the ith parity class (i = 1,..., 3), GTDj is the fixed
effect of the jth test day within feeding group (j = 1,..., 658), bim are the FR coefficients
within the ith lactation with xijkl1(DIM) = (DIM/305), xijkl2(DIM) = (DIM/305)2, xijkl3(DIM) =
ln(305/DIM) and xijkl4(DIM) = (ln(305/DIM))2, where DIM is the days in milk, ck is the
random effect of the kth cow (k = 1,..., 178), eijkl is the random error.
Model II (RR) was used to model cow-specific lactation curves by applying the function
according to Ali and Schaeffer (1987).
Page 25
22
Model II (RR):
yijkl = µ + LNRi + GTDj + ∑=
4
1mijklmim (DIM)x*b + ∑
=
4
0mijklmkm (DIM)x*c + eijkl,
where ckm are the RR coefficients within the kth cow (k = 1,..., 178), where
xijkl0(DIM) = 1, xijkl1(DIM) = (DIM/305), xijkl2(DIM) = (DIM/305)2, xijkl3(DIM) =
ln(305/DIM) and xijkl4(DIM) = (ln(305/DIM))2.
Within the analysis of dry matter intake the numerical optimisation of the restricted likelihood
did not converge. Instead, the following polynomial term of the second degree was used:
∑=
2
0mijklmkm (DIM)x*c .
Modelling the lactation curves for the trait milk yield has been a frequently discussed topic in
the literature (e.g. Wood, 1967, Grossman and Koops, 1988, Kirkpatrick et al., 1994,
Jamrozik and Schaeffer, 1997, van der Werf, 2001, Sylvestre et al., 2006). López-Romero and
Carabaño (2003) noted that functions frequently used for the modelling of lactation curves are
those proposed by Ali and Schaeffer (1987) or Wilmink (1987). In addition, also quite often
used are Legrende Polynomials (e.g. Liu et al. (2006) for milk yield and Coffey et al. (2002)
for the traits feed intake and energy balance). Sylvestre et al. (2006) hyphothesised that this
function is able to fit daily data superior than functions with less than five parameters such as
Wilmink (1987), Wood (1967) or Legrende polynomials of less than four degrees. Also for
modelling of feed intake and energy balance amongst others, Woodford et al. (1984), de Vries
et al. (1999) and Collard et al. (2000) used the Ali and Schaeffer function. Therefore, the
function according to Ali and Schaeffer (1987) was chosen for the analysis of all three traits.
The significance of fixed effects was tested by the F-test implemented in the MIXED
Procedure in SAS (2005). With regard to preconditions for linear models, homogeneity of
variance was checked by plots of the standardised residuals against the predicted values.
Additionally, these plots provided information about potential outliers. Furthermore, the
frequency plots of the residuals were checked by visual inspection and confirmed the
assumption of their normal distribution.
Modelling error covariance structures
Dependencies between the residuals of repeated yields of a cow can be modelled with
covariance structures (Sawalha et al., 2005a and 2005b, Mielenz et al., 2006). In order to
obtain basic knowledge about actual covariances between all residuals the complete
Page 26
23
parameterised covariance structure UNSTRUCTURED should be estimated. It might then be
possible to recognise underlying patterns. But this type of matrix is too complex, since all
variances and covariances are different and then too large matrices would have to be
calculated. According to Jennrich and Schluchter (1986) the number of estimatable
parameters is q = (T*(T+1))/ 2, where T is the length of the time series. With a maximum
length of time series in our dataset of about 225 measures (lactation day 6 to 230), the number
of parameters to estimate would arise to q = 25425. Of course this requires too much
computational effort and is not applicable with our computing capacity. As a compromise,
three minor complex alternatives of covariance structures were tested, the first-order
autoregressive model (AR(1)), the spatial (exponential) structure (SP(EXP)) and the
TOEPLITZ(4) model (TOEP(4)), which assume constant residual variance at the different
stages of lactation. Estimation of heterogenous residual variances within these patterns was
not possible, due to no positive definite Hessian matrices. To check the assumption of error
variance homogeneity, the residual variances were estimated separately within three lactation
stages (days in milk 30 to 70, 110 to 150 and 190 to 230) using the FR + TOEP(4) model.
It should be indicated that the notation only gives the upper triangular part of the matrices.
i) First-order autoregressive model (AR(1))
Var (e) = σe2 *
1 p p2 … pd-1
1 p … pd-2
1 … : . . p 1
Under the AR(1) model, the correlation between adjacent within-subject errors is p, regardless
of whether the pair of observations is the 1st and 2nd, 2nd and 3rd, or (d-1)th and dth (Littell et al.,
2006). For any pair of errors two units apart, the correlation is p2 and in general, errors d units
apart, have correlation pd.
ii) Spatial (exponential) structure (SP(EXP))
For the SP(EXP) structure the correlations decline as a function of time. The function is
defined as gexp (d) = e (- (d/p)) , where d is the temporal distance between two measurements at
times t1 and t2 , d = │t1 - t2│. The SP (EXP) structure models the covariance between t1 and t2
as Cov [Yt1 , Y t2] = σe2 * e (- (d/p)). The SP(EXP) type can be used for unequally spaced data
with characteristical different distances between the measures. It is only a generalisation of
the AR(1) type for unequally spaced data and it is expected to deliver the same information
criteria as AR(1) when the data are equally spaced (Littell et al., 2006).
Page 27
24
iii) TOEPLITZ model TOEP(4)
Var (e) = σe2 *
1 p1 p2
p3 0 1 p1 p2 p3
1 p1 p2
1 p1
1
For TOEP(4), the number 4 is the number of the estimated parameters σ^ 2
e plus three
covariance parameters. The TOEP(4) model is similar to the AR(1) model, because pairs of
within-subject errors separated by a common lag have the same correlation. However, errors d
units apart have correlation pd instead of pd (Littell et al., 2006).
In order to avoid biased results with application of AR(1) and TOEP(4) complete time series
with equal distances between the observations (~equally spaced data) are recommended
(SAS, 2005). Therefore, missing values (10% of the records for milk yield and 4% of the
records for water and dry matter intake) were replaced by the mean value of the prior three-
day period. It should be emphasised that replacing missing values is problematic and possibly
biases the results. Otherwise, the corresponding error was assumed to be moderate due to the
marginal number of replaced missing values. Nevertheless, comparing different error
covariance structures for the new traits water intake and dry matter intake requires the
replacing of missing values.
Criteria for the selection of the models
Model selection was based on the restricted maximum-likelihood principle (REML). The
procedure MIXED in SAS (2005) provides by default different model selection criteria
(Mielenz et al., 2006). Models, of which the former one could be reduced to a special case of
the latter one, were compared by applying the likelihood ratio test (LRT), which is a statistical
test of the quality of the fit of two hierarchically nested models. Those models are identical in
their design matrices of the fixed model parameters. The LRT is calculated as the difference
∆(-2logL) of the two comparable models and approximates a chi-square distribution with ∆q
degrees of freedom, where q is the number of estimated covariance components of each
model.
Models with different covariance structures for the repeated measures are not hierarchically
nested. For the comparison of these models, the information criteria of Akaike (1973) (AIC,
Akaike’s information criteria) and Schwarz (1978) (BIC, Bayesian’s information criteria)
were used. These values take the number of estimated parameters into account and prefer less-
complex model variants. For the decision, the model with the smallest values for AIC and
Page 28
25
BIC have to be selected without making a statement about the underlying significance. In
contrast, the LRT yields a significance test under the null hypothesis that the reduced model is
correct. Thus, both information criteria on the one hand and the LRT on the other hand can
lead to different results during the model selection process (Pitt et al., 2002).
In addition, the investigation of the impact of model choice on drawing inference from the
data analysis was enclosed. Thus, the model with the best ability to fit was compared with a
less-complex model by significance results for one fixed effect.
Results
Preconditions for linear mixed models
For all three traits the frequency plot of the residuals was visualised in order to detect
deviations from a normal distribution. Additionally, homogeneity of variance of the residuals
was judged by visual inspection of the plots of the standardised residuals against the predicted
values. As an example, the frequency plot of the residuals (Figure 1a) and the plot of the
standardised residuals against the predicted values (Figure 1b) obtained from Model I (FR)
are given for the trait water intake. It was concluded that the residuals were normally
distributed and that their variance was homogenous over the whole range of the predicted
estimates. Most residuals were in the range of ±3 s.d. A total of 0.92% of all residuals were
smaller than -3 s.d. and 0.26% of all residuals were greater than +3 s.d. Also for milk yield
and dry matter intake normal distribution and variance homogeneity arose from the adequate
plots (not presented).
Page 29
26
a)
0
1000
2000
3000
4000
5000
6000
-55 -45 -35 -25 -15 -5 5 15 25 35 45 55
Residuals (kg water intake/d)
Nu
mb
er o
f re
cord
s
b)
-9
-6
-3
0
3
6
9
0 20 40 60 80 100 120 140
Predicted water intake (kg/d)
Sta
nd
ard
ised
res
idu
als
Figure 1
Frequency plot (a) of the residuals and plots of the standardised residuals against the predicted
water intake (b) after fitting the data with Model I
Page 30
27
Lactation curves
In order to provide evidence about the modelling quality of the underlying function according
to Ali and Schaeffer (1987), the lactation curves are shown in Figure 2. The curves were
hardly affected by the applied model and the presented ones are obtained from Model I (FR)
for primiparous cows and for the three traits.
0
10
20
30
40
0 30 60 90 120 150 180 210
Days in milk
Mil
k y
ield
(k
g/d
),
Dry
ma
tter
inta
ke
(kg
/d)
40
50
60
70
80
Wa
ter i
nta
ke (
kg
/d)
Milk yield Dry matter intake Water intake
Figure 2
Lactation curves for milk yield, dry matter intake and water intake for primiparous cows after
fitting with Model I
For milk yield, the characteristic course of the curve with an increase at the beginning up to
50 days and a subsequent slight decline was as expected. The trajectory for water intake was
similar, but at a higher level. In contrast to the trait milk yield, it took longer to achieve the
maximum level, but it also declined slightly in the further lactation. In contrast, the trait dry
matter intake increased along the whole lactation.
Comparison of FR and RR models with different error covariance structures
For the three traits, the residual variance, the restricted log likelihood values and information
criteria of the different models are given in Table 2. The results for the alternatives AR(1) and
SP(EXP) were exactly the same because of the application of equally spaced data as shown
by Littell et al. (2006). Thus, the covariance structure SP(EXP) is not listed in Table 2. Within
Page 31
28
a trait, all model variants except the FR + AR(1) model were hierarchically nested. The
differences between these nested models were all classified as highly significant (p < 0.01)
using the LRT. The results of the LRT and the information criteria AIC and BIC did not lead
to different conclusions for the model selection.
Table 2
Estimated residual variance, restricted log likelihood and information criteria of the different
models for all three traits
Model σ^ 2
e q -2RlogL ∆(-2RlogL) d.f. ∆(AIC) ∆(BIC)
Water intake
FR 109.45 2 160193 2097 17 2063 2008
FR + AR(1) 108.52 3 160133 2037 16 2005 1954
FR + TOEP(4) 108.26 5 159144 1048 14 1012 995
RR (AS) 98.16 16 158636 540 3 534 524
RR (AS) + AR(1) 97.79 17 158573 477 2 473 467
RR (AS) + TOEP(4) 98.75 19 158096
Dry matter intake
FR 4.24 2 92336 2524 8 2509 2483
FR + AR(1) 4.29 3 92213 2401 7 2387 2365
FR + TOEP(4) 4.17 5 90883 1071 5 1061 1045
RR (p2) 3.77 7 90540 728 3 722 707
RR (p2) + AR(1) 3.76 8 90510 698 2 694 688
RR (p2) + TOEP(4) 3.78 10 89812
Milk yield
FR 6.46 2 101022 13846 17 13812 13759
FR + AR(1) 6.81 3 90480 3304 16 3273 3222
FR + TOEP(4) 5.44 5 90445 3269 14 3241 3197
RR (AS) 3.66 16 91212 4036 3 4030 4021
RR (AS) + AR(1) 3.97 17 88286 1110 2 1106 1099
RR (AS) + TOEP(4) 3.70 19 87176
AIC = Akaike’s information criteria; BIC = Bayesian’s information criteria; FR = fixed regression; RR (AS) =
random regression with the function of Ali and Schaeffer (1987); RR (p2) = random regression with polynomial
of second degree; σ^ 2
e = residual variance; q = number of covariance components, d.f. = degrees of freedom
Page 32
29
For all traits, the classic FR model had the highest restricted log likelihood and the highest
AIC and BIC values (where smaller is better), so that fitting was better for every alternatively
tested model. In addition, modelling the cow-specific lactation curve with the RR model
indicated much lower restricted log likelihood, AIC and BIC values for all traits.
Furthermore, including different covariance structures to model the dependencies between
repeated measures showed similar tendencies for water intake and dry matter intake in
contrast to milk yield. For water intake and dry matter intake the FR + AR(1) model provided
only a moderately, but significantly better fitting. In contrast to the FR + AR(1) model, the FR
+ TOEP(4) model provided much better information criteria for the traits water intake and dry
matter intake. For milk yield the FR + AR(1) and the FR + TOEP(4) models delivered much
better model fitting in contrast to the FR variant, but the AIC and BIC values were nearly the
same for these two variants.
The differences of quality of fit between the AR(1) and the TOEP(4) covariance structures
were also found along with the RR models for the traits water and dry matter intake and even
for milk yield. Comparing all model variants, the best fit was achieved with the most complex
RR + TOEP(4) model.
Homogeneity of residual variance and correlations between residual effects
The residual variances and the correlations between the repeated measures within the different
lactation stages are presented in Table 3. Hence, the assumption of homogenous residual
variances can be checked. Due to the best fit, the RR + TOEP(4) model should have been
chosen, but in order to avoid convergence problems with RR models due to the small number
of included observations, the FR + TOEP(4) model was used instead.
Page 33
30
Table 3
Estimated residual variance and correlations for the different lags at different stages of
lactation after modelling with the FR + TOEP(4) Model
Trait Stage of lactation σ^ 2
e Lag 1 (p1) Lag 2 (p2) Lag 3 (p3)
Water intake 5 - 230 108.26 0.03 0.17 0.12
30 - 70 98.62 -0.04 0.16 0.10
110 - 150 102.24 0.00 0.13 0.12
190 - 230 108.86 -0.03 0.12 0.08
Dry matter intake 5 - 230 3.78 -0.05 0.12 0.10
30 - 70 3.75 -0.08 0.13 0.13
110 - 150 3.83 -0.06 0.09 0.07
190 - 230 3.75 -0.09 0.11 0.07
Milk yield 5 - 230 5.44 0.48 0.36 0.21
30 - 70 4.00 0.33 0.30 0.18
110 - 150 3.65 0.35 0.28 0.18
190 - 230 3.05 0.29 0.30 0.21
σ^ 2
e = residual variance
For water and dry matter intake, residual variance varied only marginally between the
beginning, the middle and the end of the lactation in contrast to the estimates for the whole
lactation. For milk yield, different estimates were found for the whole lactation ( σ^ 2
e = 5.44) in
contrast to the separate lactation stages ( σ^ 2
e = 4.00, 3.65 and 3.05, respectively). The
correlations between the adjacent repeated measures of water intake, dry matter intake and
milk yield, estimated for the whole lactation, were p1= 0.03, -0.05 and 0.48, respectively. For
measurements two units apart, the correlations were p2 = 0.17, 0.12 and 0.36, respectively,
while they were assessed on p3 = 0.12, 0.10 and 0.21 for water intake, dry matter intake and
milk yield measurements with a lag of three observations. The correlations estimated for the
different stages of lactation differed only marginally in contrast to those estimated for the
whole lactation, with the exception of p1 and p2 for milk yield. For the whole lactation, the
correlation p1 was 0.48 in comparison to p1 = 0.33, 0.35 and 0.29 for the three different
lactation stages.
Page 34
31
Model choice and statistical inference
The influence of the model choice on the results of significance tests was proven by
comparing the model with the best fit (RR + TOEP(4)) with the RR model without error
covariance structures. In the case of the fixed effect parity, the inclusion of the error
covariance structure TOEP(4) showed a clear influence on the accuracy of the inference
(Table 4). For milk yield, the significance value of the global F-test levels altered with the
consequence of another conclusion. Parity was not statistically significant (p = 0.061) in the
RR model, it was significant (p = 0.004) in the other model.
Table 4
Significance values (p) for the fixed effect parity and for the differences between LSM of
parity levels dependent on trait and model
Trait (model) F-test
Milk yield (RR) 0.061
Milk yield (RR + TOEP(4)) 0.004
Water intake (RR) 0.302
Water intake (RR + TOEP(4)) 0.217
Dry matter intake (RR) <0.001
Dry matter intake (RR + TOEP(4)) <0.001
RR = random regression
Discussion
Lactation curves
The lactation curve for milk yield showed the characteristic course, which had been shown
frequently before (amongst others Veerkamp and Thompson, 1999, Hüttmann, 2007). The
lactation curve for water intake showed a path similar to the curve for milk yield with only a
shift in level, which was also observed by Murphy et al. (1983). Similar lactation curves for
dry matter intake were also found by Veerkamp and Thompson (1999) and Hüttmann (2007).
The given course was similarly expected after inspecting the trajectory of the raw data. This is
indeed not an evidence but an indication that the parameters according to Ali and Schaeffer
(1987) are also suitable to model the lactation curves of the traits water intake and dry matter
intake.
Page 35
32
Comparison of FR and RR models with different error covariance structures
For all traits, the RR models had much lower information criteria in contrast to the classic FR
models. Similar results were found by Hüttmann (2007) for daily milk yield and dry matter
intake with different FR and RR models. With RR models, water intake, dry matter intake and
milk yield dynamics are modelled separately for every lactation day, which leads to a more
effective consideration of the underlying biology and therefore to much more precise results
(van der Werf, 2001, Mielenz et al., 2006).
Inclusion of different error covariance structures along either FR or RR models again
improved the values of the information criteria and thus the model fit for all three traits. But it
seems that different covariance patterns are indicated for the three traits.
In detail for milk yield, model fit under the FR models was similar when comparing the
AR(1) with the TOEP(4) pattern. The assumption of Littell et al. (2006) that adjacent daily
measures are higher correlated than measures with lags of more units apart could be
confirmed with both covariance structures. High dependencies between the repeated measures
were found (p1 = 0.65, p2 = (0.65)2 = 0.42, p3 = (0.65)3 = 0.27 with the FR + AR(1) model and
p1 = 0.48, p2 = 0.36, p3 = 0.21 with the FR + TOEP(4) model, respectively). The estimated
correlations were similar and thus the differences between the patterns of the covariance
structures had no effect. Along with the RR models clear differences between AR(1) and
TOEP(4) were found. With the inspection of the corresponding correlations estimated for
these model variants (p1 = 0.40, p2 = (0.40)2 = 0.16, p3 = (0.40)3 = 0.03 with the RR + AR(1)
model and p1 = 0.32, p2 = 0.27, p3 = 0.17 with the RR + TOEP(4) model, respectively), it is
obvious that with the RR + AR(1) model the exponential decline in the correlations is too fast.
In contrast, the correlations assessed with the RR + TOEP(4) model seem to be more realistic.
Similar correlations (p1 = 0.30, p2 = 0.23, p3 = 0.13) with a RR + TOEP(4) model for repeated
milk intakes were found by Hüttmann (2007).
For dry matter intake and water intake, model fit was much better with the TOEP(4) model in
contrast to the AR(1) model regardless of whether the FR or RR model was applied. The
covariance structure AR(1) acts on the assumption that adjacent measures are higher
correlated than those with more units between them (Littell et al., 1998, Littell et al., 2006).
This seems to be the main reason as to why the AR(1) structure misrepresents the
dependencies and patterns of the repeated measures of water and dry matter intake. Under the
FR model, the AR(1) matrix valued the correlation for adjacent measures of dry matter intake
and water intake at p1 = 0.08 and 0.05. The corresponding correlations p2 and p3 were hence
(0.08)2 = 0.0064 and (0.08)3 = 0.000512 for dry matter intake and (0.05)2 = 0.0025 and
Page 36
33
(0.05)3 = 0.000125, which is almost equal to zero. With the TOEP(4) model the correlations
were p1 = -0.05, p2 = 0.12 and p3 = 0.10 for dry matter intake and p1 = 0.03, p2 = 0.17 and p3 =
0.12 for water intake (see also Table 3). Thus it appears to be the case that measures with a
lag of two units apart are the highest correlated and even for measures three units apart
correlations do exist. The correlations for repeated dry matter intakes are in agreement with
the investigations of Stamer (1995), who found under a FR + TOEP(3) model an
autocorrelation between adjacent measures of p1 = 0.02 and between measures two units apart
of p2 = 0.10, while the AR(1) model showed no autocorrelation between repeated measures.
In addition, the AIC value was lowest for the variant with a TOEP(3) covariance structure.
Hüttmann (2007) found under a RR + TOEP(4) model a similar correlation pattern with p1 =
0.07, p2 = 0.10 and p3 = 0.07 for repeated measures of dry matter intake, too. This model
variant also provided the by far best fitting ability in contrast to models with an underlying
AR(1) covariance structure. Thus, under a TOEPLITZ matrix the correlation pattern between
repeated measures of dry matter intake and also water intake is assumed to be estimated more
precisely. Maybe the physiology of these two coherent traits (correlation between cow effects
is rc = 0.73 according to Kramer et al., 2008) underlies another more enduring biorhythm than
from day to day and therefore adjacent repeated measures are not necessarily the highest
correlated. Of course this is speculative.
Generally, according to the fitting ability, the most complex RR + TOEP(4) model has to be
emphasised for the analysis of daily yields of milk intake, water and dry matter intake. This is
in accordance with the investigations of Hüttmann (2007), who obtained the best goodness of
fit with a TOEP(4) model for the traits milk yield, feed intake, energy balance and body
weight.
Homogeneity of residual variance and correlations between residual effects
The residual variance of water and dry matter intake varied only marginally between the
beginning, the middle and the end of the lactation in contrast to the estimates for the whole
lactation. For milk yield, residual variance estimated for the whole lactation was different
from those estimated for the separate lactation sections. Residual variance seems to vary in
the course of lactation. Jamrozik and Schaeffer (1997) clearly found higher residual variances
for milk yield in the first lactation days in contrast to the further lactation. This seems to be
similar in the present study and can explain the higher residual variance estimated for the
whole lactation ( σ^ 2
e = 5.44) in contrast to the separate sections ( σ^ 2
e = 4.00, 3.65 and 3.05,
respectively), because the first lactation days are not included in the first section (days in milk
Page 37
34
30 to 70), but they are included for the whole lactation (days in milk 5 to 230). Furthermore,
the correlations p1, p2 and p3 estimated for the whole lactation differed only marginally from
those correlations estimated for the separate lactation sections, exceptionally re1 and re2 for
milk yield. Maybe this is also due to the inclusion of the first lactation days in the whole
lactation, which seem to be somewhat different in contrast to the further lactation.
For water and dry matter intake, the almost constant residual variances and correlations in the
lactation trajectory gave evidence that assuming constant residual variances with the different
covariance structures was reasonable. Thus, the emphasis for the use of the RR + TOEP(4) for
daily yield data of these traits can be made without having made incorrect assumptions. For
milk yield, error covariance structures with supposed heterogenic residual variances would
have delivered a more correct fit but are difficult to compute.
Model choice and statistical inference
The choice of the right model is very important for drawing the correct inference from the
analysed data (van der Werf, 2001). Thus, the model with the best fit RR + TOEP(4) was
compared with the RR model. For the fixed effect parity, the inclusion of the error covariance
structure TOEP(4) showed a clear influence on the accuracy of the inference. Parity was not
statistically significant (p = 0.061) in the RR model, while it was significant (p = 0.004) in the
other model. Varying significance values among the applied model variants is very important
for the interpretation of statistical analyses. Imagine feeding research where the effect of a
feeding additive on milk yield is tested and the effect would be significant under the applied
model while it would be no longer significant under the more correct model. The
consequences of such biased results could cause large economic losses for dairy farms.
Inclusion of error covariance structures influences also variance components of test day milk,
fat and protein yields and test day somatic cell scores (Sawalha et al., 2005a) and also of daily
voluntary milking frequency in an automatic milking system (König et al., 2006). The authors
postulated the use of autoregressive error covariance structures for such data in order to
prevent bias in heritabilities, because models without error covariance structures seem to
overestimate the heritabilities. Similar conclusions in another research area were indicated by
Bonham and Reich (1999). These authors showed for autocorrelated data that inclusion of
spatial autoregressive error covariance structure delivered the best linear unbiased estimates
of parameters and also reduced the significance of differences between treatments of oil spills.
Hence, in order to obtain preferable certain results it is always necessary to aspire to use the
model with the best fit.
Page 38
35
Practical implementation
To obtain correct statistical inference, the results emphasise the use of adequate error
covariance structures with RR models for the analysis of daily yields such as milk yield, water
intake and dry matter intake, respectively. With equally spaced datasets the use of TOEP(4)
error covariance structure must be postulated. Under practical conditions, daily data (e.g. milk
yield) provide probably cow time series with gaps due to technical bugs or diseases of cows.
In this regard Mielenz et al. (2006) did not fill up the lacks of daily feed intake data. With
such datasets they emphasised the use of an RR + SP(EXP) model. This type of covariance
structure could be a compromise for practical implementation, because for all traits including
this would be better than a complete omission of error covariance structures. Generally, it
would be necessary for the future to investigate daily yield data of other traits with regard to
the possible autocorrelation patterns.
Conclusion
The comparison of the conventional FR model and RR models with or without covariance
structures for the repeated measures showed best model fitting with the most complex RR +
TOEP(4) model for all traits. Autocorrelations between daily yields could be found and the
covariance structure TOEP(4) was most suitable to indicate the dependencies of the repeated
measures. The model choice influenced the significance values of the fixed effect parity and
therefore the general inference of the data analysis. Thus, despite its complexity the RR +
TOEP(4) model is recommended for use for analysis of equally spaced datasets of milk yield,
water intake and dry matter intake.
References
Akaike, H., 1973. Information theory and an extension of the maximum likelihood principle.
In: Petrov, B.N., Csaki, F. (eds), Proc. 2nd Intern. Symp. Information Theory,
Akademiai Kiado, Budapest, Hungary, pp. 267-281.
Ali, T.E., Schaeffer, L.R., 1987. Accounting for covariances among test day milk yields in
dairy cows. Can. J. Anim. Sci. 67, 637-644.
Bonham, C.D., Reich, R.M., 1999. Influence of spatial autocorrelation on a fixed-effect
model used to evaluate treatment of oil spills. Appl. Math. Comput. 106, 149-162.
Coffey, M.P., Simm, G., Brotherstone, S., 2002. Energy balance profiles for the first three
lactations of dairy cows estimated using random regression. J. Dairy Sci. 85, 2669-
2678.
Page 39
36
Collard, B.L., Boettcher, P.J., Dekkers, J.C.M., Petitclerc, D., Schaeffer, L.R., 2000.
Relationships between energy balance and health traits of dairy cattle in early lactation.
J. Dairy Sci. 83, 2683-2690.
DeLaval, 2008. Somatic cell counter DCC. Retrieved March 08, 2008, from
http://www.delaval.com/Products/Milking/Cell-counter-DCC/default.htm.
de Vries, M.J., van der Beek, S., Kaal-Lansbergen, L.M.T.E., Ouweltjes, W., Wilmink,
J.B.M., 1999. Modeling of energy balance in early lactation and the effect of energy
deficits in early lactation on first detected estrus postpartum in dairy cows. J. Dairy Sci.
82, 1927-1934.
Grossman, M., Koops, W.J., 1988. Multiphasic analysis of lactation curves in dairy cattle. J.
Dairy Sci. 71,1598-1608.
Hüttmann, H., 2007. Analyse der Futteraufnahme und der Energiebilanzmerkmale bei
hochleistenden, erstlaktierenden Milchkühen. Schriftenreihe des Instituts für Tierzucht
und Tierhaltung der Christian-Albrechts-Universität zu Kiel. Band 164.
Jamrozik, J., Schaeffer, L.R., 1997. Estimates of genetic parameters for a test day model with
random regressions for yield traits of first-lactation Holsteins. J. Dairy Sci. 80, 762-770.
Jennrich, R.I., Schluchter, M.D., 1986. Unbalanced repeated-measures models with structured
covariance matrices. Biometrics 42, 805-820.
Kirkpatrick, M., Hill, W.G., Thompson, R., 1994. Estimating the covariance structure of traits
during growth and ageing, illustrated with lactation in dairy cattle. Genet. Res. 64, 57-
69.
Koenen, E.P.C., Veerkamp, R.F., 1998. Genetic covariance functions for live weight,
condition score, and dry-matter intake measured at different lactation stages of Holstein
Friesian heifers. Livest. Prod. Sci. 57, 67-77.
König, S., Köhn, F., Kuwan, K., Simianer, H., Gauly, M., 2006. Use of repeated measures
analysis for evaluation of genetic background of dairy cattle behavior in automatic
milking systems. J. Dairy Sci. 89, 3636-3644.
Kramer, E., Stamer, E., Mahlkow, K., Lüpping, W., Krieter, J., 2008. Relationship between
water intake, dry matter intake and daily milk yield on a German research farm. Livest.
Sci. 115, 99-104.
Littell, R.C., Henry, P.R., Ammerman, C.B., 1998. Statistical analysis of repeated measures
data using SAS procedures. J. Anim. Sci. 76, 1216-1231.
Littell, R.C., Milliken, G.A., Stroup, W.W., Wolfinger, R.D., Schabenberger, O., 2006. SAS
for mixed models, users manual. SAS Inc., Cary, NC, USA, pp. 174-203.
Page 40
37
Liu, Y.X., Zhang, J., Schaeffer, L.R., Yang, R.Q., Zhang, W.L., 2006. Optimal random
regression models for milk production in dairy cattle. J. Dairy Sci. 89, 2233-2235.
López-Romero, P., Carabaño, M.J., 2003. Comparing alternative random regression models to
analyse first lactation daily milk yield data in Holstein-Friesian cattle. Livest. Prod. Sci.
82, 81-96.
Mielenz, N., Spilke, J., Krejcova, H., Schüler, L., 2006. Statistical analysis of test-day milk
yields using random regression models for the comparison of feeding groups during the
lactation period. Arch. Anim. Nutr. 60, 341-357.
Murphy, M.R., Davis, C.L., McCoy, G.C., 1983. Factors affecting water consumption by
Holstein cows in early lactation. J. Dairy Sci. 66, 35-38.
Ordolff, D., 2005. On-farm analysis of milk: a promising challenge. In: Cox, S. (ed),
Precision Livestock Farming ’05, Wageningen Academic Publishers, The Netherlands,
pp. 157-161.
Pitt, M.A., Myung, I.J., Zhang, S., 2002. Toward a method of selecting among computational
models of cognition. Psychol. Rev. 109, 472-491.
Rosário, M.F., Silva, M.A.N., Coelho, A.A.D., Savino, V.J.M., 2007. Estimating and
predicting feed conversion in broiler chickens by modeling covariance structure. Int. J.
Poult. Sci. 6, 508-514.
SAS Institute Inc., 2005. SAS/STAT user’s guide version 9.0. SAS Inc., Cary, NC, USA.
Sawalha, R.M., Keown, J.F., Kachman, S.D., van Vleck, L.D., 2005a. Evaluation of
autoregressive covariance structures for test-day records of Holstein cows: estimates of
parameters. J. Dairy Sci. 88, 2632-2642.
Sawalha, R.M., Keown, J.F., Kachman, S.D., van Vleck, L.D., 2005b. Genetic evaluation of
dairy cattle with test-day models with autoregressive covariance structures and with a
305-d Model. J. Dairy Sci. 88, 3346-3353.
Schaeffer, L.R., 2004. Application of random regression models in animal breeding. Livest.
Prod. Sci. 86, 35-45.
Schaeffer, L.R., Dekkers, J.C.M., 1994. Random regressions in animal models for test-day
production in dairy cattle. In: Proc. 5th WCGALP 18, Guelph, Canada, pp. 443-446.
Schwarz, G., 1978. Estimating the dimension of a model. Ann. Statist. 6, 461-464.
Stamer, E., 1995. Futteraufnahmeverhalten von Milchkühen - Analyse der Zeitstruktur und
Nutzungsmöglichkeiten. Schriftenreihe des Institutes für Tierzucht und Tierhaltung der
Christian-Albrechts-Universität zu Kiel, Band 85.
Page 41
38
Svennersten-Sjaunja, K., Sjögren, M., Andersson, I., Sjaunja, L.O., 2005. Milk analyses: a
comparison between a simple IR-instrument for use on farm level and available IR-
methods. In: Cox, S. (ed), Precision Livestock Farming ’05 , Wageningen Academic
Publisher, The Netherlands, pp. 141-147.
Silvestre, A.M., Petim-Batista, F., Colaco, J., 2006. The accuracy of seven mathematical
functions in modeling dairy cattle lactation curves based on test-day records from
varying sample schemes. J. Dairy Sci. 89, 1813-1821.
van der Werf, J., 2001. Random regression in animal breeding. Course notes. Jaboticabal, SP
Brazil, November 2001. Retrieved November 28, 2008, from http://www-
personal.une.edu.au/~jvanderw/CFcoursenotes.pdf.
Veerkamp, R.F., Thompson, R., 1999. A covariance function for feed intake, live weight, and
milk yield estimated using a random regression model. J. Dairy Sci. 82, 1565-1573.
Wilmink, J.B.M., 1987. Adjustment of test-day milk, fat and protein yield for age, season and
stage of lactation. Livest. Prod. Sci. 16, 335-348.
Wood, P.D.P., 1967. Algebraic model of the lactation curve in cattle. Nature 216, 164-165.
Woodford, S.T., Murphy, M.R., Davis, C.L., 1984. Water dynamics of dairy cattle as affected
by initiation of lactation and feed intake. J. Dairy Sci. 67, 2336-2343.
Page 42
39
Chapter Three:
Analysis of water intake and dry matter intake using different
lactation curve models
E. Kramer1, E. Stamer2, J. Spilke3, G. Thaller1 and J. Krieter1
1Institute of Animal Breeding and Husbandry, Christian-Albrechts-University,
D-24118 Kiel, Germany 2TiDa Tier und Daten GmbH, D-24259 Westensee/Brux, Germany
3Biometrics and Informatics in Agriculture Group, Martin-Luther-University,
D-06108 Halle/Saale, Germany
Submitted for publication in Journal of Dairy Science
Page 43
40
Abstract
The objective was to evaluate six different lactation curve models for the daily measured traits
water intake and dry matter intake. Data originated from the Futterkamp dairy research farm
of the Chamber of Agriculture of Schleswig-Holstein. A dataset of about 23,000 observations
from 193 Holstein cows was used. Average daily water and dry matter intake were 82.3 and
19.8 kg, respectively. The basic linear mixed model included the fixed effects parity and test
day of feeding group. Additionally, six different functions were tested for the fixed effect of
the lactation curve as well as for the individual (random) effect of the lactation curve.
Furthermore, the autocorrelation between repeated measures was modelled with the Spatial
(Power) covariance structure; model fit was evaluated by the likelihood ratio test, Akaike’s
and Bayesian’s information criteria and additionally by analysis of the mean residual at
different days in milk.
The Ali and Schaeffer function was most suitable to model the fixed effect of the lactation
curve for both traits. The Legendre polynomial of order 4 delivered the best model fit for the
random effects of lactation day. Applying the error covariance structure led to significant
better model fit and indicated that repeated measures were autocorrelated. Generally, the most
complex model, using the Ali and Schaeffer function and the Legendre polynomial of order 4
to model the average lactation and the cow-specific lactation curve and including additionally
the error covariance structure Spatial (Power) provided the lowest information criteria. This
model is recommended for the analysis of water intake and dry matter intake including
missing observations in order to obtain estimation of correct statistical inference and valid
variance components.
Keywords: dairy cow, lactation curve, water intake, dry matter intake, model fit
Introduction
Today on many test stations or dairy research farms, water intake and feed intake are
measured automatically and completely (e.g. Coffey et al., 2002, Hüttmann et al., 2008,
Kramer et al., 2008a). In the future, water and feed intake will become more important for
dairy management due to their link to the cow’s health status (González et al., 2008, Lukas et
al., 2008) as well as for dairy breeding because of their relationship to the cow’s energy status
and the corresponding liability to diseases in the first part of lactation (Veerkamp and
Thompson, 1999, Coffey et al., 2002, Hüttmann et al., 2008). Furthermore, in times of
increasing costs for feed concentrates, it is imaginable that feed intake will be included in
Page 44
41
future dairy breeding programmes. Unfortunately, recording daily feed intake is difficult and
cost-intensive and hence only imaginable in test stations or research herds (Hüttmann, 2007).
In contrast, individual recording of water intake is less expensive (Kramer et al., 2008a).
Since the correlation between these traits has been estimated to be high (r = 0.73, Kramer et
al., 2008a), water intake may be suitable to serve as an information trait for feed intake and
might be included in dairy programmes instead of feed intake. Nevertheless, there are only a
few sources in the literature regarding the analysis of water and feed intake with different
models in order to obtain the one with the best model fit, although this is necessary for valid
statistical inference and correct variance components (van der Werf, 2001, Sawalha et al.,
2005, Kramer et al., 2008b). Today, random regression models (RR) are increasingly used for
the estimation of breeding values and commonly recommended for statistical analysis in this
area (e.g. Koenen and Veerkamp, 1998, Veerkamp and Thompson, 1999, Coffey et al., 2002).
They allow the estimation of cow-specific lactation curves with additional random regression
coefficients (Schaeffer and Dekkers, 1994, Schaeffer, 2004) in contrast to conventional fixed
regression models (FR), which only contain the fixed effect of lactation curve estimated with
average regression coefficients universally valid, and thus are fixed for all cows (van der
Werf, 2001). In a previous study, Kramer et al. (2008a) analysed the relationship of water and
feed intake in the course of lactation. They used the estimated parameters of the function of
Ali and Schaeffer (1987) for both the fixed and random regression coefficients in order to
model the average and the cow-specific lactation curves. In the German national genetic
evaluation of milk yield, the Wilmink function (1987) is used to model the fixed regression
coefficients on day of lactation and the Legendre polynomial of order 2 to model the random
regression coefficients on day of lactation (VIT, 2008). Generally, modelling lactation curves
has been a frequently discussed topic in the literature for the trait milk yield in contrast to
water or feed intake (e.g. Wood, 1967, Guo and Swalve, 1995, van der Werf, 2001, Silvestre
et al., 2006).
The objective of the present study was to analyse daily water and dry matter intake
measurements with different lactation curve models. In doing so 1) the best function for the
average lactation curve was evaluated and chosen as the basis for 2) the evaluation of the best
(co)variance function to model the cow-specific lactation curve. Finally, the model with the
best fit is presented at the end of the model selection process and preferably, this model is
emphasised for general use.
Page 45
42
Material and Methods
Data
Data were recorded on the Futterkamp dairy research farm of the Chamber of Agriculture of
Schleswig-Holstein. The period of recording was between March 2005 and April 2006. The
dairy herd was subdivided into a research and a production herd. During data collection, three
feeding experiments were performed. The research herd with a frequently changing cow stock
comprising nearly 70 cows, was divided into two feeding groups (Group A and Group B).
Nearly 23,000 cow-days were accumulated from 193 Holstein cows belonging to the parities
1 to 9. Lactation days were between 6 and 230. Complete lactation length could not be
recorded, because most of the cows had already left the feeding groups at lactation day 230.
23 cows had observations in two lactations. Between the feeding experiments dry matter
intake was not recorded. Cows were milked twice daily and they were fed an ad libitum total
mixed ration also twice daily. The feeding and the water troughs developed and installed by
the company INSENTEC were equipped with an individual cow identification system; hence
the cows were only able to pass the troughs one at a time. Each visit to the water and feeding
trough was routinely recorded and the amounts of collected feed and water were accumulated
to daily yields. Extreme values that deviated more than ±4 s.d. were excluded from the
dataset. Thus, for the traits water intake and dry matter intake observations from 10.7 to 155.6
kg and 3.8 to 34.8 kg, respectively, were taken into account (Table 1), while the average
amount of dry matter was about 45% during the data collecting period. In addition, only
lactations with at least 15 test days were considered. Furthermore, the first and the last day of
each feeding experiment were excluded and 3 days due to general technical problems. All in
all, a total of 800 records (3.4% of all records) were omitted from data analysis.
Table 1
Number of observations (n), missing observations (m.o.), means (x̄), standard deviations (s)
and range (minimum, maximum) of the two analysed traits
Trait n m.o. x̄ s Minimum Maximum
Water intake (kg/d) 22,660 468 82.3 19.0 10.7 155.6
Dry matter intake (kg/d) 22,624 496 19.8 4.0 3.8 34.8
Data analysis
Preliminary investigations were performed using the SAS (2005) software in order to analyse
the fixed effects. The FR basis model contained the significant fixed effects parity, group test
Page 46
43
day and lactation curve and the random effect residual. The group test day was included as a
common test day and feeding group effect in order to consider the possible influences of the
different feeding rations. Parity was divided into three classes: first parity, second parity, and
third and higher parities.
Model I (FR):
yijl(DIM) = µ + Pi + GTDj + fiw (DIM) + eijl ,
where yijl are the observations of water intake or dry matter intake, µ is the overall mean, Pi is
the fixed effect of the ith parity class (i = 1,..., 3), GTDj is the fixed effect of the jth test day
within feeding group (j = 1,..., 664), fiw (DIM) describes six functions (w = 1,..., 6) to model
the ith lactation curve, where DIM is the days in milk, eijl is the random error.
In a first step the fixed effect of average lactation curve was modelled by the following six
functions of days in milk. These functions were chosen because they are commonly accepted
and well established in the literature for modelling lactation curves of different traits.
1) GS (Guo and Swalve, 1995):
fi1(DIM) = a1i + a2i * (DIM)0.5 + a3i * ln (DIM),
2) Wi (Wilmink, 1987):
fi2(DIM) = a1i + a2i * DIM + a3i * e (-0.05 * DIM),
3) Lg2 (Legendre polynomial of 2nd order (Brotherstone et al., 2000))
fi3(DIM) = a1i + a2i * z + a3i * 0.5 * (3z2 – 1),
4) Lg3 (Legendre polynomial of 3rd order (Brotherstone et al., 2000))
fi4(DIM) = a1i + a2i * z + a3i * 0.5 * (3z2 – 1) + a4i * 0.5 (5z3 – 3z),
5) Lg4 (Legendre polynomial of 4th order (Brotherstone et al., 2000))
fi5(DIM) = a1i + a2i * z + a3i * 0.5 * (3z2 – 1) + a4i * 0.5 * (5z3 – 3z) + a5i * 0.125 *
(35z4 – 30z2 +3),
6) AS (Ali and Schaeffer, 1987)
fi6(DIM) = a1i + a2i * (DIM/305) + a3i * (DIM/305)2 + a4i * ln(305/DIM) + a5i *
(ln(305/DIM))2 ,
with z = -1 + 2 ((DIM – 5)/(230 – 5)) and DIM = days in milk.
In order to check homogeneity of residual variance along the whole lactation period the
average residual obtained with each FR submodel was plotted against the lactation day. The
function 1, 2, ..., or 6, which delivered the best model fit, was chosen as the basis for the RR
model (Model II), i.e. this function was chosen to model the average lactation curve under the
Page 47
44
RR model. As the second step, modelling the cow-specific lactation curves was carried out
again by applying the functions 1 to 6. Hence, Model II differed from Model I in the case that
the six functions 1 to 6 were used to describe the RR effect of the kth cow (k = 193), which
encompasses both the animal genetic and the permanent environmental effect. Furthermore in
contrast to Model I, heterogenous residual variance was assumed across the three parity
classes and the Spatial (Power) covariance structure (SP(POW)) for the residuals was applied
with Model II. This was due to the fact that datasets with repeated daily measures within cow
are assumed to contain dependent and thus autocorrelated repeated measures (Littell et al.,
1998, Littell et al., 2006). For this purpose dependencies between the residuals of repeated
yields can be modelled with covariance structures (Sawalha et al., 2005, Mielenz et al., 2006,
Kramer et al., 2008b). In a previous study, Kramer et al. (2008b) found autocorrelated
residuals of daily water and feed intake and they emphasised the use of a Spatial covariance
structure for datasets including missing values. Thus, in this dataset the assumed
dependencies between the residuals of water and feed intake were modelled with the
SP(POW) covariance structure, which assumes constant residual variance at the different
stages of lactation. In accordance to this, Kramer et al. (2008b) showed that residual variance
of water and dry matter intake was almost constant during the lactation. For the SP(POW)
structure the correlations (re) decline as a function of time. The function is defined as g (d) =
red, where d is the temporal distance between two measurements at times t1 and t2 , d =
│t1 - t2│. The SP(POW) structure models the covariance between t1 and t2 as Cov [Yt1 , Yt2] =
σe2 * re
d. The SP(POW) type can be used for unequally spaced data with characteristically
different distances between the measures. However, it should be noted that the better the RR
models fit the data, the lower the correlations between the residuals should actually be. Hence
as a last step, for both traits the model with the best fit was compared to the same model
except the error covariance structure in order to possibly confirm the estimated correlations
between the residuals and thus to verify the necessity of the assumption of the SP(POW) error
covariance structure.
Criteria for the selection of the models
Model selection under testing the different FR models was based on maximum likelihood
principle (ML). The procedure MIXED in SAS (2005) provides by default different model
selection criteria. Since two models including different fixed effects being compared, the
information criteria are not comparable under the predetermined method in the MIXED
procedure in SAS (2005), which is by default based on the restricted maximum-likelihood
Page 48
45
principle (REML). Under the RR models model selection was based on REML estimation.
Models, of which the former one could be reduced to a special case of the latter one, were
compared by applying the likelihood ratio test (LRT), which is a statistical test of the quality
of the fit of two hierarchically nested models (Littell et al., 2006). Those models are identical
in their design matrices of the fixed model parameters. The LRT is calculated as the
difference ∆(-2logL) of the two comparable models and approximates a chi-square
distribution with ∆q degrees of freedom, where q is the number of estimated covariance
components of each model.
Submodels with the different functions for the fixed effect of average lactation curve or the
different functions for the random cow effect used in the present study (except Lg2 – Lg4) are
not hierarchically nested. For the comparison of these models, the information criteria of
Hurvich and Tsai (1989) (AICC, Akaike’s information criteria corrected) and Schwarz (1978)
(BIC, Bayesian’s information criteria) were used. These values take the number of estimated
parameters into account and prefer less complex model variants. For the decision, the model
with the smallest values for AICC and BIC have to be selected without making a statement
about the underlying significance. In contrast, the LRT yields a significance test under the
null hypothesis that the reduced model is correct. Thus, both information criteria on the one
hand and the LRT on the other hand can lead to different results during the model selection
process (Pitt et al., 2002).
Results
Lactation curves
For primiparous cows the lactation curves for the four functions GS, Wi, AS and Lg4 after
fitting with the FR model are shown in Figure 1. The curves of the functions Lg2 and Lg3
were very similar to the Lg4 function. Therefore the Lg2 and Lg3 curves were omitted.
The lactation curves for primiparous cows were only marginally affected by the underlying
function. For water intake, the functions Wi, GS and AS showed nearly the same trajectory.
The Lg4 function differed slightly from the other three functions. At lactation day 200 a
moderate increase could be observed for the AS and Lg4 functions. For dry matter intake all
functions were very similar. The lactation curves of both traits for the multiparous cows
characteristically differed from those of the primiparous cows indicating a higher increase at
the beginning and also a greater decrease at the end of lactation (not presented). Additionally,
only a marginal influence of the underlying function on the curves could be observed.
Page 49
46
a)
45
50
55
60
65
70
75
0 30 60 90 120 150 180 210 240
Days in milk
Wa
ter i
nta
ke (
kg
)
ASGSLg4Wi
b)
8
10
12
14
16
18
20
0 30 60 90 120 150 180 210 240
Days in milk
Dry m
att
er i
nta
ke
(kg
)
ASGSLg4Wi
Figure 1
Lactation curves of water (a) and dry matter intake (b) for the functions of Wilmink (Wi),
Guo and Swalve (GS), Ali and Schaeffer (AS) and the Legendre polynomial of order 4 (Lg4)
– primiparous cows.
Page 50
47
Comparison of different FR submodels to model the average lactation curve
For both traits, the residual variance, the number of fixed effects, the log likelihood values
and information criteria of the different FR (sub)models are given in Table 2. Within a trait,
only the variants FR (Lg2), FR (Lg3) and FR (Lg4) were hierarchically nested. The
differences between these nested models were all classified as highly significant (p < 0.01)
using the LRT. The results of the LRT and the information criteria AICC and BIC did not
lead to different conclusions for the model selection, although the differences between the
models became smaller with the AICC and even more with the BIC criteria due to penalting
more complex models carried out with these criteria.
Table 2
Estimated residual variance, log likelihood and information criteria of the different functions
under the FR model for water intake and dry matter intake
Model (function) σ^ 2
e p -2logL ∆(-2logL)* ∆(AICC)* ∆(BIC)*
Water intake
FR (GS) 176.15 669 181296 73 60 13
FR (Wi) 175.98 669 181274 51 39 11
FR (Lg2) 178.10 669 181546 323 310 263
FR (Lg3) 176.06 670 181285 62 55 31
FR (Lg4) 175.60 671 181225 2 2 2
FR (AS) 175.58 671 181223
Dry matter intake
FR (GS) 6.26 669 105715 198 185 138
FR (Wi) 6.28 669 105779 262 249 202
FR (Lg2) 6.39 669 106176 659 646 599
FR (Lg3) 6.24 670 105622 105 99 75
FR (Lg4) 6.22 671 105546 29 31 29
FR (AS) 6.21 671 105517
AICC = Akaike’s information criteria corrected; BIC = Bayesian’s information criteria; FR = fixed regression;
GS = function of Guo and Swalve; Wi = function of Wilmink; Lg2–Lg4 = Legendre polynomial of order 2, 3
and 4; AS = function of Ali and Schaeffer; σ^ 2
e = residual variance; n = number of fixed effects included in the FR
model
* calculated as difference to the FR (AS) model
Page 51
48
For both traits the AS and Lg4 functions were the most suitable functions to model the
average lactation curve under the FR models. Of these two functions AS showed somewhat
lower information criteria. However for water intake, using the BIC criteria the differences
between the models, except the FR (Lg2) model, were only small yet.
The different models were compared with regard to the plot of the mean residual water intake
(Figure 2) and dry matter intake (Figure 3) against the days in milk. This was done to check
whether the functions provide a constant model fit and thus homogeneity of variance of the
average residuals along the whole lactation.
Figure 2
Mean residuals of water intake (kg/d) against days in milk for the six functions.
Wilmink
-8
-6
-4
-2
0
2
4
6
8
0 50 100 150 200Days in milk
Mea
n r
esid
ual
(kg
/d)
Guo and Swalve
-8
-6
-4
-2
0
2
4
6
8
0 50 100 150 200Days in milk
Mea
n re
sidu
al (
kg/d
)
Legendre2
-8
-6
-4
-2
0
2
4
6
8
0 50 100 150 200Days in milk
Mea
n re
sidu
al (
kg/d
)
Legendre3
-8
-6
-4
-2
0
2
4
6
8
0 50 100 150 200Days in milk
Mea
n r
esid
ual
(kg
/d)
Legendre4
-8
-6
-4
-2
0
2
4
6
8
0 50 100 150 200Days in milk
Mea
n r
esid
ual
(kg
/d)
Ali and Schaeffer
-8
-6
-4
-2
0
2
4
6
8
0 50 100 150 200Days in milk
Mea
n r
esid
ual
(kg/
d)
Page 52
49
Figure 3
Mean residuals of dry matter intake (kg/d) against days in milk for the six functions.
Comparing the different functions for both traits, the AS as well as the Lg4 function showed
the best modelling. The average residuals obtained with these two functions were uniformly
spaced around the value 0, while the residuals of the other functions, especially the Lg2
function, showed heterogeneity of variance while observing more or less major deviations
from a uniform distribution around the value 0. It was obvious that with the Lg2 function the
predicted values at the beginning (end) of the lactation are overestimated (underestimated)
leading to negative (positive) residuals. In contrast, the residuals obtained with the Wi and GS
functions were mainly positive at the beginning and negative at the end of the lactation. This
was obvious especially for dry matter intake.
Comparison of different RR submodels to model the cow-specific lactation curve
Under the different RR models, the AS function was chosen to model the fixed effect of
average lactation curve due to best model fit. For the modelling of the cow-specific lactation
curves again the six different functions were tested. The number of covariance components,
the restricted log likelihood values and information criteria of the different RR (sub)models
are given (Table 3).
Wilmink
-2
-1,5
-1
-0,5
0
0,5
1
1,5
2
0 50 100 150 200Days in milk
Mea
n r
esid
ual
(kg/
d)
Guo and Swalve
-2
-1,5
-1
-0,5
0
0,5
1
1,5
2
0 50 100 150 200
Days in milk
Mea
n re
sidu
al (
kg/
d)
Legendre2
-2
-1,5
-1
-0,5
0
0,5
1
1,5
2
0 50 100 150 200Days in milk
Mea
n re
sidu
al (
kg/d
) Legendre3
-2
-1,5
-1
-0,5
0
0,5
1
1,5
2
0 50 100 150 200Days in milk
Mea
n re
sidu
al (
kg/d
)Legendre4
-2
-1,5
-1
-0,5
0
0,5
1
1,5
2
0 50 100 150 200Days in milk
Mea
n re
sidu
al (
kg/d
) Ali and Schaeffer
-2
-1,5
-1
-0,5
0
0,5
1
1,5
2
0 50 100 150 200
Days in milk
Mea
n re
sidu
al (
kg/
d)
Page 53
50
Table 3
Number of covariance components (q), restricted log likelihood and information criteria of
the different functions under the RR model for both traits
Model (function) q -2RlogL ∆(-2RlogL)* ∆(AICC)* ∆(BIC)*
Water intake
RR (GS) 12 167014 353 335 305
RR (Wi) 12 167051 390 372 343
RR (Lg2) 12 166972 311 293 263
RR (Lg3) 16 166793 132 122 105
RR (AS) 21 166723 62 63 65
RR (Lg4) 21 166661
Dry matter intake
RR (GS) 12 95581 491 472 443
RR (Wi) 12 95616 526 507 479
RR (Lg2) 12 95598 508 489 460
RR (Lg3) 16 95398 308 297 281
RR (AS) 21 95196 106 107 110
RR (Lg4) 21 95090 AICC = Akaike’s information criteria corrected; BIC = Bayesian’s information criteria; RR = random
regression; GS = function of Guo and Swalve; Wi = function of Wilmink; Lg2–Lg4 = Legendre polynomial of
order 2, 3 and 4; AS = function of Ali and Schaeffer;
* calculated as difference to the RR (Lg4) model
The RR (Wi) submodel showed the highest information criteria for both traits. Comparing all
model variants the best model fit was achieved with the RR (Lg4) model for both traits.
Generally, it was obvious that the RR models delivered much better information criteria than
the FR models.
Finally, the model with the best fit (RR (Lg4)) was compared to the same model except the
SP(POW) error covariance structure in order to confirm the estimated correlations between
the residuals and thus to verify the necessity of the assumption of the SP(POW) error
covariance structure. For both traits, the estimated correlations between the repeated measures
and the estimated residual variances – dependent on parity class and obtained with the RR
(Lg4) model – are given as well as the results of the LRT in comparison to the same model
except the SP(POW) error covariance structure (Table 4).
Page 54
51
Table 4
Estimated residual variance ( σ^ 2
e ) and correlation between repeated measures (re) – dependent
on parity class – and results of the LRT between the RR (Lg4) model and the same model
except the error covariance structure
σ^ 2
e re ∆(-2RlogL) LRT
Parity class 1 2 3 1 2 3
Water intake 67.34 98.68 126.77 -0.07 -0.04 -0.12 142 <0.01
Dry matter intake 2.63 3.80 4.75 -0.05 -0.05 -0.14 166 <0.01
For both traits, the LRT exposed a significant better model fit for the RR (Lg4) model
compared to the same model without the error covariance structure. Repeated measures of
both traits were autocorrelated with re between -0.04 and -0.14, depending on the parity class.
Estimated residual variance increased with parity classes 1, 2 and 3 from 67.34 up to 126.77
and from 2.63 to 4.75 for water intake and dry matter intake, respectively.
Discussion
Lactation curves
The lactation curves for dry matter intake were similar to those presented by Veerkamp and
Thompson (1999) and Hüttmann (2007). For water intake the lactation curves were akin to
those observed by Murphy et al. (1983) except for the increase of water intake at the
beginning of late lactation observed by the Lg4 and AS function. Apart from this increase the
curves for water intake showed a path similar to the well known curves for milk yield. At this
point it should be noted again, that only partial lactation was modelled because records were
only available until lactation day 230. If the curve would be extended and thus extrapolated
until lactation day 305, the increase in water intake, observed by the Lg4 and AS function,
would be continued. This is probably unrealistically and hence, extrapolation should not be
done. The actual existent increase at lactation day 200 is based on records of only a few cows.
However, the increase might be a good indication that only the functions with five parameters
(AS and Lg4) were flexible enough to model this new increase in the raw data. Hence, it was
assumed that the AS and Lg4 functions are more suitable to model the lactation curves of
water intake in contrast to the Wi and GS functions. Nevertheless, if full lactation records
would have been available, it is assumed that the increase of water intake at lactation day 200
would disappear with the raw data and hence probably with the AS and Lg4 functions so that
Page 55
52
lactation curves would be not very different between the six functions. In this case, other
criteria would have to generate more information about appropriateness of lactation functions
and the corresponding model selection. All in all, it is not expected that records from
complete lactations would have resulted in a different model selection, although this is
speculative.
Comparison of different FR submodels to model the average lactation curve
The comparison of different FR submodels did not lead to different results for both traits. In
detail, the AS function was the most suitable function to model the fixed effect of average
lactation curve for both traits. Only a slightly inferior fit was found for the Lg4 function for
both traits. Hence, the assumption after visualisation of the lactation curves that the functions
with five parameters might be more flexible and thus suitable was indeed confirmed. In the
literature the AS function has been frequently used to model of lactation curves (López-
Romero and Carabaño, 2003). In previous studies, this function has been used in order to
analyse the relationship between water and dry matter intake in the course of lactation
(Kramer et al., 2008a) and to investigate the autocorrelation patterns of residuals of water and
dry matter intake (Kramer et al., 2008b). For feed intake and energy balance this function was
also used by Woodford et al. (1984), de Vries et al. (1999) and Collard et al. (2000).
Furthermore, modelling the lactation curve of even somatic cell count measurements was also
performed using this function (Reents et al., 1995) indicating that many different traits can be
succesfully modelled using the AS function.
An additional criterion to evaluate model fitting ability is the average residual at the different
lactation days (Silvestre et al., 2006). The mean error should preferably be small and the
residuals should randomly oscillate between negative and positive residuals. This indicates
that model fit is constantly good over the whole range of lactation. For both traits the graphs
confirmed the model fit statistics and our assumption after visual inspection of the particular
lactation curves. The mean residuals showed that not each tested lactation curve model was
suitable to model water and dry matter intake because some of these functions made
systematic errors at some stages of lactation. Comparing the different functions, those with
five parameters (AS as well as the Lg4 function) were best for modelling, while the other
functions showed more or less heterogeneity of variance. However, for the mean residuals of
water intake observed with the Wi and GS functions only slightly more heterogeneity of
variance was obvious. It confirmed again the BIC information criteria (Table 2), because
these indicated only marginal differences between the AS, Lg4, GS and Wi functions for
Page 56
53
water intake in contrast to dry matter intake. The worst modelling was observed with the Lg2
function and that was in accordance with the results of the study of Silvestre et al. (2006).
Generally, modelling at the beginning and the end of the lactation seemed to be more difficult
than on the days in the middle of the lactation. This was assumed to be the case especially for
functions with inferior model fit because these functions provided systematic over-
/underestimation of the predicted values and thus negative/positive residuals at the beginning
or end of the lactation (Silvestre et al., 2006). Additionally, model performance of the
lactation models are strongly affected by the number of underlying observations per lactation
(Silvestre et al., 2006). Furthermore, the availability of test day records before peak yield is
crucial for the correct estimation of the lactation curve shape (Macciotta et al., 2005). This
might also be an explanation for the clear differences between model performance of the
separate functions in this study because the research herd is characterised by a frequently
changing cow stock. There were several cows with only few observations per lactation (at
least 15 by definition) and/or cows with a major interval between calving and first test day,
because they remained the first part of lactation in the production herd. Generally, there may
be more appropriate datasets to analyse lactation curve models. However, the average amount
of about 109 records per lactation may indicate, that the data are suitable albeit not optimal
for this type of analysis.
Due to the slightly better model fit compared to the Lg4 function and no observable
differences between the distribution of the separate average residuals of both traits during
lactation, the AS function was chosen to model the fixed effect of the lactation curve while
testing the RR models.
Comparison of different RR submodels to model the cow-specific lactation curve
For both traits the RR models had much lower information criteria in contrast to the FR
models regardless of which function was used. Similar results were found by Hüttmann
(2007) for daily milk yield and dry matter intake with different FR and RR models obtaining a
general better fit with the RR models. With RR models, water intake and dry matter intake
dynamics are modelled separately for each lactation day leading to a more effective
consideration of the underlying biology and therefore to much more precise results (van der
Werf, 2001, Mielenz et al., 2006).
Comparing the different submodels, the RR (Lg4) model provided the best model fit, thus it
was indicated that this function was most suitable to map the individual water and feed intake
dynamics of each cow during the lactation. Legendre polynomials have also been used quite
Page 57
54
often to model lactation curves of milk yield (Liu et al., 2006), but also for feed intake and
energy balance parameters (Coffey et al., 2002). Silvestre et al. (2006) hyphothesised that the
Lg4 function, which is a polynomial of the 4th degree, was able to fit daily data superior to
functions with less than five parameters such as Wi or Legendre polynomials of less than four
degrees. This was in line with the results of the present daily data-based study. It led to the
conclusion that for both the fixed and random lactation curves the functions with five
parameters (AS and Lg4) delivered the best information criteria in contrast to the other
functions with less than five parameters (Wi, GS, Lg2 and Lg3).
Different functions provided the best model fit for the fixed and the random lactation curves
for both traits. According to this also two different functions (Wi, Lg2) are currently used in
the German national genetic evaluation to model the fixed and random lactation curves of
milk yield (VIT, 2008). It is imaginable that the individual dynamics of each cow with high
variation and corresponding high amplitudes (especially since it is obvious for water and feed
intake) would have been better mapped by for instance the Lg4 function and the average
lactation curve would have been better modelled using another function (for instance AS).
The Lg4 function has an advantage for model performance in contrast to the AS function if
only few observations per cow are available, especially at the beginning of lactation (Silvestre
et al., 2006). This might have been a reason for the advantage of the Lg4 function for
modelling the cow-specific lactation curves, because the dataset of the present study
contained several cows that had previously stayed in the production herd and, hence, these
cows had their first test day later in lactation. Nevertheless, this might no longer have had any
effect on the modelling of the average lactation curve and another function (i.e. AS) actually
performed better. To check the correctness of these assumptions the Lg4 function was used to
model both the average and random lactation curve under an additional RR model (not
presented in Table 3). The model fit statistics indeed were inferior in contrast to the preferable
RR (Lg4) model, which contains the AS and Lg4 function for the modelling of the fixed and
random lactation curve. Nevertheless, an RR model using the Lg4 function for both the
average and random lactation curve might be an alternative because of the probably higher
simplicity during programming.
In addition, the comparison of the RR (Lg4) model and the same model except the SP(POW)
error covariance structure resulted in a significant difference under using the LRT. Thus it
was necessary to include the error covariance structure. This is in line to the results of
Hüttmann (2007), who also observed significant differences between RR models with and
without using an error covariance structure for daily feed intake and energy balance data.
Page 58
55
However, the estimated correlations between adjacent repeated measures were only estimated
at marginal values (-0.04 to -0.14 for both traits). Maybe one would have expected positive
instead of negative correlations. It might be imaginable that cows react inhibited at one day
since they have eaten or drunk much at the previous day. Of course this is speculative. The
highest residual variance was estimated with observations from the third parity class
indicating that the model could not explain as much of the variation in contrast to
observations from first and second parity cows. According to this, the (absolute value of the)
correlations between the residuals of adjacent repeated measures of the third parity class were
the highest confirming that with a inferior model fit the left over covariance between these
residuals may increase.
All in all, the model with the best fit – RR (Lg4) including the error covariance structure
SP(POW) – must be emphasised for analyses of datasets of water intake and dry matter intake
including also missing observations in order to obtain valid statistical inference and correct
variance components (van der Werf, 2001, Sawalha et al., 2005, Rosário et al., 2007).
Conclusion
Mean residuals of water and dry matter intake against days in milk showed clear differences
in model performance between the different FR submodels. This was confirmed by the
information criteria indicating the best model fit for the fixed and random effect of days in
milk using the AS and Lg4 functions, respectively. Furthermore, application of a covariance
structure was necessary. This led to the conclusion that the model with the best fit RR (Lg4)
must be emphasised for analyses of datasets of water intake and dry matter intake including
also missing observations.
References
Ali, T.E., Schaeffer, L.R., 1987. Accounting for covariances among test day milk yields in
dairy cows. Can. J. Anim. Sci. 67, 637-644.
Brotherstone, S., White, I.M.S., Meyer, K., 2000. Genetic modelling of daily milk yield using
orthogonal polynomials and parametric curves. Anim. Sci. 70, 407-415.
Coffey, M.P., Simm, G., Brotherstone, S., 2002. Energy balance profiles for the first three
lactations of dairy cows estimated using random regression. J. Dairy Sci. 85, 2669-
2678.
Page 59
56
Collard, B.L., Boettcher, P.J., Dekkers, J.C.M., Petitclerc, D., Schaeffer, L.R., 2000.
Relationships between energy balance and health traits of dairy cattle in early lactation.
J. Dairy Sci. 83, 2683-2690.
de Vries, M.J., van der Beek, S., Kaal-Lansbergen, L.M.T.E., Ouweltjes, W., Wilmink,
J.B.M., 1999. Modeling of energy balance in early lactation and the effect of energy
deficits in early lactation on first detected estrus postpartum in dairy cows. J. Dairy Sci.
82, 1927-1934.
González, L.A., Tolkamp, B.J., Coffey, M.P., Ferret, A., Kyriazakis, I., 2008. Changes in
feeding behaviour as possible indicators for the automatic monitoring of health
disorders in dairy cows. J. Dairy Sci. 91, 1017-1028.
Guo, Z., Swalve, H.H., 1995. Modelling of the lactation curve as a sub-model in the
evaluation of test day records. In: Proc. Interbull Mtg. Prague, Czechoslovakia.
International Bull Evaluation Service, Uppsala, Sweden. Interbull Bull. No. 11, pp. 4-7.
Hurvich, C.M., Tsai, C.L., 1989. Regression and time series model selection in small samples.
Biometrics 76, 297-397.
Hüttmann, H., 2007. Analyse der Futteraufnahme und der Energiebilanzmerkmale bei
hochleistenden, erstlaktierenden Milchkühen. Schriftenreihe des Instituts für Tierzucht
und Tierhaltung der Christian-Albrechts-Universität zu Kiel. Band 164.
Hüttmann, H., Stamer, E., Junge, W., Thaller, G., Kalm, E., 2008. Analysis of feed intake and
energy balance of high yielding first lactating Holsteins with fixed and random
regression models. Animal, in press.
Koenen, E.P.C., Veerkamp, R.F., 1998. Genetic covariance functions for live weight,
condition score, and dry-matter intake measured at different lactation stages of Holstein
Friesian heifers. Livest. Prod. Sci. 57, 67-77.
Kramer, E., Stamer, E., Mahlkow, K., Lüpping, W., Krieter, J., 2008a. Relationship between
water intake, dry matter intake and daily milk yield on a German research farm. Livest.
Sci. 115, 99-104.
Kramer, E., Stamer, E., Spilke, J., Krieter, J., 2008b. Analysis of water intake, dry matter
intake and daily milk yield using different error covariance structures. Animal 2, 1585-
1594.
Littell, R.C., Henry, P.R., Ammerman, C.B., 1998. Statistical analysis of repeated measures
data using SAS procedures. J. Anim. Sci. 76, 1216-1231.
Littell, R.C., Milliken, G.A., Stroup, W.W., Wolfinger, R.D., Schabenberger, O., 2006. SAS
for mixed models, users manual. SAS Inc., Cary, NC, USA, pp. 174-203.
Page 60
57
Liu, Y.X., Zhang, J., Schaeffer, L.R, Yang, R.Q., Zhang, W.L., 2006. Optimal random
regression models for milk production in dairy cattle. J. Dairy Sci. 89, 2233-2235.
López-Romero, P., Carabaño, M.J., 2003. Comparing alternative random regression models to
analyse first lactation daily milk yield data in Holstein-Friesian cattle. Livest. Prod. Sci.
82, 81-96.
Lukas, J.M., Reneau, J.K., Linn, J.G., 2008. Water intake and dry matter intake changes as a
feeding management tool and indicator of health and estrus status in dairy cows. J.
Dairy Sci. 91, 3385-3394.
Macciotta, N.P.P., Vicario, D., Cappio-Borlino, A., 2005. Detection of different shapes of
lactation curve for milk yield in dairy cattle by empirical mathematical models. J. Dairy
Sci. 88, 1178-1191.
Mielenz, N., Spilke, J., Krejcova, H., Schüler, L., 2006. Statistical analysis of test-day milk
yields using random regression models for the comparison of feeding groups during the
lactation period. Arch. Anim. Nutr. 60, 341-357.
Murphy, M.R., Davis, C.L., McCoy, G.C., 1983. Factors affecting water consumption by
Holstein cows in early lactation. J. Dairy Sci. 66, 35-38.
Pitt, M.A., Myung, I. J., Zhang, S., 2002. Toward a method of selecting among computational
models of cognition. Psychol. Rev. 109, 472-491.
Reents, R., Jamrozik, J., Schaeffer, L.R., Dekkers, J.C.M., 1995. Estimation of genetic
parameters for test-day records of somatic cell score. J. Dairy Sci. 78, 2847-2857.
Rosário, M.F., Silva, M.A.N., Coelho, A.A.D., Savino, V.J.M., 2007. Estimating and
predicting feed conversion in broiler chickens by modeling covariance structure. Poult.
Sci. 6, 508-514.
SAS Institute Inc., 2005. SAS/STAT User’s Guide Version 9.0. SAS Inc., Cary, NC, USA.
Sawalha, R.M., Keown, J.F., Kachman, S.D., van Vleck, L.D., 2005. Evaluation of
autoregressive covariance structures for test-day records of Holstein cows: estimates of
parameters. J. Dairy Sci. 88, 2632-2642.
Schaeffer, L.R., 2004. Application of random regression models in animal breeding. Livest.
Prod. Sci. 86, 35-45.
Schaeffer, L.R., Dekkers, J.C.M., 1994. Random regressions in animal models for test-day
production in dairy cattle. In: Proc. 5th WCGALP, Guelph, Canada. Communication No.
18, pp. 443-446.
Schwarz, G., 1978. Estimating the dimension of a model. Ann. Statist. 6, 461-464.
Page 61
58
Silvestre, A.M., Petim-Batista, F., Colaco, J., 2006. The accuracy of seven mathematical
functions in modeling dairy cattle lactation curves based on test-day records from
varying sample schemes. J. Dairy Sci. 89, 1813-1821.
van der Werf, J., 2001. Random regression in animal breeding. Course notes. Jaboticabal, SP
Brazil, November 2001. Retrieved November 28, 2008, from http://www-
personal.une.edu.au/~jvanderw/CFcoursenotes.pdf.
Veerkamp, R.F., Thompson, R., 1999. A covariance function for feed intake, live weight, and
milk yield estimated using a random regression model. J. Dairy Sci. 82, 1565-1573.
VIT, 2008. Zuchtwertschätzungsbeschreibung0808. Retrieved October 17, 2008, from
http://www.vit.de/fileadmin/user_upload/vit-fuers-
Rind/zuchtwertschaetzung/milchrinder-zws-online/Zws_Bes0808_eng.pdf.
Wilmink, J.B.M., 1987. Adjustment of test-day milk, fat and protein yield for age, season and
stage of lactation. Livest. Prod. Sci. 16, 335-348.
Wood, P.D.P., 1967. Algebraic model of the lactation curve in cattle. Nature 216, 164-165.
Woodford, S.T., Murphy, M.R., Davis, C.L., 1984. Water dynamics of dairy cattle as affected
by initiation of lactation and feed intake. J. Dairy Sci. 67, 2336-2343.
Page 62
59
Chapter Four:
Lameness and mastitis detection in dairy cows by
application of Fuzzy Logic
E. Kramer1, D. Cavero2, E. Stamer3, J. Krieter1
1Institute of Animal Breeding and Husbandry, Christian-Albrechts-University
D-24118 Kiel, Germany 2Lohmann Tierzucht GmbH, D-27454 Cuxhaven, Germany
3TiDa Tier und Daten GmbH, D-24259 Westensee/Brux, Germany
Submitted for publication in Livestock Science
Page 63
60
Abstract
The aim of the present study was to develop a fuzzy logic model for classification and control
of lameness and mastitis in cows using the data of the Futterkamp dairy research farm of the
Schleswig-Holstein Chamber of Agriculture. A dataset of about 13,500 records from 119
cows was used. Lameness treatments were used to determine two definitions of lameness;
they differed in the length of the corresponding disease block. Mastitis was determined
according to the definitions: (1) udder treatments and (2) udder treatment or SCC over
400,000/ml. Disease alerts by the fuzzy logic model were generated using the variables milk
yield, dry matter intake, dry matter intake behaviour (number of visits at the feeding trough,
time spent at the feeding troughs), water intake, activity and information about preliminary
diseases as input data. To develop and verify the model, the dataset was divided into training
data (9,074 records) and test data (4,604 records). The evaluation of the model was carried out
according to sensitivity, specificity and error rate. If the block-sensitivity was set to be at least
70%, the specificity for lameness detection ranged between 75.3% and 75.9% and the error
rate varied between 98.9% and 99.5% depending on lameness definition. With the mastitis
detection models, specificities ranged between 84.1% and 92.1%, while error rates were
obtained between 96.2% and 97.9%. The results of the test data verified those of the training
data, indicating that the models could be generalised but also are not yet applicable in
practice.
Keywords: dairy cow, lameness, mastitis, fuzzy logic.
Introduction
Lameness and mastitis still remain very important diseases for the dairy industry. In the year
2007 culling rates in Germany due to lameness and mastitis were 12.2% and 16.6%,
respectively, and have changed only marginally in the last few years (ADR, 2007).
Simultaneously, with increasing herd sizes, the time needed to detect diseases by farm staff
has decreased. Average economic losses caused by one case of lameness are rated at 446 US$
per cow and year (Esslemont and Kossaibati, 1997) and economic losses due to mastitis are
estimated to be around 150-200 Euro per cow and year (DVG, 2002). In addition, animal
welfare has become more and more important (de Mol and Ouweltjes, 2001) and thus it is
indicated that there is an overall interest for an early detection of diseases. Amongst others,
Cavero et al. (2006) developed a fuzzy logic detection model for early mastitis detection with
electrical conductivity and milk yield as input parameters. They found high sensitivities and
Page 64
61
specificities but too high error rates. Nevertheless these authors considered that fuzzy logic
can be a useful tool if an adequate sensor technique is available.
Furthermore, there are many studies which showed a linkage between water and feed intake
and the corresponding behaviour on the one hand and cow’s health status on the other hand
(González et al., 2008, Lukas et al., 2008). Lukas et al. (2008) indicated that a case of mastitis
or lameness significantly reduces the cow’s water and dry matter intake. In addition,
González et al. (2008) reported on differences in feeding behaviour between healthy cows and
cows with lameness within the 30 days before the disease occurred. Thus the aim of the
present study was to develop an automated detection system for lameness and mastitis with
fuzzy logic models. The potential input variables milk yield, water and dry matter intake and
also parameters regarding the animals behaviour such as number of visits at the feeding
troughs and feeding time were used in order to assess whether they could serve as alternative
input parameters for disease detection models in contrast to parameters obtained from other
sensor technologies.
Materials and Methods
Data
Data were recorded on the Futterkamp dairy research farm of the Chamber of Agriculture of
Schleswig-Holstein between August 2006 and February 2007. In total about 13,500 cow-days
were accumulated from 119 Holstein Friesian cows with 135 lactations. Cows were milked
twice daily and they were fed an ad libitum total mixed ration also twice daily. The feeding
and the water troughs developed and installed by the company INSENTEC were equipped
with an individual cow identification system, so the cows were only able to pass the troughs
one at a time. Each visit to the water and feeding trough was routinely recorded and the
amounts of collected feed and water were accumulated to daily yields. Furthermore, each
milking for the trait milk yield was recorded with the milk meter technology of the company
DeLaval and activity measurement was taken using neck transponders made by the same
company. In addition, medical treatments of diseases were recorded permanently by
veterinarians and farm staff. Extreme values (mainly for the traits water intake and dry matter
intake) that deviated more than ±4 s.d. were excluded from the dataset. Thus, for the traits
milk yield, water intake, dry matter intake, number of feeding visits, feeding time and activity
observations from 5.8 to 58.5 kg, 9.7 to 165.9 kg, 3.1 to 35.9 kg, 2 to 131, 18 to 385 min and
6 to 89 contacts per hour, respectively, were taken into account, while the average amount of
dry matter was about 45% during the data collecting period. Average milk yield, water and
Page 65
62
dry matter intake were 34.9, 84.3 and 20.3 kg, respectively. Mean number of feeding visits
was 51.9 and cows spent an average of 180 minutes at the feeding troughs. Additionally, the
mean activity value per day was 30.8 contacts per hour. The cows belonged to lactation
numbers 1 to 9 and the days in milk included were between day 6 and day 305.
In order to make a pre-selection of potentially suitable input traits for early disease detection,
four subdatasets were generated comprising a) cows with at least one case of lameness in the
first 100 lactation days, b) healthy cows within the same lactation stadium as for a, c) cows
with at least one case of mastitis in the first 100 lactation days and d) healthy cows within the
same lactation stadium as for c. The first 100 lactation days were chosen because these are the
days with the highest frequency of diseases (e.g. Hinrichs et al., 2006). The lame cows in
subdataset a) had their first treatment on average at lactation day 48. Hence both datasets a)
and b) consisted of lactation days 28 to 48 in order to compare the preceding days before the
disease with the corresponding healthy cows. In addition, the cows with mastitis were firstly
treated on average at lactation day 44. Thus both datasets c) and d) contained the lactation
days 24 to 44. Average milk production, water and dry matter intake, number of feeding
visits, feeding time and activity exemplary for subdatasets a) to d) are given in Table 1.
Table 1
Means (x̄) of the analysed traits for the lame cows, mastitis cows and the corresponding
particular healthy cows (standard deviations in parentheses)
Trait Lame cows Healthy cows Mastitis cows Healthy cows
Number of cows 17 48 13 51
Lactation stage (days) 28-48 28-48 24-44 24-44
Average number of parity 3.3 (1.7) 2.2 (1.1) 2.3 (0.8) 2.2 (1.0)
Milk yield (kg) 39.6 (7.4) 39.7 (8.0) 36.9 (6.5) 39.5 (8.1)
Water intake (kg) 87.6 (19.3) 89.7 (18.7) 86.3 (20.8) 88.9 (18.3)
Dry matter intake (kg) 20.2 (3.7) 20.2 (3.7) 19.8 (4.0) 19.9 (3.6)
Feeding time (min) 171.1 (45.6) 192.1 (49.4) 162.4 (41.8) 191.2 (49.2)
Number of feeding visits 41.8 (18.6) 56.0 (20.3) 49.8 (20.5) 55.8 (20.2)
Activity (contacts/h) 28.0 (9.3) 32.0 (10.3) 22.5 (7.5) 31.8 (10.3)
Production traits were only marginally affected prior to a disease, regardless of suffering from
lameness or mastitis, compared with the corresponding healthy cows. Clear differences
between diseased and healthy cows were found for the traits feeding time, number of feeding
Page 66
63
visits and activity. This is in accordance with González et al. (2008), who observed different
feeding behaviour between healthy cows and cows developing a disease in a time interval of
30 days before the first clinical sign of the disease occurred. Thus it was decided to use these
traits as potential input parameters for the disease detection models.
Finally, the complete dataset was randomly divided into two data subsets with different cows.
Two thirds of the original data were the training data, used to develop the fuzzy logic model.
The other part of the data was the test data used to test whether the developed model could be
generalised.
Disease definitions
Diseases were defined as disease blocks, i.e. an uninterrupted sequence of “days of disease”.
The treatments served as a basis for these disease blocks and the different definitions varied
only in the sequence length of the blocks. Due to the fact that cows change their feeding
behaviour a few days before clinical outbreak (González et al., 2008) and, additionally, the
focus of this study was on early disease detection, only the days before the treatment were
included in the disease blocks. Quimby et al. (2001) reported that morbid animals can be
identified earlier by monitoring feeding behaviour by four days. Hence, the following
definitions for claw and leg diseases were dependent on the number of included block disease
days before treatment:
1) Treat 3: day of treatment including three days before the treatment
2) Treat 5: day of treatment including five days before the treatment
In addition, udder health was classified on the basis of information on udder treatments as
well as on the cows’ SCC, which was measured weekly from pooled quarter milk samples
taken from each cow. A total of 1,016 SCC tests was carried out with 151,000 cells/ml on
average. The threshold of 400,000 cells/ml was used in the present study, which represents
the European Union maximum bulk milk SCC legal limit for saleable milk. An SCC
measurement of > 400 cells/ml was just as equally concerned as a treatment. Hence, two
variants of mastitis definition were used in this investigation. According to Quimby et al.
(2001) the disease blocks were extended to four days before the treatment and/or
measurement was made:
1) Treat 4: treatment performed without consideration of SCC, including four days
before treatment
2) Treat 400: treatment performed and/or a SCC > 400,000 cells/ml, including four
days before treatment and/or measurement
Page 67
64
The days in the dataset were classified as “days of health”, “days of lameness”, “days of
mastitis” or “unknown days”. Additionally, at least seven days – after the first day of
treatment occurred i.e. the last day within the defined disease block – were set to “unknown”
in order to give consideration to the withdrawal period. A disease block was defined as an
uninterrupted sequence of “days of disease” and if at least one alarm was generated by the
model within this block, the block was considered as detected.
Sixteen lameness blocks were found for the training data and eleven lameness blocks for the
test data. Depending on the mastitis definition, fourteen and 41 mastitis blocks were found to
conform to mastitis definitions 1 and 2, respectively, for the training data and eight and
seventeen for the test data. Distributions of days of health, days of disease as well as averaged
lameness or mastitis and healthy cows per day subject to definition of lameness or mastitis are
shown in Table 2.
Table 2
Number of days of health (Doh), days of lameness/mastitis (Dol/ Dom) or unknown days as
well as averaged lameness, mastitis and healthy cows per day (Lc/d, Mc/d, Hc/d) according to
the two different lameness/mastitis definitions considered.
a) Lameness
Training data Dol Doh Unknown Lc/d Hc/d
1) Treat 3 62 8,705 307 0.27 43.1
2) Treat 5 92 8,645 337 0.40 43.0
Test data
1) Treat 3 44 4,374 189 0.19 21.8
2) Treat 5 66 4,338 203 0.29 21.7
b) Mastitis
Training data Dom Doh Unknown Mc/d Hc/d
1) Treat 4 37 8,537 500 0.16 43.2
2) Treat 400 205 8,457 412 0.89 42.5
Test data
1) Treat 4 31 4,392 184 0.13 21.9
2) Treat 400 79 4,367 161 0.34 21.7
Methods
A multivariate fuzzy logic model was used to develop the automatic detection of lameness
and mastitis using MATLAB software (MATLAB, 2003). According to Biewer et al. (1997)
Page 68
65
fuzzy logic translates natural language knowledge into formal mathematical modelling and is
characterised by three steps: fuzzification, fuzzy inference and defuzzification (Zimmermann,
1991):
a) Fuzzification:
Fuzzification is the transformation of algebraic variables into linguistic variables and the
corresponding allocation of the grade of membership (a scalar between 0 and 1) to the diverse
membership functions (2-4 per trait in the present study). The input values for fuzzification
were the relative deviation of the traits milk yield, water intake, dry matter intake, number of
feeding visits, feeding time and activity between actual measured value and the corresponding
estimated moving average performed by means of the of previous five values. In addition, the
input variables “preliminary case of lameness/mastitis in the actual lactation” and
“preliminary case of lameness/mastitis in the previous lactations” were included with two
membership functions (Yes or No) for the lameness/mastitis detection models.
Figure 1 is shown as an example to illustrate the concept of linguistic variable and
membership function for the input variable deviation in feeding visits. A relative deviation of
85% would result in intersections with the membership functions “high” and “very high”. The
grade of membership would be 0.25 and 0.75 for the membership functions “high” and “very
high”, respectively.
Feeding visits
0
0,25
0,5
0,75
1
75 80 85 90 95 100 105 110 115
% Deviation of the moving average
Gra
de
of
mem
ber
ship
very high high normal low
Figure 1
Membership function for the input variable relative deviation in feeding visits
Page 69
66
b) Fuzzy inference:
This contains the setting of rules (if-conditions and then-conclusions) with the linguistic
combination of the traits, based on human knowledge. The outcome of combined traits was
the determination of the health status of the cow with the membership functions “very high”,
“high”, “middle” and “low” possibility of lameness/mastitis. An example for a rule box for
combination of the traits ‘deviation in activity’ and ‘deviation in feeding visits’ is presented in
Table 3. For example: IF deviation in feeding visits is “high” and deviation in activity is
“high”, THEN health status is a “higher” risk of lameness.
Table 3
Rules for the fuzzy inference for the traits deviation in activity and deviation in feeding visits,
concerning the risk of lameness
Deviation in activity
Low Normal High
Low no lameness no lameness middle risk
Normal no lameness no lameness higher risk
High middle risk middle risk higher risk Deviation in feeding visits
Very high middle risk higher risk very high risk
c) Defuzzification:
Defuzzification is the transformation of the fuzzy values into one output value, which has to
be compared with the real output data in order to evaluate the performance of the model.
Test procedure
If the resulting value of defuzzification exceeded a given threshold value, the system
generated an alert. This threshold depended on the lameness/mastitis definition. The model
performance was assessed by comparing these alerts with the actual occurrences of lameness
and mastitis, respectively. In doing so four different classifications could appear:
The concerning day of observation was classified as true positive (TP) if the threshold was
exceeded on a day of lameness/mastitis, while a non-detected day of lameness/mastitis was
classified as false negative (FN). Each day in a healthy period was considered a true negative
case (TN) if no alerts were generated and a false positive case (FP) if an alert was given.
The accuracy of these procedures was evaluated by the parameters sensitivity, block
sensitivity, specificity and error rate.
Page 70
67
The sensitivity represents the percentage of correctly detected days of lameness/mastitis of all
days of lameness/mastitis:
100negative falsepositive true
positive trueysensitivit ×
+
=
While sensitivity considered each single day of lameness/mastitis, for block sensitivity each
disease block was considered as a true positive case (TP) if one or more alerts were given
within the defined lameness/mastitis block and a false negative case (FN) otherwise.
The specificity indicates the percentage of correctly found healthy days from all the days of
health:
100positive falsenegative true
negative trueyspecificit ×
+
=
The error rate represents the percentage of days outside the lameness/mastitis periods from all
the days where an alarm was produced:
100positive truepositive false
positive falserate error ×
+
=
In addition, the number of false positive and true positive cows per day is also given. The
number of false positive cows per day is important. True positive and false positive cows/day
signifies the average number of rightly and wrongly diseased-registered cows per day,
respectively, and thus directly indicates the effort of the farmer with regard to disease
monitoring.
Results and discussion
The block-sensitivity was set to be at least 70%, thus the threshold for the value of fuzzy
output for the alarm occurrence was optimised for each variant. During the model
development process many different combinations of the input parameter were tested. For
lameness detection the most sufficient accuracy was obtained using the input parameters dry
matter intake, feeding time, number of feeding visits, activity and preliminary case of
lameness in actual lactation. The best mastitis detection model resulted from the combination
of the input parameters milk yield, water intake, dry matter intake, feeding time, number of
feeding visits and preliminary cases of mastitis in actual and previous lactation(s) (Table 4).
For the training data specificities were 71.2% and 70.8% for the lameness definitions Treat 3
and Treat 5, respectively. However, error rates were also high with 99.3% and 98.3%. For the
mastitis detection models, block sensitivities and specificities ranged between 71.4-78.0% and
Page 71
68
77.4-88.3%, respectively, for the variants Treat 4 and Treat 400. But again the error rates
were very high with 99.3% and 96.7%. The fact that there are many more “days of health”
than “days of lameness or mastitis” (see also Table 2) causes a greater likelihood for FP to
arise, which has a considerable impact on the error rate.
Table 4
Classification parameters of lameness (a)1) and mastitis (b)2) detection from the training data
and test data by the fuzzy logic models
a)
Training data 3)
Threshold Sensitivity 5) Specificity Error rate TP cows/d FP cows/d
1) Treat 3 0.52 75.0 71.2 99.3 0.09 12.0
2) Treat 5 0.53 75.0 70.8 98.3 0.21 12.1
Test data 4)
1) Treat 3 0.52 72.7 75.9 99.5 0.02 5.0
2) Treat 5 0.53 72.7 75.3 98.9 0.06 5.1
b)
Training data 3)
Threshold Sensitivity Specificity Error rate TP cows/d FP cows/d
1) Treat 4 0.59 71.4 88.3 99.3 0.03 4.8
2) Treat 400 0.57 78.0 77.4 96.7 0.31 9.1
Test data 4)
1) Treat 4 0.59 75.0 92.1 97.9 0.03 1.7
2) Treat 400 0.57 82.3 84.1 96.2 0.12 3.3 1) Input parameter: dry matter intake, feeding time, number of feeding visits, activity and information about preliminary cases of lameness in the actual lactation 2) Input parameter: milk yield, water intake, dry matter intake, feeding time, number of feeding visits, activity and information about preliminary cases of mastitis in the actual and previous lactations 3) Average for training data: 43 cows per day 4) Average for test data: 22 cows per day 5) Calculated as block-sensitivity
Averaged true positive and false negative cows/day were also determined, which means the
number of cows per day classified rightly and wrongly as diseased, respectively, and thus
directly illustrates the farmers’ effort with regard to lameness or mastitis monitoring. The
number of TP cows/day for the training data were 0.09 and 0.21 for lameness definitions 1
and 2 and 0.03 and 0.31 for mastitis defintions. The FP cows/day were 12.0 and 12.1 for the
alternatives 1 and 2 of lameness definition and 4.8 and 9.1 for the different mastitis
definitions. The average herd size for the training data was 43.4 cows/day and thus it was
obvious that the farmer would not have much trust in the daily alert list.
Page 72
69
The results obtained for the test data were in the same order of magnitude as for the training
data, which argues for the validation of the model and ensures that the model does not overfit
the data. This may indicate that the model is generally applicable.
Two variants of definition were used in this investigation for both disease categories.
Generally, it was obvious that the more lameness/mastitis days were included in the datasets,
the lower the error rates were due to a slightly lesser likelihood of FP alerts. This could be
observed since the block length was extended (Treat 5 in contrast to Treat 3 for lameness) or
the disease days were increased (mastitis definition Treat 400 due to including SCC data in
contrast to Treat 4). All in all, it has to be pointed out that the disease definition is very
important and influences subsequent classification results. Therefore, a comparison of model
performance with other studies is difficult.
In the literature, similar lameness detection models using input or output parameters such as
those in the present study could not be found. Both definitions in the present study were based
on treatments of the cow and differed only in block length. Ill cows can be identified
according to Quimby et al. (2001) four days before the disease occurs. Furthermore, cows
change feeding behaviour in a 30-day period before a disease (González et al., 2008). Thus
disease blocks were exposed in order to identify cases of lameness in the three or five days
enduring period before clinical outbreak, i.e. an occurrence of the first treatment. The
comparison of lame and healthy cows in a period of 20 days before treatment until the day of
treatment could confirm these suggestions (see also Table 1). According to this, model
performance with regard to sensitivity was acceptable since twelve of sixteen lameness blocks
could be correctly detected leading to a sensitivity of 75%. In turn, specificities were only
around 70% and above all, error rates were too high with about 98%. These latter
classification parameters are mainly affected by the number of FP alerts, which was very high
in the present study. A reason for this unfavourable high number of FP might be the fact that
there is a high variation of the recorded traits between cows but also within cows and,
according to Halachmi et al. (2008), cows always react individually to diseases. Hence, it is
very difficult to detect a unique pattern as to how the cow suffer and/or develop a disease. Of
course feeding behaviour especially has potential for lameness monitoring at a group level
(González et al., 2008). Nevertheless, it is probably unsuitable to be the basis of cows’
individual health monitoring in a dairy herd with good health status since at this moment an
avoidance of the bulk of FP alerts cannot be expected. Fortunately, in the last few years new
sensor techniques have been increasingly developed and early lameness detection has seemed
to work better with automatic visible analysis of cows’ gait (Flower et al., 2005) and/or
Page 73
70
weight distribution of the feet (Rajkondawar et al., 2002). The latter technology is already
used in practice (Stepmetrix©, BouMatic), although sensitivities and specificities are reported
to be improvable for this technique, too (Bicalho et al., 2007).
For mastitis, two definitions were also used in this investigation. Variant 1 (Treat 4) is
somewhat problematic since there may have been cows which were ill but not considered as
such. This leads to a higher probability of FP resulting in high error rates. Moreover, there is
also a higher probability of TN since most negatives were true. As a consequence, the
specificity is also high for this variant. Variant 2 (Treat 400) is the other definition used in this
dataset. In contrast to Variant 1, the proportion of ill cows and healthy cows is slightly higher
(see also Table 2), resulting in somewhat higher probabilities for TP but also lower
probabilities for TN. Consequently, this led to a moderate decrease of error rate and
sensitivity, respectively, in contrast to Variant 1. Of course, a SCC threshold of 400,000 is
arguable. It was also used by Cavero et al. (2006), who reported that this definition could be a
compromise of a mastitis definition between only considering treatments (as be done for
Treat) and a definition based on treatments and a relatively low SCC threshold such as
100,000, as recommended by the DVG (2002). Cavero et al. (2006) developed early mastitis
detection models for an automated milking system using fuzzy logic as a method and amongst
others electrical conductivity and milk flow as input variables. Since they allowed
sensitivities to be at least 80%, they found specificities for the mastitis definitions “Treat”,
“Treat 100” and “Treat 400” of about 94%, 78% and 89%, respectively, and also high error
rates with 96%, 47% and 77% for the three variants. Although their error rates were too high
in order to emphasise a wide use in practice, the performance of their models was somewhat
better than that obtained in the present study. All in all, it is indicated that the input
parameters used in the present study are not suitable for early mastitis detection due to the too
large variances of the input parameters between and within cows. Alternative on-farm
analyses such as viscosity measurement or online cell count measurement of the milk have
also been developed (Ordolff, 2005). These new sensor techniques are already sporadically
used in practice and will help the farmer to monitor the udder health status of cows in the
future (Lely, 2008, DeLaval, 2008).
All in all, the basis for the evaluation of the performance of disease detection is the
knowledge of the actual status of the cow on each day of observation, therefore the choice of
the length of the reference mastitis block is crucial. The block-sensitivity was calculated for
the whole disease blocks, dependent on the different disease definitions. The evaluation
parameters depend strongly on the length of the reference period around the date established
Page 74
71
for a case of lameness/mastitis. In fact, the block-sensitivity would increase significantly if
longer periods were considered. For instance, Mele et al. (2001) took seven days for clinical
and ten days after and ten days before for subclinical mastitis and de Mol et al. (1997) took
ten days before till seven days afterwards for clinical mastitis and fourteen days before and
after for subclinical mastitis. This indicates that comparing the classification parameters of the
different models is very difficult. In another study, a mastitis period comprised the day when
clinical mastitis was recorded plus the preceding six days (de Mol and Ouweltjes, 2001),
which is similar to the definition Treat for mastitis (and both lameness definitions Treat 3 and
Treat 5) used in the present study. Furthermore, in the present study, specificities were
calculated considering all cows. This has not been done in other studies (de Mol and
Ouweltjes, 2001, Mele et al., 2001), where only cows with no case of mastitis during the test
period were used. This led to a higher possibility of obtaining FP in the present study.
Conclusion
The automation of the detection of lameness or mastitis using traits with regard to
performance (milk yield, water and dry matter intake) or behaviour (feeding behaviour,
activity) did not perform well enough to obtain the chance to use it in practice. The huge
variability of the input parameters between and within cows made it very difficult to detect a
unique pattern for cows developing a case of lameness or mastitis although means of the input
traits obtained from a group of ill cows indicated differences in contrast to healthy cows. The
established fuzzy logic method was used to develop a detection model for lameness/mastitis,
and model performance is not expected to be improved since other methods (e.g. neural
networks) would be applied.
Acknowledgements
The authors are grateful to the Stiftung Schleswig-Holsteinische Landschaft for financial
support to this project.
References
ADR, 2007. Jahresbericht.
Bicalho, R.C., Cheong, S.H., Cramer, G., Guard, C.L., 2007. Association between a visual
and an automated locomotion score in lactating Holstein cows. J. Dairy Sci. 90, 3294-
3300.
Page 75
72
Biewer, B., 1997. Fuzzy-Methoden: Praxisrelevante Rechenmodelle und Fuzzy-
Programmiersprachen. Springer, Berlin Heidelberg.
Cavero, D., Tölle, K.H., Buxadé, C., Krieter, J., 2006. Mastitis detection in dairy cows by
application of Fuzzy Logic. Livest. Sci. 105, 207-213.
DeLaval, 2008. Somatic cell counter DCC. Retrieved March 08, 2008, from
http://www.delaval.com/Products/Milking/Cell-counter-DCC/default.htm.
de Mol, R.M., Kroeze, G.H., Achten, J.M.F.H., Maatje, K., Rossing, W., 1997. Results of a
multivariate approach to automated oestrus and mastitis detection. Livest. Prod. Sci. 48,
219-227.
de Mol, R.M., Ouweltjes W., 2001 Detection model for mastitis in cows milked in an
automatic milking system. Prev. Vet. Med. 49, 71-82.
DVG, 2002. Leitlinien zur Bekämpfung der Mastitis des Rindes als Bestandsproblem.
Sachverständigenausschuss "Subklinische Mastitis". 4. Auflage, Deutsche
Veterinärmedizinische Gesellschaft e. V., Gießen.
Esslemont, R.J., Kossaibati, M.A., 1997. Culling in 50 dairy herds in England. Vet. Record
140, 36-39.
Flower, F.C., Sanderson, D.J., Weary, D.M., 2005. Hoof pathologies influence kinematic
measures of dairy cow gait. J. Dairy Sci. 88, 3166-3173.
González, L.A., Tolkamp, B.J., Coffey, M.P., Ferret, A., Kyriazakis, I., 2008. Changes in
feeding behaviour as possible indicators for the automatic monitoring of health
disorders in dairy cows. J. Dairy Sci. 91, 1017-1028.
Halachmi, I., Klopcic, M., Polak, P., 2008. New tools in monitoring animal behaviour and
health status for decision making. 59th EAAP, Book of Abstracts No. 14, p. 239.
Hinrichs, D., Stamer, E., Junge, W., Kalm, E., 2006. Genetic analysis of several economically
important disease traits in German Holstein cows. Arch. Tierz. 49, 209-221.
Lely, 2008. Milk quality control (MQC). Retrieved September 18, 2008, from
http://195.162.136.147/Lely_DE_DE/agri/prodDisplay.jsp?PID=4790&PARID=4789.
Lukas, J.M., Reneau, J.K., Linn, J.G., 2008. Water intake and dry matter intake changes as a
feeding management tool and indicator of health and estrus status in dairy cows. J.
Dairy Sci. 91, 3385-3394.
MATLAB, 2003. MathsWorks, Fuzzy Logic Toolbox, for use with MATLAB 6.5.1. User’s
Guide.
Page 76
73
Mele, M., Secchiari, P., Serra, A. Ferruzzi, G., Paoletti, F., Biagioni, M., 2001. Application of
the ‘tracking signal’ method to the monitoring of udder health and oestrus in dairy
cows. Livest. Prod. Sci. 72, 279-284.
Ordollf, D., 2005. On- farm analysis of milk: a promising challenge. In: Cox, S. (ed),
Precision Livestock Farming ’05, Wageningen Academic Publishers, The Netherlands,
pp. 157-161.
Quimby, W.F., Sowell, B.F., Bowman, J.G.P., Branine, M.E, Hubbert, M.E., Sherwood,
H.W., 2001. Application of feeding behaviour to predict morbidity of newly received
calves in a commercial feedlot. Can. J. Anim. Sci. 81, 315-320.
Rajkondawar, P.G., Tasch, U., Lefcourt, A.M., Erez, B., Dyer, R.M., Varner, M.A., 2002. A
system for identifying lameness in dairy cattle. Appl. Eng. Agric. 18, 87-96.
Zimmermann, H-.J., 1991. Fuzzy set theory and its applications, Second ed. Kluwer
Academic Publishers, Boston/Dordrecht/London.
Page 78
75
General Discussion
The aim of the present study was to analyse serial data in dairy cows. Special emphasis was
given to the traits water and feed intake. In a first step, the general relationship between these
traits and additionally milk yield was analysed and model evaluation was performed. To do
this, different fixed and random regression models and in detail several candidate error
covariance strutures and lactation curve models were compared. Finally, a fuzzy logic model
was developed in order to assess the potential of health monitoring based on water and feed
intake and other serial data such as e.g. activity.
Model analysis of repeated measurements in general
Model analysis in animal breeding has been a frequently discussed topic in the literature
(amongst others van der Werf, 2001, Sawalha et al., 2005, Schaeffer and Jamrozik, 2008).
With the developement of technical progress in data recording, serial data – based on daily
measurements – have become more and more available. According to this, repeated daily
yields of e.g. the traits water intake and feed intake were available for the present study. In the
literature only little knowledge exists up to now as to what kind of models are needed for the
analysis of relatively new traits, especially water intake, and whether the relationship between
these traits is constant during the lactation. Furthermore, it is arguable as to whether the
repeated measures are independent or correlated and whether their correlation follows a
special pattern. Another question deals with the lactation trajectory of the traits and in detail
with the most suitable function to model the lactation curve. Hence, it is obvious that
modelling new traits is crucial. Finally, it should be noted that it is generally emphasised to
use a model with the best ability to fit in order to obtain valid statistical inference and correct
variance components (Bonham and Reich, 1999, van der Werf, 2001).
Fixed and random regression models
Worldwide, the estimation of breeding values for dairy cows is increasingly done using
random regression models (RR) instead of conventional fixed regression models (FR). Both
model variants contain the fixed effect of the lactation curve, which is calculated by average
regression coefficients universally valid for all cows. Due to the fact that the coefficients are
constant and fixed for all animals, the corresponding models are called FR models. In
contrast, the RR models include additional regression coefficients. These are computed for
every animal, which is usually considered as a random effect in the mixed model (van der
Page 79
76
Werf, 2001). These coefficients are therefore indicated as random regression coefficients and
the corresponding models as RR models. Thus, RR models allow the estimation of cow-
specific lactation curves (Schaeffer and Dekkers, 1994, Schaeffer, 2004). Furthermore, with
RR models it is possible to detect a potential change in dependencies of traits within the
course of lactation (Veerkamp and Thompson, 1999). Hence, both an FR and RR model were
used in the Chapter One in order to detect the changing dependencies of water and feed intake
in the course of lactation and to confirm the hypothesis of analysing these traits with RR
models, too. The repeatabilities estimated with the RR models at the different lactation
sections were slightly higher than the repeatabilities given by the FR models. The correlations
(cow effects) between the beginning and the end of lactation for water and dry matter intake
were only moderate with 0.47 and 0.43, respectively. Although the correlations (cow effects)
between water and dry matter intake remained almost constant during the lactation (0.76-
0.82), this was not the case for the correlations between water intake and milk yield (0.13-
0.84) and dry matter intake and milk yield (0.48-0.93). It was obvious that the correlations
within and across traits changed during lactation and thus RR models should also be used for
analyses of water and dry matter intake. However, a genetic analysis would have been
interesting at this point. Unfortunately, the number of cows in the dataset at 225 was too small
to estimate heritabilities and genetic correlations. Since a genetic analysis would have
confirmed the high correlations between water and dry matter intake, this would be interesting
for dairy breeding. In times of increasing costs for feed concentrates, it is imaginable to
include the trait feed intake into future dairy breeding programmes. Unfortunately, in contrast
to water intake, recording feed intake is too expensive to implement in commercial farms. The
related costs might be around 6000 € for one feeding trough (Junge, personal
communication). But for water intake, the remaining costs can be evenly distributed across
10-15 cows since this number of cows is commonly emphasised requiring only one water
trough. Of course, the farm has to be equipped with an individual cow identification
technique. Hence, with the supposed high correlation between water and feed intake it is
imaginable that water intake could serve as an information trait for feed intake and that it
could be included in a dairy breeding programme.
Correlation between repeated measures
For datasets with repeated daily measures of cows such as those given in the present study, it
is assumed that they are not independent and thus autocorrelated (Littell et al., 1998, Littell et
al., 2006). Generally, repeated measurements deserve a special statistical treatment in the
Page 80
77
sense that their covariance pattern, which has to be taken into account, is often very structured
(van der Werf, 2001). Repeated measurements on the same animal are more correlated
throughout than two measurements from different animals, and the correlation between
repeated measurements may decrease as the time between them increases (Littell et al., 2006).
Hence, modelling the covariance structure of repeated measurements correctly by using
suitable error covariance structures is of great importance for drawing correct inference from
such data (van der Werf, 2001). According to this, the daily measured traits water intake, dry
matter intake and additionally milk yield were analysed in Chapter Two by using different FR
and RR models with several error covariance structures. They were compared using the
likelihood ratio test and the information critera of Akaike (1973) and Schwarz (1978) in order
to state whether error covariance structures are necessary for the analyses of water and dry
matter intake. Furthermore, possible error covariance patterns were supposed to be detected
thereby. For this purpose, missing observations (about 10% of the dataset) had to be replaced,
because several error covariance structures are only valid for equally spaced datasets.
Including different covariance structures into the RR models resulted in better model fit in
contrast to the simple RR models. The TOEPLITZ structure of order 4 (TOEP (4)) showed
significantly better fit in contrast to the Autoregressive Model of First Order (AR (1)). The
correlations for repeated measures of water and dry matter intake were very similar. It
appeared to be the case that measures being two units apart are the highest correlated and
even for measures three units apart correlations do exist. Similar correlation patterns for dry
matter intake were found by Stamer (1995) and Hüttmann (2007) and a TOEPLITZ structure
also provided best model fit in contrast to other covariance structures. Thus it was obvious
that the correlation pattern between repeated measures of dry matter intake and also water
intake is estimated more precisely under a TOEPLITZ matrix.
Finally, the effect of model choice on statistical inference was tested with the simple RR
model and the RR model with an additional TOEP(4) error covariance structure. The fixed
effect parity was not statistically significant under the simple RR model, while it was
significant with the other model. According to this, Bonham and Reich (1999) estimated
different variance components and found varying significances of least square means when
taking different covariance structures for the residuals of repeated measures into account.
Hence, it was obvious that model choice can influence the accuracy of statistical inference.
All in all, a statistical analysis of repeated measures of water and dry matter intake should
actually be performed with an RR model and an additional TOEP(4) error covariance
structure. Unfortunately, the dataset analysed by such a model is not allowed to have missing
Page 81
78
observations and since missing values are not unusual in this case, these have to be replaced.
This is of course problematic and may not be done in praxis. Thus, another error covariance
structure should be used instead. Hence, if daily measurements of water intake were included
in dairy breeding programmes, the national genetic evaluation should be performed with an
RR model, which includes a Spatial (Power) error covariance structure to model the
autocorrelations between the measurements. Thus, valid statistical inference and correct
variance components might be obtained.
Lactation curve models
Generally, modelling lactation curves has been a frequently discussed topic in the literature
for the trait milk yield in contrast to water or feed intake (e.g. Wood, 1967, Guo and Swalve,
1995, van der Werf, 2001, Silvestre et al., 2006). In Chapters One and Two, the lactation
curves of water and feed intake were modelled according to the parameters of AS (Ali and
Schaeffer, 1987). But other functions beside AS might be quite suitable to model the lactation
trajectory of water and feed intake. Hence, the objective of Chapter Three was to analyse
daily water and feed intake measurements with different lactation curve models. In a first
step, the best function for the average lactation curve of all cows was evaluated and chosen as
the basis for the second step, the evaluation of the best function to model the cow-specific
lactation curve.
For both traits the comparison of different FR submodels generally indicated that the function
of AS was the most suitable function to model the fixed effect of the average lactation curve.
Only a slightly inferior fit was found for the Legendre polynomial of order 4 (Lg4) for both
traits. For feed intake and energy balance this function has also been used by Woodford et al.
(1984), de Vries et al. (1999) and Collard et al. (2000). Furthermore, modelling the lactation
curve of even somatic cell count measurements was also performed using this function
(Reents et al., 1995) indicating that many different traits can be succesfully modelled using
the AS function. Hence, the AS function was chosen to model the fixed effect of the lactation
curve while testing the RR models. Comparing the different RR submodels, the RR (Lg4)
model provided the best model fit, thus it was indicated that this function was most suitable to
map the individual water and feed intake dynamics of each cow during the lactation. Legendre
polynomials have also been used quite often to model lactation curves of milk yield (Liu et
al., 2006), but also of feed intake and energy balance parameters (Coffey et al., 2002).
Silvestre et al. (2006) hyphothesised that the Lg4 function, which includes 5 parameters and
which is a polynomial of the 4th degree, is able to fit daily data in a more superior manner than
Page 82
79
functions with less than five parameters such as the function of Wilmink (1987) or Legendre
polynomials of less than four degrees. This was in line with the results of the present study.
Beside the better information criteria, these functions also showed a more flexible modelling
of the lactation curves since they were able to map the new increase in the raw data of water
intake at the end of lactation in contrast to the functions with only four or less parameters.
Thus, for the analysis of water and feed intake, the AS and the Lg4 functions should be used
to model the average lactation curve and the cow-specific lactation curve, respectively. An
RR model using the Lg4 function for both the average and the cow-specific lactation curve
might nevertheless be an alternative.
Potential for health monitoring
After model evaluation, water and feed intake, but also feeding visits, feeding time, activity,
milk yield and information about preliminary diseases were used to assess their potential for
health monitoring in Chapter Four. They were included as input parameters in fuzzy logic
models in order to detect lameness and mastitis automatically. Many different combinations
of the input parameters were tested. If the sensitivities were set to be at least 70%,
specificities ranged between 75% and 92%. However, the error rates were too high with at
least 96.2%. The reason for these unsatisfying results may not have been due to the
underlying method fuzzy logic, because this method is well established in data-mining and
decision-making. Additionally, other methods such as neural networks are not assumed to
improve the results. The worse results might rather have been caused by the high variation of
the input parameters between cows but also within cows. In accordance with Halachmi et al.
(2008), cows always react individually to diseases. Hence, it was very difficult to detect a
unique pattern of the cows’ suffering and/or development of a disease. It was obvious that
most of the input parameters used in the present study were unsuitable to be the basis to
monitor the cows’ individual health. In addition, the sensors for the activity measurements
were insufficient since many records were not realistic and had to be excluded from the
dataset. Generally, developing adequate sensor technology is crucial for the subsequent
success of automatic disease monitoring. With this regard, Cavero et al. (2006) developed a
mastitis detection system using different statistical methods and using amongst others the
input parameter electrical conductivity. They also argued that the sensors used in that study
were not suitable to detect mastitis. Fortunately, in the last few years new sensor techniques
have been increasingly developed for both lameness and mastitis detection. Early lameness
detection has seemed to work better with automatic visible analysis of cows’ gait (Flower et
Page 83
80
al., 2005) and/or weight distribution of the feet (Rajkondawar et al., 2002). The latter
technology is already used in practice (Stepmetrix©, BouMatic), although sensitivities and
specificities are reported to be improvable for this technique, too (Bicalho et al., 2007). For
mastitis detection, viscosity measurement or online cell count measurement of the milk seem
to be adequate alternatives (Ordolff, 2005). These new sensor techniques are also already
sporadically used in practice and will help the farmer to monitor the udder health status of
cows in the future (Lely, 2008, DeLaval, 2008).
References
Akaike, H., 1973. Information theory and an extension of the maximum likelihood principle.
In: Petrov, B.N., Csaki, F. (eds), Proceedings of the Second International Symposium
on Information Theory, Akademiai Kiado, Budapest, Hungary, pp. 267-281.
Ali, T.E., Schaeffer, L.R., 1987. Accounting for covariances among test day milk yields in
dairy cows. Can. J. Anim. Sci. 67, 637-644.
Bicalho, R.C., Cheong, S.H., Cramer, G., Guard, C.L., 2007. Association between a visual
and an automated locomotion score in lactating Holstein cows. J. Dairy Sci. 90, 3294-
3300.
Bonham, C.D., Reich, R.M., 1999. Influence of spatial autocorrelation on a fixed-effect
model used to evaluate treatment of oil spills. J. Appl. Math. Comput. 106, 149-162.
Cavero, D., Tölle, K.H., Buxadé, C., Krieter, J., 2006. Mastitis detection in dairy cows by
application of Fuzzy Logic. Livest. Sci. 105, 207–213.
Coffey, M.P., Simm, G., Brotherstone, S., 2002. Energy balance profiles for the first three
lactations of dairy cows estimated using random regression. J. Dairy Sci. 85, 2669-
2678.
Collard, B.L., Boettcher, P.J., Dekkers, J.C.M., Petitclerc, D., Schaeffer, L.R., 2000.
Relationships between energy balance and health traits of dairy cattle in early lactation.
J. Dairy Sci. 83, 2683-2690.
DeLaval, 2008. Somatic cell counter DCC. Retrieved March 08, 2008, from
http://www.delaval.com/Products/Milking/Cell-counter-DCC/default.htm.
de Vries, M.J., van der Beek, S., Kaal-Lansbergen, L.M.T.E., Ouweltjes, W., Wilmink,
J.B.M., 1999. Modeling of energy balance in early lactation and the effect of energy
deficits in early lactation on first detected estrus postpartum in dairy cows. J. Dairy Sci.
82, 1927-1934.
Page 84
81
Flower, F.C., Sanderson, D.J., Weary, D.M., 2005. Hoof pathologies influence kinematic
measures of dairy cow gait. J. Dairy Sci. 88, 3166-3173.
Guo, Z., Swalve, H.H, 1995. Modelling of the lactation curve as a sub-model in the evaluation
of test day records. In: Proc. Interbull Mtg. Prague, Czechoslovakia. International Bull
Evaluation Service, Uppsala, Sweden. Interbull Bull. No. 11, pp. 4-7.
Halachmi, I., Klopcic, M., Polak, P., 2008. New tools in monitoring animal behaviour and
health status for decision making. 59th EAAP, Book of Abstracts No. 14, p. 239.
Hüttmann, H., 2007. Analyse der Futteraufnahme und der Energiebilanzmerkmale bei
hochleistenden, erstlaktierenden Milchkühen. Schriftenreihe des Instituts für Tierzucht
und Tierhaltung der Christian-Albrechts-Universität zu Kiel. Band 164.
Lely, 2008. Milk quality control (MQC). Retrieved September 18, 2008, from
http://195.162.136.147/Lely_DE_DE/agri/prodDisplay.jsp?PID=4790&PARID=4789.
Littell, R.C., Henry, P.R., Ammerman, C.B., 1998. Statistical analysis of repeated measures
data using SAS procedures. J. Anim. Sci. 76, 1216-1231.
Littell, R.C., Milliken, G.A., Stroup, W.W., Wolfinger, R.D., Schabenberger, O., 2006. SAS
for mixed models, users manual. SAS Inc., Cary, NC, USA, pp. 174-203.
Liu, Y.X., Zhang, J., Schaeffer, L.R., Yang, R.Q., Zhang, W.L., 2006. Optimal random
regression models for milk production in dairy cattle. J. Dairy Sci. 89, 2233-2235.
Ordollf, D., 2005. On-farm analysis of milk: a promising challenge. In: Cox, S. (ed), Precision
Livestock Farming ’05, Wageningen Academic Publishers, The Netherlands, pp. 157-
161.
Rajkondawar, P.G., Tasch, U., Lefcourt, A.M., Erez, B., Dyer, R.M., Varner, M.A., 2002. A
system for identifying lameness in dairy cattle. Appl. Eng. Agric. 18, 87-96.
Reents, R., Jamrozik, J., Schaeffer, L.R., Dekkers, J.C.M., 1995. Estimation of genetic
parameters for test-day records of somatic cell score. J. Dairy Sci. 78, 2847-2857.
Sawalha, R.M., Keown, J.F., Kachman, S.D., van Vleck, L.D., 2005. Evaluation of
autoregressive covariance structures for test-day records of Holstein cows: estimates of
parameters. J. Dairy Sci. 88, 2632-2642.
Schaeffer, L.R., 2004. Application of random regression models in animal breeding. Livest.
Prod. Sci. 86, 35-45.
Schaeffer, L.R., Dekkers, J.C.M., 1994. Random regressions in animal models for test-day
production in dairy cattle. In: Proc. 5th WCGALP 18, Guelph, Canada, pp. 443-446.
Schaeffer, L.R., Jamrozik, J. 2008. Random regression models: a longitudinal perspective. J.
Anim. Breed. Genet. 125, 145-146.
Page 85
82
Schwarz, G., 1978. Estimating the dimension of a model. Ann. Statist. 6, 461-464.
Silvestre, A.M., Petim-Batista, F., Colaco, J., 2006. The accuracy of seven mathematical
functions in modeling dairy cattle lactation curves based on test-day records from
varying sample schemes. J. Dairy Sci. 89, 1813-1821.
Stamer, E., 1995. Futteraufnahmeverhalten von Milchkühen – Analyse der Zeitstruktur und
Nutzungsmöglichkeiten. Schriftenreihe des Institutes für Tierzucht und Tierhaltung der
Christian-Albrechts-Universität zu Kiel, Band 85.
van der Werf, J., 2001. Random regression in animal breeding. Course notes. Jaboticabal, SP
Brazil, November 2001. Retrieved November 28, 2008, from http://www-
personal.une.edu.au/~jvanderw/CFcoursenotes.pdf.
Veerkamp, R.F., Thompson, R., 1999. A covariance function for feed intake, live weight, and
milk yield estimated using a random regression model. J. Dairy Sci. 82, 1565-1573.
Wilmink, J.B.M., 1987. Adjustment of test-day milk, fat and protein yield for age, season and
stage of lactation. Livest. Prod. Sci. 16, 335-348.
Wood, P.D.P., 1967. Algebraic model of the lactation curve in cattle. Nature 216, 164-165.
Woodford, S.T., Murphy, M.R., Davis, C.L., 1984. Water dynamics of dairy cattle as affected
by initiation of lactation and feed intake. J. Dairy Sci. 67, 2336-2343.
Page 86
83
General Summary
This thesis focuses on the analysis of serial data in dairy cows with special emphasis on the
traits water and feed intake. In Chapter One the general relationship between these traits and
additionally milk yield was analysed. Chapters Two and Three consist of model evaluation.
Therefore, different fixed and random regression (FR, RR) models and in detail several error
covariance strutures and lactation curve models were evaluated. In Chapter Four a fuzzy
logic model was developed in order to assess the potential of (amongst others) water and feed
intake for lameness and mastitis detection.
Data recording was generally performed on the Futterkamp dairy research farm of the
Chamber of Agriculture Schleswig-Holstein between March 2005 and February 2007. Four
different datasets were used for the analyses in the different chapters.
In Chapter One the relationship between water and dry matter intake and milk yield was
investigated in order to clarify whether these relationships remained constant over the stages
of lactation. Estimations of variance components were accomplished by applying linear mixed
FR and RR models. Repeatabilities with the FR model were assessed at 0.41, 0.34 and 0.76
for water intake, dry matter intake and milk yield and after applying the RR model they
changed during the lactation to 0.46-0.52, 0.43-0.50 and 0.79-0.92, respectively. Correlations
with the FR model between water and dry matter intake and between milk yield and water and
dry matter intake were 0.73, 0,73 and 0.59, respectively, and after applying the RR model
they ranged in the course of lactation between 0.76 and 0.82, 0.13 and 0.84 and 0.48 and 0.93,
respectively. Hence, the variance components of these traits differed during lactation. Thus
the use of RR models must be emphasised to analyse these traits.
In Chapter Two the daily measured traits water and dry matter intake and milk yield were
analysed with FR- and RR models added with different error covariance structures. It was
investigated whether these models deliver better model fitting in contrast to conventional FR-
and RR models using the likelihood ratio test, Akaike’s and Bayesian’s information criteria.
Furthermore, possible autocorrelation between repeated measures was investigated. The effect
of model choice on statistical inference was also tested.
Different autocorrelation patterns were found. Adjacent repeated measures of daily milk yield
were highest correlated (re1 = 0.32) in contrast to measures further apart, while for water
intake and dry matter intake, the measurements being two units apart had the highest
Page 87
84
correlations with re2 = 0.11 and 0.12. The covariance structure of TOEPLITZ was most
suitable to indicate the dependencies of the repeated measures for all traits. Generally, the
most complex model, RR with the additional covariance structure TOEPLITZ, provided the
lowest information criteria. Furthermore, the model choice influenced the significance values
of one fixed effect and therefore the general inference of the data analysis. Thus, the RR +
TOEPLITZ model is recommended for use for the analysis of equally spaced datasets of
water intake, dry matter intake and milk yield.
In Chapter Three six different lactation curve models for the daily measured traits water
intake and dry matter intake were evaluated. The different functions were tested for the fixed
effect of the lactation curve as well as for the individual (random) effect of the lactation curve.
Model fit was evaluated by the likelihood ratio test, Akaike’s and Bayesian’s information
criteria.
The Ali and Schaeffer function was most suitable to model the fixed effect of the lactation
curve for both traits. The Legendre polynomial of order 4 delivered the best model fit for the
random effects of lactation day. Repeated measures seemed to be autocorrelated and thus a
covariance structure for the residuals was applied. Generally, the most complex model, using
the Ali and Schaeffer function and the Legendre polynomial of order 4 to model the average
lactation and the cow-specific lactation curve and including the additional error covariance
structure Spatial (Power), provided the lowest information criteria. This model is
recommended for the analysis of water intake and dry matter intake including missing
observations.
Chapter Four deals with the development of a fuzzy logic model for classification and control
of lameness and mastitis in cows. Lameness treatments were used to determine two
definitions of lameness; they differed in the length of the corresponding disease block.
Mastitis was determined according to the definitions: (1) udder treatments and (2) udder
treatment or SCC over 400,000/ml. Disease alerts by the fuzzy logic model were generated
using as input data the variables milk yield, dry matter intake, dry matter intake behaviour
(number of visits at the feeding trough, time spent at the feeding troughs), water intake,
activity and information about preliminary diseases. To develop and verify the model, the
dataset was divided into training data (9,074 records) and test data (4,604 records). The
evaluation of the model was carried out according to sensitivity, specificity and error rate. If
the block-sensitivity was set to be at least 70%, the specificity for lameness detection ranged
Page 88
85
between 75.3% and 75.9% and the error rate varied between 98.9% and 99.5% depending on
lameness definition. With the mastitis detection models, specificities ranged between 84.1%
and 92.1%, while error rates were obtained between 96.2% and 97.9%. The results of the test
data verified those of the training data, indicating that the models could be generalised but
also are not yet applicable in practice.
Page 90
87
Zusammenfassung
Das Ziel der vorliegenden Arbeit besteht in der Analyse von seriellen Daten bei Milchkühen.
Besonderes Augenmerk liegt dabei auf der Analyse der Merkmale Wasser- und
Futteraufnahme. In Kapitel 1 wird zunächst die generelle Beziehung zwischen diesen
Merkmalen und der Milchleistung abgeleitet. In Kapitel 2 und 3 wird eine Modellevaluierung
vorgenommen. Verschiedene Fixed-Regression- und Random-Regression-Modelle (FR und
RR) werden hinsichtlich ihrer Modellgüte verglichen. Dabei sind mehrere
Kovarianzstrukturen für die Residuen sowie unterschiedliche Funktionen zur Modellierung
des Laktationsverlaufs verwendet worden. Kapitel 4 beschreibt ein Fuzzy-Logic-Modell, das
zur Abschätzung des Potentials von Wasser- und Futteraufnahme bei der Erkennung von
Lahmheiten und Mastitis entwickelt wurde.
Die Datenerfassung erfolgte zwischen März 2005 und Februar 2007 auf dem Versuchsbetrieb
Futterkamp der Landwirtschaftskammer Schleswig-Holstein. Dabei sind vier unterschiedlich
große Datensätze für die den einzelnen Kapiteln zugrunde liegenden Analysen herangezogen
worden.
In Kapitel 1 werden zunächst die Beziehungen zwischen Wasser- und Futteraufnahme sowie
Milchleistung untersucht, um in einem weiteren Schritt zu überprüfen, ob sich diese
Beziehungen zwischen den Merkmalen möglicherweise im Laktationsverlauf verändern. Die
Varianzkomponentenschätzung erfolgte mit Hilfe von linearen, gemischten FR- und RR-
Modellen. Dabei konnten mit dem FR-Modell Wiederholbarkeiten von 0,41, 0,34 und 0,76
für die Merkmale Wasser- und Futteraufnahme sowie Milchleistung geschätzt werden. Die
mit dem RR-Modell ermittelten Wiederholbarkeiten variierten im Verlauf der Laktation
zwischen 0,46 und 0,52, 0,43 und 0,50 sowie zwischen 0,79 und 0,92. Die mit dem FR-
Modell geschätzte tierbedingte Korrelation zwischen Wasser- und Futteraufnahme wurde mit
0,73 angegeben, während diese im Laktationsverlauf zwischen 0,76 und 0,82 variierte (RR-
Modell). Die Milchleistung und die Wasser- bzw. Futteraufnahme waren unter Anwendung
des FR-Modells mit 0,73 bzw. 0,59 korreliert, im Laktationsverlauf aber schwankten diese
Korrelationen zwischen 0,13 und 0,84 bzw. 0,48 und 0,93 (RR-Modell). Somit konnte gezeigt
werden, dass die Varianzkomponenten dieser Merkmale sich als nicht konstant über die
Laktation erweisen und dass aus diesem Grund RR-Modelle zur Analyse dieser Merkmale
empfohlen werden müssen.
Page 91
88
In Kapitel 2 erfolgt eine Analyse der täglich gemessenen Merkmale Wasser- und
Futteraufnahme sowie der Milchleistung mit FR- und RR-Modellen. Zusätzlich wurden die
Residuen mit unterschiedlichen Kovarianzstrukturen modelliert, um anhand des Likelihood-
Ratio-Tests sowie der Informationskriterien von Akaike und Schwarz zu überprüfen, ob diese
Modelle den konventionellen FR- und RR-Modellen überlegen sind. Außerdem konnte so
eine Untersuchung der wiederholten Beobachtungen hinsichtlich möglicher
Autokorrelationen erfolgen.
Bei der Auswertung traten in Abhängigkeit der Merkmale unterschiedliche Autokorrelations-
muster auf. Beim Merkmal Milchleistung waren benachbarte, wiederholte Messungen höher
korreliert als weiter auseinander liegende (re1 = 0,32), während bei den Merkmalen Wasser-
und Futteraufnahme diejenigen Beobachtungen mit re2 = 0,11 und 0,12 die höchsten
Korrelationen aufwiesen, die einen Abstand von zwei Tagen voneinander hatten. Die
TOEPLITZ-Kovarianzstruktur eignete sich am besten zur Abbildung der Abhängigkeiten
aller Merkmale. Insgesamt zeigte das komplexeste aller getesteten Modelle (RR-Modell mit
der zusätzlichen TOEPLITZ-Kovarianzstruktur) die niedrigsten und damit besten
Informationskriterien. Des Weiteren stellte sich heraus, dass die Modellwahl die Signifikanz
eines fixen Effektes entscheidend beeinflusste. Deshalb muss das RR + TOEPLITZ-Modell
für die Analyse von Wasser- und Futteraufnahme sowie Milchleistung empfohlen werden,
sofern die Daten keine fehlenden Beobachtungen aufweisen.
Kapitel 3 beschäftigt sich mit der Evaluierung von sechs verschiedenen Funktionen zur
Modellierung des Laktationsverlaufs der täglich erfassten Merkmale Wasser- und
Futteraufnahme. Die verschiedenen Funktionen wurden sowohl für die Modellierung des
fixen Effektes der durchschnittlichen Laktationskurve aller Kühe als auch für die Abbildung
des zufälligen Effektes des kuh-individuellen Laktationsverlaufes eingesetzt.
Für beide Merkmale erwies sich die Ali und Schaeffer-Funktion (AS) als die geeigneteste
Funktion zur Modellierung des fixen Effektes des Laktationsverlaufs, während das Legendre-
Polynom vierten Grades (Lg4) die beste Modellierung bei der kuh-individuellen
Laktationskurve zeigte. Wiederholte Beobachtungen scheinen außerdem autokorreliert zu
sein, weshalb eine Kovarianzstruktur für die Residuen angewendet wurde. Die niedrigsten
Informationskriterien ergaben sich generell beim komplexesten Modell, welches die AS-
Funktion und das Polynom Lg4 zur Modellierung der durchschnittlichen und kuh-
individuellen Laktationskurve sowie die Kovarianzstruktur Spatial (Power) zur Abbildung der
Abhängigkeiten der Residuen verwendete. Deshalb muss dieses Modell zur Analyse von
Page 92
89
täglicher Wasser- und Futteraufnahme empfohlen werden, wenn die Datensätze auch fehlende
Beobachtungen enthalten.
Das Kapitel 4 beinhaltet die Entwicklung eines Fuzzy-Logic-Modells zur Klassifizierung und
zur Kontrolle von Lahmheiten und Mastitiden bei Milchkühen. Zwei Definitionen von
Lahmheiten, die sich nur in der Länge des jeweiligen Krankheitsblocks unterschieden,
wurden mit Hilfe der Behandlungen von Klauen- und Gliedmaßenerkrankungen erstellt.
Krankheitsblöcke für Mastitis wurden anhand von 1) Euterbehandlungen sowie 2)
Euterbehandlungen und/oder eines Zellgehaltes von über 400.000 Zellen/ml definiert. Zur
Generierung der Krankheitsalarme mit dem Fuzzy-Logic-Modell wurden die Inputparameter
Milchleistung, Futteraufnahme, Futteraufnahmeverhalten (Anzahl der Fütterungsbesuche und
Fressdauer), Wasseraufnahme, Aktivität und Informationen über frühere Erkrankungen
verwendet. Um das Modell zu entwickeln und zu validieren, erfolgte eine Einteilung des
Datensatzes in einen Trainingsdatensatz (n = 9074) und einen Testdatensatz (n = 4604). Die
Güteparameter Sensitivität, Spezifität und Fehlerrate wurden zur Modellbewertung genutzt.
Bei einer Sensitivität von mindestens 70 % schwankte die Spezifität bei der Lahmheits-
erkennung je nach Definition zwischen 75,3 % und 75,9 %, während die Fehlerrate zwischen
98,9 % und 99,5 % variierte. Mit dem Modell zur Mastitiserkennung lagen die Spezifität in
Abhängigkeit der Definition bei 84,1 % und 92,1 % und die Fehlerrate zwischen 96,2 % und
97,9 %. Die Ergebnisse der Testdaten glichen denen der Trainingsdaten. Es zeigte sich damit,
dass das Modell zwar generalisiert werden konnte, es aber dennoch als nicht geeignet für den
Einsatz in der Praxis angesehen werden muss.
Page 94
DANKSAGUNG
An dieser Stelle möchte ich mich bei den Menschen bedanken, die zum Gelingen dieser
Arbeit beigetragen haben.
Mein aufrichtiger Dank gilt Herrn Prof. Dr. Joachim Krieter für die Überlassung des Themas,
die wissenschaftliche Betreuung und die gewährleisteten Freiräume bei der Erstellung dieser
Arbeit sowie für die Möglichkeiten, meine Ergebnisse auch im Ausland vorzustellen. Auf
diesem Weg möchte ich ihm auch für die Wiedereinführung der sehr lehrreichen, aber auch
Zusammenhalt fördernden Doktorandenrunden und der Doktorandenfahrt ein ganz herzliches
Dankeschön aussprechen.
Für die Übernahme des Korreferates danke ich Herrn Prof. Dr. G. Thaller.
Das Projekt wurde ermöglicht durch die finanzielle Förderung der Stiftung Schleswig-
Holsteinische Landschaft, bei der ich mich herzlich bedanke.
Für die Bereitstellung der Daten vom Lehr- und Versuchszentrum Futterkamp der
Landwirtschaftskammer Schleswig-Holstein danke ich Herrn Dr. W. Lüpping, Frau Dr. K.
Mahlkow und Herrn M. Schweigmann.
Ganz besonders bedanken möchte ich mich bei Herrn Dr. Eckhard Stamer für seine nie enden
wollende Hilfsbereitschaft, für die Vermittlung von Methoden und Wissen sowie sehr
wertvolle Anregungen bei der Anfertigung dieser Arbeit. Darüber hinaus danke ich ihm für
das freundschaftliche Verhältnis, seine immer für mich offene Tür und die vielen
Diskussionen über Fußball und anderes.
Bei Herrn Dr. David Cavero-Pintado bedanke ich mich für die ständige Hilfsbereitschaft im
Programmieren von SAS, Matlab und die entstandene sehr gute Freundschaft.
Für die ständige Bereitschaft zum Korrekturlesen bedanke ich mich bei Eckhard, Sven, Lotti,
Tina, Anna und nicht zuletzt bei meiner Schwester Hilke.
Darüber hinaus danke ich allen Kollegen und Freunden für die wunderbare Zeit am Institut,
das äußerst angenehme Arbeitsklima und die vielen gemeinsamen Stunden auf Abgabebieren,
Disputationen, Fußballabenden etc.. Des Weiteren bedanke ich mich bei unserer aktiven
Fußballrunde (v.a. bei Stephan, Andreas, Andi, Rudolf, Jan, Thomas, Marrin und Anna), die
mir stets sehr viel Spaß, draußen und in der Halle, gemacht hat. Diane und Imke T. danke ich
für die sehr netten gegenseitigen Besuche in den jeweiligen Büros, Rike, Nina und Tino für
Page 95
die witzigen Büronachbarschaftstreffen, Steffi H. für die Hilfe bei Formatierungsproblemen in
Word und Andi, Andreas, Stephan und Tino für die spaßigen Nachmittage und Abende im
Trotzdem. Mein besonderer Dank gilt den Kollegen Hauke Hüttmann, Sibylle Gäde und
Marrin Arfsten für ihre tolle Freundschaft und die moralische Unterstützung.
Abschließend bedanke ich mich für die Unterstützung und das mir entgegengebrachte
Verständnis und Vertrauen bei meinen Freunden außerhalb des Instituts (v. a. Holger, Arnd,
Arno und Claas) und meiner Familie, ganz besonders bei meiner Mutter, die es mir durch
ihren unermüdlichen Arbeitseinsatz ermöglicht hat, Tiere und Promotion unter einen Hut zu
bringen. Mein größter Dank gilt jedoch Tina, die mich stets unterstützt hat und auf die ich
mich in guten und schweren Zeiten immer verlassen konnte.
Page 96
Lebenslauf
Name: Ewald Kramer Geburtstag: 15. August 1979 Geburtsort: Leer (Ostfriesland) Familienstand: ledig Staatsangehörigkeit: deutsch Eltern: Heddo Kramer † (Landwirt), Harmine Kramer (Krankenschwester) Schulbildung
Aug. 85 – Jun. 89 Grundschule Ihrhove Aug. 89 – Jun. 91 Orientierungsstufe Collhusen Aug. 91 – Jun. 98 Ubbo-Emmius-Gymnasium Leer
Abschluss: allgemeine Hochschulreife Zivildienst
Jul. 98 – Aug. 99 Zivildienst bei der Diakoniestation Ihrhove
Berufsausbildung
Okt. 99 – Nov. 02 Studium der Agrarwissenschaften mit der Fachrichtung Tierproduktion an der Christian-Albrechts-Universität Kiel, Abschluss: Bachelor of Science
Nov. 02 – Aug. 04 Studium der Agrarwissenschaften mit der Fachrichtung Tierproduktion an der Christian-Albrechts-Universität Kiel, Abschluss: Master of Science
Berufliche Tätigkeit
Sept. 03 – Okt. 05 Betriebsleiter des familiären Milchviehbetriebes in Dorenborg (Ostfriesland)
Seit Oktober 2005 Wissenschaftlicher Mitarbeiter am Institut für Tierzucht und Tierhaltung der Christian-Albrechts-Universität zu Kiel bei Herrn Prof. Dr. J. Krieter
Praktika
Jul. 01 – Okt. 01 Landwirtschaftliches Praktikum auf dem Milchviehzuchtbetrieb Gerd Klöcker, Schwege