Water footprint of dairy production in Ethiopia An assessment on commercial dairy farming and milk processing within a 200km radius from Addis Ababa Raquel de Paiva Seroa da Motta Report 1176
Transcript
Water footprint of dairy production in EthiopiaAn assessment on commercial dairy farming and milk processing within a 200km radius from Addis Ababa
Raquel de Paiva Seroa da Motta
Together with our clients, we integrate scientific know-how and practical experience to develop livestock concepts for the 21st century. With our expertise on innovative livestock systems, nutrition, welfare, genetics and environmental impact of livestockfarming and our state-of-the art research facilities, such as Dairy Campus and Swine Innovation Centre Sterksel, we support our customers to find solutions for current and future challenges.
The mission of Wageningen UR (University & Research centre) is ‘To explore the potential of nature to improve the quality of life’. Within Wageningen UR, nine specialised research institutes of the DLO Foundation have joined forces with Wageningen University to help answer the most important questions in the domain of healthy food and living environment. With approximately 30 locations, 6,000 members of staff and 9,000 students, Wageningen UR is one of the leading organisations in its domain worldwide. The integral approach to problems and the cooperation between the various disciplines are at the heart of the unique Wageningen Approach.
Wageningen UR Livestock ResearchP.O. Box 65 8200 AB LelystadThe NetherlandsT +31 (0)320 23 82 38E [email protected]/livestockresearch
Livestock Research Report 0000ISSN 0000-000 Report 1176
Water footprint of dairy production in Ethiopia
An assessment on commercial dairy farming and milk processing within a 200km radius from Addis Ababa
Raquel de Paiva Seroa da Motta, MSc
This research was part of the DairyBISS project implemented by Wageningen Livestock Research, commissioned and funded by the Embassy of the Kingdom of the Netherlands in Ethiopia within the framework of the Food Security Programme.
Wageningen Livestock Research Wageningen, June 2019
1.1 Objective of the study 6 1.2 Scope of the study 6 1.3 Overview of activities 6 1.4 Expected results and deliverables of the study 6
2 Contextualization 8
2.1 Dairy systems in Ethiopia 8 2.2 Specialised dairy farms located in a radius of 200km from Addis Ababa 9
2.2.1 Spatial temporal and climatic characteristics 9 2.2.2 Water resources in Ethiopia and its limitations 10
2.3 Water footprint concepts 11 2.3.1 General definition 11 2.3.2 Blue, Green and Grey water footprint 11 2.3.3 WF of Animal products 11
3 Methodology of the WF assessment 13
3.1 Stepwise approach and method 13 3.2 System boundaries 14 3.3 Datasets 14 3.4 Assumptions 15 3.5 WF calculations 15
3.5.1 Water footprint of Dairy production in Ethiopia 15 3.5.2 Water footprint of feed 16
4 WF accounting results 17
4.1 Dairy chain network between producers and processing centres 17 4.1.1 KPIs collected from Dairy Producers 18 4.1.2 KPIs collected from Dairy Processing and Pasteurising centres 19
4.2 Blue water footprint 19 4.3 Green water footprint 20 4.4 Summed water footprint 20
5 Validation and discussion 21
5.1 Results compared with Ethiopia’s national weighted average WF. 21 5.2 Results compared with Ethiopia, Kenya and South Africa 22 5.3 Results compared with Ethiopia, Kenya, South Africa, Netherlands, France and
Ireland 22
6 Response strategies to reduce WF 24
6.1 Blue water footprint 24 6.2 Green water footprint 24
7 Conclusion: Further research, training and policy making 25
8 Mapping of key actors and institutions 26
8.1 Ethiopia’s water footprint stakeholders and institutions 26 8.2 WUR’s specialists 27
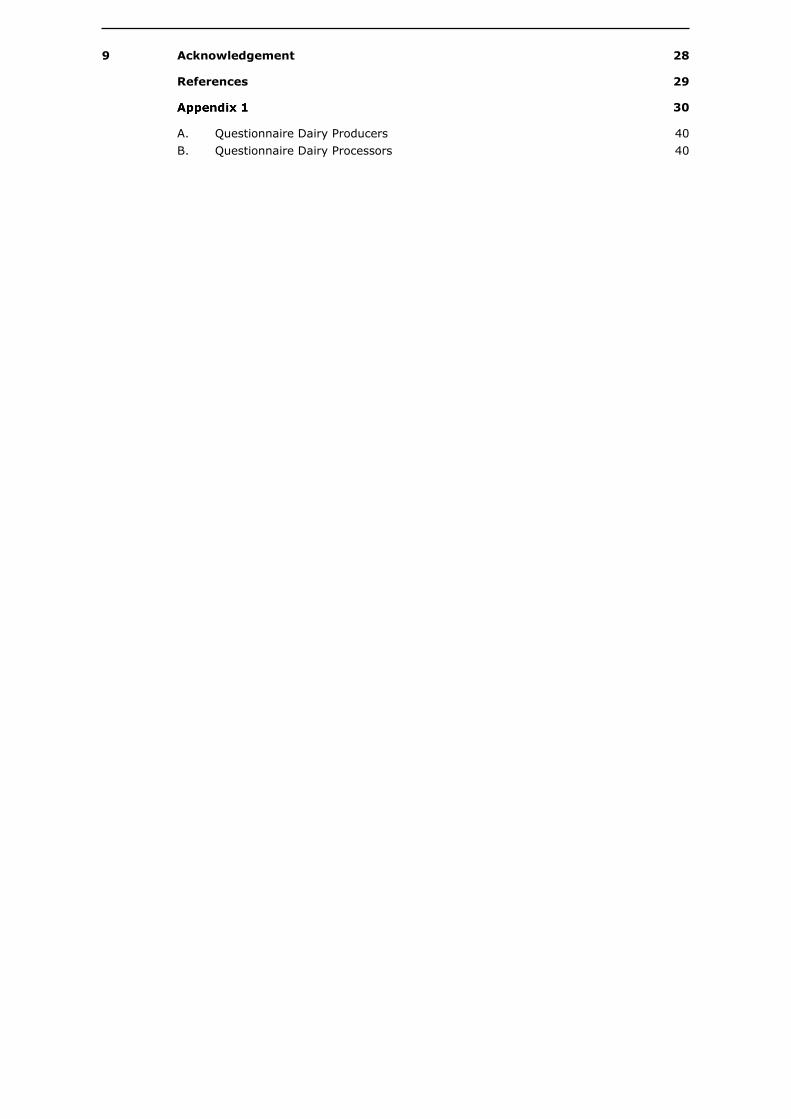
9 Acknowledgement 28
References 29
30
A. Questionnaire Dairy Producers 40 B. Questionnaire Dairy Processors 40
Wageningen Livestock Research Report 1176 | 5
1 Introduction
Efforts in capacity building and investments for the development of the Dairy sector in Ethiopia are of increased attention for its local authorities as well for the Dutch embassy, non-governmental organisations and research institutes such as Wageningen Livestock and Research (WLR). Since 2015, WLR has been active in Ethiopia implementing the DairyBiss project. As part of its finals deliverables, WLR decided to assess how the expansion of commercial dairy farming in Ethiopia could affect the availability of water resources of the country in the future. Despite the expressive number of livestock in Ethiopia, highest from Africa, dairy productivity rates in the country are considerably low. This is mostly due to poor genetics, poor nutrition(feed) and lack of natural resources allocation knowledge, such as in water an nutrient management practices. The result of those conditions is a livestock sector with low feed conversion rates. When it comes to milk, the average production per cow (i.e. local breeds) in the country ranges from a minimum of 2 litter/day until a maximum of 35 litters/cow (i.e. Exotic breeds) (Brandsma, Mengistu, Kassa, Yohannes, & Van Der Lee, 2013). Animal production requires large volumes of water for feed production, plus drinking and servicing water for the animals. By far the largest water demand in animal production is the water needed to produce animal feed. Because of the increasing demand for animal products and the growing sector of industrial farming, the demand for feedstuffs grows as well, including cereals, starchy roots, fodder crops, oilseeds and oil meals. In turn, such high demand for feed causes a rising demand for water. Besides, intensification of animal production systems, if not well managed, can lead to surface and groundwater pollution, both from the use of fertilisers in feed crops production and improper storage and application of manures (Hoekstra, 2014; M M Mekonnen & Hoekstra, 2010a). The concept of ‘water footprint’ (WF) provides an appropriate framework of analysis to find the link between the production of animal products and the use of global water resources. The water footprint is defined as the total volume of freshwater that is used to produce the goods and services consumed by an individual or community (Hoekstra, Chapagain, & Aldaya, 2011). A number of studies have assessed the WF of dairy in different contexts and countries. However, in Africa, Bosire (2016) is one of the few that have assessed the land and water footprint of Milk production in Kenya. While Owusu-Sekyere (2016) performed an assessment of blue, green and grey WF of dairy production in South Africa. Until the development of this study, no scientific literature had specifically assessed the WF of dairy production in Ethiopia. Mekonnen & Hoekstra (2010b), had elaborate an extensive study assessing the WF of animal products along the globe. Ethiopian blue, green and grey national WF average of milk production under grazing and mixed farming systems have been assessed by the authors. Nevertheless, commercial farming described as “industrial” were not assessed so far. Here we intend to fill this gap by assessing the Green and Blue WF of commercial dairy production of 7 farms and 4 milk processing plants located in a 200 km radius from Addis Ababa. Due to the relatively low contribution to the total WF of animal products, the grey WF was left out of this study scope (De Boer et al., 2013). The next chapter will present a focused description of this study scope, objectives and activities. Then, the method applied and sources of data and calculation rules are described in chapter 3. Followed by the results and validation of those in comparison with other studies performed in East Africa (chapter 4 and 5). Lastly, focus recommendations and encountered limitations are presented from a policy and scientific perspective (chapter 6). In addition, a list of key actors and organization engaged within the thematic of water-livestock-environment is provided (chapter 7).
6 | Wageningen Livestock Research Report 1176
1.1 Objective of the study
In light of the near conclusion of the DairyBISS project (August 2018) and the prevision of extending it to a longer and larger programme, the need of performing an analysis of the water footprint (WF) of dairy farming in Ethiopia was identified. The aim is to obtain a first screening and estimation of blue and green water footprint, BWF and GWF respectively, related to dairy farming and processing practices in a 200km radius from Addis Ababa. Also, a flexible framework possible to be further implemented in different dairy farms located within the Ethiopian territory is expected.
1.2 Scope of the study
Information retrieved from 7 farms and 4 milk processing centres located in a radius of 200km from Addis Ababa constituted this WF study. The focus will be on commercial specialised dairy farms. In a further stage, the intention is to implement the approach in different dairy systems within the Ethiopian territory.
1.3 Overview of activities
To achieve the aim of this investigation, a process dived in 4 strategic activities occurred: • Activity 1
1.1 Mapping of literature on Ethiopia’s water profile and studies attempting to account the WF of dairy farms in the country and regional level components such as rainfall patterns, weather variabilities and share of irrigated agriculture. In a (dairy) farm-level, the focus will be on studies estimating the consumption of ground and surface water (blue water) as well as consumption of soil moisture due to evapotranspiration (green water)
1.2 Screening of which data andspatial-temporal information will be necessary to assess the blue and green water footprint of producing one kg of fat and protein corrected milk (FPCM) in Ethiopia.
• Activity 2: 2.1 Proposal of a methodological approach to and list of follow up actions to obtain farm-level data
and the water profile of at least one agro-ecological zone in Ethiopia. 2.2 Fieldwork in Ethiopia to visualise the conditions of dairy farming and connect with institutions
which can further support this study. • Activity 3:
Implementation of the approach, including data analysis and modelling of scenarios. • Activity 4:
Interpretation and delivery of results.
1.4 Expected results and deliverables of the study
It is expected to obtain an understanding of the conditions and components which contributes to the water footprint of dairy farming in Ethiopia. An estimation of the ratio between blue/green WF of producing 1 kg of FPCM in the country will give us insights to identify farm-level improvement options. If due any constraints encountered within the process (e.g. lack of consistent farm-level data) this ratio could not be entirely identified, at least macro-level estimations can be performed to understand the contribution of the dairy sector to Ethiopia’ water stress level. In an overall, this analysis will: • Add value to the completion of the DairyBISS project; • Serve as input for the follow-up of the DairyBISS project, where deeper analysis of impact and
dependencies of water quantity and quality of the dairy sector in Ethiopia are expected; • Contribute as a study case for developing an internal strategy to addressing water-related issues on
projects from Wageningen Livestock & Environment;
Wageningen Livestock Research Report 1176 | 7
The following deliverables are expected: 1. Mapping of the dairy chain from specialised farms located in 200km radius north of the great
Addis, Highlands, humid and commercial farms. Where milk collection and processing occurs (from field to bottle). Reason: this will be the focus of the next phase of the project.
2. Accounting of the BWF and GWF 3. Mapping of a relevant network in Ethiopia – farmers, researchers, advisors and government
authorities that can support the next phase of the project.
8 | Wageningen Livestock Research Report 1176
2 Contextualization
2.1 Dairy systems in Ethiopia
Ethiopia has been facing a rapidly increasing of its human population to over 91 million (CIA World Factbook, July 2012). The country had also exprienced an accelerated rate of urbanisation at 4.3% per year, increasing per capita income in urban areas, combined with growth in direct investment in dairy processing by both expatriates and Ethiopians. It is expected that this growth will lead to an increased demand and supply of milk and milk products over the coming years. The urban population, with relatively high purchasing power, represents the main market for fresh milk and milk products. As a result, commercial and market-oriented smallholder peri-urban dairy production systems have tremendous potential for development (MoA and ILRI, 2013). Ethiopian dairy systems can be categorized under five structures of operation:
From the overall Ethiopian milk production, the rural dairy system, which includes a. b. and c. , contributes 98%, while d. and e. produce 2% of the total milk production of the country (figure 1). (Ethiopian Dairy Policy Inventory, 2009).
Figure 1 Scale representation and description of Ethiopia's dairy system. Source: Author.
Wageningen Livestock Research Report 1176 | 9
2.2 Specialised dairy farms located in a radius of 200km from Addis Ababa
2.2.1 Spatial temporal and climatic characteristics
The focus area of this study is the surroundings of the city of Addis Ababa (Ethiopia’s capital). We selected farms and processing plants located in a range of 200 km radius, mostly north, from Addis. Beyond Addis, four key locations were explored: Chancho, 50km north ( 9.25° N, 39.76° E); Gebre Guracha, 166 km northwest (9.48° N, 38.87° E); Holeta 40km west ( 9.07° N, 39.49° E); and Debre Birhan 131 km northeast (9.48° N, 39.41° E). (figure 1).
Figure 2 Ethiopia's cluster division and study focus area. Traditionally, climatic conditions in Ethiopia are classified into five climatic zones based on altitude and temperature variation. Those vary from high cold type in the extreme highlands (>3,200m) named as “wurich” to the semi-arid desert type in the low-lands (<500m) with a hot climatic condition known as “Berh”. The 200km radius in the north of Addis is classified as “Dega” by being located at 2,614 meters above sea level, with mean annual rainfall ranging from 900 to 1,200 mm and mean annual temperature ranging from 11.5 and 17.5 °C (table 1).
10 | Wageningen Livestock Research Report 1176
Table 1 Dega's climatic zone and its variables. Retrieved from (Berhanu, Seleshi, & Melesse, 2014)).
Climatic Zone Altitude Mean annual
rainfall
Length of growing
periods
Mean annual
temperature
meters mm days °C
Dega
(Cool to humid)
2,300-3,200 900-1,200 121-210 11.5-17.5
Meteorological data from the locations visited, such as rainfall (mm), sunshine (h), relative humidity (%), maximum and minimum temperature (°C), and wind speed (m/s), were retrieved from CROPWAT 8 model based on the geographical positions of each farm/processing plant. As a proxy, information was retrieved from Ethiopia’s meteorological station number 90 named as DIXIS (table 2), which is located at the geographical positions (8.13° N and 39.58 °E), altitude (2,600m) and is the closest in features with Chancho (9.18° N and 38.45° E) (2,614m). Table 2 Meteorological data from Ethiopia's station 90, used as a proxy for this study. Source:
CLIMWAT 2.0 for CROPWAT 8.
Month Min Temp Max Temp Humidity Wind Sun Rad ETo °C °C % km/day hours MJ/m²/day mm/day
January 5.4 29.4 58 104 7.9 19.4 4.09
February 4.5 28.1 59 104 7.3 19.7 4.13
March 5.9 28.1 62 104 6.7 19.7 4.19
April 7.4 26 65 104 6.6 19.7 4.04
May 6.5 25.9 65 95 6.6 19.2 3.87
June 7 26.8 70 112 6.5 18.6 3.86
July 7.5 25.8 80 104 4.3 15.5 3.24
August 8.1 24.8 82 104 5 16.9 3.35
September 8 25.4 81 104 5.1 17.1 3.44
October 6.7 25.6 73 95 6.8 19.1 3.73
November 4.9 26.1 63 104 7.7 19.3 3.78
December 4 28.6 59 104 8 19.1 3.89
Average 6.3 26.7 68 103 6.5 18.6 3.8
2.2.2 Water resources in Ethiopia and its limitations
Ethiopia has a complex topography, a diversified climate, and considerably large water resources. The spatiotemporal variability of the water resources is characterised by multi-weather-rainfall systems. Most of the river courses become full and flood their surroundings during the three main rainy months (June–August). According to current estimation, the country has about 124.4 billion cubic meters (BCM) river water, 70 BCM lake water, and 30 BCM groundwater resources. It has the potential to develop 3.8million ha of irrigation and 45,000MW hydropower production. (Berhanu et al., 2014) Most of the population in Ethiopia live in highland areas. Meantime, 85% of the population is rural and dependent on agriculture with a low level of productivity. The population pressure in highland areas led to an expansion of agricultural land to marginal areas. Production growth in the long term mainly comes from extensification of agricultural land and little is done in terms of intensification through improved water control. Even though there is a relatively large volume of physically available water per person in Ethiopia, an average of 1575 CM/yr, due to the lack of water storage infrastructure and
Wageningen Livestock Research Report 1176 | 11
large variations in rainfall, there is not enough water for most farmers to produce more than one crop per year. (Awulachew et al., 2007) (Tadesse, 2004)
2.3 Water footprint concepts
2.3.1 General definition
The water footprint is a multidimensional indicator, showing water consumption volumes by source and polluted volumes by type of pollution. It can be regarded as a comprehensive indicator of freshwater resources appropriation, next to the traditionalmeasure of water withdrawal. The water footprint of a product is the volume of freshwater assimilated to produce the product, measured over the full supply chain (Hoekstra et al., 2011). Water footprint accounts give spatiotemporally explicit information regarding how water is appropriated for various purposes. Here, by assessing the water footprint of dairy production in specific chains in Ethiopia, one can have performance indicators to deal with eminent issues such as equitable water use and allocation efficiency. The estimation of water footprints can also support further assessments of environmental, social and economic impacts.
2.3.2 Blue, Green and Grey water footprint
The blue water footprint refers to the consumption of blue water resources (surface and groundwater) along the supply chain of a product. ‘Consumption’ refers to the loss of water from the available ground-surface water body in a catchment area. Losses occur when water evaporates, returns to another catchment area, or the sea or is incorporated into a product. The green water footprint refers to the consumption of green water resources (rainwater in so far as it does not become run-off). The grey water footprint refers to pollution and is defined as the volume of freshwater that is required to assimilate the load of pollutants given natural background concentrations and existing ambient water quality standards (Hoekstra et al., 2011). ‘Consumptive water use’ does not mean that the water disappears, because water will remain within the cycle and always return somewhere. Water is a renewable resource, but that does not mean that its availability is unlimited. In a certain period, the amount of water that recharges groundwater reserves and that flows through a river is always limited to a certain amount. Water in rivers and aquifers can be used for irrigation or industrial or domestic purposes. But in a certain period, one cannot consume more water than is available.
2.3.3 WF of Animal products
The water footprints of animal products can be understood from three main factors: feed conversion efficiency of the animal, feed composition, and origin of the feed. In addition, the type of production system (grazing, mixed, commercial) is important because it influences all three factors. A first explanatory factor in the water footprints of animal products is the feed conversion efficiency. The more feed is required per unit of animal product, the more water is necessary (to produce the feed). A second factor is the feed composition, in particular, the ratio of concentrates versus roughages and the percentage of valuable crop components versus crop residues in the concentrate. A third factor that influences the water footprint of an animal product is the origin of the feed. The water footprint of a specific animal product varies across countries due to differences in climate and agricultural practice in the regions from where the various feed components are obtained. Since sometimes a relatively large fraction of the feed is imported while at other times feed is mostly obtained locally, not only the size but also the spatial dimension of the water footprint depends on the sourcing of the feed. (M M Mekonnen & Hoekstra, 2010a) The water footprint of a product equals to the sum of the WF of the process steps taken to produce the product (considering the whole production and supply chain). The water footprint of a process is expressed as water volume per unit of time. When divided over the quantity of product that results from the process (product units per unit of time), it can also be expressed as water volume per
12 | Wageningen Livestock Research Report 1176
product unit. The water footprint of a product is always expressed as water volume per product unit. Here we expressed the water footprint of dairy as:
A stepwise approach was designed to best reach the outcomes of this study. Also, the approach was elaborate as such that it could benefit the performing of future assessments of other dairy systems and countries (see figure 3).
Figure 3 Diagram of the Stepwise methodological approach developed by the author to assess the water footprint of dairy production.
First, a clear scope and goal definition is set. At this stage, the type of dairy system is defined together with is its geographical locational range, as well as altitude and mean annual rainfall. Next, the level of detail of the WF accounting is define as well as a description of how variables will be calculated and how data will be acquired or gathered. Here, the focus is on the Green and Blue WF in m3 per ton of milk. The method developed by Mekonnen & Hoesktra (2010b) to calculate WF of animal products was select to perform this accounting (see chapter 3). Besides, the Water footprint manual (Hoekstra et al., 2011) was used as guidelines to design this study. Then, the results of the WF accounting are presented (chapter 4) followed by a validation of the findings(chapter 5). Here, a study performed in Kenya (Bosire, 2016) and another in South Africa (Owusu-Sekyere et al., 2016) were used for such validation. As well as a comparison of the results in contrast with Ethiopia’s national average WF of Milk (1%<fat<6%) production and other East African and European countries averages (M M Mekonnen & Hoekstra, 2010a).
14 | Wageningen Livestock Research Report 1176
Lastly, the results from the WF accounting gives insights to identify hot-stops for the providence of further research, trainings and policy recommendations. Here, strategic meetings and interviews, as well as a livestock, water, productivity assessment of the blue Nile basin, provided strong insights into the discussion of results and elaboration of recommendations (Haileslassie, Peden, Gebreselassie, Amede, & Descheemaeker, 2009). Those recommendations are presented on chapter 6, followed by the final conclusions at chapter 7. Also, throughout the design and implementation of each of those steps, a cross-cutting activity occured. Which relates to the mapping of key actors and institutions within the subject of the study. Here the focus is on identifying those actors within the dairy, livestock, feed and water sector of Ethiopia (chapter 8).
3.2 System boundaries
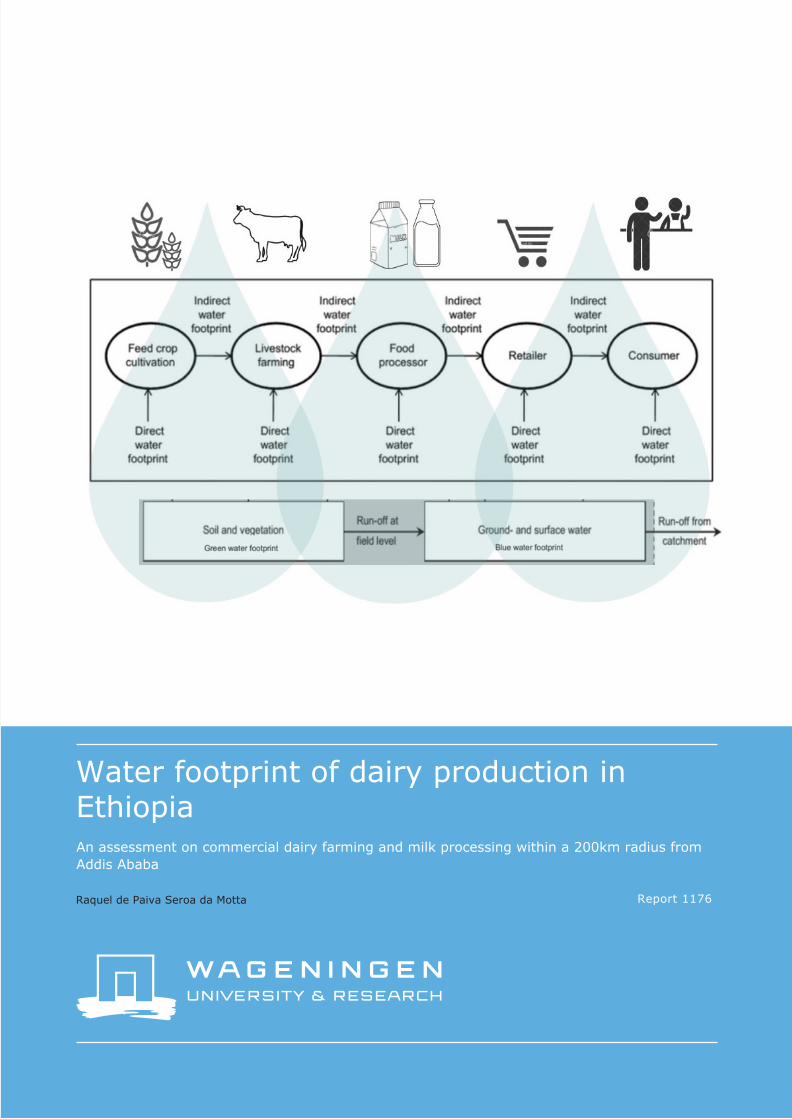
Due to the complexity of dairy farming systems in Ethiopia and the scope of this project, the system boundaries were considered as the production from (dairy) farm-to-gate (processing plant) of 1 ton of milk (1%<fat<6% ) under specialized and commercial farms located in a maximum radius of 200km from Addis Ababa. Such production was framed by looking into the capacity of production milk production of 1 unit of animal (best performing lactating cow of the herd) and its intake of drinking water and feeding practices (i.e. intake volume, composition). In addition, the volume of service water utilised for cleaning the barns, mixing the feed and other services which are indirectly related to unit of the animal were also considered. Lastly, the consumption of water related to the processing of 1 unit of milk was also allocated to obtain the final values of Green and Blue Water footprint of this study (see figure 4).
Figure 4 Diagram of this study system boundaries (dotted line) and sources of direct and indirect WF within a conventional dairy chain (source: Author).
3.3 Datasets
Primary data of water consumption and milk productivity were collected based on a tailor-made questionnaire (see Annex 1) applied in 7 farms and 4 dairy collection/processing centres. Ethiopian region specific ( Amhara, Oromia and Afar) values related to Green and Blue water footprint of crops and crop products estimated by Mekonnen and Hoesktra (2011) were considered for the calculation of
Wageningen Livestock Research Report 1176 | 15
the WF of feed. The authors obtained their values from a crop water use model at a 5 by 5 arc minute spatial resolution.
3.4 Assumptions
Due to lack of precise information related to the traceability of feed purchased by farmers, those were assumed to be produced within national boundaries of Ethiopia. Nevertheless, the information of potential regions in Ethiopia where those feed comes from were provided by the Ethiopian Ministry of Agriculture and a local advisor. That had supported the calculation of the WF of feed. A estimation of the percentage of feed intake per animal related to roughages (hay), concentrate (mainly maize, brewery bi-product and molasses) was estimated based on daily dietary information provided by the farmers to overcome the lack of precise information when it comes to feed volumes and composition ( more details in section 2). According to Aquastat1 data related to Ethiopia cultivation practices of forage and grains, here it is assumed that forage crops are rainfed, while grain crops are irrigated. All the water extracted from underground were assumed to be consumptive water. This is due to the fact that the volume is either assimilated by the cow or used for services, such as cleaning the barn, and further on discharged to non-regulated sewages which will end up in the nearest rivers, but not per say to the catchment’ location. Whereas, all the water sourced from the collection of rainwater was considered as non-consumptive, and excluded from the calculations.
3.5 WF calculations
3.5.1 Water footprint of Dairy production in Ethiopia
To estimate the water footprint of the production of dairy in Ethiopia one must aggregate the values of the WF of where this milk comes from. Meaning the sum of the WF of a dairy cattle and the WF of a dairy processing plant. For dairy cattle, it is most straightforward to look at the water footprint of the animal per year, averaged over its lifetime, because one can easily relate this annual animal water footprint to its average annual milk production (Mekonnen and Hoekstra 2010b). Therefore, the water footprint of an animal can be expressed in terms of m3/yr/animal, or, when summed over the lifetime of the animal, in terms of m3/animal. The water footprint of an animal can thus be expressed as:
𝑊𝑊𝑊𝑊 𝑑𝑑𝑑𝑑𝑑𝑑𝑑𝑑𝑑𝑑 𝑐𝑐𝑑𝑑𝑜𝑜𝑐𝑐𝑐𝑐𝑐𝑐𝑐𝑐𝑑𝑑𝑐𝑐𝑝𝑝 [ 𝑐𝑐𝑑𝑑𝑜𝑜𝑐𝑐𝑐𝑐𝑐𝑐𝑐𝑐𝑑𝑑𝑐𝑐𝑝𝑝 𝑐𝑐𝑚𝑚𝑑𝑑𝑐𝑐𝑐𝑐 ,𝐸𝐸𝑐𝑐ℎ𝑑𝑑𝑜𝑜𝑐𝑐𝑑𝑑𝑑𝑑𝑐𝑐𝑐𝑐𝑐𝑐𝑐𝑐𝑐𝑐𝑐𝑐𝑐𝑐𝑐𝑐𝑐𝑐𝑐𝑐] = 𝑊𝑊𝑊𝑊𝑐𝑐𝑐𝑐𝑑𝑑𝑐𝑐𝑑𝑑𝑐𝑐𝑐𝑐 + 𝑊𝑊𝑊𝑊 𝑐𝑐𝑐𝑐𝑐𝑐𝑑𝑑𝑝𝑝𝑑𝑑 Where, WFcattle, Ethiopia commercial, represents the water footprint of one dairy cattle in a commercial dairy system in Ethiopia related to feeding, drinking water and service water consumption, respectively; The feed water footprint generally dominates the other components by far. Service water refers to the water used for cleaning the area occupied by the animals, washing the animal and carrying out other services necessary to maintain the environment. The water footprint for drinking is related to the water intake per animal.
1 http://www.fao.org/nr/water/aquastat/countries_regions/ETH/ (Accessed on 28 July 2018)
The Total WF then was the sum of the processes that demand blue and green water consumption for each category expressed in water volume per unit of time and divided over the quantity of product that stems from the process: Either dairy production per cattle or dairy processing per processing plant.
3.5.2 Water footprint of feed
The water footprint of feed consumed by an animal consists of two parts: (i) the water footprint of the various feed ingredients; and (ii) the water that is used to mix the feed ingredients: 𝑊𝑊𝑊𝑊𝑜𝑜𝑐𝑐𝑐𝑐𝑑𝑑 [ 𝑑𝑑𝑑𝑑𝑑𝑑𝑑𝑑𝑑𝑑 𝑐𝑐𝑑𝑑𝑐𝑐𝑐𝑐𝑚𝑚𝑐𝑐,𝐸𝐸𝑐𝑐ℎ𝑑𝑑𝑜𝑜𝑐𝑐𝑑𝑑𝑑𝑑𝑐𝑐𝑐𝑐𝑐𝑐𝑐𝑐𝑐𝑐𝑐𝑐𝑐𝑐𝑐𝑐𝑐𝑐𝑐𝑐] = ∑ (𝑊𝑊𝑐𝑐𝑐𝑐𝑑𝑑, 𝑑𝑑𝑐𝑐𝑐𝑐𝑐𝑐𝑑𝑑𝑚𝑚 𝑑𝑑𝑐𝑐𝑐𝑐𝑑𝑑𝑚𝑚𝑐𝑐 [𝑐𝑐] × 𝑊𝑊𝑊𝑊𝑐𝑐𝑑𝑑𝑜𝑜𝑑𝑑 [𝑐𝑐]𝑛𝑛
𝑝𝑝=1 ) + 𝑊𝑊𝑊𝑊 𝑐𝑐𝑑𝑑𝑚𝑚𝑑𝑑𝑐𝑐𝑝𝑝 [𝑐𝑐] Where Feed, annual intake is measured in (tonne/yr) and WF mixing, is the volume of water consumed by mixing the feed (m3/yr/animal). WFprod [p] is the average water footprint of the various crops, roughages, and crop by-products p (m3/ton) weighted over the production locations. All other categories of feed than supplemental and compounded feed are assumed to be produced and consumed within the production system. Supplemental and compounded feed was further characterised as consisting of maize as the main cereal. (Bosire, 2016) Given that based on the data collection of the farms, all the feed is originated from Ethiopia itself a relation between imports and exports were not applied. The feed throughout the farms is basic a combination between roughages locally sourced – mainly hay from improved grasses – and concentrate nationally sourced - a combination of maize germ, brewery bi-product, minerals and molasses.
Wageningen Livestock Research Report 1176 | 17
4 WF accounting results
4.1 Dairy chain network between producers and processing centres
To allocate correctly the WF related to the production and processing of dairy, a mapping of the relations between dairy farms and its designated dairy processing centre was elaborate (see figure 5).
Figure 5 Relation between dairy producer (farm) and dairy processing centre (source: Author).
18 | Wageningen Livestock Research Report 1176
4.1.1 KPIs collected from Dairy Producers
Table 3 KPIs of dairy producers and collected during mission in Ethiopia.
Water, total l/day 999.1 681.5 240 575 331.9 1201.4 0.0
Water, biogas l/day
4500.0
Daily diet composition (Roughages: Concentrate)*
ratio 52:47 62:38 32:68 25:75 28:72 33:67 30:70
* Roughages, locally sourced (Manly Hay from improved grasses). Concentrate, nationally sourced (Combination of Maize germ; Brewery bi-
product; Minerals and Molasses).
Wageningen Livestock Research Report 1176 | 19
4.1.2 KPIs collected from Dairy Processing and Pasteurising centres
Table 4 KPIs collected from dairy processors during mission in Ethiopia.
Dairy Collecting and Processing Centres
Unit Zagol Centre Jato Centre Tebatu Centre Misale Centre
Location Referential city Chancho Gebre Guracha Holeta Debre Birhan
Collecting points Dairy farms 150 60 80 2100
Total Milk productivity l/day 3000 700 1200 12000
Pasteurised milk % from total production
83 55 41 30
Yogurt % from total production
17 - 19 60
Butter % from total production
- 12 - 10
Cottage cheese % from total production
- 33 - -
Mozzarella % from total production
- - 20 -
Sourcing of water, borehole
% 100 80 80 100
Sourcing of water, rainwater
%
20
Sourcing of water, local authorities
%
20
Water use, machinery cleaning
l/day 6000
Water use, collecting gallons cleaning
l/day 1000
Water use, service, location itself
l/day 500
Total water use l/day 7500 2000 3000 28000
Water, return flow (Volume that returns to same sourcing catchment)
% 50 20 0 75
4.2 Blue water footprint
Figure 6 Summary of Blue WF of each farm expressed in m3 per ton of milk.
6863
55
6963
72
42
0
10
20
30
40
50
60
70
80
Melkam Kassa Daniel Elias Emabet Tebatu Misale
BWF [m3/ton of milk]
20 | Wageningen Livestock Research Report 1176
4.3 Green water footprint
Figure 7 Summary of Green WF of each farm expressed in m3 per ton of milk.
4.4 Summed water footprint
Figure 8 Yearly sum (in purple) of Green and Blue WF of each farm expressed in m3 per ton of milk
1047
1250
1703
1951
1585
865 912
0
500
1000
1500
2000
2500
Melkam Kassa Daniel Elias Emabet Tebatu Misale
GWF [m3/ton of milk]
11481339
1768
2042
1662
978 955
0
500
1000
1500
2000
2500
Melkam Kassa Daniel Elias Emabet Tebatu Misale
Yearly sum of GWF and BWF [m3/ton of milk]
Summed WFP m3/ton of milk GWF m3/ton of milk BWF m3/ton of milk
Wageningen Livestock Research Report 1176 | 21
5 Validation and discussion
5.1 Results compared with Ethiopia’s national weighted average WF.
The comparison of our findings in relation to the weighted national average of Ethiopia’s Blue and Green WF of Milk (1%<fat<6%) help us understanding how farm-level practices have an impact on the WF and how does the national averages are closely related to the farms with poorer feed and drinking water practices (see figure 9). For instance, Elias, Daniel and Emabet are the farms with respectively higher results on Green WF and more closely related to the national average (1546 m3 of green water/ton of milk). At those farms the daily diet composition per cow is constituted of low level of roughages and high level of concentrate. For instance Elias farm presents a ration between roughages and concentrate of 25:75, and Emabet 28:72 (see table 3). In contrast, Melkam and Kassa’ results are of a ratio of 52:47 and 62:38 respectively. Presenting low results of Green WF when compared with the national average diets. This support previous research findings that feeding practices rich in roughages, rather than concentrates, has a lower impact on the WF related to farm animal products (Gerbens-Leenes & Mekonnen, 2013; M M Mekonnen & Hoekstra, 2010a; Mesfin M Mekonnen & Hoekstra, n.d.). When it comes to the Blue WF results, all the farms presented much lower results than the national level (141 m3 of blue water/ton of milk), ranging from 42 to 72 m3 of blue water/ton of milk. Where 42 m3/ton of milk is related to Misale’s farm, one of the few farms where a water management systems built by the farmer to collect rain water and re-use servicing water was observed. In one hand, the findings indicates low pressure under local water resources and catchments and could also be a reality for the Ethiopian highlands, where water resources are much more abundant than the rest of the country, not per say demanding high volumes of applied blue water as the indicated average. In the other hand, this could be a sign that the cows are not receiving enough drinking water, fundamental to boost animal welfare and productivity. In addition, could also indicate that the services in the farm, such as cleaning the barns, are not being executed with regularity. At least 3 out of the 7 barns visited were under poor sanitary conditions and could benefit not only from smart maintenance and cleaning schedules, but also from housing techniques to improve animal welfare.
Figure 9 Validation of results comparing farm results with the Ethiopian national average (last bar in the right).
11481339
1768
2042
1662
978 955
1687
10471250
17031951
1585
865 912
1546
68 63 55 69 63 72 42 141
0
500
1000
1500
2000
2500
Melkam Kassa Daniel Elias Emabet Tebatu Misale Ethiopia(Mekonnem& Hoekstra,
2012)
Results X Ethiopia's national weighted average
Summed WFP [m3/ton of milk] GWF [m3/ton of milk] BWF [m3/ton of milk]
22 | Wageningen Livestock Research Report 1176
5.2 Results compared with Ethiopia, Kenya and South Africa
By comparing the average result of total summed WFP of this study (1277 m3/ton of milk) with the average WF observed in Kenya and South Africa a couple of points deserve attention. Comparing to Kenya, the values found by Mekonnem & Hoekstra differ considerably with the values observed by Bosine. This is also observed in the previous session, when comparing this study finding with the Ethiopian average from Mekonnem & Hoekstra. This clear difference indicates how results obtained from farm-level studies (i.e. this study and Bosine) are yet necessary to validate the country-level modelling performed by Mekonnem & Hoekstra. Feeding practices in Kenya are surely more based in green forage than Ethiopia, this could also explain the findings of 855 m3/ton of milk (third purple bar). However, when comparing this study with Bosine’s findings for Kenya it is remarkable that the same value of green WF of 1200 m3/ton of milk were observed. The values of green WF of South Africa were close to the findings of this study. However, blue WF is almost twice higher. Which could indicate that feeding practices might be similar, however applied water techniques (servicing, drinking) might differ between the countries. In an overall when comparing the summed WF of this study (1277 m3/ton of milk), with Bosine’s findings for Kenya (1230 m3/ton of milk) and South Africa (1293 m3/ton of milk) the values are aligned, supporting the validation of the accounting methodology applied here.
Figure 10 Comparison of the weighted WF averages (sum, green and blue) obtained from the farms evaluated at this study (first bar left) and other studies in East Africa.
5.3 Results compared with Ethiopia, Kenya, South Africa, Netherlands, France and Ireland
The aim of performing this comparison was to support the reader on understanding how WF values differs extensively when comparing averages from Ethiopia, Kenya and South Africa with European
1277
1687
855
1230 12931200
1546
824
1200 1186
56141
60 30107
0200400600800
10001200140016001800
Average from thisstudy, Ethiopia
Ethiopia(Mekonnem &
Hoekstra, 2012)
Kenya (Mekonnem& Hoekstra, 2012)
Kenya (Bosine, 2015) South Africa(OwusuSekyere,
2016)
Results Average X Ethiopia X Kenya X South Africa
Summed WFP [m3/ton of milk] GWF [m3/ton of milk] BWF [m3/ton of milk]
Wageningen Livestock Research Report 1176 | 23
countries. The Netherlands, France and Ireland are well knew by its highly efficient and productive dairy farming practices. This is also well expressed when observing the green and blue WF of those countries.
Figure 11 Comparison of the weighted WF averages (sum, green and blue) obtained from the farms evaluated at this study (first bar left) and the average of European countries retrieved from the WF Network.
1277
1687
855
1293
519 524398
1200
1546
824
1186
477 486363
56141
60 107 42 38 35
0200400600800
10001200140016001800
Results Average X Ethiopia X Kenya XSouth Africa X Netherlands X France X Ireland
Summed WFP [m3/ton of milk] GWF [m3/ton of milk] BWF [m3/ton of milk]
24 | Wageningen Livestock Research Report 1176
6 Response strategies to reduce WF
6.1 Blue water footprint
It is noticeable that the farms which invested in water management systems performed considerably better than the ones which rely on the infrastructure offered by the government. Blue water footprints are mostly related to the direct volume of water applied and consumed. This value can reduce significantly if effective re-using and re-cycling systems are present. For farms which are closer to Addis Ababa is easier to have access to some level of waste water treatment infrastructure, however as further you go from the cities, the lower are the chances of findings those systems. Therefore, farm-level strategies must be placed in order to reach efficiently use of water resources and reducing the blue WF. In contrast with the lowlands, water is a resource in abundance in the Ethiopian highlands. This condition might possibly explain the low level of relevance given by the producers to water management practices observed in this research. It is noticeable that water is not in the priority of the “worry agendas” of the producers. However, this scenario changes when the dry period strikes. Many of the farmers encounter shortage of water and its distribution during the dry season. Reservoirs to storage rain water during the rainy season could easily tackle this issue. Nevertheless, access to information and capacity building are key into raising awareness of the importance of maximizing the efficiency of using water resources in dairy farming and production.
6.2 Green water footprint
A substantial part of the water footprint of an animal product produced in one country often resides outside that country. This is most in particular the case for products originating from industrial production systems, because those systems uses the largest fraction of concentrate feed. Feed crops are often imported rather than produced domestically. Shifting the usage of concentrated feed towards an increasing use of crop residues and by-products such as bran, straw, chaff and leaves and tops from sugar beet could be an interesting pathway for the dairy farming systems analysed in this study. Those crop-residues have a water footprint of about zero because the water footprint of crop growing is mainly attributed to the main crop products, not the low-value residues or by-products. As a result, they provide an opportunity to reduce the water footprint of animal production. The utilization of brewery bi-product was already observed in most of the farms visited. However, this was still combined with high levels of concentrate feed. Therefore, to improve this scenario a careful selection of feeds that meet the nutrient requirement of the animals and at the same time have a smaller water footprint per ton could significantly reduce the indirect use of freshwater resources (green WF) associated with dairy production in Ethiopia.
Wageningen Livestock Research Report 1176 | 25
7 Conclusion: Further research, training and policy making
Estimating the water footprint of Ethiopians dairy chains supports decision makers in understanding which kind of water resources pressures dairy farming sets in a local and regional level. Once dairy production in the Ethiopia is expected to grow as well as become more sophisticated, this study supports the building of future scenarios and management strategies for a sustainable and climate-smart expansion of the sector. Since animal production and consumption play an important role in depleting and polluting the world’s scarce freshwater resources, further research on the water footprint of animal products will help us understand how we can sustain Ethiopia’s scarce freshwater resources. To meet a rising demand for animal products, a shift from traditional extensive and mixed farming to industrial farming systems is likely to occur. Industrial farming systems largely depend on concentrate feed. This intensification of animal production systems will result in increasing water footprints per unit of animal product. The pressure on the global freshwater resources will thus increase those footprints because of the increasing milk consumption and the increasing blue and green water footprint per unit of milk consumed. On the production side, it would be wise to include freshwater implications in the development of animal farming policies, which means that particularly feed composition, feed water requirements and feed origin need to receive attention. Animal farming puts the lowest pressure on freshwater systems when dominantly based on crop residues, waste and roughages. Therefore, reinforcing initiatives focused on bi-products with high nutritional profile and fodders are key to support the growth of the dairy sector with reduced water footprints. For this, capacity must be built, and training is necessary to increase knowledge and awareness of the farmers towards the importance of feed management practices with reduced water footprints. In summary, policies aimed at reducing the negative impacts of animal production while reinforcing the establishment of climate-water-smart practices are key to support a sustainable growth of Ethiopia’s dairy sector. Lastly, in a country where the livelihood of its population greatly depends on animal farming, measurements addressing environmental trade-offs (e.g. water footprint, carbon footprint) should be carefully designed. This is to ensure that the implementation of those measures will not affect needs in food security nor disrespect cultural aspects of Ethiopians.
26 | Wageningen Livestock Research Report 1176
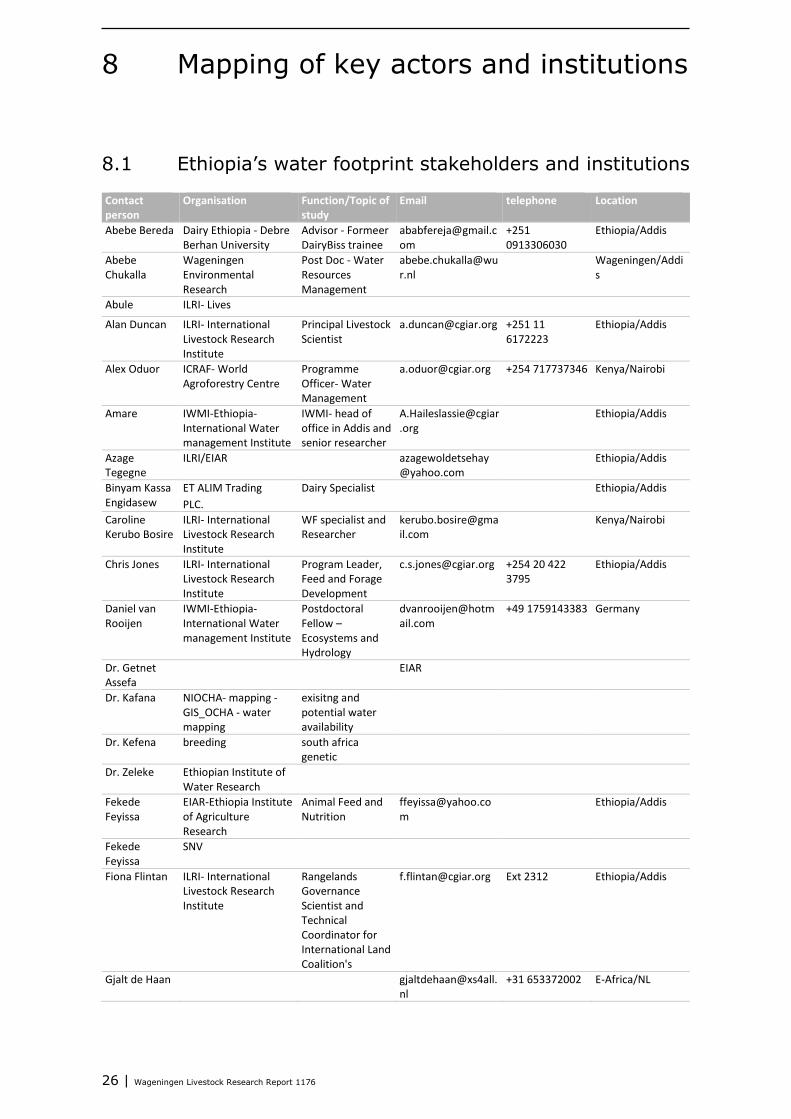
8 Mapping of key actors and institutions
8.1 Ethiopia’s water footprint stakeholders and institutions
Contact person
Organisation Function/Topic of study
Email telephone Location
Abebe Bereda Dairy Ethiopia Debre Berhan University
The author would like to thanks ir. Karin Andeweg, Adriaan Vernooij, ir. Jan van der Lee, dr Asaah Ndambi (WUR’s Livestock International colleagues) for the input and support in the Netherlands and in Addis while performing this study. In addition to dr Ingeborg de Wolf (head of the Livestock & Environment department) for her manager-careful-minded support during the preparation period in The Netherlands. Also, her most sincere gratitude( አመሰግናለሁ) for dr Abebe Bereda, who have been an incredible host, advisor and a great company in Addis. Without his effort, smartness, flexibility and charism this study would never been completed. Further thanks to the staff of the BENEFIT office, in special Zebebi and Tinsae Berhanu. Last but not least, the author would like to express her enormous obrigada, አመሰግናለሁ , gracias , dankjewel for the water and carbon foot printing researchers that supported the building of the framework applied at this study. As well for their sharing of experiences and learnings in this field of research. Many thanks dr Julio Cesar Pascale Palhares (Embrapa/Pecuária Sudeste), dr Abebe Chukalla (WUR/ Water Resources management division), dr Angel de Miguel Garcia and (WUR/ Soil physics and land management division) and dr Marion de Vries and dr Idse Hoving (WLR/ Livestock and Environment department).
Wageningen Livestock Research Report 1176 | 29
References
Berhanu, B., Seleshi, Y., & Melesse, A. M. (2014). Surface Water and Groundwater Resources of Ethiopia: Potentials and Challenges of Water Resources Development. In Nile River Basin (pp. 97–117). Cham: Springer International Publishing. https://doi.org/10.1007/978-3-319-02720-3_6
Bosire, C. K. (2016). The water and land footprint of meat and milk production and consumption in Kenya. Retrieved from http://doc.utwente.nl/102232/1/thesis_C_Bosire.pdf
Brandsma, W., Mengistu, D., Kassa, B., Yohannes, M., & Van Der Lee, J. (2013). An assessment of development potential The Major Ethiopian Milksheds. Retrieved from http://edepot.wur.nl/341410
De Boer, I. J. M., Hoving, I. E., Vellinga, T. V., Van De Ven, G. W. J., Leffelaar, P. A., & Gerber, P. J. (2013). Assessing environmental impacts associated with freshwater consumption along the life cycle of animal products: The case of Dutch milk production in Noord-Brabant. International Journal of Life Cycle Assessment, 18(1), 193–203. https://doi.org/10.1007/s11367-012-0446-3
Gerbens-Leenes, P. W., & Mekonnen, M. M. (2013). The water footprint of poultry, pork and beef: A comparative study in different countries and production systems. Water Resources and Industry, 1–2, 25–36. https://doi.org/10.1016/J.WRI.2013.03.001
Haileslassie, A., Peden, D., Gebreselassie, S., Amede, T., & Descheemaeker, K. (2009). Livestock water productivity in mixed crop – livestock farming systems of the Blue Nile basin : Assessing variability and prospects for improvement. AGRICULTURAL SYSTEMS. https://doi.org/10.1016/j.agsy.2009.06.006
Hoekstra, A. Y. (2014). Water for animal products: A blind spot in water policy. Environmental Research Letters, 9(9), 1–3. https://doi.org/10.1088/1748-9326/9/9/091003
Hoekstra, A. Y., Chapagain, A. K., & Aldaya, M. M. (2011). The Water Footprint Assessment Manual. Mekonnen, M. M., & Hoekstra, a. Y. (2011). The green, blue and grey water footprint of crops and
derived crop products. Hydrology and Earth System Sciences, 15(5), 1577–1600. https://doi.org/10.5194/hess-15-1577-2011
Mekonnen, M. M., & Hoekstra, a Y. (2010a). The green, blue and grey water footprint of farm animals and animal products. Volume 2 : Appendices. Water Research, 2(48), 122.
Mekonnen, M. M., & Hoekstra, A. Y. (n.d.). A Global Assessment of the Water Footprint of Farm Animal Products. Retrieved from http://waterfootprint.org/media/downloads/Mekonnen-Hoekstra-2012-WaterFootprintFarmAnimalProducts.pdf
Mekonnen, M. M., & Hoekstra, A. Y. (2010b). The green, blue and grey water footprint of farm animals and animal products. Retrieved from https://ris.utwente.nl/ws/portalfiles/portal/5146067/Report-48-WaterFootprint-AnimalProducts-Vol1.pdf
MoA and ILRI. (2013). Dairy value chain vision and strategy for Ethiopia. Addis Ababa, Ethiopia: Ministry of Agriculture and International Livestock Research Institute. Retrieved from http://www.moa.gov.et/home
Owusu-Sekyere, E., Scheepers, M., & Jordaan, H. (2016). Water Footprint of Milk Produced and Processed in South Africa: Implications for Policy-Makers and Stakeholders along the Dairy Value Chain. Water, 8(8), 322. https://doi.org/10.3390/w8080322
30 | Wageningen Livestock Research Report 1176
A. Questionnaire Dairy Producers
WF of Ethiopian commercial dairy chains Audience: Dairy producers Date (dd-mm-yyyy) : Interviewer name : Respondent Name : Respondent Function: Gender : � Male � Female Address / GPS coordinates : Phone number : Farm type: � commercial-specialized � mixed crop-livestock � pastoral Cattle management system: � extensive (mostly grazing) � Semi-intensive (confined, little grazing) � intensive (confined) _________________________________________________________________________________ Explanation to respondent:
• Thank you for taking time for this questionnaire. I will first explain why we do this interview.
• This questionnaire is part of the DairyBISS project. The research is an assignment financed by the Embassy of the Kingdom of the Netherlands to support the sustainable development of Dairy production in Ethiopia. Is carried out by Wageningen University from the Netherlands in partnership with Ambo university, USAID AGP Livestock Marketing Dev project, Fair & Sustainable PLC and FSiBAD.
• The reason that we do this research is because we would like to understand the dependency and impact on water resources due to dairy production. For the long run advise dairy producers and processors on measurements to improve water consumptions, efficient use, within their activities.
• The whole interview can take up to 1.0 hours, depending on your farm situation. We will start with the first half of the interview, then I would like to ask you to show me
the farm. After this, we will continue with the second half of the interview. Do you have any questions so far?________________________________________________ Screening questions: Can I take photos? Yes ( ) No ( ) How much time you have to answer the questions?___________________________________________ What is the best way for contacting you to share the results of my research?_______________________ Do you want confidentiality of your answer? Yes ( ) No ( ) Depending on the results ( ) _________________________________________________________________________________ Questionnaire:
a. What is the total area in use at the farm (ha)?_______________________________ Which % is grassland?_________________________________________ Which % is arable land?_________________________________________ Which % is used for milk production?_______________________________
b. Altitude: _____________________________________________________________
Wageningen Livestock Research Report 1176 | 31
c. Dry season (months): ________________________________________________ d. Wet season (months):__________________________________________________ e. Agroecologic Zone (AEZ):
� Bereha (hot lowlands, <500 meters, In the arid east, crop production is very limited , in the humid west roots, crops and maize are largely grown) � Kolla (lowlands, 500 - 1,500, sorghum, finger millet, sesame, cowpeas, groundnuts) � Woina Dega (midlands, 1,500 - 2,300, wheat, teff, barley, maize, sorghum, chickpeas , haricot beans) � Dega (highlands, 2,300 - 3,200, barley, wheat, highland oilseeds, highland pulses) � Wurch (highlands, 3,200 - 3,700, barley is common) � Kur (highland, >3,700, primarily for grazing)
3) Herd composition and dairy production a. How many dairy cows do you have at the moment? ____________________________ b. From those cows, how many of them are lactating (giving milk)? __________________ c. How much each cow’s weight in average?
_____________________________________ d. How many months per year each cow gives milk? ______________________________ e. Are there losses of milk until the end of the production? If yes, how much
(%)________ f. Do you have any sensor installed in the cow? Or just an identification?______________ g. Are there any parasite or diseases which can affect your cows?____________________ h. Are there any conditions which you observe a lower production of milk from the cows?
Such as winter time? Or very warm conditions?_________________________________
i. Fill in the herd size and milk productivity table: i. What is the breed of the cows? Exotic, Crossbreed? If you don’t know can
you tell me the dominant breed?_________________________________________
ii. How much milk each cow produces per day?____________________________
Local Milk Productivity (litters
Number of lactating cows
Breed (e.g. Horro) Dry season /Yearly
Dry season/Daily
Wet season/yearly
Wet Season/Daily
Total:
Per cow: Per cow: Per cow: Per cow:
Exotic (grade>75%) Milk Productivity (litters)
Number of lactating cows
Breed (e.g. H.F.) Dry season /Yearly
Dry season/Daily
Wet season/yearly
Wet Season/Daily
Per cow: Per cow: Per cow: Per cow:
Cross-breed Milk Productivity (litters)
Number of
Breed (e.g. Horro x H.F.)
Dry season /Yearly
Dry season/Daily
Wet season/yearly
Wet Season/Daily
32 | Wageningen Livestock Research Report 1176
lactating cows
Per cow: Per cow: Per cow: Per cow:
j. Fill out the production parameters of 2 lactating cows from the least and best producing
group. Milking cows/wet season
From worse performing group From best performing group
Cow 1 Cow 2 Cow 1 Cow 2
Breed � Lo � Ex � Cr � Lo � Ex � Cr � Lo � Ex � Cr � Lo � Ex � Cr
Current production
……………litter / day ……………litter / day ………litter / day ……… litter / day
Time in lactation ……………… months ……………… months ……………… months ……………… months
Number of calves ……………… calves ……………… calves ……………… calves ……………… calves
k. Where are animals mostly located during the rainy season? Milking cows/wet season Local breed Exotic Crossbred
Day � confined (no grazing)
� confined (no grazing)
� confined (no grazing)
� grassland on farm � grassland on farm � grassland on farm
� communal land � communal land � communal land
� road sides � road sides � road sides
Night � confined (no grazing)
� confined (no grazing)
� confined (no grazing)
� grassland on farm � grassland on farm � grassland on farm
� communal land � communal land � communal land
� road sides � road sides � road sides
Wageningen Livestock Research Report 1176 | 33
l. Where are animals mostly located during the dry season?
Milking cows/Dry season Local breed Exotic Crossbred
Day � confined (no grazing)
� confined (no grazing)
� confined (no grazing)
� grassland on farm � grassland on farm � grassland on farm
� communal land � communal land � communal land
� road sides � road sides � road sides
Night � confined (no grazing)
� confined (no grazing)
� confined (no grazing)
� grassland on farm � grassland on farm � grassland on farm
� communal land � communal land � communal land
� road sides � road sides � road sides
4) Dairy products and commercialisation
a. How much milk is commercialised per month and per year (litters)?________________ b. What is the % of fat in the milk? Between 1% and 6%?__________________________ c. What is the % of protein in the milk? ________________________________________ d. How is the milk taken from the cows?
� Manually � Mechanically � Robot
e. How is most of the fresh milk sold? � no fresh milk sold � sold at local market � sold to dairy cooperative, distance from farm: ………………… km � sold to processor at collection site, distance from farm: ……………… km � sold at the farm (for example, to neighbours or traders) � other, namely: ……………
f. On average, how much of the fresh milk and milk products is lost or disposed during a day on which you sold products (for example, during transport and on the market)?
Fresh milk: � (nearly) all � more than half � half � less than half � (almost) none Processed products: � (nearly) all � more than half � half � less than half � (almost) none
g. Do you consider the past year as a good year in terms of milk productivity? � very good � good � not good not bad � bad � very bad Why?………………………………………………………………………………………………………………………………… …………………………………………………………………………………………………………………………………………… ……………………………………………………………………………………………………………………………………………
5) Water consumption (cow, irrigation, cleaning) and sourcing (ground and surface water) a. Where does the water that you use comes from? (i.e. lake, reservoir, artesian well
river)? � River � Dam � Borehole Artesian well � Spring � Pipe water � Other, namely: ______________________________________________________________________
a. Does the government supply water? If yes, do you have a water meter at your property?____________________________________________________________
b. Do you have a sewage system? Does the water that you use, return in somehow to its source? ________________________________________________________________
c. How frequently do you provide water to your milking cows?* If you don’t know, can you show how do you do it?
34 | Wageningen Livestock Research Report 1176
Local breed: � Less than 1/day � 1/day � 2/day � More than 2/day � Free access Volume per day:_____ Exotic breed: � Less than 1/day � 1/day � 2/day � More than 2/day � Free access Volume per day:_____ Crossbred: � Less than 1/day � 1/day � 2/day � More than 2/day � Free access Volume per day:_____
d. Beyond the water you give, does the cow drinks/uses any other water?_____________
e. Do you use water to clean the feedlots and the barns? ________________________ i. If yes,
1. Which technique is used (non-pressurized, pressurized, flushing)?_______________________________________________
2. How much water is used?____________________________________
3. Where does this water comes from? Is it re-used from another activity?________________________________________________
f. Do you irrigate your grassland or the feed-crops you produce in your farm? i. If yes,
1. Which technique is used (pivot, furrow, hose-reel spray)?______________________________________________
2. How often (hours/day) or how much (volume)?______________________________________________________________________________________________________
g. Do you use water for any other activity/process? if yes, how
b. If your cows eat grass from your property, which kind of grass is there? When they are grazing, do they also receive other feed?______________________________________
c. Who elaborates the diet of the cows? ( ) Expert ( ) Producer/Farmer
i. If it was not an expert please move to the next question. ii. If it was an expert, does he knows the following: • What is the dry matter intake of animals throughout the feedlot? • Period _______________ days / Kg of DM or FM per cow ______ • Period _______________ days / Kg of DM or FM per cow ______ • Period _______________ days / Kg of DM or FM per cow ______ • Period _______________ days / Kg of DM or FM per cow ______ • Diet (%) of roughage/grass/pasture and diet (%) of concentrated
feed:_______
d. How much feed (also dry matter content) each cow receives per day (kg)?_______________________________________________________________________________________________________________________________________
Wageningen Livestock Research Report 1176 | 35
i. If you don’t know, how much feed is added to the feedlots? What is the size of the feedlots? And how many times feed is given per day?__________________
e. Can you please list what does your cow eats (types of feed mixed and given to the cow)?
Produces on Property (Yes/No, if yes is it an irrigated crop? )
Produced/bought outside the property (Yes /No, if yes, do you know the brand? in which city or country it comes from?)
_______Kg/day _______% of diet
� No �Yes �Yes, irrigated
Country/city:
_______Kg/day _______% of diet
� No �Yes �Yes, irrigated
Country/city:
_______Kg/day _______% of diet
� No �Yes �Yes, irrigated
Country/city:
_______Kg/day _______% of diet
� No �Yes �Yes, irrigated
Country/city:
_______Kg/day _______% of diet
� No �Yes �Yes, irrigated
Country/city:
_______Kg/day _______% of diet
� No �Yes �Yes, irrigated
Country/city:
_______Kg/day _______% of diet
� No �Yes �Yes, irrigated
Country/city:
_______Kg/day _______% of diet
� No �Yes �Yes, irrigated
Country/city:
_______Kg/day _______% of diet
� No �Yes �Yes, irrigated
Country/city:
_______Kg/day _______% of diet
� No �Yes �Yes, irrigated
Country/city:
_______Kg/day � No Country/city:
40 | Wageningen Livestock Research Report 1176
_______% of diet �Yes �Yes, irrigated
_______Kg/day _______% of diet
� No �Yes �Yes, irrigated
Country/city:
7) Farm-structure
a. Do you grow crops at your property? If no, go to section 8. � No �yes ……………………… hectares
b. What area is used for producing annual and perennial crops (cereals, pulses, etc.)? (note: fruit excluded)
� none � ……………………… hectares c. Which crops were mainly grown? What area? Which types of crops were grown on the
same plot in the past year? (if you need more space, use the back of the paper) Crop name: ……………………… Area: …………… hectares Other crops: …………………………………… Crop name: ……………………… Area: …………… hectares Other crops: …………………………………… Crop name: ……………………… Area: …………… hectares Other crops: ……………………………………
d. What area on the farm is grassland/forage area? � none � ……………………… hectares
e. What is the type of grassland at your farm? What area? � Natural grassland (unsown) Area: ……………………… hectares � Improved grassland Area: ……………………… hectares
f. Which part was irrigated? And how often? (more than one answer is possible) � No irrigation used � crops : � 1/day � 2/day � More than 2/day � _____ hours/day.
g. Do you apply artificial fertilizer at your land? And how often? � No � Yes, type:_________________________________________________ Frequency: � 1/cycle � 2/cycle � More than 2/cycle Yes, type:_________________________________________________ Frequency: � 1/cycle � 2/cycle � More than 2/cycle Yes, type:_________________________________________________ Frequency: � 1/cycle � 2/cycle � More than 2/cycle
h. Do you consider the past year as a good year in terms of farm land productivity? � very good � good � not good not bad � bad � very bad Why?…………………………………………………………………………………………………………………… …………………………………………………………………………………………………………………………………… ……………………………………………………………………………………………………………………………………
8) Manure a. What happens with the manure (fesses and urine) of the cows?
i. Do you discharge it in the water? Apply on land?________________________________________________________
ii. How much manure is produced in a month?__________________________ b. If you could profit ($) by selling manure, would you invest on a facility to storage
WF of Ethiopian commercial dairy chains Audience: Commercial and specialized milk collection centres and dairy processors
Wageningen Livestock Research Report 1176 | 41
Date (dd-mm-yyyy) : Interviewer name : Respondent Name : Respondent Function: Gender : � Male � Female Address / GPS coordinates : Phone number : _________________________________________________________________________________ Explanation to respondent:
• Thank you for taking time for this questionnaire. I will first explain why we do this interview.
• This questionnaire is part of the DairyBISS project. The research is an assignment financed by the Embassy of the Kingdom of the Netherlands to support the sustainable development of Dairy production in Ethiopia. Is carried out by Wageningen University from the Netherlands in partnership with Ambo university, USAID AGP Livestock Marketing Dev project, Fair & Sustainable PLC and FSiBAD.
• The reason that we do this research is because we would like to understand the dependency and impact on water resources due to dairy production. For the long run advise dairy producers and processors on measurements to improve water consumptions, efficient use, within their activities.
• The whole interview can take up to 1.0 hours, depending on your farm situation. We will start with the first half of the interview, then I would like to ask you to show me
the farm. After this, we will continue with the second half of the interview. Do you have any questions so far?_____________________________________________________ Screening questions: Can I take photos? Yes ( ) No ( ) How much time you have to answer the questions?________________________________________ What is the best way for contacting you to share the results of my research?_______________________ Do you want confidentiality of your answer? Yes ( ) No ( ) Depending on the results ( ) ________________________________________________________________________________
1) Chain node: ( ) Milk collection centre ( ) Pasteurising/Processing centre ( )Other 2) Producer data
a. Commercial Name: _____________________________________________________ b. Altitude: ____________________________________________________________ c. Dry season (months): _________________________________________________ d. Wet season (months):________________________________________________ e. Agro-climatic conditions:_______________________________________________
3) Production data a. How much milk is collected/processed per month/year (litters or ton)?___________ b. From how many farms do you receive milk from:____________________________ c. What is the % of fat and protein in the milk? Between 1% and 6%?______________ d. Do you add water to the raw milk? If yes, how much (litters)?__________________ e. Do you add any other ingredient to the milk?______________________________
i. If yes, could you specify (composition/brand/quantity)?_______________________________________________________________________________________________________________________________________________________________
f. Are there any conditions which you observe a lower production of milk? Such as winter time? Or very warm conditions?____________________________________________
g. How is most of the fresh milk sold?
42 | Wageningen Livestock Research Report 1176
� no fresh milk sold � sold at local market � sold to dairy cooperative, distance from farm: ………………… km � sold to processor at collection site, distance from farm: ……………… km � sold at the farm (for example, to neighbours or traders) � other, namely: ……………
h. On average, how much of the fresh milk and milk products is lost or disposed during a day on which you sold products (for example, during transport and on the market)?
Fresh milk: � (nearly) all � more than half � half � less than half � (almost) none Processed products: � (nearly) all � more than half � half � less than half � (almost) none
i. Do you consider the past year as a good year in terms of milk productivity? � very good � good � not good not bad � bad � very bad Why?………………………………………………………………………………………………………………………………………………………………………………………………………………………………………………………………………………………………………………………………………………………………………………………………………………
4) Water consumption (processing, cleaning) and sourcing (ground or surface water) a. Where does the water that you use comes from? (i.e. lake, reservoir, artesian well
river)? � River � Dam � Borehole � Artesian well � Spring � Pipe water � Other, namely: ______________________________________________________________________
b. Are there any waterways next or in your property? ___________________________ c. Do you use water from underground?_______________________________________ d. Does the government supply water? If yes, do you have a water meter at your
property?_____________________________________________________________ e. Do you have a sewage system? Does the water that you use, return in somehow to its
source? ______________________________________________________________ f. Do you use water to clean the bottles before adding the milk? If yes, how much and
how often?________________________________________________________________
g. Do you use water for any other activity/process?___________________________ i. If yes, how much water is used?
_____________________________________ ii. Where does this water comes
from?___________________________________
44 | Conficential W
ageningen Livestock Research R
eport XXXX
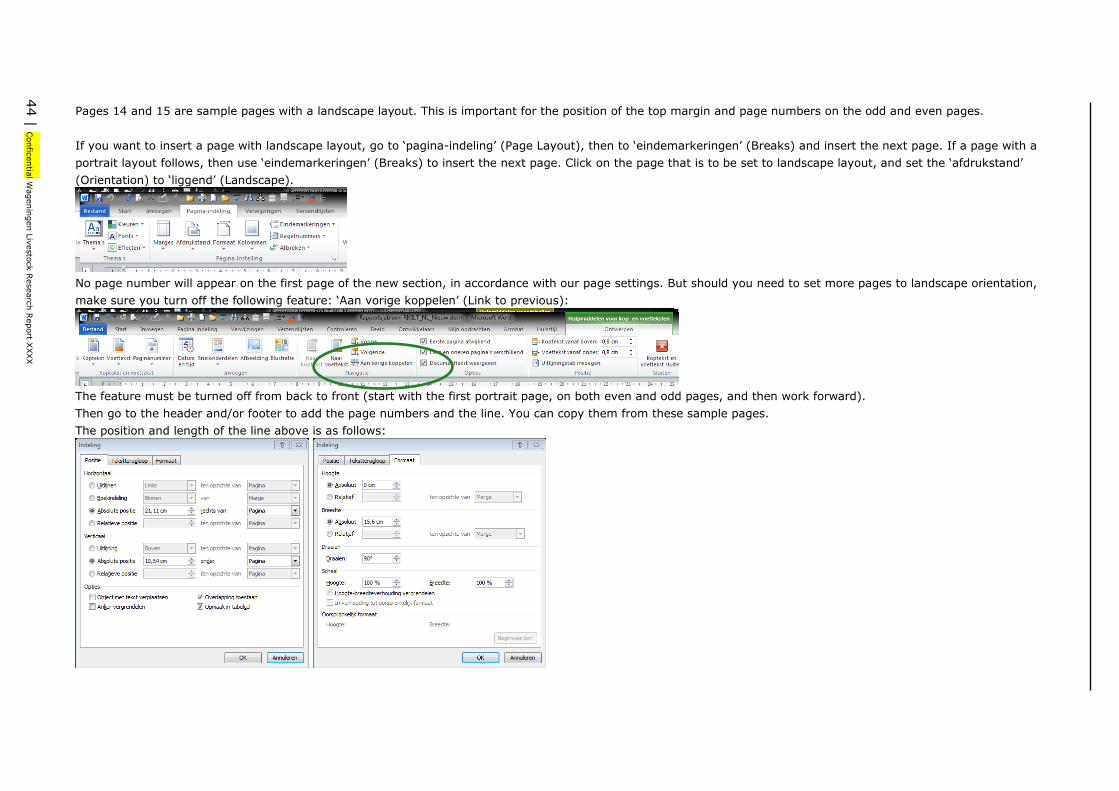
Pages 14 and 15 are sample pages with a landscape layout. This is important for the position of the top margin and page numbers on the odd and even pages. If you want to insert a page with landscape layout, go to ‘pagina-indeling’ (Page Layout), then to ‘eindemarkeringen’ (Breaks) and insert the next page. If a page with a portrait layout follows, then use ‘eindemarkeringen’ (Breaks) to insert the next page. Click on the page that is to be set to landscape layout, and set the ‘afdrukstand’ (Orientation) to ‘liggend’ (Landscape).
No page number will appear on the first page of the new section, in accordance with our page settings. But should you need to set more pages to landscape orientation, make sure you turn off the following feature: ‘Aan vorige koppelen’ (Link to previous):
The feature must be turned off from back to front (start with the first portrait page, on both even and odd pages, and then work forward). Then go to the header and/or footer to add the page numbers and the line. You can copy them from these sample pages. The position and length of the line above is as follows:
Confidential W
ageningen Livestock Resesarch R
eport XXXX | 45
The position of the page is as follows:
Wageningen Livestock Research P.O. Box 338 6700 AH Wageningen The Netherlands T +31 (0)317 48 39 53 [email protected] www.wur.nl/livestock-research Confidential Wageningen Livestock Research Report XXXX
The mission of Wageningen University & Research is “To explore the potential of nature to improve the quality of life”. Under the banner Wageningen University & Research, Wageningen University and the specialised research institutes of the Wageningen Research Foundation have joined forces in contributing to finding solutions to important questions in the domain of healthy food and living environment. With its roughly 30 branches, 5,000 employees and 10,000 students, Wageningen University & Research is one of the leading organisations in its domain. The unique Wageningen approach lies in its integrated approach to issues and the collaboration between different disciplines.