28
Water Corporation: Management of Water Pipes Western Australian Auditor General’s Report Report 1: February 2014

Water Corporation:
Management of Water Pipes
Western Australian Auditor General’s Report
Report 1: February 2014
Office of the Auditor General Western Australia7th Floor Albert Facey House 469 Wellington Street, Perth
Mail to: Perth BC, PO Box 8489 PERTH WA 6849
T: 08 6557 7500
F: 08 6557 7600
W: www.audit.wa.gov.au
National Relay Service TTY: 13 36 77 (to assist persons with hearing and voice impairment)
On request this report may be made available in an alternative format for those with visual impairment.
© 2014 Office of the Auditor General Western Australia. All rights reserved. This material may be reproduced in whole or in part provided the source is acknowledged.
VISION of the Office of the Auditor GeneralExcellence in auditing for the benefit of Western Australians
MISSION of the Office of the Auditor GeneralTo improve public sector performance and accountability by reporting independently to Parliament
ISBN: 978-1-922015-31-0
Cover photos top and middle courtesy of Water Corporation.

WESTERN AUSTRALIAN AUDITOR GENERAL’S REPORT
Water Corporation: Management of Water Pipes
Report 1February 2014

THE PRESIDENT THE SPEAKERLEGISLATIVE COUNCIL LEGISLATIVE ASSEMBLY
WATER CORPORATION: MANAGEMENT OF WATER PIPES
This report has been prepared for submission to Parliament under the provisions of section 25 of the Auditor General Act 2006.
Performance audits are an integral part of the overall audit program. They seek to provide Parliament with assessments of the effectiveness and efficiency of public sector programs and activities, and identify opportunities for improved performance.
The information provided through this approach will, I am sure, assist Parliament in better evaluating agency performance and enhance parliamentary decision-making to the benefit of all Western Australians.
COLIN MURPHYAUDITOR GENERAL19 February 2014

Water Corporation: Management of Water Pipes I 3
ContentsAuditor General’s Overview ...............................................................................4Executive summary ...........................................................................................5
Background .................................................................................................................... 5
Audit conclusion ............................................................................................................ 6
Key findings .................................................................................................................... 6
Recommendations ........................................................................................................ 8
Response from Water Corporation ................................................................................ 9
Audit focus and scope ....................................................................................10The pipe network’s overall rate of leaks and bursts is low though the rate varies across the state .......................................................................11
Water Corporation uses a range of different types of pipes in its water supply network ...................................................................................................11
Overall, pipes have performed well but the frequency of bursts and leaks is considerably higher in country regions .................................................... 12
Water loss from undetected leakage is not considered in pipe replacement decisions ............................................................................15
Undetected leakage from pipes accounts for most of the recoverable water loss from the water supply network .................................................................... 15
Water Corporation has a leak detection program in place to reduce leakage from pipes .......................................................................................... 15
Undetected leakage is not a performance indicator used in pipe replacement planning .......................................................................................... 16
The risk based approach to pipe replacement helps manage future costs but is reliant on good information ................................................17
The cost of replacing the ageing network of pipes is significant and growing .............. 17
Using asset, condition and performance information to target pipe replacement reduces the risk of under or over investment ................................. 19
The effectiveness of Water Corporation’s pipe assessment and replacement relies on accurate and accessible information ........................................ 20
Gaps in asset and performance information reduces the reliability of pipe replacement decisions ........................................................................21
The age of some older pipes is uncertain because they cannot be easily checked back to their original records .......................................................................... 21
Information about the location and cause of leaks and bursts is not complete because it is not gathered effectively .......................................................... 21
Age, condition and performance information is not well linked in IT systems making some information difficult to access ............................................. 23
Water Corporation recognises the need to improve some of its asset information but needs to review its key information gaps ................................... 23

4 I Western Australian Auditor General
Auditor General’s OverviewWater is a precious resource, particularly in a state like ours. Traditional sources of supply have become less reliable while demand has grown. Managing and using water in a sustainable way is a shared responsibility and in all of our interests. Doing so will also help keep down the costs of water to both government and consumers.
A key part of meeting that challenge is to ensure that the network of pipes and equipment that transport water from source to consumer are well managed. The water supply network is a critical asset with a replacement value in the region of $11 billion, over a third of the value of the Water Corporation’s total asset base. Overall it has performed relatively well in terms of the incidence of leaks and bursts, and has not required major replacement expenditure to maintain that performance.
The network is ageing, however, and increasing levels of investment will be needed to maintain its performance. Without an effective approach to planning that investment, there is a risk that Water Corporation may either under or over invest, with consequences for both customers and government in terms of levels of service and costs. Water Corporation is implementing a risk based approach to targeting its spending on pipe replacement which should help it avoid under or over investment. This approach relies on having robust and accessible information, and there is room for Water Corporation to improve in that area.
Every water supply network will experience water loss. Internationally accepted benchmarks provide guidance about what minimum levels of water loss are achievable. Current levels of water loss are about 10 billion litres more than the benchmark. This should not diminish the community’s commitment to reducing its water usage, but reinforces the need for Water Corporation to continue and strengthen is efforts to reduce loss and ensure water supply is sustainable into the future.
Water Corporation: Management of Water Pipes I 5
Executive summaryBackgroundThe Water Corporation is a Government Trading Enterprise (GTE) established in 1995. In 2012-13, the Water Corporation supplied 357.39 billion litres of drinking water across Western Australia. It operates and maintains a network of water, wastewater and drainage services that include dams and weirs, licensed bore fields and desalination plants. At June 2013, the total asset base had a replacement value of $31.6 billion.
As a GTE, the Water Corporation acts on commercial principles to make a profit consistent with maximising its long term value. However, it is solely owned by and provides annual dividend payments to the State Government.
The Water Corporation supplies water through a water services operating licence (licence). The Economic Regulation Authority is the independent regulator and administers licences under the Water Services Act 2012.
Water supply use and service charges to customers are set by the State Government each year. Charges are applied uniformly across the state regardless of the cost of supply. Some customers receive concessions on standard charges. These include pensioners, charitable bodies and local authorities for example. Where charges do not recover costs the Water Corporation can seek subsidy payments from the State Government. The Government has a policy of providing uniform prices across the state for the first 300 000 litres per residential service per annum.
The Water Corporation manages over 34 000 kilometres of water supply pipes across the state. Over half of these pipes are reticulation pipes generally located below ground. The remaining pipes are trunk and distribution mains which are above ground in country regions and below ground in the metropolitan area.
The rate of leaks and bursts and the amount of water lost are key measures of the performance and efficiency of pipes. Leaks and bursts are measured per 100 kilometres of pipe and water lost is measured in litres.
Water lost in a supply system affects the sustainability of supply, reduces revenue, and can undermine broader water saving initiatives. In 2012-13, the Water Corporation supplied over 357 billion litres of water, of which almost 314 billion litres was metered consumption. The difference of over 43 billion litres, or 12 per cent of total water supplied, was made up of almost 30 billion litres that was physically lost, and over 13 billion litres that was consumed but not billed for.
The 13 billion litres of water that was consumed but not billed for was made up of metering errors or customer meter inaccuracies accounting for 84 per cent; unbilled but authorised consumption (for example for firefighting use) accounting for 13 per cent; and unauthorised consumption (for instance theft) accounting for three per cent.
Water loss cannot be eliminated from any supply system but can be minimised. The Water Corporation has used an internationally accepted industry standard to estimate that just over 19 billion litres a year would be the minimum loss achievable based on the current size and configuration of its network.
The Water Corporation repairs trunk and distribution mains based on the results of regular inspections or when there are reported leaks and bursts. However, because reticulation pipes are below ground and cannot be easily or cost effectively inspected, they are generally repaired only when there are reported leaks and bursts. The Water Corporation will replace reticulation

6 I Western Australian Auditor General
pipes and trunk and distribution mains before failure or the end of the standard economic life if their age, condition and performance indicate an increasing likelihood and consequence of failure.
This audit assessed if Water Corporation’s management of bursts, leaks and water loss from its water supply pipes contributes to sustainable water supply.
Audit conclusion Water Corporation’s network of water supply pipes has generally performed well to date. Although performance is variable in different parts of the state, the overall rate of leaks and bursts has been low. The Water Corporation has maintained the water pipe network by replacing pipes as they fail. Consequently, the cost of replacing water pipes has also been low, $9 million in 2009-10. The water pipe network is ageing and as a result, pipe replacement costs will rise significantly to an estimated $41.5 million per year from 2013-14 to 2018-19, with further increases from 2020.
To allow it to better manage the network as it ages, the Water Corporation has recently adopted a risk based approach to replacing pipes, targeting the ones most likely to fail. Replacing all pipes only when they fail would risk under investment and increasing levels of pipe failures. Alternatively, replacing all pipes when they reach the end of their standard economic life regardless of their condition or performance could result in over investment. Under a risk based approach, the estimated cost of pipe replacement over the next 10 years is $318 million compared to $421.5 million based purely on the standard economic life of pipes.
A risk based approach to pipe replacement is sensible, but the Water Corporation will need to ensure it is robust. The approach relies on accurate and complete asset, condition and performance information. Currently, there are gaps in the Water Corporation’s information that need to be addressed to ensure pipe replacement decisions are fully informed.
Water loss is a risk for the Water Corporation because it affects the sustainability of supply, reduces revenue, and can diminish its credibility as an advocate of water saving amongst its customers. Water loss in 2012-13 was around 10 billion litres above the Water Corporation’s benchmark for minimum loss, and included seven to eight billion litres of undetected leakage from pipes. The Water Corporation has a leak detection program which has prevented 3.4 billion litres of leakage in the last three years. However, it is not considering undetected leakage in prioritising pipe replacement. This is a gap in replacement planning, and resolving it would strengthen efforts to reduce water loss.
Key findings• The overall rate of leaks and bursts on Water Corporation’s pipes has been within its
previous licence requirements and low compared with similar sized water utilities in other states. Until November 2013 the Water Corporation’s licence required that the overall rate of leaks and bursts be below 20 per 100 kilometres of water pipe annually. The Water Corporation has met this target since 2008 and since 2010 the rate has been below 18 per 100 kilometres. This rate is low compared with similar sized water utilities in other states. The highest rate among similar utilities was 40 per 100 kilometres in 2011-12.
• The rate of leaks and bursts is worse in country regions than in the metropolitan area. Country regions have had an annual leak and burst rate of 21 per 100 kilometres since 2010 compared to fewer than 13 in the metropolitan area. This gap between country regions and the metropolitan area is expected to continue for at least the next 20 years.

Water Corporation: Management of Water Pipes I 7
• The amount of water lost through the Water Corporation’s supply system is high compared to similar sized water utilities in other states. In 2011-12, Western Australia lost about 90 litres of water per service connection per day, compared with similar sized utilities which ranged from 50 to 96 litres per service connection per day. Water loss in the supply system affects the sustainability of supply, reduces revenue, and can undermine broader water saving initiatives. In 2012-13, the Water Corporation estimated that about 43 billion litres (12 per cent) of water was lost across the supply system. This includes over 13 billion litres that was not physically lost, but was unbilled usage. Almost 30 billion litres (eight per cent), however, was real water loss.
• While water loss cannot be eliminated from any supply system, it can be minimised. Current levels are just over 10 billion litres a year above the Water Corporation’s benchmark for minimum loss of 19 billion litres. The Water Corporation considers the 10 billion litres to be recoverable, and about seven to eight billion litres of this is undetected leakage from pipes.
• The Water Corporation is pursuing initiatives, such as its leak detection program to reduce water loss. In the three years from 2010-11 to 2012-13, the leak detection program prevented 3.4 billion litres of leakage. Pipe replacement can also help to reduce undetected leakage but it is not included as a factor in Water Corporation’s pipe replacement planning and investment. This lessens the effectiveness of efforts to reduce water loss.
• The overall low level of leaks and bursts in the network has meant that the costs of pipe replacement have also been low as pipes were replaced only when they failed. In 2009-10, the Water Corporation spent $9 million on pipe replacement. However, the pipe network is ageing and this will increase the cost of replacement. Between 2009-10 and 2012-13 an average of $17.25 million a year was invested but this will increase to $41.5 million a year on average between 2013-14 and 2018-19.
• To better manage the increasing cost of pipe replacement, the Water Corporation is replacing pipes based on the risk of failure rather than replacing them only when they fail. Continuing the ‘run to fail’ approach for all pipes with an ageing network would risk under investment and increase failures. Replacing pipes based purely on standard economic life would risk over investing by replacing pipes regardless of their condition.
• The Water Corporation estimates that using the standard economic life approach to pipe replacement would cost $421.5 million between 2010 and 2019, $103 million more than their risk based approach. Between 2020 and 2049 the economic life approach would also see replacement costs climb to a total of $3.4 billion or an average of $107 million per year. This would involve replacing about 16 000 kilometres of pipe, or 47 per cent of the total pipe network.
• The risk based approach to pipe replacement relies on accurate and accessible information to identify pipes with the highest likelihood and consequence of failure. However, there are gaps in some of the information needed to ensure fully informed decisions. The age of some older pipes cannot be easily verified and information about where leaks and bursts have occurred and what caused them is not being effectively gathered. Also, connectivity between the different IT systems that hold age, condition and performance information is poor, making access and use of the information difficult.
8 I Western Australian Auditor General
Recommendations The Water Corporation should by late 2014:
• include undetected leakage from pipes as a factor in its pipe replacement planning and investment decisions
• take a risk based approach to ensure pipe references to original construction drawings and survey field books are contained in its spatial information system
• review how information on leaks and bursts and from its leak detection program could be better linked across its IT systems
• make gathering information about the location of leaks and bursts mandatory and regularly check to see that it is being gathered
• review how information and learning about larger incidents of leaks and bursts could be better captured and disseminated to ensure lessons are learnt and resulting actions are followed up.

Response from Water Corporation Water Corporation thanks the Office of the Auditor General (OAG) for its time and due diligence in compiling this report and the recommendations they have provided.
The Corporation is pleased to note that the OAG has acknowledged that despite a number of high profile pipe breaks in the metropolitan area in 2013, the Corporation’s rate of leaks and breaks has been the lowest, of the ten water utilities of its size, in Australia.
The OAG has also outlined the Corporation’s risk based approach to pipe replacement as sensible, as it is more cost effective and targeted than simply replacing pipes when they fail or when they have reached the end of their standard economic life.
While this process has been praised in its approach, the OAG has highlighted that its success relies on access to relevant and robust information, which is an area the Corporation could improve. As noted by the OAG, the Corporation has identified data improvement as a high priority in its latest strategic asset management plan and is working toward improvements that will be implemented over time and in line with the OAG’s recommendations.
A number of factors are taken into consideration when assessing pipe replacement – whether the need is immediate or longer term; is based on the performance and overall condition of the pipe; customer interruption and service levels; and the cost of actual repair and restoration works. The Corporation accepts the OAG’s recommendation to formalise consideration of undetected leakage as part of asset replacement processes.
While unaccounted for water cannot be eliminated from any supply system, the Corporation takes this matter seriously and is working hard to reduce this amount. A targeted program to find and repair undetected leakage from pipes has been implemented, and has saved 3.4 billion litres of water in the last 3 years. The Corporation believes this, combined with other directly targeted programs, will reduce unaccounted for water more quickly than pipe replacement as it is implemented over a much greater area of the network, in a much shorter time frame.
Pipe replacement however does play an important role in maintaining assets and the Corporation has increased its investment in water pipe replacement from $9 million in 2009 to $44 million each year from 2014-15 through to 2018-19. The water supply system has always met its Operating Licence performance targets and will only improve with the outlined increase in funding, improved data integrity, targeted water recovery initiatives and other activities that will address recommendations outlined by the OAG.
Water Corporation: Management of Water Pipes I 9

10 I Western Australian Auditor General
Audit focus and scope This audit assessed if Water Corporation’s management of bursts, leaks and water loss from its pipes contributes to sustainable water supply. We had three main questions:
• Does the Water Corporation understand the age, condition and performance of its pipes?
• Does the Water Corporation learn lessons from leaks, bursts and water loss to manage future risks to its pipes?
• Does the Water Corporation appropriately target the maintenance and renewal of its pipes to manage the risk of leaks, bursts and water loss?
Our audit focused on Water Corporation’s management of its pipes. It examined how it used the asset, condition and performance information it has to manage future risks of leaks, bursts and water loss from pipes. We met with Water Corporation’s key regulators and stakeholders; Economic Regulation Authority, Department of Water and Department of Health. The Public Utilities Office was also consulted.
We focused on the Water Corporation’s management of undetected leakage from water supply pipes. We did not review Water Corporation’s management of the unbilled water ‘loss’ or the lowest ‘loss’ technically achievable from the water supply system. We also did not review undetected water loss from service reservoirs and service connections because this is unrelated to pipes. The Water Corporation’s management of wastewater pipes, drainage services, desalination plants and water supply charges were also ‘out of scope’.
The audit was conducted in accordance with Australian Auditing and Assurance Standards.

Water Corporation: Management of Water Pipes I 11
The pipe network’s overall rate of leaks and bursts is low, though the rate varies across the stateWater Corporation uses a range of different types of pipes in its water supply network Pipes are an integral part of Water Corporation’s operational assets. It manages over 34 000 kilometres of pipes that supply 992 170 properties in six regions across the state (Figure 1). Of the 992 170 properties supplied across the state, 80 per cent are in the metropolitan area and 20 per cent in country regions. These pipes and associated assets have a value of $11.72 billion.
Figure 1: Map of Water Corporation water and wastewater schemesSource: Water Corporation

12 I Western Australian Auditor General
The Water Corporation uses a range of different pipes in its water supply network. The key ones are:
• trunk mains – generally larger than 500 millimetres in diameter and carry high water flows and transport water from the source to large storages or other sources
• distribution mains – generally larger than 250 millimetres in diameter in the metropolitan area but may be smaller in country regions and carry water from storages to reticulation pipes
• water reticulation pipes – smaller than trunk or distribution mains and carry water to customers
• farmlands reticulation pipes – these are similar to water reticulation pipes and carry water to farmland services.
Trunk and distribution mains are generally located above ground in country regions and below ground in the metropolitan area. Reticulation pipes are located below ground and account for over half of all pipes. The pipes in the water supply network are made from a range of different construction materials. The key types are asbestos cement which account for 31 per cent of all mains and pipes, polyvinyl chloride at 24 per cent, steel at 17 per cent, cast iron at nine per cent and reinforced concrete at seven per cent.
The standard economic life of pipes varies from 30 to 110 years depending on their construction material and size. For reticulation pipes, the standard economic life ranges from 80 to 110 years. Less than one per cent of pipes have a standard economic life as short as 30 years. The replacement value of the pipe network is $11.7 billion (Table 1).
Area Main type Length (kilometres) Replacement value ($ million)
Metropolitan Reticulation 12 335 3 263Trunk and distribution 2 167 2 070
Country
Urban reticulation 5 581 1 610Farmlands reticulation 7 962 1 162Trunk 956 1 216Distribution 5 033 2 403
Total 34 034 11 724
Table 1: Location, type, length and replacement value of water pipes managed by the Water Corporation at January 2013
Overall, pipes have performed well but the frequency of bursts and leaks is considerably higher in country regions The Water Corporation have generally performed well against its previous licence target for leaks and bursts. Since 2010, the average statewide rate of leaks and bursts has been just under 18 per 100 kilometres per year (Figure 2).
Leaks and bursts are an important indicator of the condition and performance of pipes. The Water Corporation’s previous licence included a performance standard to maintain the statewide leak and burst rate below 20 per 100 kilometres of pipe. This standard was not included in the current licence which came into effect in November 2013 following the commencement of the Water Services Act 2012.
Water Corporation: Management of Water Pipes I 13
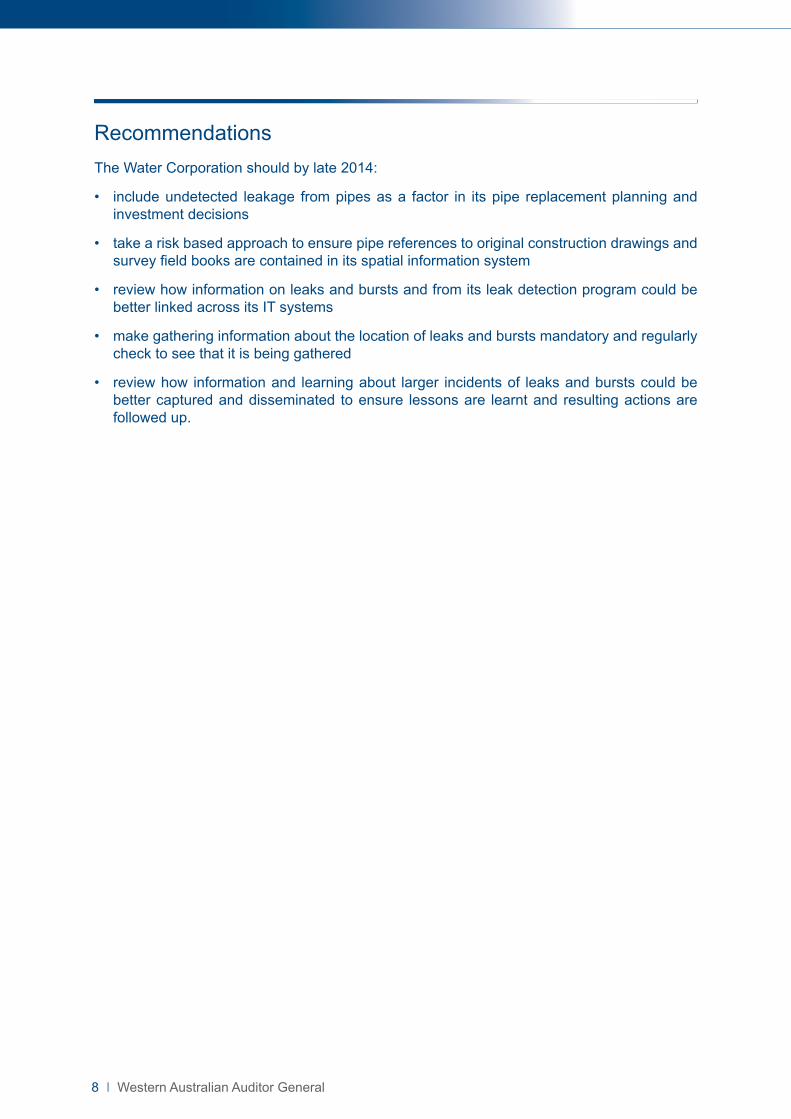
Although the Water Corporation has recently experienced a number of high profile pipe bursts in the metropolitan area, its rate of leaks and bursts has been the lowest amongst the 10 water utilities across Australia that serviced more than 100 000 connected properties in 2011-12. The highest rate among similar sized utilities was 40 per 100 kilometres in 2011-12.
10 000
8 000
6 000
4 000
2 000
0
Jun-
08
Sep
-08
Dec
-08
Mar
-09
Jun-
09
Sep
-09
Dec
-09
Mar
-10
Jun-
10
Sep
-10
Dec
-10
Mar
-11
Jun-
11
Sep
-11
Dec
-11
Mar
-12
Jun-
12
Sep
-12
Dec
-12
Mar
-13
Jun-
13
Target
Rolling year
17.6
State-wide performance17.3
5 734 5 930 6 268 6 0375 439
5 859
Leaks and bursts performance – statewideN
umbe
r of e
vent
s
25
20
15
10
5
0
Num
ber o
f lea
ks a
nd b
urst
s pe
r 100
km
Figure 2: Statewide leaks and bursts from June 2008 to June 2013
In the metropolitan area leaks and bursts have been well below the overall average statewide performance (Figure 3).
Figure 3: Metropolitan leaks and bursts from June 2008 to June 2013
10 000
8 000
6 000
4 000
2 000
0
Jun-
08
Sep
-08
Dec
-08
Mar
-09
Jun-
09
Sep
-09
Dec
-09
Mar
-10
Jun-
10
Sep
-10
Dec
-10
Mar
-11
Jun-
11
Sep
-11
Dec
-11
Mar
-12
Jun-
12
Sep
-12
Dec
-12
Mar
-13
Jun-
13
13.9
12.8
1 770 1 971 1 737 1 676 1 728 1 861
Leaks and bursts performance – metropolitan
Num
ber o
f eve
nts
25
20
15
10
5
0
Num
ber o
f lea
ks a
nd b
urst
s pe
r 100
kmTarget
Metropolitan performance
Rolling year
Source: Water Corporation
Source: Water Corporation
Month
Month
14 I Western Australian Auditor General
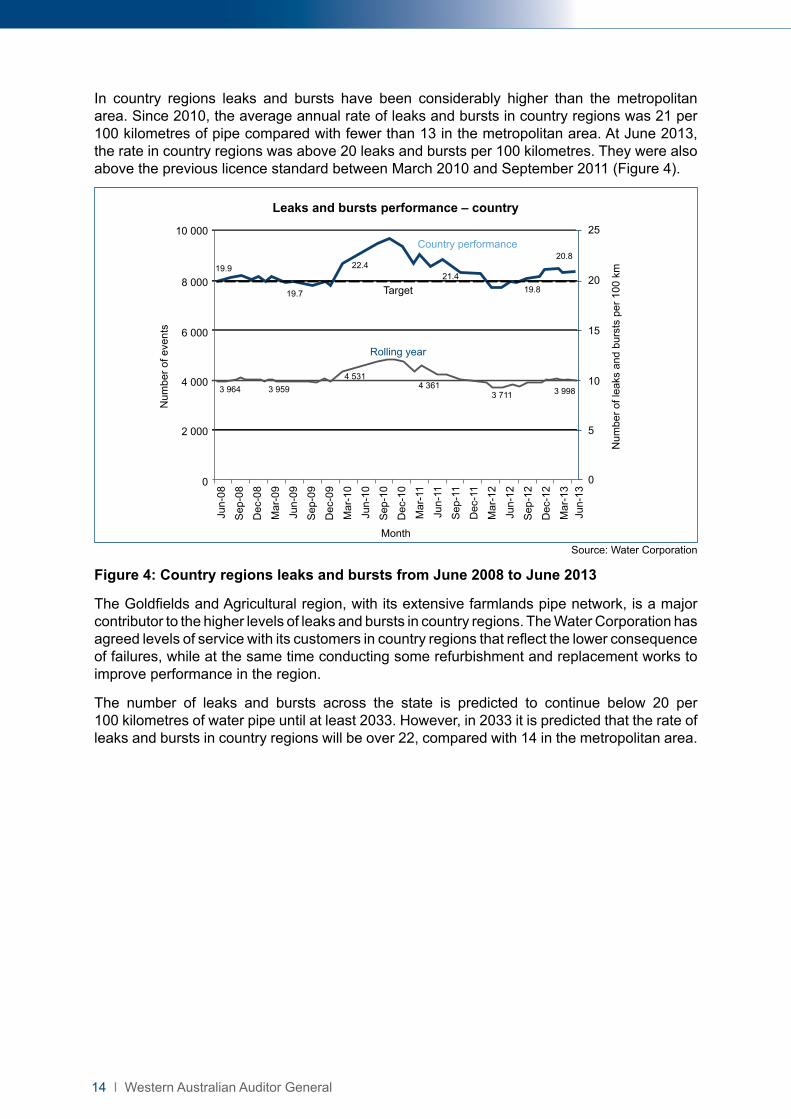
In country regions leaks and bursts have been considerably higher than the metropolitan area. Since 2010, the average annual rate of leaks and bursts in country regions was 21 per 100 kilometres of pipe compared with fewer than 13 in the metropolitan area. At June 2013, the rate in country regions was above 20 leaks and bursts per 100 kilometres. They were also above the previous licence standard between March 2010 and September 2011 (Figure 4).
10 000
8 000
6 000
4 000
2 000
0
Jun-
08
Sep
-08
Dec
-08
Mar
-09
Jun-
09
Sep
-09
Dec
-09
Mar
-10
Jun-
10
Sep
-10
Dec
-10
Mar
-11
Jun-
11
Sep
-11
Dec
-11
Mar
-12
Jun-
12
Sep
-12
Dec
-12
Mar
-13
Jun-
13
Target
Rolling year
Country performance20.8
3 964
19.8
Leaks and bursts performance – country
Num
ber o
f eve
nts
25
20
15
10
5
0
3 9594 531
4 3613 711 3 998
21.422.4
19.7
19.9
Num
ber o
f lea
ks a
nd b
urst
s pe
r 100
km
Figure 4: Country regions leaks and bursts from June 2008 to June 2013
The Goldfields and Agricultural region, with its extensive farmlands pipe network, is a major contributor to the higher levels of leaks and bursts in country regions. The Water Corporation has agreed levels of service with its customers in country regions that reflect the lower consequence of failures, while at the same time conducting some refurbishment and replacement works to improve performance in the region.
The number of leaks and bursts across the state is predicted to continue below 20 per 100 kilometres of water pipe until at least 2033. However, in 2033 it is predicted that the rate of leaks and bursts in country regions will be over 22, compared with 14 in the metropolitan area.
Source: Water CorporationMonth

Water Corporation: Management of Water Pipes I 15
Water loss from undetected leakage is not considered in pipe replacement decisions Undetected leakage from pipes accounts for most of the recoverable water loss from the water supply networkWater loss in the supply system affects the sustainability of supply, reduces revenue, and can undermine broader water saving initiatives. While it cannot be completely eliminated, current loss is around 10.5 billion litres above the 19 billion litres a year that Water Corporation estimates is the lowest achievable level of loss. Of the 10.5 billion litres considered recoverable, about seven to eight billion litres was undetected leakage from pipes.
In 2012-13, the Water Corporation supplied over 357 billion litres of water, of which almost 314 billion litres was metered consumption. The difference of over 43 billion litres, or 12 per cent of total water supplied, included over 13 billion litres that was used but not metered or billed for, and almost 30 billion litres (eight per cent of total supply) that was physically lost.
Western Australia experiences some of the highest water loss compared to similar sized water utilities in other states. In 2011-12, Western Australia lost about 90 litres of water per service connection per day. This is compared with water loss in the other similar sized water utilities that ranged from 50 to 96 litres per service connection per day.
Metering errors or customer meter inaccuracies accounted for just over 11 billion litres of the over 13 billion litres of water that was used but was not metered. Unbilled but authorised consumption (for example for firefighting use) accounted for almost 1.8 billion litres and unauthorised consumption (for instance theft) accounted for almost 360 million litres.
Well maintained and managed supply systems will experience some level of water loss, but it can be minimised. The Water Corporation has used an internationally accepted industry standard to estimate that the lowest volume of real loss it could achieve, given its current network, is just over 19 billion litres a year. Current performance at a loss of almost 30 billion litres is around 10.5 billion litres above that benchmark.
The Water Corporation considers the 10.5 billion litres of water to be recoverable. About seven to eight billion litres of it was undetected leakage from pipes. Most of the leakage is from reticulation pipes in the metropolitan area. Less than one billion litres is from trunk and distribution mains.
Water Corporation has a leak detection program in place to reduce leakage from pipes The Water Corporation has a targeted program to find and repair undetected leakage from pipes. Between 2010-11 and 2012-13, this program covered 7 400 kilometres of pipe (5 550 kilometres in the metropolitan area and 1 850 kilometres in country regions), made 1 286 repairs and prevented 3 430 million litres of leakage. But water loss from undetected leakage is not considered an indicator of performance and information from the leak detection program is not considered when assessing performance for its pipe replacement planning.
Locating where leakage is occurring from pipes across the entire water supply system can be difficult. Leakage from pipes can often go undetected for a long period of time for a range of reasons. The depth of the leak, sandy soil conditions, poorly compacted ground, proximity to sub-soil and stormwater drainage, density of lawns or pavements and the rate of leakage can all contribute to how visible leaks can be.

16 I Western Australian Auditor General
Undetected leaks can contribute to large volumes of water loss over time. For example, a large reported burst pipe with a water flow rate of 300 litres per minute would lose 108 000 litres if repaired after six hours. Small unreported leaks can also cause significant loss because they can be harder to detect and so go unrepaired for longer. An unreported leak with a water flow rate of five litres per minute would lose 2.6 million litres over a year if undetected.
The Water Corporation’s primary initiative to manage leakage from pipes is its leak detection program. It has run for three years and uses specialist personnel with electronic and acoustic equipment to detect leakage from reticulation pipes. The specialist personnel report information back through Water Corporation’s document management system, and where relevant, repairs are made.
Geology and the type of pipe construction materials are used to target areas for detecting leaks. Locations are prioritised where detection will either find the greatest rate of leakage or where reduction in leakage will prevent or reduce the need to establish more water sources. In combination with other initiatives like district metered areas and water pressure management, it is expected the active leak detection program will result in more leakage being prevented and reduced in the future.
The speed of the repairs made as a result of detection is an area of focus for the program. Currently, repair work is allocated to teams in the field at the end of each area surveyed. But new processes will enable the specialist personnel to issue work orders themselves immediately as they find leaks. Also, each area is surveyed and repaired as part of the program for any issues associated with the quality of repairs and any recurrence of leaks is addressed at this time.
Undetected leakage is not a performance indicator used in pipe replacement planning Undetected leakage is a key measure of the performance and efficiency of pipes. Pipe replacement is an aspect of managing water loss, along with initiatives such as leak detection, pressure management and the speed and quality of repairs. The leak detection program is gradually providing the Water Corporation with a greater understanding of where and why undetected leakage occurs. Information about the repairs of leaks and bursts found through the program is used in replacement planning, but not the broader information and intelligence about why leakage is occurring. Also, information about undetected leakage is not being used as a performance indicator in planning pipe replacement. Investment in pipe replacement and water loss management initiatives are considered separately within the Water Corporation’s investment planning processes.
The Water Corporation’s investment in pipe replacement is reviewed annually through its Strategic Investment Business Case (SIBC) process. The Water Mains State Wide Renewals SIBC sets out the recent history and current performance of pipes, business imperatives, risk analysis and a range of investment options. Information about reported leaks and bursts is included, but undetected leakage is not considered an indicator of the performance of pipes in the Water Mains State Wide Renewals SIBC. Information from the leak detection program is not considered in assessing performance for its pipe replacement planning.
Although leak detection is an ongoing program, the Water Corporation’s investment in these initiatives is reviewed annually through a separate SIBC. The Water Loss Management SIBC sets out capital investment options for a range of water loss management initiatives and activities. The key investment options include expanding district metered areas, pressure management and smart metering, but there is no linkage to, or consideration of, pipe replacement as an investment option in the Water Loss Management SIBC.

Water Corporation: Management of Water Pipes I 17
The risk based approach to pipe replacement helps manage future costs but is reliant on good information The cost of replacing the ageing network of pipes is significant and growingThe Water Corporation identifies and targets pipes for replacement based on asset, condition and performance information, and likelihood and consequence of failure. This risk based approach helps to manage the financial impact of a significant increase in the number of pipes reaching the end of their standard economic life over the coming decades.
Under its risk based approach, the Water Corporation predicts that the cost of replacing pipes between 2010 and 2019 would be $318 million. However, if pipes were replaced on the basis of standard economic life alone, then the estimated cost would be $421.5 million. Between 2020 and 2049, the economic life approach would also potentially see replacement costs climb to a total of $3.4 billion or an average of $107 million per year. This would involve replacing 16 000 kilometres of pipe, or 47 per cent of the total pipe network, across the metropolitan area and country regions.
Metropolitan pipes
The metropolitan area is facing a steep increase in the number of pipes reaching the end of their standard economic life. These pipes are predominately reticulation pipes made from steel, cast iron, reinforced concrete and asbestos cement.
The estimated cost of replacing metropolitan pipes on the basis of standard economic life is $76.5 million between 2010 and 2019. Thereafter, the cost of pipes needing to be replaced would rise significantly into the foreseeable future (Figure 5).
1000
800
600
400
200
02010-19 2020-29 2030-39 2040-49 2050-59 2060-69 2070-79 2080-89
Steel Reinforced concrete Plastic Ductile iron
Copper Cast iron Asbestos cement Others
Rep
lace
men
t cos
ts ($
mill
ion)
Source: Water Corporation
Figure 5: Standard economic life and potential replacement costs by pipe type for the metropolitan area

18 I Western Australian Auditor General
Country pipes
The estimated cost of replacing pipes on the basis of standard economic life in country regions between 2010 and 2019 is $345 million – a much higher cost than for the metropolitan area. All of the cost would be in the Goldfields and Agricultural region.
Looking further ahead, under a standard economic life approach to replacing pipes, costs are forecast to triple in the two decades commencing 2040 (Figure 6). The majority of the cost based on standard economic life would again be in the Goldfields and Agricultural region.
1400
1200
1000
800
600
400
200
02010-19 2020-29 2030-39 2040-49 2050-59 2060-69 2070-79 2080-89
Goldfields and Agricultural Great Southern Mid West
North West South West
Rep
lace
men
t cos
ts ($
mill
ion)
Regions
Source: Water Corporation
Figure 6: Standard economic life and potential replacement costs by country regions
Repair and replacement strategies vary for different types of pipes
The Water Corporation repairs trunk and distribution mains based on the results of regular inspections or when there are reported leaks and bursts. Reticulation pipes which are below ground and cannot be easily or cost effectively inspected are generally repaired only when there are reported leaks and bursts.
Water Corporation uses a risk based assessment process to determine which pipes are proactively managed. The initial risk assessment considers the consequences of failure. Where the consequences are significant, proactive condition assessment work is carried out so that replacement decisions can be made prior to pipe failures occurring. Where the consequences are low, pipes are managed reactively based around measurement of failure history, customer impact and the costs to replace.
Replacement of reticulation pipes in the metropolitan area is considered after three bursts in a 12 month period. By comparison reticulation pipes in farmland areas are usually not considered for replacement until they reach the end of their standard economic life. This is because leaks and bursts in farmland areas are unlikely to cause significant service interruption, environmental damage or a regulatory breach such as if water pressure and flow standards are below required levels.

Water Corporation: Management of Water Pipes I 19
Using asset, condition and performance information to target pipe replacement reduces the risk of under or over investment The Water Corporation’s risk based approach to pipe replacement is more targeted than replacing pipes when they fail or when they have reached the end of their standard economic life. The risk based approach lessens the likelihood of under or over investment faced by the Water Corporation’s ageing asset profile.
Using its risk based approach, Water Corporation will invest over $318 million in pipe replacement from 2009-10 to 2018-19. The Water Corporation invested $69.6 million between 2009-10 and 2012-13 (an average of $17.5 million per year) and plans a significant increase to $249.3 million between 2013-14 and 2018-19 (an average of $41.5 million per year) (Table 2).
20013-14 forecast
($ million)
2014-15 forecast
($ million)
2015-16 forecast
($ million)
2016-17 forecast
($ million)
2017-18 forecast
($ million)
2018-19 forecast
($ million)Water pipe replacement 29.3 44.0 44.0 44.0 44.0 44.0
Table 2: Water pipes forecast replacement expenditure from 2014-15 to 2018-19
The Water Corporation’s investment plans are reviewed annually. This enables it to respond to issues that may arise. For example, in June 2013, $12 million in planned pipe replacement in the Perth Central Business District (CBD) was brought forward from the 2014-15 to 2018-19 program after reticulation pipes in Wellington Street burst.
The Water Corporation believes that its planned level of investment is sufficient to manage future risks and to ensure continued performance. This is based on the pipe deterioration modelling of its decision support tools like the Linear Asset Risk Model (LARM) and the Pipeline Asset and Risk Management System (PARMS), as well as investment and risk analysis carried out as part of its SIBC process. It considers that the knowledge it has about the useful life of the different types of pipes it manages, in conjunction with information about their current condition and performance means that it can make reliable investment decisions about replacement. However, the Water Corporation continues to research the failure of assets to improve its deterioration modelling and understanding of the actual useful life of its pipes.
The Water Corporation’s replacement program was introduced in 2009-10 with $9 million allocated for pipe replacement. Expenditure on replacement prior to 2009-10 is very difficult to identify because it was not separately classified but was included under a variety of different funding lines, such as minor works and operational expenditure.
It makes economic sense and will remain appropriate for many low risk pipes to only replace them when they fail. However, maintaining the 2009-10 level of investment would not have met the increasing need for future pipe replacement based on the Water Corporation’s ageing asset profile. It would have resulted in significant under investment for higher risk parts of the network and reduced the ability to effectively plan future investment. Since then expenditure has increased to $27.5 million in 2012-13, a 205 per cent increase from 2009-10 (Table 3).
2009-10 actual ($ million)
2010-11 actual ($ million)
2011-12 actual ($ million)
2012-13 actual ($ million)
Water pipe replacement 9.0 14.6 18.5 27.5
Table 3: Water pipes actual replacement expenditure from 2009-10 to 2012-13

20 I Western Australian Auditor General
Conversely, replacing pipes at their end of the standard economic life has potentially significant estimated costs of $421.5 million between 2010 and 2019 and up to $3.4 billion between 2020 and 2049. This approach risks over investment if the pipes have not reached the end of their useful life. Useful life is affected by a range of conditions and factors and can significantly vary from standard economic life.
The effectiveness of Water Corporation’s pipe assessment and replacement relies on accurate and accessible informationThe Water Corporation’s risk based approach to pipe replacement is reliant on accurate and accessible asset, condition and performance information. Since 2009-10, the Water Corporation has used this information in a structured way to identify and target high risk pipes for condition assessment.
There is a range of important asset, condition and performance information that helps to more accurately determine the actual useful life of pipes. This includes pipe asset condition and performance information like the rate of leaks and bursts. Other related information such as the construction material of the pipes, their size and the surrounding geology and environment is also important. This broader information helps better identify the remaining useful life of pipes and enables more targeted replacement decisions than standard economic life alone (Table 4).
Example 1
In 2013, Water Corporation assessed the condition of a cast iron pipe in the Perth metropolitan area. It was installed in 1932 and had a standard economic life to 2022. The 81 year old pipe was assessed to be near its original condition. It was assessed to have in excess of 20 years remaining life. Its replacement was deferred.
Example 2
In 2013, Water Corporation assessed the condition of an asbestos cement trunk main in the North West region. It was installed in 1977 and had a standard economic life to 2057. The surrounding environment had aged the pipe prematurely and increased the rate of leaks and bursts. It was assessed as no longer fit for service at 36 years old. Its replacement was accelerated.
Table 4: Illustrative examples of the impact of other factors on the useful life of water pipes
The Water Corporation has structured decision support tools that use this broader information to identify and target its condition assessment on those pipes with the highest likelihood and consequence of failure. These industry-based computer software tools are the LARM which is focused on metropolitan trunk and distribution mains and the PARMS which is focused on reticulation pipes.
LARM and PARMS have been used to provide a consistent methodology for prioritising pipes for risk assessment and, if appropriate, condition assessment. The Water Corporation commissioned independent analysis as part of the development of PARMS to predict the deterioration of individual pipe performance over time. The analysis produced a model that uses failure history and other pipe characteristics such as length, diameter, construction material and location for example. This supports determining the cost benefit of condition assessment, maintenance and replacement and provides a method to track changes in risk over time for replacement forecasting.
The LARM tool uses a range of information to better assess future risks. This includes location, diameter, asset age, construction material, failures and faults, soil condition, surrounding environment and location from other infrastructural assets and the cost of repair. This information is used to create a risk matrix which scores trunk and distribution mains on a risk level to provide a range of investment scenarios over time.

Water Corporation: Management of Water Pipes I 21
Gaps in asset and performance information reduces the reliability of pipe replacement decisions The age of some older pipes is uncertain because they cannot be easily checked back to their original recordsA quarter of all records of pipes in the Water Corporation’s spatial information system lack references to original records, making any verification of their age difficult and time consuming. The lack of accurate information of this sort has affected the reliability of the Water Corporation’s risk based approach to pipe replacement.
In April 2013, a cast iron pipe in Wellington Street in the Perth CBD burst three times in one week. Investigations found the pipe installation date recorded in the Water Corporation’s spatial information system was incorrect. The Facilities Mapping System (FMS) is the Water Corporation’s primary source of information about the age of pipes. The installation date for the burst pipe recorded in FMS was 1946. However, investigation after the burst in April 2013 revealed that 1946 was the year that the pipe was refurbished with cement lining. The original installation date was between 1889 and 1906.
There are 41.2 kilometres of cast iron water pipes in the Perth CBD. A data quality review triggered by the Wellington Street incidents found these pipes were in excess of 100 years old rather than the 60 to 70 year range recorded in the FMS. The Water Corporation has since verified the age information for all cast iron pipes in the Perth CBD and now plans to undertake data quality reviews for similar aged pipes in Fremantle, Guildford, Northbridge and Victoria Park.
The data quality review carried out by the Water Corporation as part of investigations after the Wellington Street incidents involved verifying the age of pipes by checking back to the original pipe construction drawings and survey field books. Reference numbers to the original drawings and field books are contained in FMS. But not all ‘pipe object’ records have reference numbers. Twenty-five per cent of 130 015 pipe object records in FMS do not have drawings or field book reference numbers. Almost one third of these records were in the Goldfields and Agricultural region. Eighty-six per cent relate to reticulation pipes across the state.
Verifying the age of pipes that do not have references in FMS to construction drawings and survey field books make determining the age of pipes difficult and time consuming.
Information about the location and cause of leaks and bursts is not complete because it is not gathered effectively Information is not gathered effectively about the specific location of leaks and bursts or the cause of larger leaks and bursts. This limits the analysis that can be done to identify trends or risks in other locations.
Field teams responding to leaks and bursts can record in the Water Corporation’s asset and operational management system where on the pipe the leak or burst occurred. The location is automatically recorded using mobile technology. This information is important in assessing pipe condition and where relevant prioritising pipes for replacement. But recording the location is not mandatory. Also, there are limitations with some older mobile technology used in the field including their battery life, which inhibit the ability to automatically record the location of leaks and bursts. The older mobile technology is being updated.
22 I Western Australian Auditor General
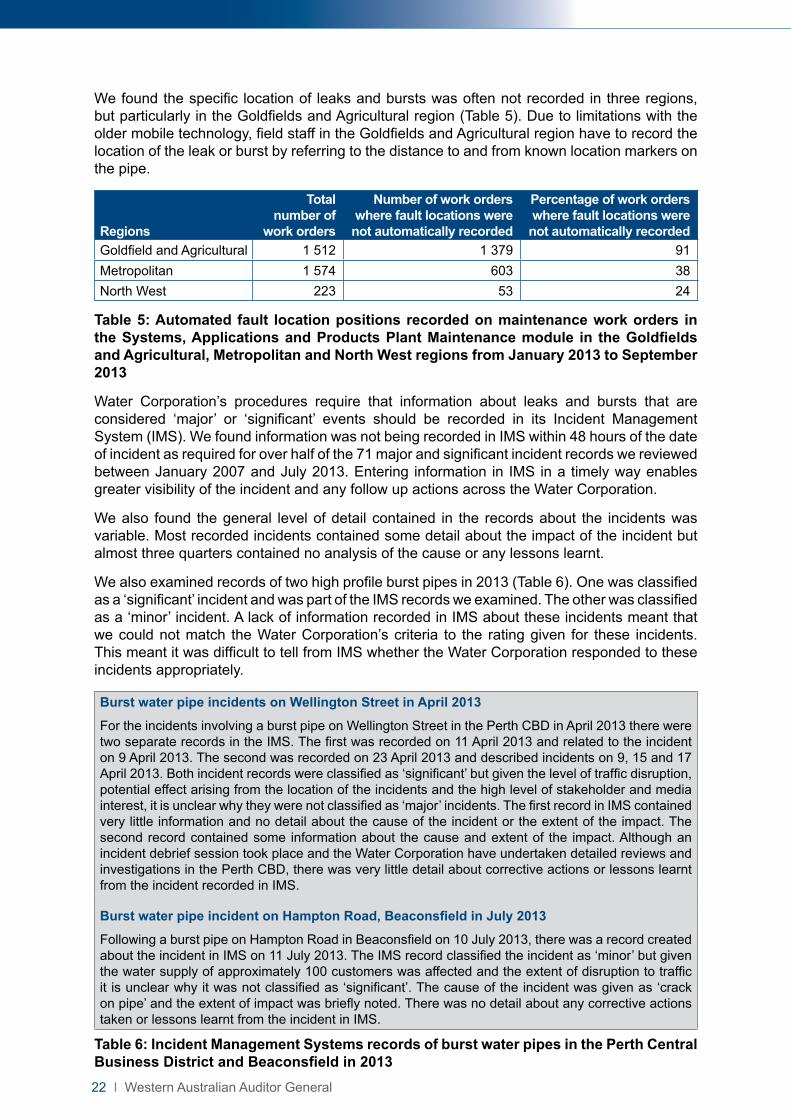
We found the specific location of leaks and bursts was often not recorded in three regions, but particularly in the Goldfields and Agricultural region (Table 5). Due to limitations with the older mobile technology, field staff in the Goldfields and Agricultural region have to record the location of the leak or burst by referring to the distance to and from known location markers on the pipe.
Regions
Total number of
work orders
Number of work orders where fault locations were not automatically recorded
Percentage of work orders where fault locations were not automatically recorded
Goldfield and Agricultural 1 512 1 379 91Metropolitan 1 574 603 38North West 223 53 24
Table 5: Automated fault location positions recorded on maintenance work orders in the Systems, Applications and Products Plant Maintenance module in the Goldfields and Agricultural, Metropolitan and North West regions from January 2013 to September 2013
Water Corporation’s procedures require that information about leaks and bursts that are considered ‘major’ or ‘significant’ events should be recorded in its Incident Management System (IMS). We found information was not being recorded in IMS within 48 hours of the date of incident as required for over half of the 71 major and significant incident records we reviewed between January 2007 and July 2013. Entering information in IMS in a timely way enables greater visibility of the incident and any follow up actions across the Water Corporation.
We also found the general level of detail contained in the records about the incidents was variable. Most recorded incidents contained some detail about the impact of the incident but almost three quarters contained no analysis of the cause or any lessons learnt.
We also examined records of two high profile burst pipes in 2013 (Table 6). One was classified as a ‘significant’ incident and was part of the IMS records we examined. The other was classified as a ‘minor’ incident. A lack of information recorded in IMS about these incidents meant that we could not match the Water Corporation’s criteria to the rating given for these incidents. This meant it was difficult to tell from IMS whether the Water Corporation responded to these incidents appropriately.
Burst water pipe incidents on Wellington Street in April 2013
For the incidents involving a burst pipe on Wellington Street in the Perth CBD in April 2013 there were two separate records in the IMS. The first was recorded on 11 April 2013 and related to the incident on 9 April 2013. The second was recorded on 23 April 2013 and described incidents on 9, 15 and 17 April 2013. Both incident records were classified as ‘significant’ but given the level of traffic disruption, potential effect arising from the location of the incidents and the high level of stakeholder and media interest, it is unclear why they were not classified as ‘major’ incidents. The first record in IMS contained very little information and no detail about the cause of the incident or the extent of the impact. The second record contained some information about the cause and extent of the impact. Although an incident debrief session took place and the Water Corporation have undertaken detailed reviews and investigations in the Perth CBD, there was very little detail about corrective actions or lessons learnt from the incident recorded in IMS.
Burst water pipe incident on Hampton Road, Beaconsfield in July 2013
Following a burst pipe on Hampton Road in Beaconsfield on 10 July 2013, there was a record created about the incident in IMS on 11 July 2013. The IMS record classified the incident as ‘minor’ but given the water supply of approximately 100 customers was affected and the extent of disruption to traffic it is unclear why it was not classified as ‘significant’. The cause of the incident was given as ‘crack on pipe’ and the extent of impact was briefly noted. There was no detail about any corrective actions taken or lessons learnt from the incident in IMS.
Table 6: Incident Management Systems records of burst water pipes in the Perth Central Business District and Beaconsfield in 2013
Water Corporation: Management of Water Pipes I 23
Age, condition and performance information is not well linked in IT systems making some information difficult to access There is a lack of connectivity between important asset, condition and performance information within the Water Corporation’s key systems. Although information within each system can be used to manually link data, tracing the required data is time consuming and risks introducing inaccuracies.
Information about the location of leaks and bursts in Systems, Applications and Products Plant Maintenance (SAP PM) is not automatically linked to spatial information in FMS or incident information in IMS. The specific location of a leak or burst on a pipe contained in work orders in the SAP PM module is not recorded or automatically linked against the location of the relevant pipe record in FMS. Because there is no automated link between these systems, identifying the specific location of leaks and bursts on pipe objects in FMS is time consuming. It is also potentially inaccurate as it requires manually plotting the information in SAP PM to records in FMS.
There is also no connectivity between information about leaks and bursts in SAP PM and information about leaks and bursts when they become larger incidents recorded in IMS. Any incident recorded in IMS and required maintenance work orders are generated and recorded separately in SAP PM.
Other important condition or performance information about pipes in the Water Corporation’s document management system is not automatically linked to FMS or SAP PM. The physical condition of assets is stored in the Asset Condition Assessment (ACA) system. When issues about the condition of pipes are identified and are not resolved through repairs, reports may be prepared through the ACA system. This information is generally stored in the document management system. Information about leakage is in reports prepared by leak detection personnel and also stored in the document management system. Having no connectivity between these systems means accessing the appropriate condition and performance information about pipes can be time consuming and could contribute to errors.
Water Corporation recognises the need to improve some of its asset information but needs to review its key information gapsThe Water Corporation recognises the unreliability of some of its information about water pipes especially for older pipes. It acknowledges a need to improve the quality of its asset information about the location of leaks and bursts. But it is not clear that the key information gaps identified in this report will be specifically addressed in the Water Corporation’s current improvement initiatives.
The Water Corporation’s Strategic Asset Management Plan 2012-13 to 2032-33 identifies improving data quality as a high priority. Water Corporation’s Data Improvement Plan Business Case For Asset Renewals identifies data gaps and a range of improvement initiatives important for replacement planning and investment.
The Water Corporation has a number of initiatives to improve the accuracy of its information. It has recently begun an asset data review to address data quality issues across a range of its areas including asset management. This work needs to specifically review the completeness and linking of important pipe age, condition and performance information across its key IT systems and how this information could be better captured, accessed and disseminated.

Western Australian Auditor General’s Reports
REPORT NUMBER 2013 REPORTS DATE
TABLED18 Managing the Impact of Plant and Animal Pests: A State-wide Challenge 12 December 2013
17 Western Power’s Management of its Wood Pole Assets 20 November 2013
16 Opinions on Ministerial Notifications 13 November 2013
15 Audit Results Report – Annual 2012-13 Assurance Audits 13 November 2013
14 Public Trustee: Administration of the Financial Affairs of Vulnerable People 18 September 2013
13 Sustainable Funding and Contracting with the Not-For-Profit Sector – Component I 18 September 2013
12 The Banksia Hill Detention Centre Redevelopment Project 7 August 2013
11 Information Systems Audit Report 27 June 2013
10 Supply and Sale of Western Australia's Native Forest Products 26 June 2013
9 Administration of the Patient Assisted Travel Scheme 26 June 2013
8 Follow-up Performance Audit of Behind the Evidence: Forensic Services 19 June 2013
7 Fraud Prevention and Detection in the Public Sector 19 June 2013
6 Records Management in the Public Sector 19 June 2013
5 Delivering Western Australia's Ambulance Services 12 June 2013
4
Audit Results Report – Annual Assurance Audits: Universities and state training providers and Other audits completed since 29 October 2012 – and Across Government Benchmarking Audits: Recording, custody and disposal of portable and attractive assets and Control of funds held for specific purposes
15 May 2013
3 Management of Injured Workers in the Public Sector 8 May 2013
2 Follow-on Performance Audit to ‘Room to Move: Improving the Cost Efficiency of Government Office Space’ 17 April 2013
1 Management of the Rail Freight Network Lease: Twelve Years Down the Track 3 January 2013

Office of the Auditor General Western Australia
7th Floor Albert Facey House 469 Wellington Street, Perth
Mail to: Perth BC, PO Box 8489
PERTH WA 6849
T: 08 6557 7500
F: 08 6557 7600
W: www.audit.wa.gov.au
Download QR Code Scanner app and scan code to access more information about our OfficeFollow us on Twitter @OAG_WA


