28
waterport Water demand management in the context of water services Tunisia
waterport
Water demand management in the context of water servicesTunisia
Water demand management in the context of water servicesTunisia
July 2016
Report prepared by Regional Centre for Energy Policy Research (REKK)
Experts: András Kis | Moez Allaoui | Gábor Ungvári
Action 1.1 – Capacity Building on Water Demand Management in Jordan and Tunisia
This report was prepared for the project“Sustainable Use of Transboundary Water Resources and Water Security Management” (WATER SUM), implemented by the Regional Environmental Center (REC) with funding from the Government of Sweden.
watersum.rec.org
1Water demand management in the context of water services Tunisia
Contents
Contents
Introduction
Institutional structure and regulatory background
Internal structure of the Ministry of Agriculture, Hydraulic Resources and Fishing 3
Public establishments in charge of water and sanitation 5
Inventory of laws and regulations 6
The hydrological situation and water balance
Surface water 8
Groundwater 10
Balancing supply and demand 12
Drinking water services
SONEDE services 13
SONEDE tariffs 18
Services provided by the General Department of Rural Engineering and Water Exploitation 21
Irrigation water use
Evaluation of current and prospective WDM measures
Good WDM practices 23
Prospective WDM measures 23
References
3
3
8
13
21
23
24
Water demand management in the context of water services Tunisia2
3Water demand management in the context of water services Tunisia
Introduction | Institutional structure and regulatory background
IntroductionThis report summarises the water demand management (WDM) findings of the inceptionperiod of the “Water Resources Management Good Practices and Knowledge Transfer”(WATER POrT) component of the project “Sustainable Use of Transboundary Water Resourcesand Water Security Management” (WATER SUM).
Based on site visits, interviews, a literature review and inputs provided by the national expert from Tunisia, the country’s water sector is analysed from the perspective of WDM. In addition to providing a brief overview of the hydrological situation and the institutional and legal framework under which the water sector operates, the authors cover WDM policiesthat have already been implemented in the urban drinking water service sector and in thefield of irrigation, and assess the scope for additional measures as well as barriers to their implementation.
The report ends with an evaluation of the possible directions to be pursued in the field of WDM.It highlights good WDM practices in Tunisia that could serve as examples for other countries inthe Middle East and North Africa (MENA), and it identifies prospective WDM measures thatcould be introduced in Tunisia, as well as barriers to their effective implementation.
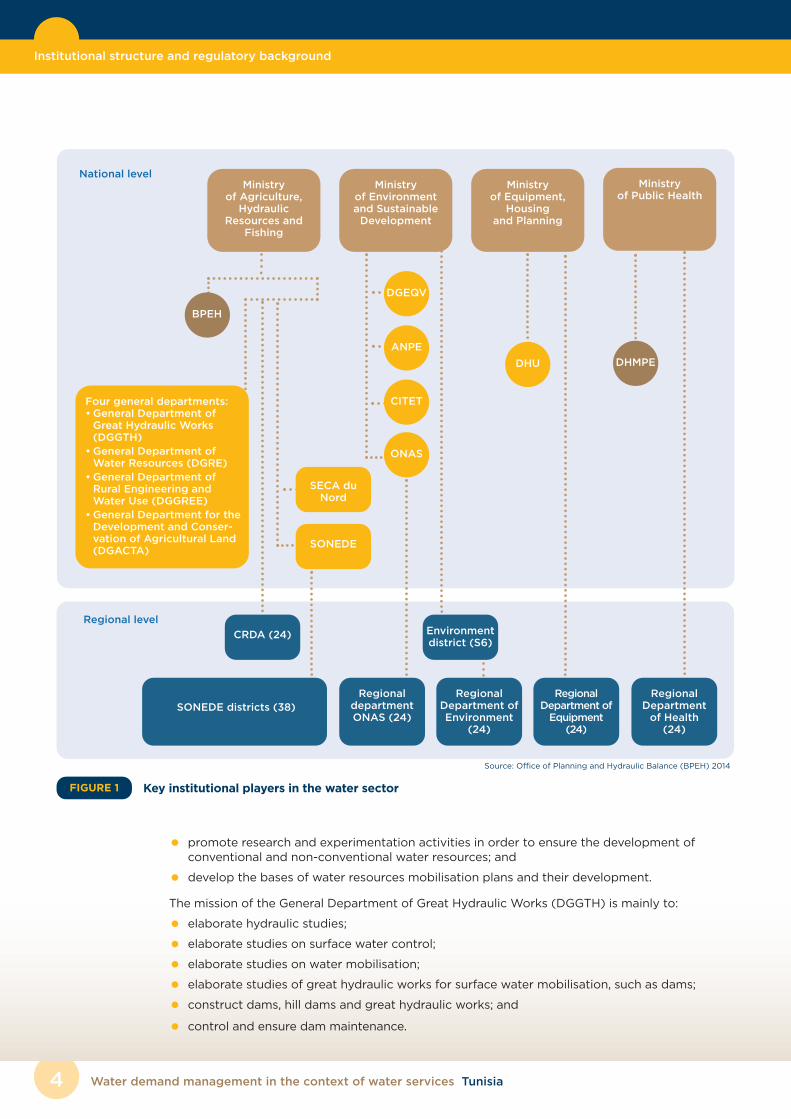
Institutional structure and regulatory backgroundAs shown in Figure 1, there are many institutional stakeholders involved in water management,most of them part of, or under the supervision of, the Ministry of Agriculture, HydraulicResources and Fishing. Others are under the umbrella of other ministries, such as the Ministryof Environment and Sustainable Development, the Ministry of Equipment, Housing and LandPlanning, and the Ministry of Public Health.
Internal structure of the Ministry of Agriculture, Hydraulic Resources and FishingThe organisational structure of the Ministry of Agriculture, Hydraulic Resources and Fishing isestablished by Decree No. 2001-420 of February 13, 2001.
The principal structures within the ministry that have tasks related directly or indirectly to watermanagement are summarised below.
The main tasks of the General Department of Rural Engineering and Water Use (DGGREE) inrelation to the water sector are to:
• rationalise the use of water, develop non-conventional water sources for use in agriculture,promote water users’ associations (WUAs) and study and implement instruments for WDM inthe agricultural sector; and
• coordinate drinking water programmes in urban and rural areas, develop programmes fordrinking water provision in rural areas, and monitor and assess the related projects.
The mission of the General Department of Water Resources (DGRE) is mainly to:
• set up and manage networks for measurements and monitoring in relation to the variouscomponents of the country’s water resources;
• develop principles and methods for the management and development of water resources,according to supply and demand;
Water demand management in the context of water services Tunisia4
Institutional structure and regulatory background
• promote research and experimentation activities in order to ensure the development of conventional and non-conventional water resources; and
• develop the bases of water resources mobilisation plans and their development.
The mission of the General Department of Great Hydraulic Works (DGGTH) is mainly to:
• elaborate hydraulic studies;
• elaborate studies on surface water control;
• elaborate studies on water mobilisation;
• elaborate studies of great hydraulic works for surface water mobilisation, such as dams;
• construct dams, hill dams and great hydraulic works; and
• control and ensure dam maintenance.
Ministry of Environmentand SustainableDevelopment
Ministry of Equipment,
Housing and Planning
Four general departments:• General Department ofGreat Hydraulic Works(DGGTH)
• General Department ofWater Resources (DGRE)
• General Department ofRural Engineering andWater Use (DGGREE)
• General Department for the Development and Conser-vation of Agricultural Land(DGACTA)
BPEH
SONEDE
CRDA (24)
SONEDE districts (38)Regional
departmentONAS (24)
Regional Department of Environment
(24)
Regional Department of Equipment
(24)
DGEQV
ANPE
ONAS
Environmentdistrict (S6)
DHU
SECA duNord
Ministry of Agriculture,
Hydraulic Resources and
Fishing
CITET
Key institutional players in the water sectorFIGURE 1
Regional level
National levelMinistry
of Public Health
Regional Departmentof Health (24)
DHMPE
Source: Office of Planning and Hydraulic Balance (BPEH) 2014
5Water demand management in the context of water services Tunisia
Institutional structure and regulatory background
The Office of Planning and Hydraulic Balance (BPEH) is linked to the Office of the Minister ofAgriculture. Its main mission is to:
• establish conventional and non-conventional water resources;
• determine the water needs of the various socioeconomic sectors;
• compile information on available and exploitable water resources;
• gather and analyse various water demands; and
• propose plans and programmes for the allocation of water resources to the various usersbased on offer and demand.
The main tasks of the General Department for the Development and Conservation of AgriculturalLand (DGACTA) are to:
• develop plans and guidance for better soil and natural resources conservation, vegetation,water and agricultural land;
• propose, develop and promote measures to ensure the better use of natural resources;
• ensure coordination between all stakeholders in water and soil conservation;
• assess water and soil conservation management; and
• involve all operators in conservation efforts.
The regional agricultural development offices (CRDAs) are public administrative establishments,created by Law No. 89-44 of March 8, 1989, as amended by Law No. 94-116 of October 31, 1994,and placed under the supervision of the Ministry of Agriculture, Hydraulic Resources and Fishing.There are 24 CRDAs, one in each governorate, in charge of implementing the government’sagricultural policy. Their mission in relation to the water sector is mainly to:
• ensure the application of legislative measures and regulations related to its field of compe-tence, in particular with regard to administrative water policy;
• ensure water and soil conservation, as well as watershed management;
• ensure the management of the hydraulic public domain;
• undertake actions related to hydraulic equipment and hydro-agricultural development programmes and projects, other than the national works determined by the Ministry of Agri-culture; and
• manage hydro-agricultural infrastructure within public perimeters, ensure its maintenance and organise water supply for irrigation.
Public establishments in charge of water and sanitationBesides the internal structures within the ministry, the state has created two public enterpriseswith legal personality and financial autonomy, which specialise in drinking water supply andsanitation, as well as another public utility in charge of raw water transportation, used partially inthe process of drinking water supply.
The national drinking water utility (SONEDE) was created under the terms of Law No. 68-22 ofJuly 2, 1968, as amended by Law No. 76-21 of January 21, 1976. This public establishment has anindustrial and commercial nature, and is placed under the supervision of the Ministry ofAgriculture, Hydraulic Resources and Fishing. Its mission is mainly to:
• produce, treat and transport water;
• supply water to all approved consumers throughout the territory of Tunisia within the frame-
work of its monopoly, recognised by the law of establishment;
• manage, extend, renew and maintain the distribution network; and
• undertake development tasks, such as studies, works and supply.
Water demand management in the context of water services Tunisia6
Institutional structure and regulatory background
The National Office for Sanitation (ONAS) was created under the terms of Law No. 37-74 ofAugust 3, 1974, as amended by Law No. 93-41 of April 19, 1993. A public establishment of anindustrial and commercial nature, it is placed under the supervision of the Ministry ofEnvironment. Its main tasks are to:
• prepare master plans for urban sanitation, feasibility studies, exploratory studies and studiesof implementation related to wastewater networks, sewage treatment and pumping plants;
• carry out sanitation projects and control projects carried out by other actors, such as prop-erty developers;
• operate and maintain sanitation networks and facilities in zones under its responsibility; and
• provide technical assistance to local governments and other public and private agencies inaddressing water pollution.
In accordance with Decree No. 75-492 of July 26, 1975 (modified by Decree No. 2002-524 ofFebruary 27, 2002), SONEDE is authorised to invoice and collect sanitation water treatmentlevies (tariffs) on behalf of ONAS. The two enterprises have also made an agreement specifyingpractical implementation arrangements. The water bills issued and distributed by SONEDE arethus divided into two parts — one for drinking water consumption and another for sanitation.
The North Water Supply Channel Company (SECA du Nord) was created under the terms of Law No. 84-26 of May 11, 1984. This public establishment of an industrial and commercial natureis placed under the supervision of the Ministry of Agriculture, Hydraulic Resources and Fishing.Its main mission is to:
• ensure the operation, management and maintenance of canals and piped water supply usedfor transporting waters in the North as well as from the Ichkeul and Sidi Salem dams to theplace of use; and
• distribute and sell water to the various bodies in charge of water distribution to final users.
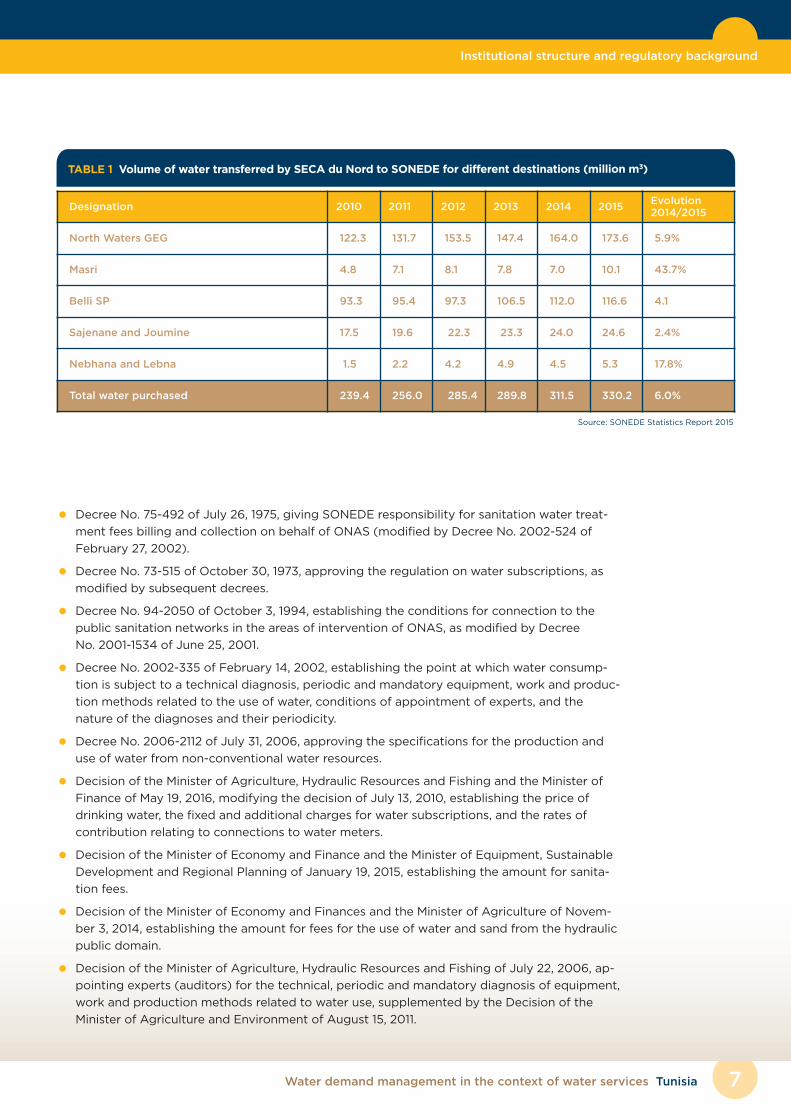
The main volume of surface water used by SONEDE (85 percent in 2015) is supplied by SECA duNord (330.2 million m3 in 2015) via its various infrastructure elements (see Table 1). This volumeincreased in the five years up to 2015 due to the declining level of groundwater, which is the othermain traditional source of water for SONEDE. The relationship between the two enterprises isdefined in an agreement that states the volumes of raw water transferred and the terms of payment.
Inventory of laws and regulationsThe main legislative texts and regulations relating to water and sanitation are listed below.
• Article 44 of the Tunisian Constitution, approved on January 27, 2014, states that: “The right
to water shall be guaranteed. The conservation and rational use of water is a duty of the state
and of society.”
• The Water Code, promulgated by Law No. 16-75 of March 31, 1975, as amended and supple-
mented by subsequent texts.
• Law No. 95-70 of July 17, 1995, on water and soil conservation.
• Law No. 68-22 of July 2, 1968, authorising the creation of the national drinking water utility
(SONEDE), as amended by Law No. 76-21 of January 21, 1976.
• Law No. 74-37 of August 3, 1974, authorising the creation of the National Office for Sanitation
(ONAS), as amended by Law No. 93-41 of April 19, 1993.
• Law No. 84-26 of November 5, 1984, authorising the creation of the North Water Supply
Canal Company (SECA du Nord).
• Law No. 99-43 of May 10, 1999, relating to agricultural and fishing development groups
(GDAPs), as amended and supplemented by Law No. 2004-24 of March 15, 2004.
7Water demand management in the context of water services Tunisia
Institutional structure and regulatory background
• Decree No. 75-492 of July 26, 1975, giving SONEDE responsibility for sanitation water treat-
ment fees billing and collection on behalf of ONAS (modified by Decree No. 2002-524 of
February 27, 2002).
• Decree No. 73-515 of October 30, 1973, approving the regulation on water subscriptions, as
modified by subsequent decrees.
• Decree No. 94-2050 of October 3, 1994, establishing the conditions for connection to the
public sanitation networks in the areas of intervention of ONAS, as modified by Decree
No. 2001-1534 of June 25, 2001.
• Decree No. 2002-335 of February 14, 2002, establishing the point at which water consump-
tion is subject to a technical diagnosis, periodic and mandatory equipment, work and produc-
tion methods related to the use of water, conditions of appointment of experts, and the
nature of the diagnoses and their periodicity.
• Decree No. 2006-2112 of July 31, 2006, approving the specifications for the production and
use of water from non-conventional water resources.
• Decision of the Minister of Agriculture, Hydraulic Resources and Fishing and the Minister of
Finance of May 19, 2016, modifying the decision of July 13, 2010, establishing the price of
drinking water, the fixed and additional charges for water subscriptions, and the rates of
contribution relating to connections to water meters.
• Decision of the Minister of Economy and Finance and the Minister of Equipment, Sustainable
Development and Regional Planning of January 19, 2015, establishing the amount for sanita-
tion fees.
• Decision of the Minister of Economy and Finances and the Minister of Agriculture of Novem-
ber 3, 2014, establishing the amount for fees for the use of water and sand from the hydraulic
public domain.
• Decision of the Minister of Agriculture, Hydraulic Resources and Fishing of July 22, 2006, ap-
pointing experts (auditors) for the technical, periodic and mandatory diagnosis of equipment,
work and production methods related to water use, supplemented by the Decision of the
Minister of Agriculture and Environment of August 15, 2011.
Designation 2010 2011 2012 2013 2014 2015Evolution2014/2015
North Waters GEG 122.3 131.7 153.5 147.4 164.0 173.6 5.9%
Masri 4.8 7.1 8.1 7.8 7.0 10.1 43.7%
Belli SP 93.3 95.4 97.3 106.5 112.0 116.6 4.1
Sajenane and Joumine 17.5 19.6 22.3 23.3 24.0 24.6 2.4%
Nebhana and Lebna 1.5 2.2 4.2 4.9 4.5 5.3 17.8%
Total water purchased 239.4 256.0 285.4 289.8 311.5 330.2 6.0%
TABLE 1 Volume of water transferred by SECA du Nord to SONEDE for different destinations (million m3)
Source: SONEDE Statistics Report 2015
8 Water demand management in the context of water services Tunisia
Institutional structure and regulatory background | The hydrological situation and water balance
In relation to WDM, a series of principles and mechanisms have been introduced through theWater Code amendment, passed in 2001. Law No. 2001-116 of November 26, 2001, amendedChapter VI–A on water saving, introducing the following principles:
• Water is a national asset.
• Sustainability.
• Water saving is a means of developing and rationalising water resources use.
• Work carried out to develop water saving and to protect and improve the quality of nationalwater resources is in the public interest (Article 86).
Among the key measures, this amendment:
• encourages the use and production of non-conventional water resources by the private sec-tor (Article 88). The volume of desalinated water produced by the private sector is currentlyestimated at 10 million m3 per year. Some hotels have built small desalination plants to covertheir own consumption, especially for the irrigation of green areas;
• establishes the technical, periodic and mandatory diagnosis of water systems (Article 89);
• includes provisions on a rationing system (Article 90);
• includes measures against water wastage (Article 91); and
• encourages water recycling by industry (Article 95).
At the same time, Decree No. 2001-2606 of November 9, 2001, amending Article 19 of the WaterCode, introduced an important institutional reform via the establishment of the National WaterCouncil, replacing the National Water Committee. The functions and composition of the councilwere strengthened to give this structure the necessary efficiency to play its full role.
The main prerogatives of this council in terms of water demand are to:
• suggest general principles for mobilisation and the enhancement of resource utilisation;
• contribute to programme development and resource mobilisation plans and measures to optimise their use; and
• present proposals for the development of a national water-saving policy.
All the texts described above have entered into force and are applicable. However, someimplementing regulations are still pending, such as the text on drinking water standards. Onthe other hand, some provisions and regulations have not been fully implemented, especiallysince 2011 — in particular the provisions regarding the protection of public domain waters andwater disconnection for non-payment of bills. According to Decree No. 73-515, Article 26, inthe case of non-payment the contract can be terminated and the water supply cut off,although in reality such a measure is rarely applied.
A water law reform was initiated in 2009. A draft Water Code was submitted by the Ministry ofAgriculture, Hydraulic Resources and Fishing to the Presidency of the Government at the end of2014 and approved by the Council of Ministers in February 2016.
The hydrological situation and water balanceSurface waterHydrological studies have evaluated the average intake of surface water in the Tunisian river systemat approximately 2,630 million m3 per year, with significant variation across the years. This volumecorresponds to potentially mobilised surface water resources with adequate hydraulic structures.These resources are divided between the major river basins of the country as follows:
9
• Medjerda: 1,000 million m3 per year;
• Far North: 585 million m3 per year;
• Ichkeul and Bizerte: 375 million m3 per year;
• Cap Bon and Meliane: 230 million m3 per year;
• Sahel and Centre (Zeroud-Merguellil, Sahel and Sfax): 320 million m3 per year; and
• South (Chotts Basin and Djeffara): 120 million m3 year.
Calculated across the three main regions of the country, the situation is as follows:
• North: 2,190 million m3 per year, of which 1,796 mil-
lion m3 have a lower salinity below 1.5 g/l;
• Centre: 320 million m3 per year, of which 153 mil-
lion m3 have a lower salinity below 1.5 g/l; and
• South: 120 million m3 per year, of which 5 million m3
have a lower salinity below 1.5 g/l.
The North apparently not only has more surface
water, but a bigger share of this water is of good
quality (82 percent in the North versus 4 percent
in the South).
Tunisia shares a certain number of watercourses with
its western neighbour, Algeria. The exchange of
surface water between the two countries is about
300 million m3 per year to the benefit of Tunisia, and
about 150 million m3 to the benefit of Algeria.
The most important cross-border river, and the only
perennially flowing river in the country, is the Medjerda
River, which flows for 460 km to the Gulf of Tunis. Its
rate of discharge varies between 2 m3/s in the summer
and 1,200 m3/s in the winter (in exceptional cases,
during a flood, even reaching 2,000 m3/s), with an
annual average flow of about 29 m3/s.
Despite the scarcity of surface water in the region, and
the crucial role of the Medjerda, there is no binding
convention or treaty between Tunisia and Algeria
regarding shared watercourses. However, bearing in
mind that agreements on land and sea borders are
relatively recent, this situation should not be
considered unusual. Nevertheless, the situation clearly
highlights the vulnerability of water supply in Tunisia.
At the same time, there is continuous collaboration between the relevant
institutions in the two countries, even at ministerial level.
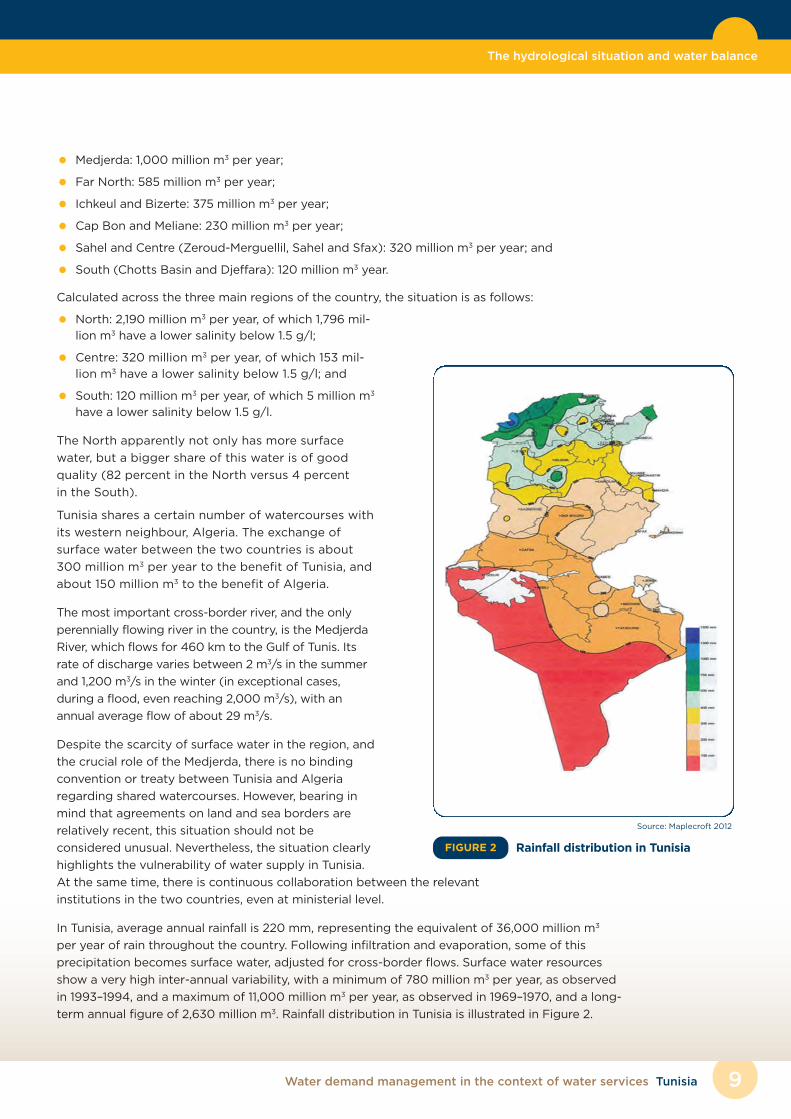
In Tunisia, average annual rainfall is 220 mm, representing the equivalent of 36,000 million m3
per year of rain throughout the country. Following infiltration and evaporation, some of this
precipitation becomes surface water, adjusted for cross-border flows. Surface water resources
show a very high inter-annual variability, with a minimum of 780 million m3 per year, as observed
in 1993–1994, and a maximum of 11,000 million m3 per year, as observed in 1969–1970, and a long-
term annual figure of 2,630 million m3. Rainfall distribution in Tunisia is illustrated in Figure 2.
Water demand management in the context of water services Tunisia
The hydrological situation and water balance
Rainfall distribution in TunisiaFIGURE 2
Source: Maplecroft 2012
Water demand management in the context of water services Tunisia10
The hydrological situation and water balance
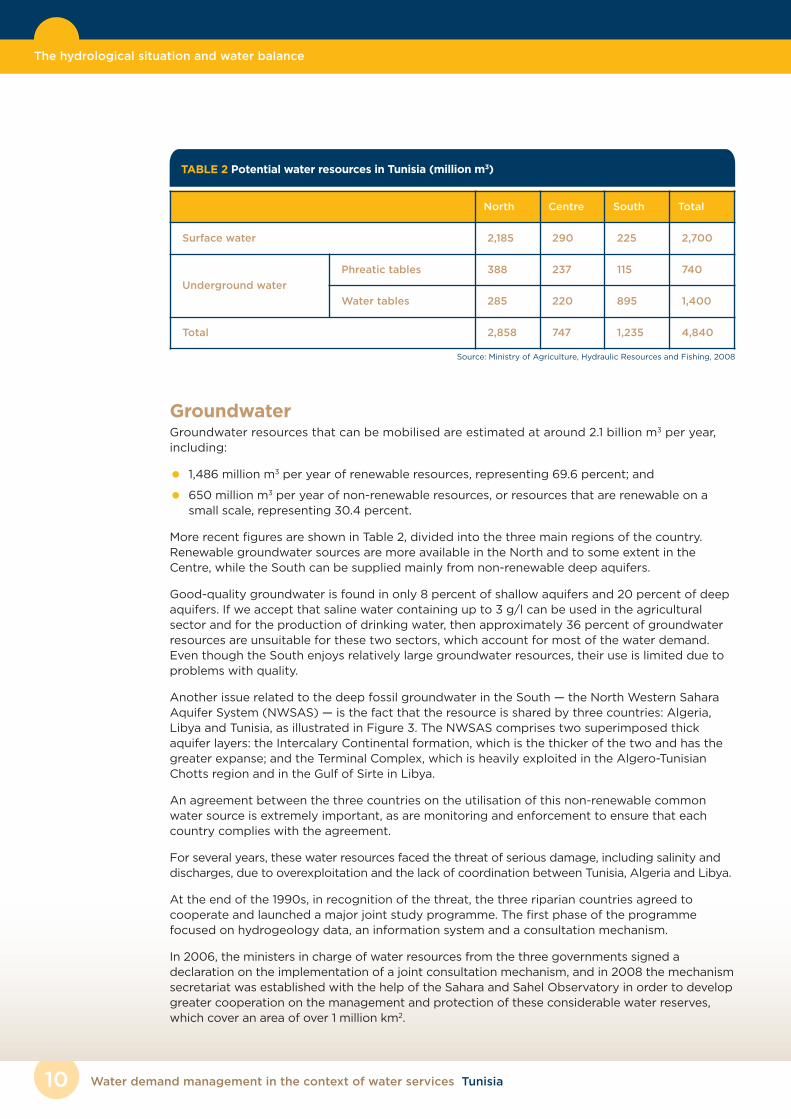
North Centre South Total
Surface water 2,185 290 225 2,700
Underground water
Phreatic tables 388 237 115 740
Water tables 285 220 895 1,400
Total 2,858 747 1,235 4,840
TABLE 2 Potential water resources in Tunisia (million m3)
Source: Ministry of Agriculture, Hydraulic Resources and Fishing, 2008
Groundwater Groundwater resources that can be mobilised are estimated at around 2.1 billion m3 per year,including:
• 1,486 million m3 per year of renewable resources, representing 69.6 percent; and
• 650 million m3 per year of non-renewable resources, or resources that are renewable on asmall scale, representing 30.4 percent.
More recent figures are shown in Table 2, divided into the three main regions of the country.Renewable groundwater sources are more available in the North and to some extent in theCentre, while the South can be supplied mainly from non-renewable deep aquifers.
Good-quality groundwater is found in only 8 percent of shallow aquifers and 20 percent of deepaquifers. If we accept that saline water containing up to 3 g/l can be used in the agriculturalsector and for the production of drinking water, then approximately 36 percent of groundwaterresources are unsuitable for these two sectors, which account for most of the water demand.Even though the South enjoys relatively large groundwater resources, their use is limited due toproblems with quality.
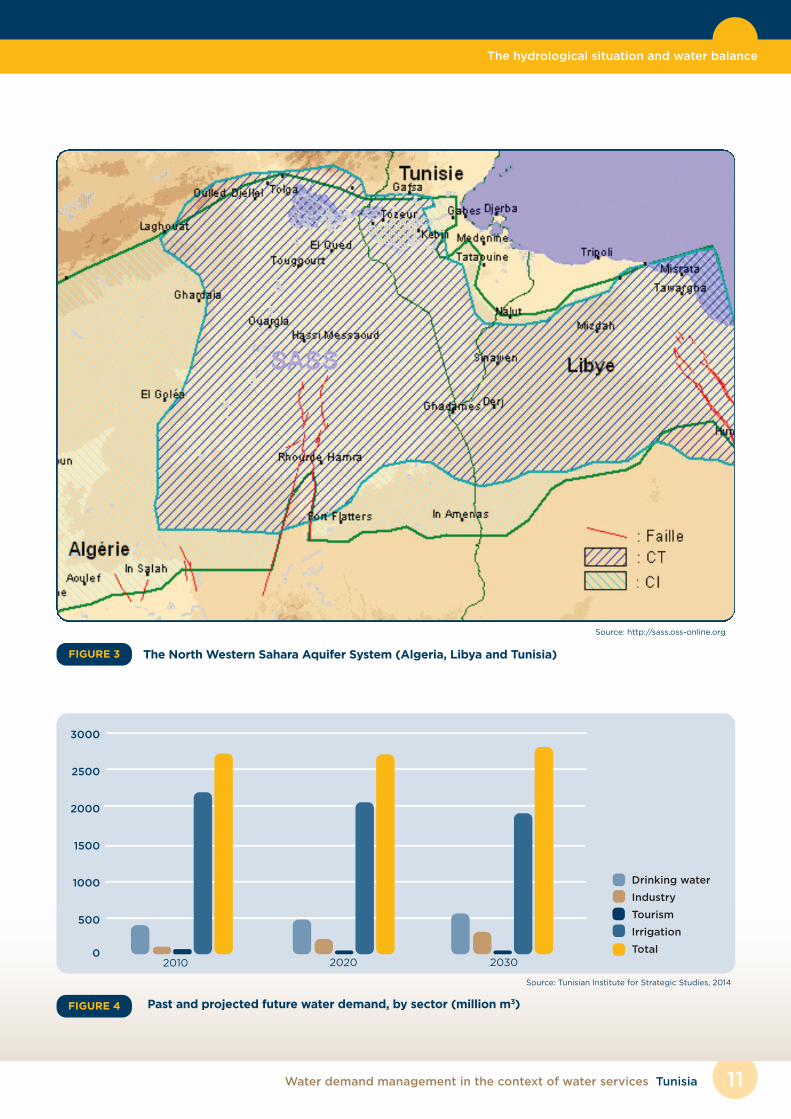
Another issue related to the deep fossil groundwater in the South — the North Western SaharaAquifer System (NWSAS) — is the fact that the resource is shared by three countries: Algeria,Libya and Tunisia, as illustrated in Figure 3. The NWSAS comprises two superimposed thickaquifer layers: the Intercalary Continental formation, which is the thicker of the two and has thegreater expanse; and the Terminal Complex, which is heavily exploited in the Algero-TunisianChotts region and in the Gulf of Sirte in Libya.
An agreement between the three countries on the utilisation of this non-renewable commonwater source is extremely important, as are monitoring and enforcement to ensure that eachcountry complies with the agreement.
For several years, these water resources faced the threat of serious damage, including salinity anddischarges, due to overexploitation and the lack of coordination between Tunisia, Algeria and Libya.
At the end of the 1990s, in recognition of the threat, the three riparian countries agreed tocooperate and launched a major joint study programme. The first phase of the programmefocused on hydrogeology data, an information system and a consultation mechanism.
In 2006, the ministers in charge of water resources from the three governments signed adeclaration on the implementation of a joint consultation mechanism, and in 2008 the mechanismsecretariat was established with the help of the Sahara and Sahel Observatory in order to developgreater cooperation on the management and protection of these considerable water reserves,which cover an area of over 1 million km2.
11Water demand management in the context of water services Tunisia
The hydrological situation and water balance
Source: http://sass.oss-online.org
0
500
1000
1500
2000
2500
3000
Drinking water
Industry
Tourism
Irrigation
Total2010 2020 2030
Past and projected future water demand, by sector (million m3)FIGURE 4
Source: Tunisian Institute for Strategic Studies, 2014
The North Western Sahara Aquifer System (Algeria, Libya and Tunisia)FIGURE 3
Initially, the aim of this organisation was to improveknowledge of NWSAS hydrological behaviour, the risksfaced, and the related socioeconomic andenvironmental conditions. Based on the scientificstudies, simulations and recommendations, the threestates decided to establish a common management ofthe NWSAS through defined forms and mechanisms.These mechanisms include the Council of Ministers inCharge of Water (of the three countries), a standingtechnical committee and national committees. Thesecretariat of the NWSAS is hosted at the Sahara andSahel Observatory. The structural coordinator isappointed on a rotating basis, and the funding is sharedequally by Tunisia, Algeria and Libya. Currently, themission of the NWSAS is limited to informationexchange and consultation, without any inter-governmental regulation of the use of the resource.
Balancing supply and demandAs shown in Figure 4, the biggest water user in Tunisia isthe agricultural sector, followed by the domestic sector,industry and tourism. While a slight decline is predictedin the use of irrigation water, other uses are forecastedto increase over the next two decades.
Tunisia experiences less water stress than some of theother MENA countries. However, with average availablewater resources of around 420 m3 per capita per year, itis only just able to meet total demand, and in years ofdrought the situation can become very difficult. Even if,in a given year, there is sufficient water in the country, itsspatial and temporal allocation is not compatible withconsumption patterns. It is the task of a well-developedwater governance system to accumulate and store
water during wet seasons (in reservoirs) and to deliver it to locations where there is substantialdemand (water transfer infrastructure).
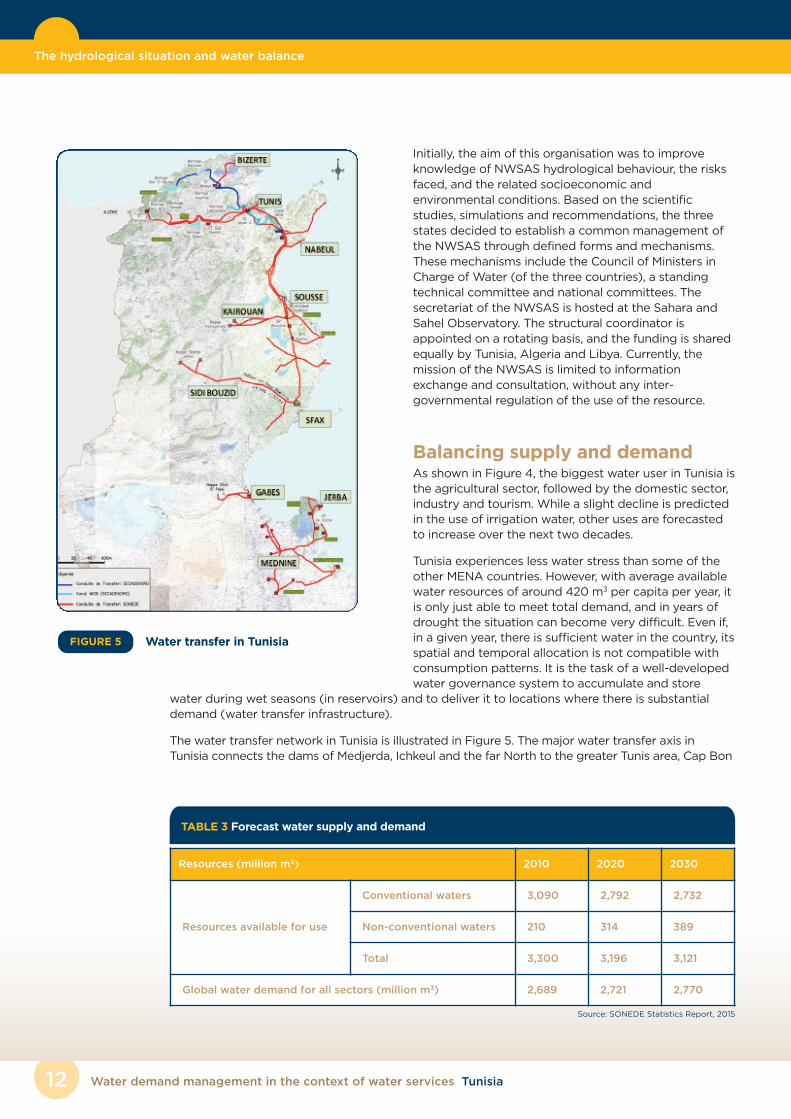
The water transfer network in Tunisia is illustrated in Figure 5. The major water transfer axis inTunisia connects the dams of Medjerda, Ichkeul and the far North to the greater Tunis area, Cap Bon
Water demand management in the context of water services Tunisia12
The hydrological situation and water balance
Resources (million m3) 2010 2020 2030
Resources available for use
Conventional waters 3,090 2,792 2,732
Non-conventional waters 210 314 389
Total 3,300 3,196 3,121
Global water demand for all sectors (million m3) 2,689 2,721 2,770
TABLE 3 Forecast water supply and demand
Source: SONEDE Statistics Report, 2015
Water transfer in TunisiaFIGURE 5
13Water demand management in the context of water services Tunisia
The hydrological situation and water balance | Drinking water services
and the eastern coast of the country. This transfer is used to meet the growing demand for drinkingwater and irrigation and to improve water quality in the Medjerda dam (salinity rate of 3 to 4 g/l) bymixing it with water that has a lower salinity from the Ichkeul dam and the far North (1 g/l).
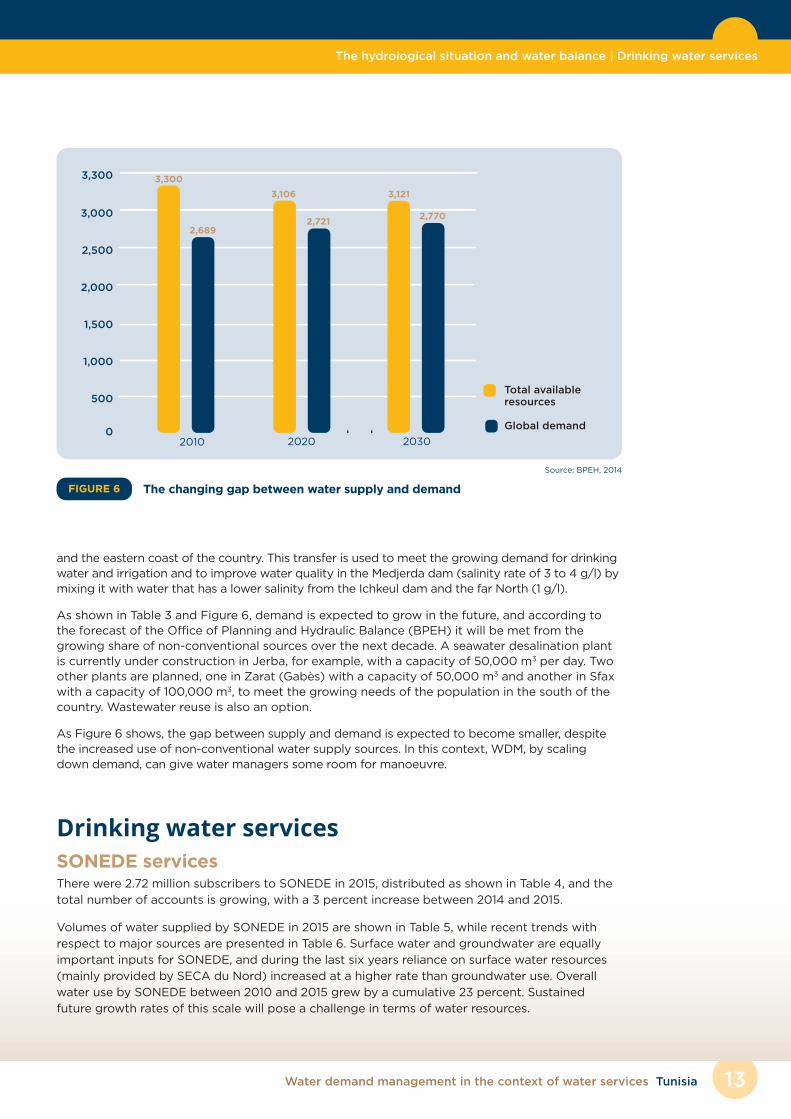
As shown in Table 3 and Figure 6, demand is expected to grow in the future, and according tothe forecast of the Office of Planning and Hydraulic Balance (BPEH) it will be met from thegrowing share of non-conventional sources over the next decade. A seawater desalination plantis currently under construction in Jerba, for example, with a capacity of 50,000 m3 per day. Twoother plants are planned, one in Zarat (Gabès) with a capacity of 50,000 m3 and another in Sfaxwith a capacity of 100,000 m3, to meet the growing needs of the population in the south of thecountry. Wastewater reuse is also an option.
As Figure 6 shows, the gap between supply and demand is expected to become smaller, despitethe increased use of non-conventional water supply sources. In this context, WDM, by scalingdown demand, can give water managers some room for manoeuvre.
Drinking water servicesSONEDE servicesThere were 2.72 million subscribers to SONEDE in 2015, distributed as shown in Table 4, and the
total number of accounts is growing, with a 3 percent increase between 2014 and 2015.
Volumes of water supplied by SONEDE in 2015 are shown in Table 5, while recent trends with
respect to major sources are presented in Table 6. Surface water and groundwater are equally
important inputs for SONEDE, and during the last six years reliance on surface water resources
(mainly provided by SECA du Nord) increased at a higher rate than groundwater use. Overall
water use by SONEDE between 2010 and 2015 grew by a cumulative 23 percent. Sustained
future growth rates of this scale will pose a challenge in terms of water resources.
0
500
1,000
1,500
2,000
2,500
3,000
Total availableresources
Global demand
2010 2020 2030
3,300 3,300
2,689
3,106
2,721
3,121
2,770
The changing gap between water supply and demandFIGURE 6
Source: BPEH, 2014
Water demand management in the context of water services Tunisia14
Drinking water services
Source of water
SECA du NordDams managed bySONEDE
Groundwater Desalination Deferrisation Total
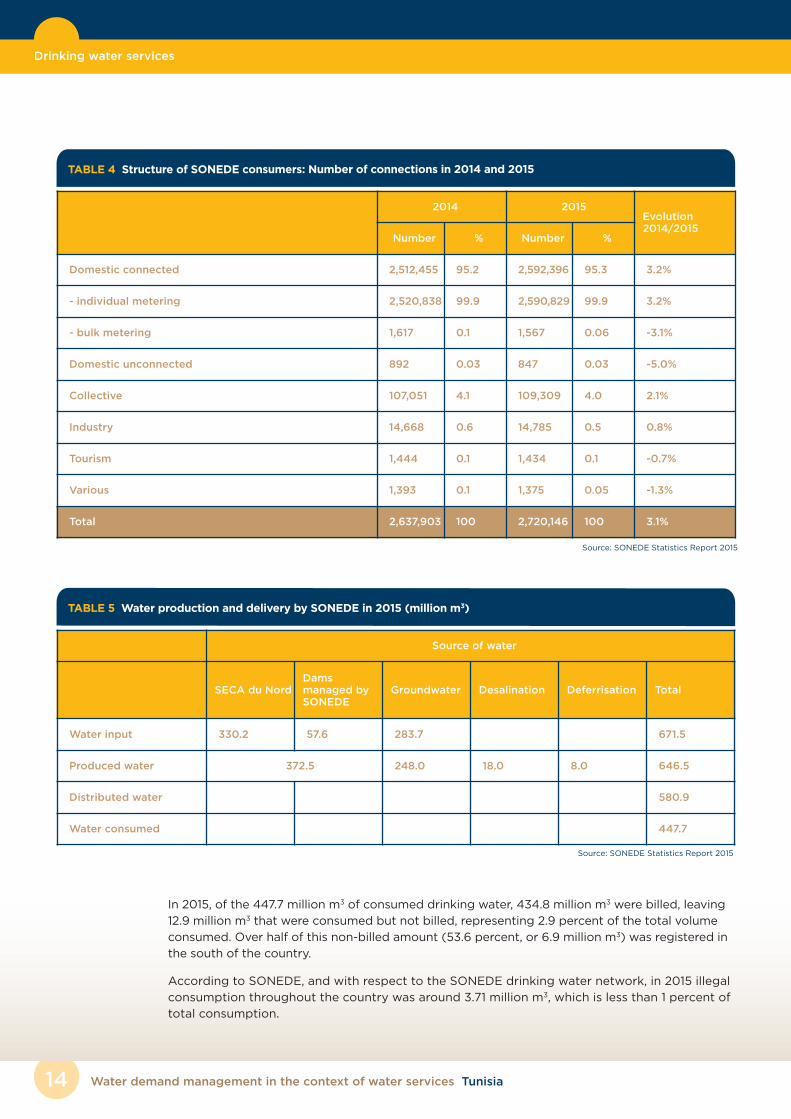
Water input 330.2 57.6 283.7 671.5
Produced water 372.5 248.0 18.0 8.0 646.5
Distributed water 580.9
Water consumed 447.7
TABLE 5 Water production and delivery by SONEDE in 2015 (million m3)
Source: SONEDE Statistics Report 2015
In 2015, of the 447.7 million m3 of consumed drinking water, 434.8 million m3 were billed, leaving
12.9 million m3 that were consumed but not billed, representing 2.9 percent of the total volume
consumed. Over half of this non-billed amount (53.6 percent, or 6.9 million m3) was registered in
the south of the country.
According to SONEDE, and with respect to the SONEDE drinking water network, in 2015 illegal
consumption throughout the country was around 3.71 million m3, which is less than 1 percent of
total consumption.
2014 2015Evolution2014/2015
Number % Number %
Domestic connected 2,512,455 95.2 2,592,396 95.3 3.2%
- individual metering 2,520,838 99.9 2,590,829 99.9 3.2%
- bulk metering 1,617 0.1 1,567 0.06 -3.1%
Domestic unconnected 892 0.03 847 0.03 -5.0%
Collective 107,051 4.1 109,309 4.0 2.1%
Industry 14,668 0.6 14,785 0.5 0.8%
Tourism 1,444 0.1 1,434 0.1 -0.7%
Various 1,393 0.1 1,375 0.05 -1.3%
Total 2,637,903 100 2,720,146 100 3.1%
TABLE 4 Structure of SONEDE consumers: Number of connections in 2014 and 2015
Source: SONEDE Statistics Report 2015
15Water demand management in the context of water services Tunisia
Drinking water services
2010 2011 2012 2013 2014 2015Evolution2014/2015
Surface water
millionm3 301.3 319.2 344.7 356.2 374.3 387.3
3.6%
% 55.5 55.6 57.3 56.7 57.5 57.8
Groundwater
millionm3 242.1 244.5 256.6 272.5 276.3 283.7
2.7%
% 44.5 43.4 42.7 43.3 42.5 42.2
Input volume
millionm3 543.4 563.7 601.3 628.7 650.6 671.5
3.2%
% 100 100 100 100 100 100
TABLE 6 Trends in water volumes at SONEDE by source (2010–2015)
Source: SONEDE Statistics Report 2015
Volume Connections
millionm3 %
Evolution2014/2015
Number %Evolution2014/2015
Domestic connected 330.0 76.6 3.7% 2,592,396 95.3 3.2%
Domestic unconnected 13.1 3.0 10.9% 847 0.03 -5.0%
Collective 45.9 10.6 0.9% 109,309 4.0 2.1%
Industry 28.2 6.5 -11.6% 14,785 0.54 0.8%
Tourism 12.3 2.8 -20.4% 1,434 0.05 -0.7
Various 2.3 0.5 7.2% 1,375 0.05 -1.3%
Total 434.8 100 1.6% 2,720,146 100 3.1%
TABLE 7 Delivered volume of drinking water and number of connections under different consumer categories (2015)
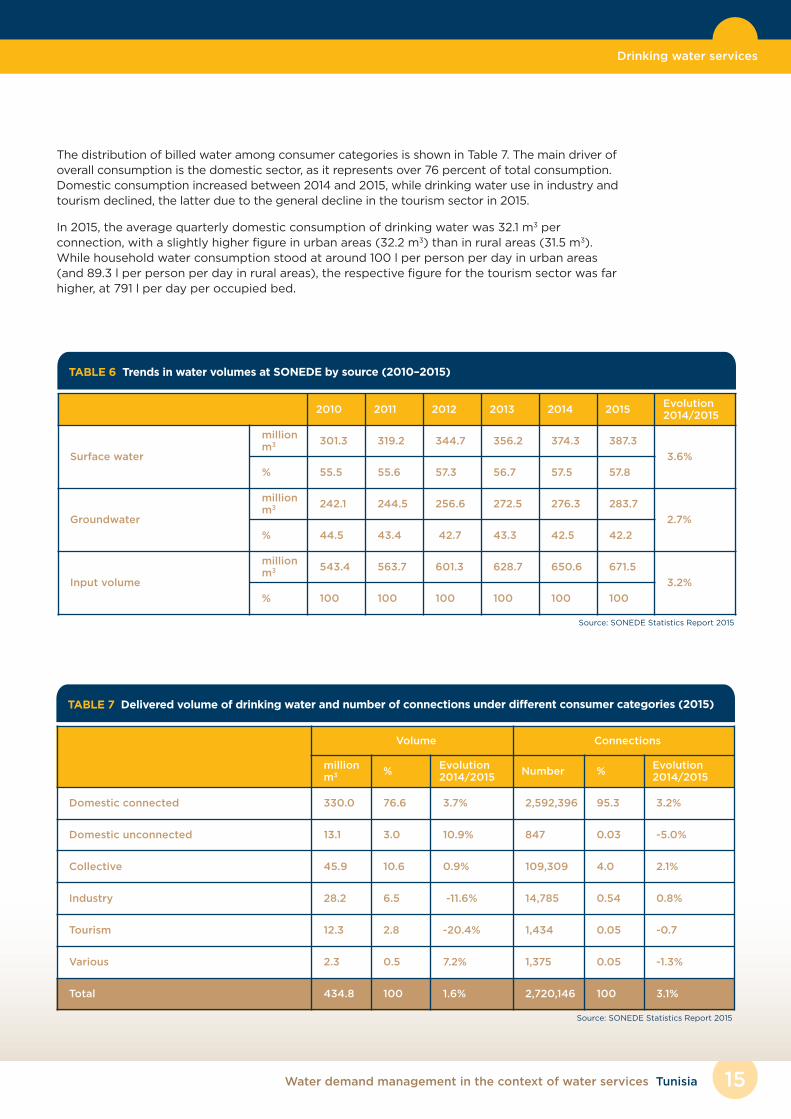
The distribution of billed water among consumer categories is shown in Table 7. The main driver ofoverall consumption is the domestic sector, as it represents over 76 percent of total consumption.Domestic consumption increased between 2014 and 2015, while drinking water use in industry andtourism declined, the latter due to the general decline in the tourism sector in 2015.
In 2015, the average quarterly domestic consumption of drinking water was 32.1 m3 perconnection, with a slightly higher figure in urban areas (32.2 m3) than in rural areas (31.5 m3).While household water consumption stood at around 100 l per person per day in urban areas(and 89.3 l per person per day in rural areas), the respective figure for the tourism sector was farhigher, at 791 l per day per occupied bed.
Source: SONEDE Statistics Report 2015
Water demand management in the context of water services Tunisia16
Drinking water services
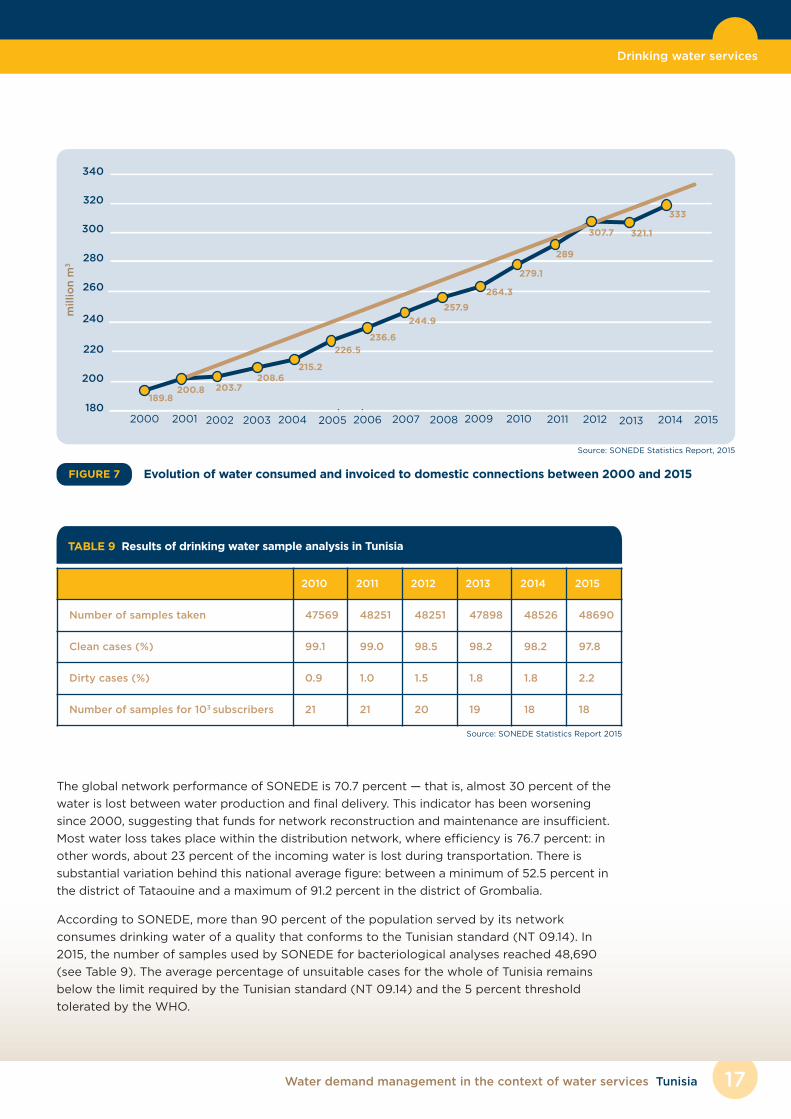
Figure 7 illustrates the clearly rising trend in water consumption by SONEDE’s domestic
consumers in the last 15 years. This increase is mainly related to urbanisation and to the
subsequent growth in the number of connections (see Table 7).
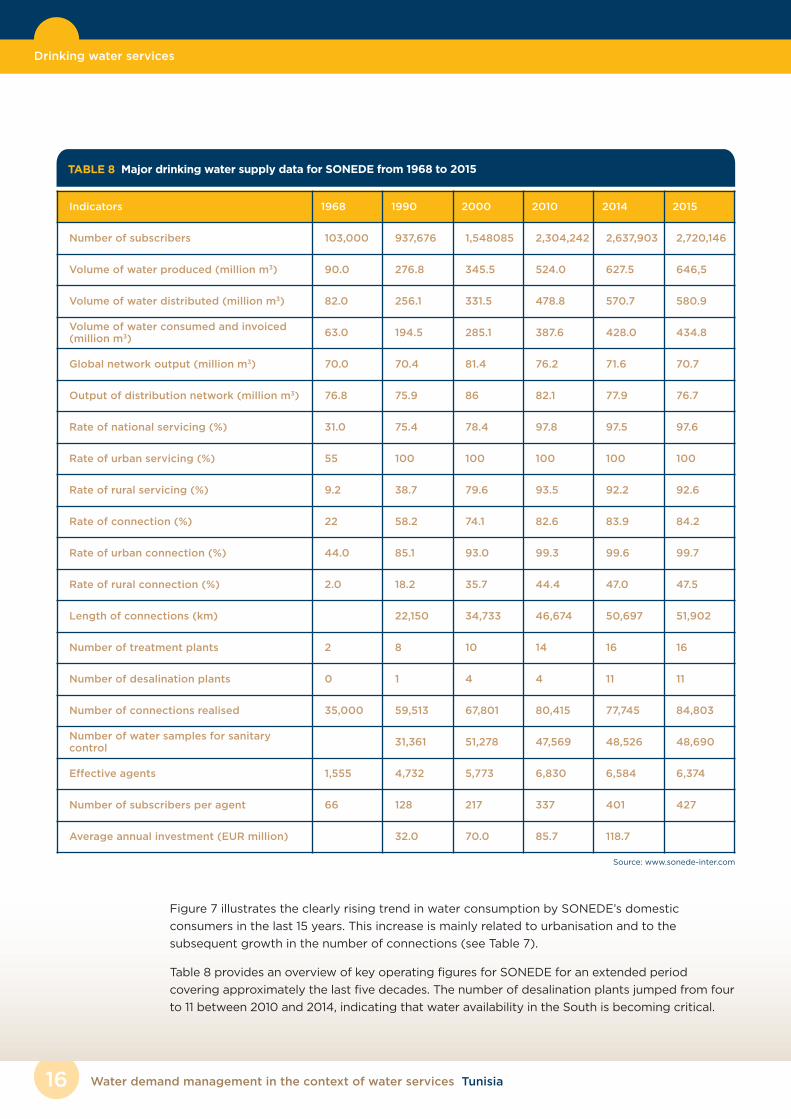
Table 8 provides an overview of key operating figures for SONEDE for an extended period
covering approximately the last five decades. The number of desalination plants jumped from four
to 11 between 2010 and 2014, indicating that water availability in the South is becoming critical.
Indicators 1968 1990 2000 2010 2014 2015
Number of subscribers 103,000 937,676 1,548085 2,304,242 2,637,903 2,720,146
Volume of water produced (million m3) 90.0 276.8 345.5 524.0 627.5 646,5
Volume of water distributed (million m3) 82.0 256.1 331.5 478.8 570.7 580.9
Volume of water consumed and invoiced(million m3)
63.0 194.5 285.1 387.6 428.0 434.8
Global network output (million m3) 70.0 70.4 81.4 76.2 71.6 70.7
Output of distribution network (million m3) 76.8 75.9 86 82.1 77.9 76.7
Rate of national servicing (%) 31.0 75.4 78.4 97.8 97.5 97.6
Rate of urban servicing (%) 55 100 100 100 100 100
Rate of rural servicing (%) 9.2 38.7 79.6 93.5 92.2 92.6
Rate of connection (%) 22 58.2 74.1 82.6 83.9 84.2
Rate of urban connection (%) 44.0 85.1 93.0 99.3 99.6 99.7
Rate of rural connection (%) 2.0 18.2 35.7 44.4 47.0 47.5
Length of connections (km) 22,150 34,733 46,674 50,697 51,902
Number of treatment plants 2 8 10 14 16 16
Number of desalination plants 0 1 4 4 11 11
Number of connections realised 35,000 59,513 67,801 80,415 77,745 84,803
Number of water samples for sanitary control
31,361 51,278 47,569 48,526 48,690
Effective agents 1,555 4,732 5,773 6,830 6,584 6,374
Number of subscribers per agent 66 128 217 337 401 427
Average annual investment (EUR million) 32.0 70.0 85.7 118.7
TABLE 8 Major drinking water supply data for SONEDE from 1968 to 2015
Source: www.sonede-inter.com
17Water demand management in the context of water services Tunisia
Drinking water services
The global network performance of SONEDE is 70.7 percent — that is, almost 30 percent of the
water is lost between water production and final delivery. This indicator has been worsening
since 2000, suggesting that funds for network reconstruction and maintenance are insufficient.
Most water loss takes place within the distribution network, where efficiency is 76.7 percent: in
other words, about 23 percent of the incoming water is lost during transportation. There is
substantial variation behind this national average figure: between a minimum of 52.5 percent in
the district of Tataouine and a maximum of 91.2 percent in the district of Grombalia.
According to SONEDE, more than 90 percent of the population served by its network
consumes drinking water of a quality that conforms to the Tunisian standard (NT 09.14). In
2015, the number of samples used by SONEDE for bacteriological analyses reached 48,690
(see Table 9). The average percentage of unsuitable cases for the whole of Tunisia remains
below the limit required by the Tunisian standard (NT 09.14) and the 5 percent threshold
tolerated by the WHO.
2010 2011 2012 2013 2014 2015
Number of samples taken 47569 48251 48251 47898 48526 48690
Clean cases (%) 99.1 99.0 98.5 98.2 98.2 97.8
Dirty cases (%) 0.9 1.0 1.5 1.8 1.8 2.2
Number of samples for 103 subscribers 21 21 20 19 18 18
TABLE 9 Results of drinking water sample analysis in Tunisia
Source: SONEDE Statistics Report 2015
180
200
220
240
260
280
300
2000 2005 2007
320
340
189.8200.8 203.7
208.6215.2
226.5236.6
244.9
257.9
264.3
279.1
289
307.7 321.1
333
2001 2002 2003 2004 2006 2008 2009 2010 2011 20132012 2014 2015
Evolution of water consumed and invoiced to domestic connections between 2000 and 2015FIGURE 7
Source: SONEDE Statistics Report, 2015
million m
3
Water demand management in the context of water services Tunisia18
Drinking water services
SONEDE tariffsArticle 24 of Decree No. 73-515 of October 30, 1973, approving the regulation on water
subscriptions, states that “the price of water and ancillary fees are fixed by a ministerial
decision”. The latest Decision of the Minister of Agriculture, Hydraulic Resources and Fishing and
the Minister of Finance is dated May/June 2016.
The tariff system, which is the same throughout the country, is divided into fixed and variable
tariffs. Fixed tariffs are independent of consumption, while variable tariffs depend on the level
of consumption.
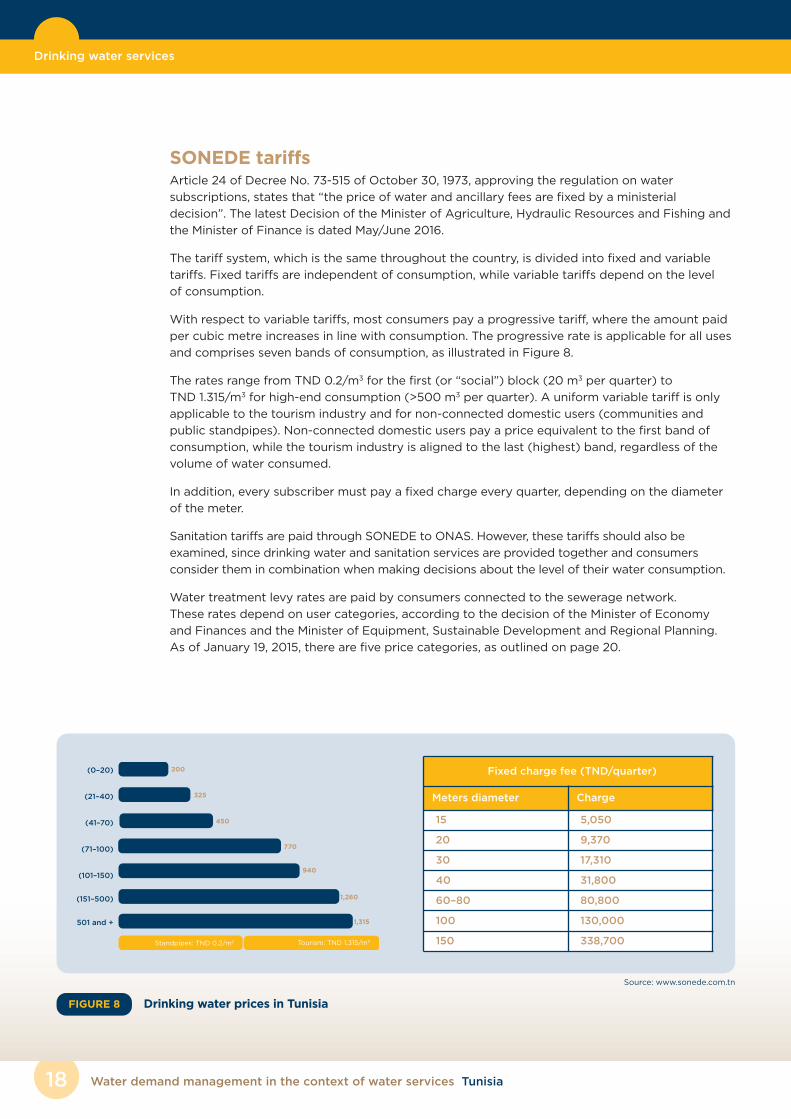
With respect to variable tariffs, most consumers pay a progressive tariff, where the amount paid
per cubic metre increases in line with consumption. The progressive rate is applicable for all uses
and comprises seven bands of consumption, as illustrated in Figure 8.
The rates range from TND 0.2/m3 for the first (or “social”) block (20 m3 per quarter) to
TND 1.315/m3 for high-end consumption (>500 m3 per quarter). A uniform variable tariff is only
applicable to the tourism industry and for non-connected domestic users (communities and
public standpipes). Non-connected domestic users pay a price equivalent to the first band of
consumption, while the tourism industry is aligned to the last (highest) band, regardless of the
volume of water consumed.
In addition, every subscriber must pay a fixed charge every quarter, depending on the diameter
of the meter.
Sanitation tariffs are paid through SONEDE to ONAS. However, these tariffs should also be
examined, since drinking water and sanitation services are provided together and consumers
consider them in combination when making decisions about the level of their water consumption.
Water treatment levy rates are paid by consumers connected to the sewerage network.
These rates depend on user categories, according to the decision of the Minister of Economy
and Finances and the Minister of Equipment, Sustainable Development and Regional Planning.
As of January 19, 2015, there are five price categories, as outlined on page 20.
501 and +
(151–500)
(101–150)
(71–100)
(41–70)
(21–40)
(0–20) 200
325
450
770
940
1,260
1,315
Standpipes: TND 0.2/m3 Tourism: TND 1.315/m3
Drinking water prices in TunisiaFIGURE 8
Fixed charge fee (TND/quarter)
Meters diameter Charge
15 5,050
20 9,370
30 17,310
40 31,800
60–80 80,800
100 130,000
150 338,700
Source: www.sonede.com.tn
19Water demand management in the context of water services Tunisia
Drinking water services
Consumption (million m3)
Consumption band
Usage charge (TND)
variable fixed
0–20 0–20 22 1,500
21–40
0–20 32
1,500
21–40 195
41–70
0–20 207
4,695
21–70 326
71–100
0–70 326
9,225
71–100 540
101–150
0–70 343
9,685
71–150 561
+151
0–70 343
9,970
71+ 693
TABLE 10 Tariffs for domestic consumption, based on consumption band
Usage
Usage fee (TND)
variable fixed
Industrial, with a release meeting discharge standards into the public sewerage system
970 9,950
Industrial, with a release meeting discharge standards into the natural environment
705 9,950
Industrial, with a release exceeding dischargestandards into the public sewerage system
970 + (Q*470) 9,950
Industrial and polluting activities not connectedto the public sewerage system
705 9,950
TABLE 11 Fees for industrial water use
Source: Decision of the Minister of Economy and Finance and the Minister of Equipment, Sustainable Development and Regional Planning of January 19, 2015, establishing the amount for sanitation fees
Source: Decision of the Minister of Economy and Finance and the Minister of Equipment, Sustainable Development and Regional Planning of January 19, 2015, establishing the amount for sanitation fees
Water demand management in the context of water services Tunisia20
Drinking water services
Usage
Usage fee
variable fixed
Commercial, professional and craft non-pollutingactivities with a consumption below 10m3/quarter
660 9,950
Commercial, professional and craft non-pollutingactivities with a consumption exceeding 10m3/quarter
820 9,950
Commercial, professional and craft non-pollutingactivities with a release exceeding dischargestandards into the public sewerage system
970 + (Q*470) 9,950
TABLE 12 Fees for commercial, professional and other water use
Source: Decision of the Minister of Economy and Finance and the Minister of Equipment, Sustainable Development and Regional Planning of January 19, 2015, establishing the amount for sanitation fees
Usage
Usage fee
variable fixed
Non-polluting administrative 970 9,950
Administrative, with a release exceeding discharge standards into the public sewerage
970 + (Q*470) 9,950
TABLE 13 Fees for administrative water use
Source: Decision of the Minister of Economy and Finance and the Minister of Equipment, Sustainable Development and Regional Planning of January 19, 2015, establishing the amount for sanitation fees
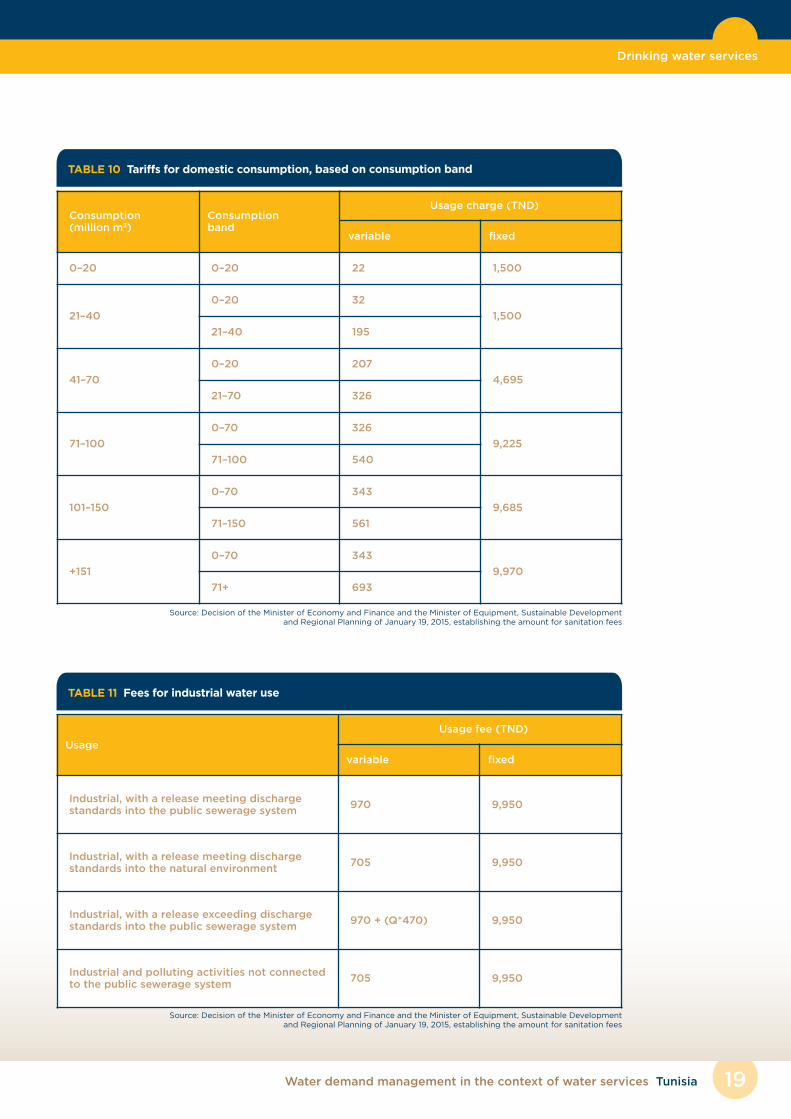
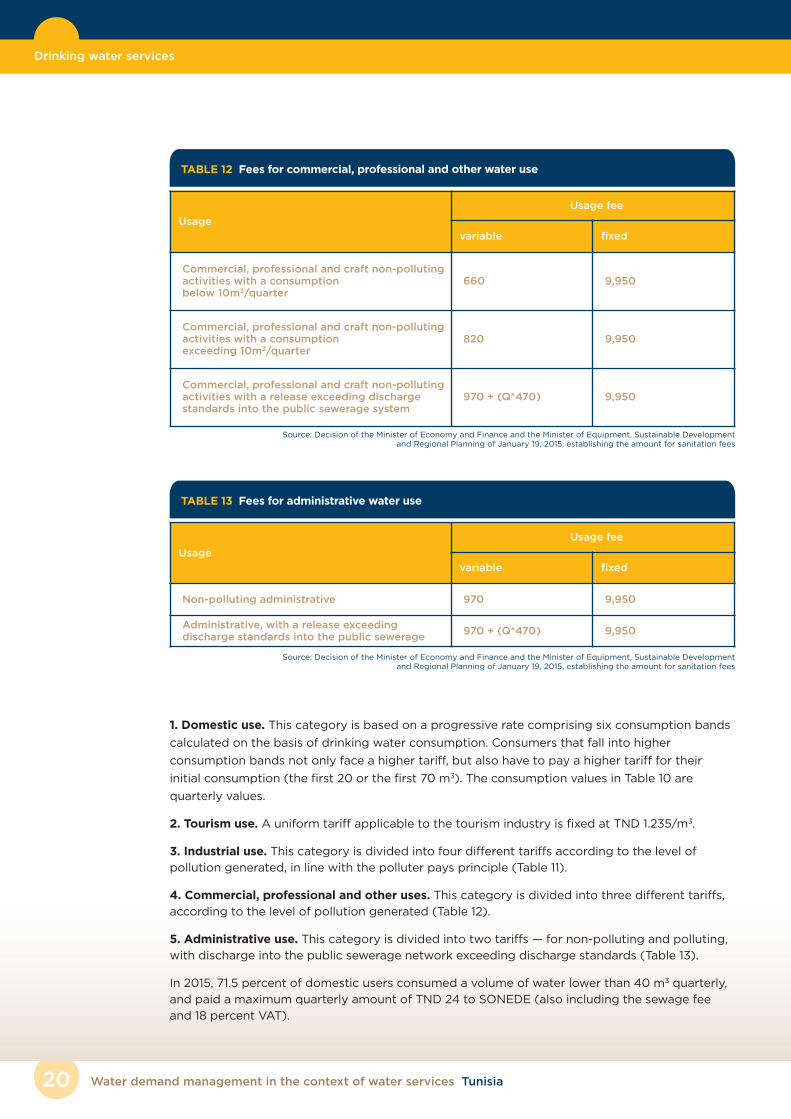
1. Domestic use. This category is based on a progressive rate comprising six consumption bands
calculated on the basis of drinking water consumption. Consumers that fall into higher
consumption bands not only face a higher tariff, but also have to pay a higher tariff for their
initial consumption (the first 20 or the first 70 m3). The consumption values in Table 10 are
quarterly values.
2. Tourism use. A uniform tariff applicable to the tourism industry is fixed at TND 1.235/m3.
3. Industrial use. This category is divided into four different tariffs according to the level ofpollution generated, in line with the polluter pays principle (Table 11).
4. Commercial, professional and other uses. This category is divided into three different tariffs,according to the level of pollution generated (Table 12).
5. Administrative use. This category is divided into two tariffs — for non-polluting and polluting,with discharge into the public sewerage network exceeding discharge standards (Table 13).
In 2015, 71.5 percent of domestic users consumed a volume of water lower than 40 m3 quarterly,
and paid a maximum quarterly amount of TND 24 to SONEDE (also including the sewage fee
and 18 percent VAT).
21Water demand management in the context of water services Tunisia
Drinking water services | Irrigation water use
Services provided by the General Department of Rural Engineering and Water ExploitationAlthough SONEDE legally has a monopoly on the distribution of drinking water throughoutTunisia, in rural areas, which are far from the public drinking water distribution network andwhere settlements are dispersed, the Ministry of Agriculture, Hydraulic Resources and Fishinghas instructed the General Department of Rural Engineering and Water Exploitation to providedrinking water services through the water users’ associations (WUAs). Currently, more than232,000 families are served via the water systems managed by the WUAs. About 1,260 WUAs(out of a total of 3,000) offer drinking water services as well as irrigation water services.
The overall drinking water supply rate in Tunisia is 97.6 percent (2015), an average based on arate of 100 percent in urban areas and 92.6 percent in rural areas, of which 41.4 percent isprovided by the DGGREE.
The price of water charged by the WUAs varies between TND 0.5 and 1.25/m3, depending on thecosts directly borne by the consumers (wages, water transportation, profit margin of the watersellers etc.), which is above the water price paid by SONEDE customers. In rare cases, the pricepaid by WUA users reaches TND 5/m3. Users supplied by the WUAs also face problems relatedto water quality and the continuity of service, especially during the summer, as well as difficultiesaccessing some water points, which may be at some distance from their dwellings.
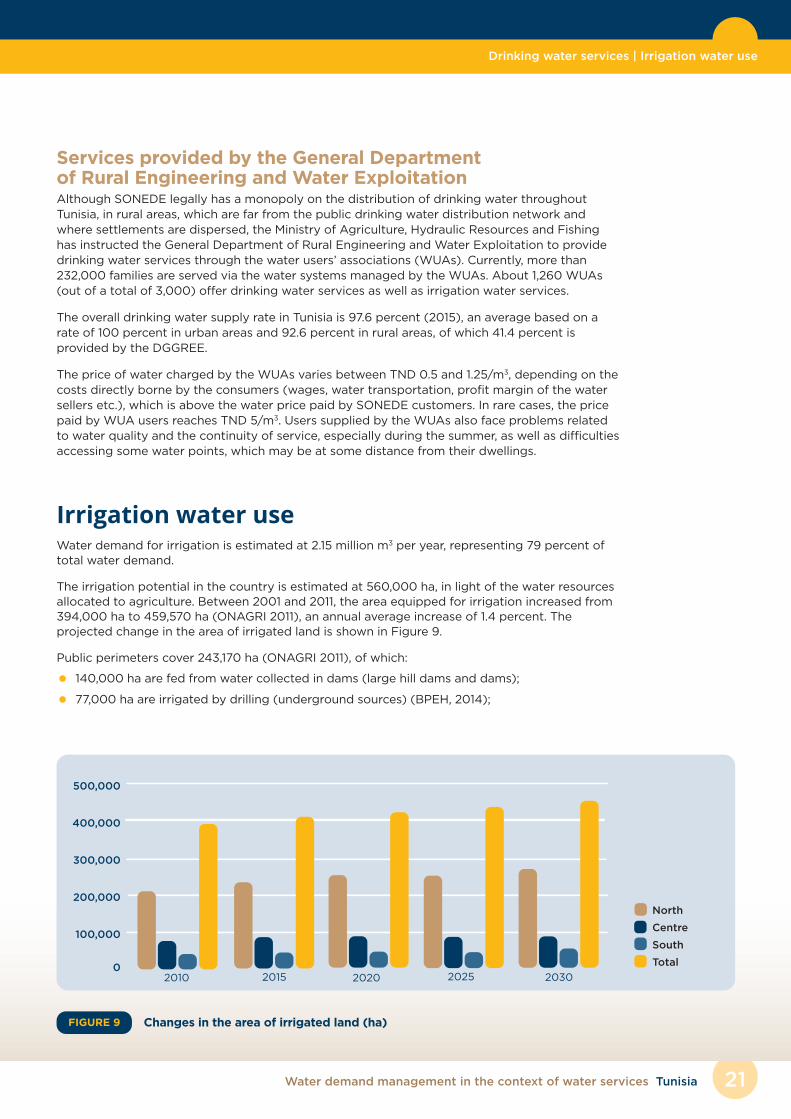
Irrigation water useWater demand for irrigation is estimated at 2.15 million m3 per year, representing 79 percent oftotal water demand.
The irrigation potential in the country is estimated at 560,000 ha, in light of the water resourcesallocated to agriculture. Between 2001 and 2011, the area equipped for irrigation increased from394,000 ha to 459,570 ha (ONAGRI 2011), an annual average increase of 1.4 percent. Theprojected change in the area of irrigated land is shown in Figure 9.
Public perimeters cover 243,170 ha (ONAGRI 2011), of which:
• 140,000 ha are fed from water collected in dams (large hill dams and dams);
• 77,000 ha are irrigated by drilling (underground sources) (BPEH, 2014);
0
100,000
200,000
300,000
400,000
500,000
North
Centre
South
Total
2010 2020 20302015 2025
Changes in the area of irrigated land (ha)FIGURE 9
Water demand management in the context of water services Tunisia22
Irrigation water use
• 9,500 ha from reated wastewater (GWP 2009, quoted by Aquastat); and
• 16,670 ha from unknown sources.
On 216,400 ha of private perimeters, irrigation is carried out by the operators themselves
(ONAGRI 2011), of which:
• 150,000 ha are fed from shallow groundwater;
• 30,000 ha are fed from private deep wells (BPEH 2014); and
• 36,400 ha not known, although certainly including pumping in wadis and more.
The area actually irrigated during the crop year 2010–2011 was evaluated at 379,990 ha, made up
of 188,560 ha of public irrigated perimeters and 191,430 ha of private irrigated areas.
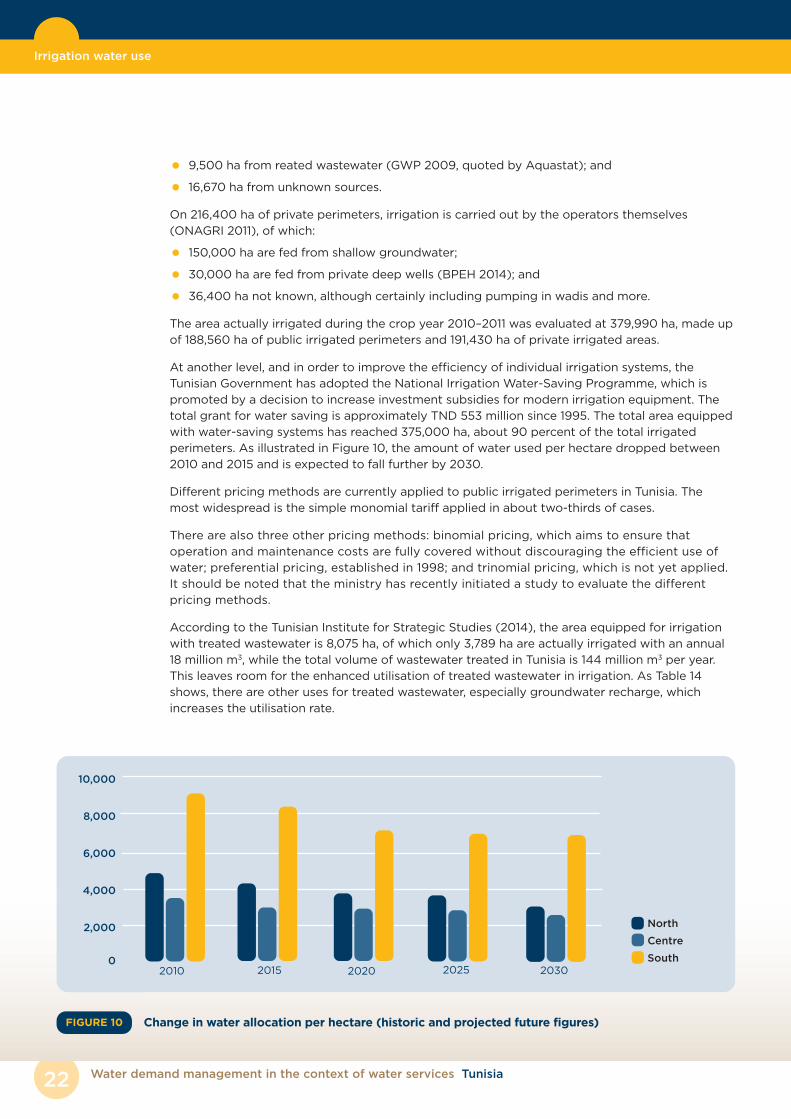
At another level, and in order to improve the efficiency of individual irrigation systems, the
Tunisian Government has adopted the National Irrigation Water-Saving Programme, which is
promoted by a decision to increase investment subsidies for modern irrigation equipment. The
total grant for water saving is approximately TND 553 million since 1995. The total area equipped
with water-saving systems has reached 375,000 ha, about 90 percent of the total irrigated
perimeters. As illustrated in Figure 10, the amount of water used per hectare dropped between
2010 and 2015 and is expected to fall further by 2030.
Different pricing methods are currently applied to public irrigated perimeters in Tunisia. The
most widespread is the simple monomial tariff applied in about two-thirds of cases.
There are also three other pricing methods: binomial pricing, which aims to ensure that
operation and maintenance costs are fully covered without discouraging the efficient use of
water; preferential pricing, established in 1998; and trinomial pricing, which is not yet applied.
It should be noted that the ministry has recently initiated a study to evaluate the different
pricing methods.
According to the Tunisian Institute for Strategic Studies (2014), the area equipped for irrigation
with treated wastewater is 8,075 ha, of which only 3,789 ha are actually irrigated with an annual
18 million m3, while the total volume of wastewater treated in Tunisia is 144 million m3 per year.
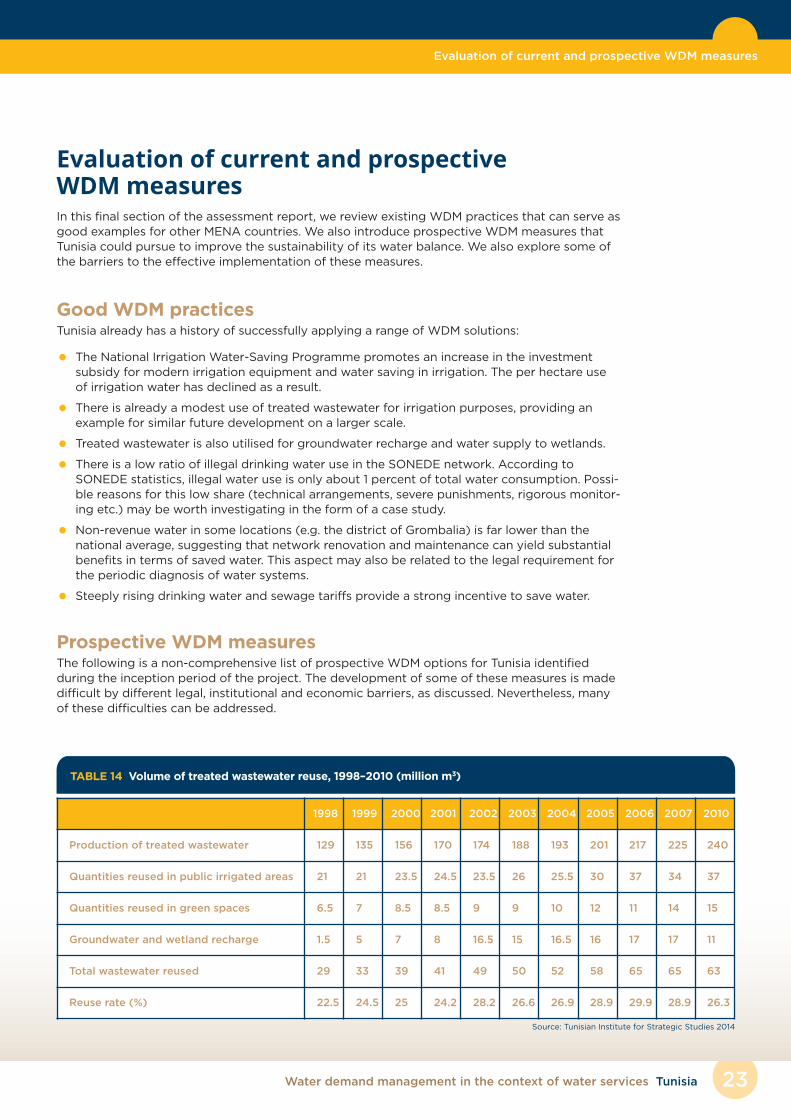
This leaves room for the enhanced utilisation of treated wastewater in irrigation. As Table 14
shows, there are other uses for treated wastewater, especially groundwater recharge, which
increases the utilisation rate.
0
2,000
4,000
6,000
8,000
10,000
North
Centre
South2010 2020 20302015 2025
Change in water allocation per hectare (historic and projected future figures)FIGURE 10
23Water demand management in the context of water services Tunisia
Evaluation of current and prospective WDM measures
Evaluation of current and prospective WDM measuresIn this final section of the assessment report, we review existing WDM practices that can serve asgood examples for other MENA countries. We also introduce prospective WDM measures thatTunisia could pursue to improve the sustainability of its water balance. We also explore some ofthe barriers to the effective implementation of these measures.
Good WDM practicesTunisia already has a history of successfully applying a range of WDM solutions:
• The National Irrigation Water-Saving Programme promotes an increase in the investment subsidy for modern irrigation equipment and water saving in irrigation. The per hectare use of irrigation water has declined as a result.
• There is already a modest use of treated wastewater for irrigation purposes, providing an example for similar future development on a larger scale.
• Treated wastewater is also utilised for groundwater recharge and water supply to wetlands.
• There is a low ratio of illegal drinking water use in the SONEDE network. According toSONEDE statistics, illegal water use is only about 1 percent of total water consumption. Possi-ble reasons for this low share (technical arrangements, severe punishments, rigorous monitor-ing etc.) may be worth investigating in the form of a case study.
• Non-revenue water in some locations (e.g. the district of Grombalia) is far lower than the national average, suggesting that network renovation and maintenance can yield substantialbenefits in terms of saved water. This aspect may also be related to the legal requirement forthe periodic diagnosis of water systems.
• Steeply rising drinking water and sewage tariffs provide a strong incentive to save water.
Prospective WDM measuresThe following is a non-comprehensive list of prospective WDM options for Tunisia identifiedduring the inception period of the project. The development of some of these measures is madedifficult by different legal, institutional and economic barriers, as discussed. Nevertheless, manyof these difficulties can be addressed.
1998 1999 2000 2001 2002 2003 2004 2005 2006 2007 2010
Production of treated wastewater 129 135 156 170 174 188 193 201 217 225 240
Quantities reused in public irrigated areas 21 21 23.5 24.5 23.5 26 25.5 30 37 34 37
Quantities reused in green spaces 6.5 7 8.5 8.5 9 9 10 12 11 14 15
Groundwater and wetland recharge 1.5 5 7 8 16.5 15 16.5 16 17 17 11
Total wastewater reused 29 33 39 41 49 50 52 58 65 65 63
Reuse rate (%) 22.5 24.5 25 24.2 28.2 26.6 26.9 28.9 29.9 28.9 26.3
TABLE 14 Volume of treated wastewater reuse, 1998–2010 (million m3)
Source: Tunisian Institute for Strategic Studies 2014
Water demand management in the context of water services Tunisia24
Evaluation of current and prospective WDM measures | References
• Use of wastewater for irrigation. Some treated wastewater is already used for irrigation, but most wastewater is not utilised directly. Analysing the underlying institutional, economicand perceptual reasons for this may lead to proposals on how to enhance the utilisation oftreated wastewater.
• Investigation of illegal wells used for irrigation. Illegal water abstraction is especially prob-lematic in the south of Tunisia. Enhanced monitoring and dedicated enforcement are neededto curb illegal abstraction.
• Much irrigation water use is based on a simple, one-part tariff. Alternative tariff schemesthat provide greater incentives to save water could be evaluated.
• Network reconstruction to reduce leakage. In some parts of Tunisia, network losses reach 40 to 50 percent. A cost-benefit analysis of network renovation and reconstruction can helpto determine whether the savings associated with reduced leakage would cover the cost ofthe network investment. The problem is especially acute in the south, where network lossesexceed the national average while the cost of producing drinking water is high. Network re-construction can therefore potentially generate the greatest benefit in this region. Lack ofcapital is probably the most important barrier to large-scale network investments.
• Drinking water tariffs.While drinking water tariffs for most users are progressive in design,they are usually not at a level ensuring long-term cost recovery (including the renewal of as-sets). The consequences — in terms of changed consumption and affordability — of a gradualshift toward full cost recovery can be inspected via economic modelling.
• Education and awareness raising. Many water users are not aware of the scarcity of water inTunisia and the options available to them to reduce their consumption. Awareness campaignsmay help to reduce water use.
• Disconnection for unpaid bills. The regulation on disconnection due to unpaid bills is not cur-rently enforced. As a result, consumers do not have a reason to reduce their water consump-tion, since this action does not have consequences in terms of the size of their water bill. Inaddition, SONEDE receives less revenue, reducing the resources available for network mainte-nance and modernisation.
ReferencesAquastat, Food and Agriculture Organization of the UN: www.fao.org
Besbes, M. et al. (2003): “Système Aquifère du Sahara Septentrional: Gestion commune d’un bassintransfrontière”. La Houille Blanche, No. 5-2003.
BPEH (2014): Rapport national du secteur de l’eau. Office of Planning and Hydraulic Balance.
MEWINA/CEDARE/N-AMCOW/AWF (July 2014): Tunisia Water Sector Monitoring and Evaluation RapidAssessment. Monitoring and Evaluation for Water in North Africa/Center for Environment and Developmentfor the Arab Region and Europe/North African Ministers’ Council on Water/African Water Facility.
Ministry of Agriculture, Hydraulic Resources and Fishing (2008): www.agriculture.tn
Official Journal of the Republic of Tunisia
ONAGRI (2011): Statistical Yearbook. Water resources. National Agricultural Observatory of Tunisia.
ONAS: National Sanitation Office, www.onas.nat.tn
OSS: Observatoire du Sahara et du Sahel, www.oss-online.org
SONEDE Statistics Report 2015.
SONEDE website www.sonede.com.tn
Tunisian Institute for Strategic Studies (2014): Système hydraulique de la Tunisie à l’horizon 2030.

watersum.rec.org
The regional project Sustainable Use of Transboundary Water Resources and Water SecurityManagement (WATER SUM) addresses water-related challenges and promotes regional cooperation in the Middle East and North Africa (MENA) through two project components: Water Resources Management Good Practices and Knowledge Transfer (WATER POrT); and Water Security (WaSe). The WATER POrT component focuses on building skills and transferringknowledge on integrated water resources management in order to promote sustainable development and climate adaptation. The WaSe component supports the introduction of local water security actionplans to help communities withstand asset scarcity and tackle environment-related conflicts.
The overall objective of the WATER SUM project is to promote and enhance the sustainability of managing water resources in beneficiary countries in the MENA region in order to halt the downward spiral of poverty and to reduce biodiversity loss and environmental degradation. The main expected impact is institutional and behavioural change in water governance and utilisationpatterns. This will be achieved through the successful transfer of knowledge and skills to all participating actors in the water management arena. Additional impacts related to improving water security are also significant in terms of overall environmental security. It is therefore vital to build partnerships in order to address environmental asset scarcity, environmental risks or adverse changes, and environment-related tensions or conflicts, as this is the most effective means for delivering development and conservation targets to local communities and beyond.
The WATER SUM project brings high added value, as it provides beneficiary countries with a structured opportunity to boost their development, share new methods for improved water management, improve planning at all levels of governance, and address unemployment and poverty.
Project duration: April 2014 – April 2017Total project budget: EUR 6 million
CONTACTS
Mihallaq Qirjo • Project Director • [email protected] Ignjatovic • Project Manager • [email protected] Environmental Center for Central and Eastern Europe (REC)Ady Endre ut 9–11 • 2000 Szentendre • Hungary Tel: +36 26 504 000 • Fax: +36 26 311 294 The REC is an international organisation with a mission to assist in addressing environmental issues. The REC fulfils this missionby promoting cooperation among governments, non-governmental organisations, businesses and other environmentalstakeholders, and by supporting the free exchange of information and public participation in environmental decision making.
The WATER SUM project is financed by the Government of Sweden and implemented by the REC.


