WATER DEMAND PROJECTIONS EAST SIDE WATER TREATMENT SUPPLY PLANNING AND PROJECT DEVELOPMENT Madison Water Utility Madison, Wisconsin 119 East Olin Avenue Madison, WI 53713 Black & Veatch Corporation B&V Project 169092.0100 B&V File 41.0100 Black & Veatch Corporation 225 E. Mason Street, Suite 801 Milwaukee, Wisconsin 53202 January 21, 2011
Transcript
WATER DEMAND PROJECTIONS EAST SIDE WATER TREATMENT SUPPLY PLANNING AND PROJECT DEVELOPMENT
Madison Water Utility Madison, Wisconsin 119 East Olin Avenue Madison, WI 53713
Black & Veatch Corporation B&V Project 169092.0100 B&V File 41.0100
Black & Veatch Corporation 225 E. Mason Street, Suite 801 Milwaukee, Wisconsin 53202
January 21, 2011
Technical Memorandum MADISON WATER UTILITY Water Demand Projections January 21, 2011
2. Study Area ............................................................................................................................................ 4
Technical Memorandum MADISON WATER UTILITY Water Demand Projections January 21, 2011
BLACK & VEATCH Project 169092.0100 Page 4
1. BACKGROUND The Madison Water Utility (MWU) is developing a plan to continue to provide a reliable supply of high quality water cost effectively to the City of Madison’s (City’s) Zone 6 - East Service Area. The Zone 6 - East Service Area is served by six wells including Unit Well Nos. 7, 8, 9, 11, 13, 15, 23, 25 and 29. As part of the East Side Water Supply Planning and Project Development Project (East Side Project), the purpose of this memorandum is to:
Discuss conservation planning for the MWU and how it compares to other similar communities
Document the assumptions used in developing and updating water demand projections and peaking factors for the MWU for Design Years 2010, 2015, 2030 and Buildout.
Compare projected demands with existing available water supply.
2. STUDY AREA The study area for this project is the City’s East Service area including service zones 1, 3, 4, 5, and 6E. For the water demand projections, however, the boundary is the same as the 2006 Master Plan. The study areas referenced in this document are shown in Attachment A at the end of this memo and include the following:
The City of Madison
The Village of Maple Bluff (Maple Bluff)
The Village of Shorewood Hills (Shorewood Hills)
The Town of Madison
Growth areas described in the City’s 2005 Comprehensive Plan.
East Service Area
3. CONSERVATION Traditionally the north Midwestern United States has had abundant water supplies for municipal use and conservation has not been a priority. However, growing demand for water supply is beginning to put a strain on water resources and affect water quality. In addition, a growing understanding of the cost of wasteful water use including: capital improvements, water treatment, and declining water quality as a result of over pumping are prompting many communities to place an increased emphasis on conservation. Although indoor water usage tends to be fairly stable throughout the year, outdoor water demand varies significantly seasonally and responds directly to weather patterns. Crediting only conservation without taking climatic trends into account for an overall reduction in water demand in the past 5 years may be pre-mature due to the wet cool summer weather pattern that has been prevalent in the Madison area. It is difficult to quantify the success of conservation efforts based on the total demand in the short-term since typically outdoor water demands vary
Technical Memorandum MADISON WATER UTILITY Water Demand Projections January 21, 2011
BLACK & VEATCH Project 169092.0100 Page 5
considerably from year to year in response to temperatures and rainfall. Water demands will continue to be monitored over the next decade to evaluate overall conservation success.
3.1. MWU Conservation Efforts Water conservation is not a new concept to MWU. Water conservation in Madison has a tradition reaching back more than 30 years to appropriate water use control techniques including but not limited to: metered water usage for all customers, leak detection and abatement programs, and an outdoor water use restriction ordinance (to control water use during emergency conditions). As a result, the City has relatively low per capita water use and water loss rates. In response to declining aquifer levels, impacts of well pumping on surface water features, and a desire to preserve the aquifer for generations to come, MWU adopted a Water Conservation and Sustainability Plan (Conservation Plan) in 2008. The Plan has a primary goal of maintaining the current annual rate of groundwater withdrawal in existing areas and secondary goals of:
Residential: reduce residential water use by 20 percent by 2020 to an average use of 58 gallons per capita per day
Commercial: promote water conservation through rebate promotions and education.
Industrial: develop a water conservation plan for each industrial customer.
Municipal: enact water savings programs for all government buildings that support the primary goal.
Interest in conservation has been in response to numerous factors including: reducing the need for adding additional or maintaining existing well capacity to the system, declining aquifer levels, impacting surface water features, contaminant transport, and the potential of declining water quality. In addition, there is a growing public awareness and demand for using natural resources in a sustainable manner. Water conservation not only saves water, it also reduces chemical usage and can provide a significant energy savings to a utility. Ultimately water conservation reduces MWU’s overall carbon footprint. To be successful conservation efforts are implemented as a combination of public education, institutional regulations, monetary incentives and physical changes which results in a change in water use patterns within the general public. In its Conservation Plan, MWU outlined the recommendations summarized in Table 1. In order to reduce residential usage by 20 percent, MWU will need to reduce the per capita usage from a 2002 – 2006 average of 73 gallons per capita per day (gpcd) to 58 gpcd (about 15 gpcd). Based on information from Handbook of Water Use and Conservation: Homes, Landscapes, Industries, Businesses, Farms (Amy Vickers, 2001) changing from standard toilets to high efficiency toilets will reduce water usage by approximately 10.3 gpcd, which is one of the easiest and most effective indoor water use conservation steps.
Table 1 - MWU Conservation Recommendations
Recommendation 1 Description Priority
Residential
High efficiency toilets MWU implemented a $100 per household and apartment rebate program to replace old toilets with high efficiency “Water Sense” toilets
10/082
Install an Advanced Metering Infrastructure (AMI)billing
Install an AMI-system and start monthly billing. Short Term3
Technical Memorandum MADISON WATER UTILITY Water Demand Projections January 21, 2011
BLACK & VEATCH Project 169092.0100 Page 6
Table 1 - MWU Conservation Recommendations
Recommendation 1 Description Priority
system
Provide customers with current consumption data through the AMI system
Instruct customers on tracking their water usage through meter reading.
Short Term3
Inclining rate structure Change the MWU rate structure to an inverted rate structure to reward low water usage and penalize high water usage
Short Term
Outdoor Water Usage Restrictions
Restrict outdoor water usage when pumping exceeds 50 mgd for 2 consecutive days.
Short Term
Residential water audit program
Allow individual residential customers to request an on-site or individual water audit of their home.
Long Term
High efficiency washing machines/dishwashers
Develop a financial incentive program for washing machines and dishwashers similar to the Utility’s toilet rebate program
Long Term
Industrial
Water Conservation Plans Perform individual audits and develop water conservation plans for industrial customers
Short Term
Commercial
Education Target high-use customers with education/ outreach to promote water conservation
Short Term
Landscaping ordinance Enact landscaping ordinance with water limiting requirements and drought resistant plantings for new development/major redevelopment
Intermediate
Appliance Upgrade Program Develop appliance upgrade program for heavy water use commercial clients
Long Term
Certification Program Develop a certification program for water-efficient buildings
Long Term
Car Wash Reclamation Ordinance
Enact an ordinance requiring car washes to use water reclamation.
Long Term
Municipal
Quantify Water Use Improve record keeping to quantify water use for municipal accounts
Short Term
Minimize Reservoir Dumping Improve operational control of water reservoirs to minimize dumping
Short Term
Leak-Detection Program Expand leak detection program to identify and correct leaks
Short Term
Water Utility Bill Upgrade water utility billing with new software Short Term
Meter Raw Water Pumping Install use meters in well buildings Intermediate
Water Conservation Plans Perform individual audits and develop water conservation plans for other government buildings
Intermediate
Reduce Hydrant Flushing Reduce the Utility’s annual unidirectional flushing program as well filters are installed, operational changes are implemented and overall water quality in the distribution system is improved
Short term to Intermediate
1 Recommendations from the Conservation Plan, Summary of Conservation Goals Table.
Technical Memorandum MADISON WATER UTILITY Water Demand Projections January 21, 2011
BLACK & VEATCH Project 169092.0100 Page 7
Table 1 - MWU Conservation Recommendations
Recommendation 1 Description Priority
2 Recommendation has been implemented by MWU. 3 Madison will begin implementing a two-year AMI program in 2011 which will allow the Utility to move to monthly billing.
As MWU implements the Conservation Plan recommendations, the overall effectiveness of the program will be evaluated and the program will be refined and expanded as needed.
3.2. Conservation Efforts in Other Northern North American Communities Although MWU has seen a reduction in water demands in the last couple of years, due to recent weather patterns, it is too early to evaluate the long-term effectiveness of the conservation program. For comparison, other northern mid-sized cities with established conservation programs and published results were selected and evaluated. Table 2 summarizes the conservation results from these communities. The MWU Conservation Plan includes recommendations similar to other communities. Based on the City’s historic demand rates and these examples, it will likely be challenging for Madison to achieve its 20 percent residential demand reduction goal by 2020.
Technical Memorandum MADISON WATER UTILITY Water Demand Projections January 21, 2011
BLACK & VEATCH Project 169092.0100 Page 8
Table 2 - Comparison of Conservation Programs
for Northern North American Communities
Utility Start Year
Programs Estimated Reduction in
Water Demand
Lincoln, NE1 1988 Increasing block rate structure
Public Education
7 %
Waterloo, Ontario2 Early
1980s Toilet retrofit
Water efficient shower heads
13 %
Wichita, KS3 1990s Toilet retrofit
2 day per week watering
School education program
Proposed increasing block rate structure
13% (projected)
Barrie, Ontario4 1994 Toilet retrofit
Water efficient shower heads
7 % (16.5 gpcd)
Waukesha, WI5 2006 Toilet retrofit
Daytime irrigation ban
2 day per week watering restriction
School education program
Proposed increasing block rate structure
11%
1 From www.lincoln.ne.gov/city/pworks/water/conserve/ and 2007 Facilities Master Plan Update
(Black & Veatch, 2009). 2 From Regional Case Studies: Best Practices for Water Conservation in the Great Lakes-St.
Lawrence Region (Great Lakes Commission, June 2004) 3 From “IRP: A Case Study From Kansas,” Journal of the American Water Works Association 87,
No. 6 (June1995): pp.57-71. 4 From Cases in Water Conservation: How Efficiency Programs Help Water Utilities Save Water
and Avoid Costs (United States Environmental Protection Agency, 2002). 5 From “Waukesha, WI Promotes Water Conservation, Environmentally Responsible Water
Supply Planning” by Mayor Larry Nelson, U.S. Mayor Newspaper, March 23, 2009 and “Proposed Waukesha Water Rates Encourage Conservation” by Lisa Kaiser, www.expressmilwaukee.com, Wednesday, May 20, 2009.
4. POPULATION AND EMPLOYMENT Population and employment are important factors in evaluating existing water usage and projecting future water usage. Population and employment data by Traffic Analysis Zone (TAZ) are also used to develop an understanding of the spatial component (geography) of demands.
4.1. Historical, Existing, and Future Service Population Estimates of existing service population were developed from Dane County TAZ projections and census estimates obtained from the Wisconsin Demographic Service Center and compared.
Technical Memorandum MADISON WATER UTILITY Water Demand Projections January 21, 2011
BLACK & VEATCH Project 169092.0100 Page 9
4.1.1 Methodology 1 –Demographic Service Center The State of Wisconsin – Department of Administration Demographic Service Center (www.doa.state.wi.us) develops annual total population estimates for counties, towns, cities, and villages. Population estimates by year for the City, Maple Bluff, Shorewood, and the Town of Madison were obtained. In addition, to the incorporated areas served by MWU, there are approximately 8,000 customers located in unincorporated areas, called expansion areas. The Demographic Service Center does not provide employment information. Table 3 summarizes the historical population using this approach.
2010 5,923 228,200 1,384 1,701 8,000 245,208 1 Estimated population as of January 1
st of the indicated year.
2 Expansion population was assumed and held constant based on a review of the 2006 Master
Plan demographic data 3 2000 United States Census Results.
4.1.2 Methodology 2 – Interpolation of TAZ Data The Madison Area Transportation and Planning Board provided population and employment data by TAZ for years 2000, 2030, and 2035. The advantage of the TAZ data is that it provides not only a total service area population, but also provides information on the spatial distribution of the population and employment. TAZ data was combined with current city limit and anticipated service area boundaries to develop the population and employment projections for the service area. Linear interpolation was used between 2000 and 2035 to determine intermediate year values. This data is summarized on Table 4. Since the 2005 Comprehensive Plan developed by the Planning Department of the City of Madison is still in effect, there has been no change in the long-term land use projection. The buildout projections from the 2006 Water Master Plan have not changed and are still appropriate for use.
Projection 2 East Side Area population and employment are still being developed.
3 Madison Water Utility Plan (Black & Veatch, December 2008), Table 2-5 and
Table 2-15
The two approaches are shown graphically on Figure 1. Methodology 2 produces a population projections that is less than one percent higher (about 1,000 people) than projections from the Demographic Services Center. Because the TAZ projections are similar to the Demographic Services Center projections and also provide employment information and spatial distribution of population, Methodology 2 will be used for estimating existing population and employment.
Figure 1 - Population Methodology Comparison
Technical Memorandum MADISON WATER UTILITY Water Demand Projections January 21, 2011
BLACK & VEATCH Project 169092.0100 Page 11
Attachment B includes detailed information on population and employment by TAZ (and neighborhood for the East Side) along with a map identifying the TAZ locations.
Technical Memorandum MADISON WATER UTILITY Water Demand Projections January 21, 2011
BLACK & VEATCH Project 169092.0100 Page 12
5. WATER DEMANDS Projected water demands are developed from existing water demands and the anticipated impact of growth and conservation on the demand.
5.1. Definitions and Usage A water utility must be able to supply water at rates that fluctuate over a wide range. Yearly, seasonally, monthly, weekly, daily, and hourly variations in water demand occur in all water systems, with higher water use typically occurring during hot, dry weather due to increased outdoor use. Water use rates follow a daily (diurnal) pattern that will vary by season and day of the week. Water demand is typically lowest at night and greatest in the early morning and late afternoon. The importance of the key demand rates to the hydraulic design and operation of a water supply and distribution system are as follows:
Average Day (AD) Demand: The AD demand rate is used primarily as the basis from which to estimate maximum day (MD) and maximum hour (MH) demands. The AD rate is also used to estimate future revenues and operating costs. The AD demand rate is calculated as the total volume of water used during the year, divided by the number of days in the year.
Summer Demand (SD): This gives insight into the additional pumping required in the summer and the amount of water used in outdoor applications. It is calculated as the water volume used during the highest 3 months of pumping divided by 90.
Maximum 30 Day (M30D) Demand: Also called maximum month, the average rate of use during the M30D is a good indicator of the period in which the MD use rate will be found. It also indicates the season of elevated use over a prolonged period, which is used to evaluate the ability of the source of supply to yield adequate quantities of water over extended periods. It is calculated as the maximum volume of water used in a single month divided by 30.
Maximum 10 Day (M10D) Demand: The M10D is the average rate of use during the maximum 10 day period. It is calculated as the maximum value of water used in a 10 day period divided by 10. The M10D demand will be used in hydraulic modeling efforts in future tasks of this project. This demand level is typically indicative of what happens when the system is highly stressed and serves to demonstrate the water systems ability to meet MWUs level of service.
Maximum 7 Day (M7D) Demand: The M7D is the average rate of use during a maximum 7 day period. It is calculated as the maximum value of water used in a 7 day period divided by 7.
Maximum Day: The MD rate is used to size water supply and treatment facilities, and booster pumping stations when equalization storage is properly sized. The MD demand distribution is combined with fire flow demand at selected locations to assess the maximum hydraulic capacity of the distribution system to satisfactorily serve required fire demand. It is calculated as the maximum volume of water used during a single day of the year.
Technical Memorandum MADISON WATER UTILITY Water Demand Projections January 21, 2011
BLACK & VEATCH Project 169092.0100 Page 13
Maximum Hour: Since minimum distribution system pressures are usually experienced during MH, the sizes and locations of distribution facilities are generally determined on the basis of this condition. MH water requirements are partially met through the use of strategically located system storage. The use of system storage minimizes the required capacity of transmission mains and permits a more uniform and economical operation of the water supply, treatment, and pumping facilities. It is calculated as the maximum volume of water used during a single hour, multiplied by 24 hours.
Minimum Day (MinD): Minimum day usage is becoming increasingly significant relative to issues of water quality in the distribution system. It is the basis for evaluating the maximum water age in the distribution system, which coincides with greatest degradation of water quality. It is calculated at the minimum volume of water used during a single day.
5.2. Historical Water Demands Historical water production and water billing data was used in combination with population and employment to develop an understanding of historical water use in the Service Area.
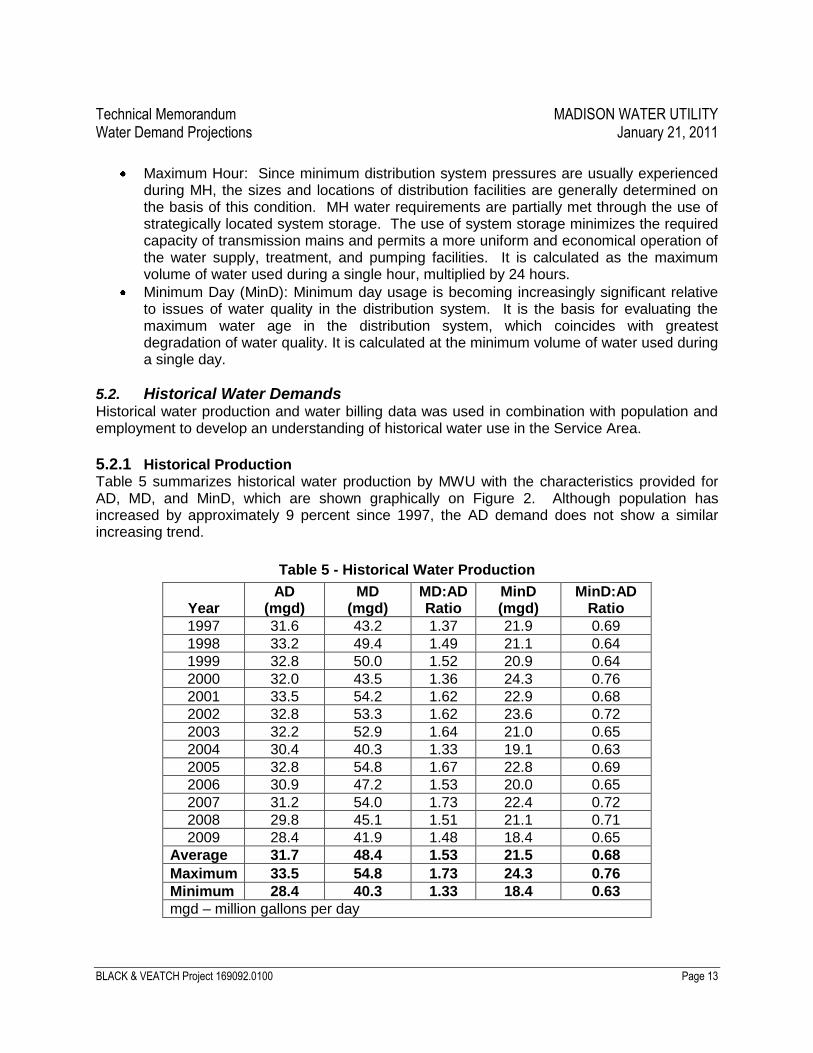
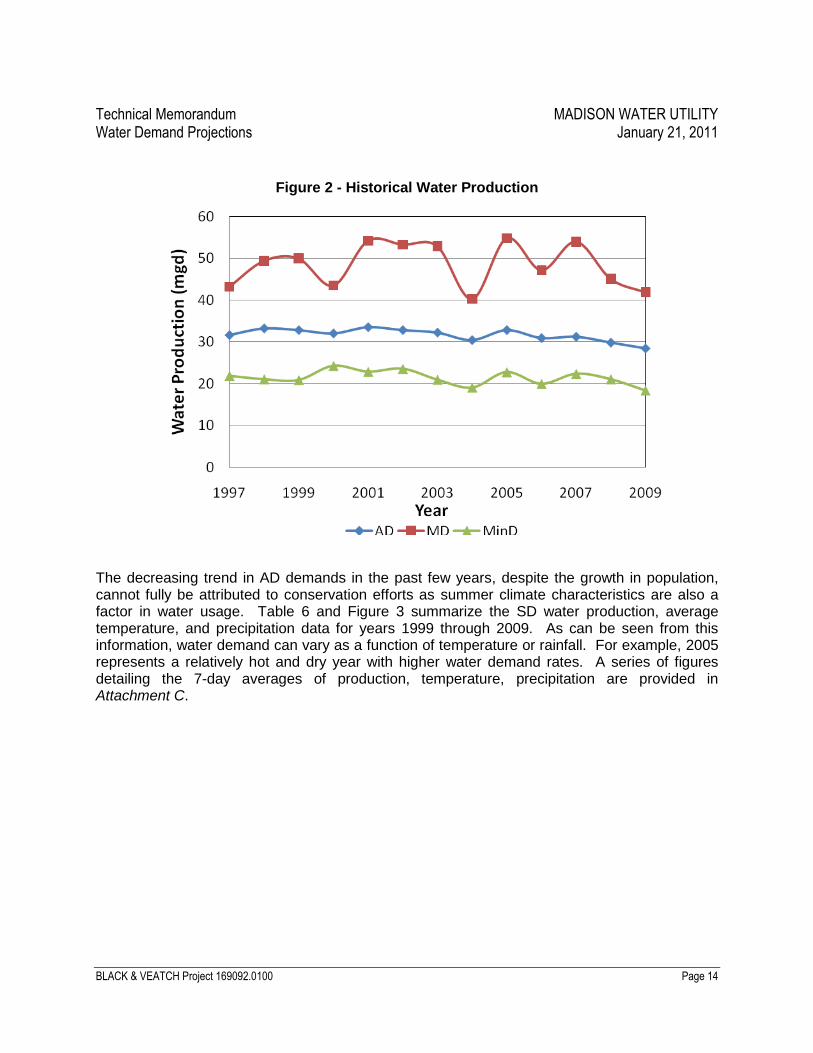
5.2.1 Historical Production Table 5 summarizes historical water production by MWU with the characteristics provided for AD, MD, and MinD, which are shown graphically on Figure 2. Although population has increased by approximately 9 percent since 1997, the AD demand does not show a similar increasing trend.
Table 5 - Historical Water Production
Year AD
(mgd) MD
(mgd) MD:AD Ratio
MinD (mgd)
MinD:AD Ratio
1997 31.6 43.2 1.37 21.9 0.69
1998 33.2 49.4 1.49 21.1 0.64
1999 32.8 50.0 1.52 20.9 0.64
2000 32.0 43.5 1.36 24.3 0.76
2001 33.5 54.2 1.62 22.9 0.68
2002 32.8 53.3 1.62 23.6 0.72
2003 32.2 52.9 1.64 21.0 0.65
2004 30.4 40.3 1.33 19.1 0.63
2005 32.8 54.8 1.67 22.8 0.69
2006 30.9 47.2 1.53 20.0 0.65
2007 31.2 54.0 1.73 22.4 0.72
2008 29.8 45.1 1.51 21.1 0.71
2009 28.4 41.9 1.48 18.4 0.65
Average 31.7 48.4 1.53 21.5 0.68
Maximum 33.5 54.8 1.73 24.3 0.76
Minimum 28.4 40.3 1.33 18.4 0.63
mgd – million gallons per day
Technical Memorandum MADISON WATER UTILITY Water Demand Projections January 21, 2011
BLACK & VEATCH Project 169092.0100 Page 14
Figure 2 - Historical Water Production
The decreasing trend in AD demands in the past few years, despite the growth in population, cannot fully be attributed to conservation efforts as summer climate characteristics are also a factor in water usage. Table 6 and Figure 3 summarize the SD water production, average temperature, and precipitation data for years 1999 through 2009. As can be seen from this information, water demand can vary as a function of temperature or rainfall. For example, 2005 represents a relatively hot and dry year with higher water demand rates. A series of figures detailing the 7-day averages of production, temperature, precipitation are provided in Attachment C.
Technical Memorandum MADISON WATER UTILITY Water Demand Projections January 21, 2011
BLACK & VEATCH Project 169092.0100 Page 15
Table 6 - Summer Production vs. Climate Data
Year
Summer 1 Demand
(mgd)
Average Summer 1
Temperature (˚F)
Summer 1 Rainfall (inches)
1999 38.2 67 9.6
2000 35.8 67 9.1
2001 39.4 67 16.1
2002 40.0 69 7.8
2003 39.3 68 9.1
2004 33.5 66 11.0
2005 39.8 70 7.1
2006 35.7 67 13.0
2007 37.4 69 20.3
2008 35.1 68 9.3
2009 32.2 67 8.6
Average 36.9 68 11.0
Maximum 40.0 70 20.3
Minimum 32.2 66 7.1 1 Data from July - September
Figure 3 - Water Production and Climate Influence
Technical Memorandum MADISON WATER UTILITY Water Demand Projections January 21, 2011
BLACK & VEATCH Project 169092.0100 Page 16
Figure 3 seems to indicate that there is no obvious direct correlation between cumulative summer rainfall (labeled on the secondary y-axis) and summer demand. Other summer precipitation factors may impact summer water demand such as time of rainfall or other unidentified spring climatic conditions. It appears that there may be a correlation between summer demand and average summer temperature. In any case, historical water demand records indicate a significant variation in summer demands due to climate influences. Making long term water demand projections based on short term trends may not be appropriate.
5.2.2 Non-Revenue Water In addition to billed water use, there is an unaccounted-for (or non-revenue) water component. Non-revenue water is defined as the difference between total water production and metered sales. The American Water Works Association (AWWA) Manual 36 – Water Audits and Loss Control Programs (Third Edition 2009) identifies two types of non-revenue water, real losses and apparent losses. Real losses include incidents where the water is never put to a beneficial use, such as pipeline leaks and tank overflow spills. Apparent losses include losses related to meter inaccuracies and non-metered water use, such as system flushing, fire fighting, or unauthorized connections.
As shown in Table 7, estimated non-revenue water in the MWU system varies between 6.9 and 12.8 percent. This is within industry standards for a well operated water distribution system. The average non-revenue water of 10 percent will be assumed for future water production projections. The implementation of AMI and monthly billing is anticipated to produce more accurate estimates of non-revenue water. It is expected that non-revenue water in the MWU system will decrease with the implementation of AMI.
Table 7 - Historical Non-Revenue Water
Year Non-Revenue Water
(mgd) Non-Revenue
Water (percent)
1997 3.1 9.7
1998 3.3 9.9
1999 2.4 7.2
2000 2.9 8.9
2001 3.9 11.7
2002 3.7 11.1
2003 3.5 10.8
2004 3.4 11.1
2005 4.2 12.8
2006 2.2 6.9
2007 3.4 10.7
2008 3.1 10.4
2009 2.2 7.6
Average 3.2 9.9
Maximum 4.2 12.8
Minimum 2.2 6.9
Technical Memorandum MADISON WATER UTILITY Water Demand Projections January 21, 2011
BLACK & VEATCH Project 169092.0100 Page 17
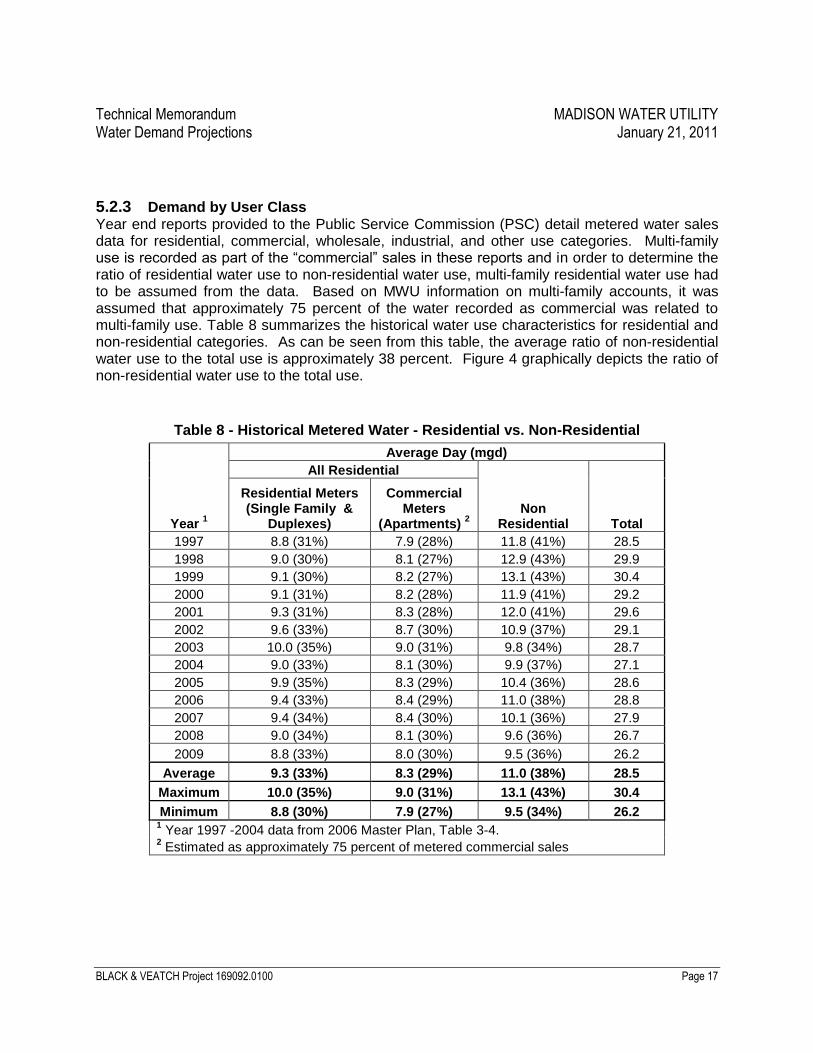
5.2.3 Demand by User Class Year end reports provided to the Public Service Commission (PSC) detail metered water sales data for residential, commercial, wholesale, industrial, and other use categories. Multi-family use is recorded as part of the “commercial” sales in these reports and in order to determine the ratio of residential water use to non-residential water use, multi-family residential water use had to be assumed from the data. Based on MWU information on multi-family accounts, it was assumed that approximately 75 percent of the water recorded as commercial was related to multi-family use. Table 8 summarizes the historical water use characteristics for residential and non-residential categories. As can be seen from this table, the average ratio of non-residential water use to the total use is approximately 38 percent. Figure 4 graphically depicts the ratio of non-residential water use to the total use.
Table 8 - Historical Metered Water - Residential vs. Non-Residential
Year 1
Average Day (mgd)
All Residential
Non Residential Total
Residential Meters (Single Family &
Duplexes)
Commercial Meters
(Apartments) 2
1997 8.8 (31%) 7.9 (28%) 11.8 (41%) 28.5
1998 9.0 (30%) 8.1 (27%) 12.9 (43%) 29.9
1999 9.1 (30%) 8.2 (27%) 13.1 (43%) 30.4
2000 9.1 (31%) 8.2 (28%) 11.9 (41%) 29.2
2001 9.3 (31%) 8.3 (28%) 12.0 (41%) 29.6
2002 9.6 (33%) 8.7 (30%) 10.9 (37%) 29.1
2003 10.0 (35%) 9.0 (31%) 9.8 (34%) 28.7
2004 9.0 (33%) 8.1 (30%) 9.9 (37%) 27.1
2005 9.9 (35%) 8.3 (29%) 10.4 (36%) 28.6
2006 9.4 (33%) 8.4 (29%) 11.0 (38%) 28.8
2007 9.4 (34%) 8.4 (30%) 10.1 (36%) 27.9
2008 9.0 (34%) 8.1 (30%) 9.6 (36%) 26.7
2009 8.8 (33%) 8.0 (30%) 9.5 (36%) 26.2
Average 9.3 (33%) 8.3 (29%) 11.0 (38%) 28.5
Maximum 10.0 (35%) 9.0 (31%) 13.1 (43%) 30.4
Minimum 8.8 (30%) 7.9 (27%) 9.5 (34%) 26.2 1 Year 1997 -2004 data from 2006 Master Plan, Table 3-4.
2 Estimated as approximately 75 percent of metered commercial sales
Technical Memorandum MADISON WATER UTILITY Water Demand Projections January 21, 2011
BLACK & VEATCH Project 169092.0100 Page 18
Figure 4 - Historical Non-residential Usage
5.2.4 Large Users Large water users, industrial and commercial (ICI) customers that use more than 100,000 gpd on an average basis, make up nearly 75 percent of the total non-residential demand. These include the University of Wisconsin, Oscar Mayer Foods, hospitals, government entities, and wholesale customers. Table 9 summarizes large user demands over the last 10 years. Generally a large water user’s demand is fairly consistent. The University of Wisconsin – Madison has been actively pursuing water conservation for the last few years and has seen a significant decrease in demand since 2002. In addition to water demands for the University buildings, there is also a Cogeneration Facility on campus that typically uses cooling water from Lake Mendota, but could put a demand as large as 2 mgd on the system during a drought when lake levels are inadequate to supply cooling water. The wholesale customers: Shorewood Hills and Maple Bluff see a more significant change from year to year, which is likely because their service area is primarily residential customers with variable seasonal demands. In the distribution system computer model, large user demands will be point loaded so that the model properly handles these usually large demands. It is assumed that large user demand will be reduced in the future consistent with other non-residential water conservation efforts.
Technical Memorandum MADISON WATER UTILITY Water Demand Projections November 22, 2010 Draft
BLACK & VEATCH Project 169092.0100 Page 19
Table 9 - Existing Largest Water Customers
Water Customer AD Demand (mgd)
20001 2001
1 2002
1 2003
1 2004
1 2005
1 2006 2007 2008
2 2009
2 Average
University of Wisconsin3 4.18 4.15 4.02 3.74 3.72 3.00 3.25 2.78 2.96 2.78 3.46
5 Village of Shorewood Hills experienced a large system leak in 2002. Average does not include 2002 data.
6 Village of Maple Bluff had very high usage in 2006. Average does not include 2006 data.
Technical Memorandum MADISON WATER UTILITY Water Demand Projections January 21, 2010 Draft
BLACK & VEATCH Project 169092.0100 Page 20
5.2.5 Historical Unit Demands In order to determine the appropriate residential unit demand and determine the sensitivity of the assumptions related to the multi-family usage, two methodologies were used to compare residential unit demand results.
The first methodology was based on the assumptions from the 2006 Master Plan. The residential usage (single family and duplexes) was used in conjunction with the number of residential metered accounts and an assumed housing density to determine a residential per-capita unit water use. This data is shown in Table 10 and is only representative of single-family and duplex residential use. The housing density used in this table beginning at 2.43 persons per household for year 1997 with a decreasing trend is based on the City 2005 Comprehensive Plan, Volume I where the data shows that in 2000 the single-family household density is 2.4 persons per household and has been declining at a rate of .01 persons per year since 1980. The limitation of this methodology is that it only provides information on the residential unit usage for single-family and duplex use and it is also highly dependent upon the household density assumptions.
Table 10 - Unit Residential Water Use Calculations (Method 1)
Year
Average Residential
Metered Use (mgd)
Number of Residential
Metered Accounts
Single Family
Housing Density
1
Calculated Residential
Metered Population
Per-Capita Residential Water Use
(gpcd)
1997 8.8 46,944 2.43 114,100 77.3
1998 9.0 47,513 2.42 115,000 78.0
1999 9.1 48,143 2.41 116,000 78.3
2000 9.1 49,029 2.4 117,700 77.3
2001 9.3 50,033 2.39 119,600 77.5
2002 9.7 51,250 2.38 122,000 78.8
2003 10.0 52,391 2.37 124,200 80.3
2004 9.0 53,454 2.36 126,200 71.6
2005 9.9 53,454 2.35 125,600 78.9
2006 9.4 55,270 2.34 129,300 72.7
2007 9.4 55,730 2.33 129,900 72.2
2008 9.0 56,033 2.32 130,000 69.2
2009 8.8 56,244 2.31 129,900 67.3
Average 9.3 -- -- -- 75.3
Maximum 10.0 -- -- -- 80.3
Minimum 8.8 -- -- -- 67.3 1 Housing Density is declining as described in the Madison Comprehensive Plan
Technical Memorandum MADISON WATER UTILITY Water Demand Projections January 21, 2010 Draft
BLACK & VEATCH Project 169092.0100 Page 21
The second methodology used to estimate residential unit water demand uses the service area population estimates provided in Table 3 and the estimated total residential usage provided in Table 8. The resulting data is provided in Table 11. Both methods produce similar results, with an average unit residential usage of around 74 gpcd and a maximum of 81 gpcd. Based on the results of the unit residential water use calculations for the last 10 years, a unit demand of 80 gpcd was chosen for future demands without conservation (High).
Table 11 - Unit Residential Water Use Calculations (Method 2)
Year Residential
Usage (mgd) Service
Population
Per-Capita Residential Water
Use (gpcd)
2000 17.3 226,149 76.4
2001 17.6 228,463 77.1
2002 18.3 231,739 78.8
2003 18.9 233,721 81.0
2004 17.2 235,945 72.7
2005 18.3 238,929 76.4
2006 17.8 240,437 74.0
2007 17.8 241,982 73.5
2008 17.1 243,760 70.2
2009 16.7 244,804 68.2
Average 17.7 -- 74.8
Maximum 18.9 -- 81.0
Minimum 16.7 -- 68.2
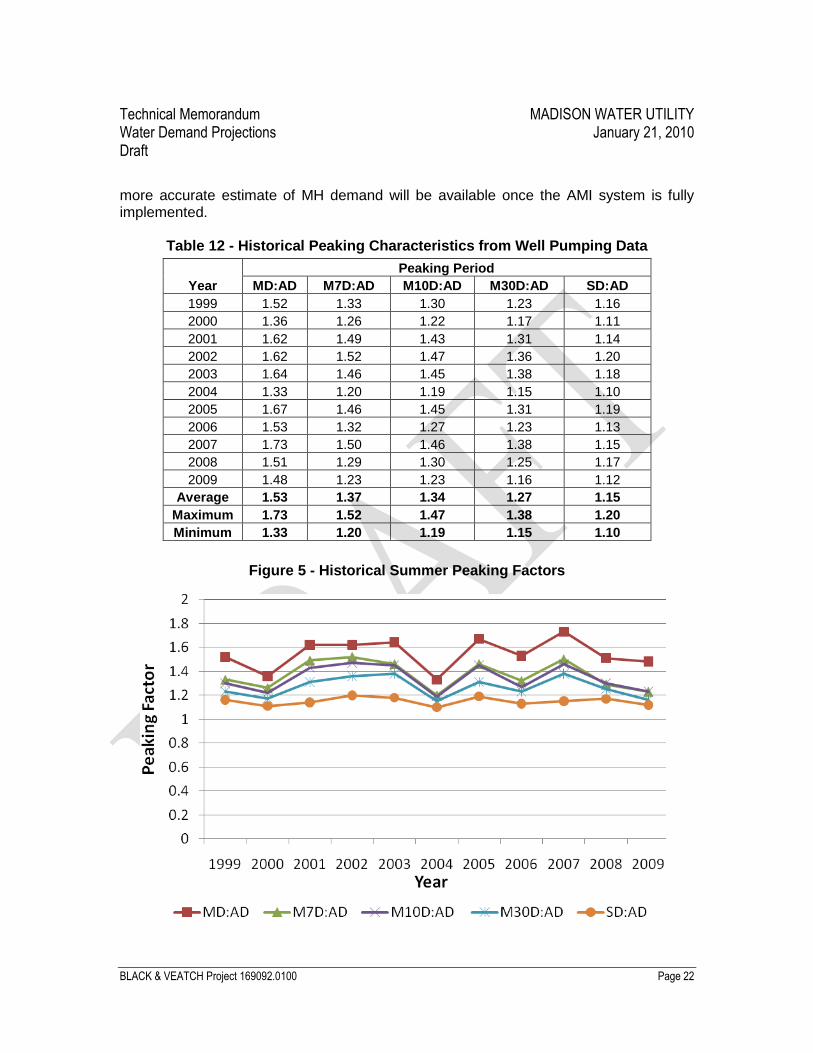
5.2.6 System Peaking Factors In order to determine typical system peaking factors, pumping data from years 1999 to 2009 was evaluated. Peaking factors for each year of data were calculated and summarized in Table 12 and are shown in Figure 5 for the following conditions:
MD Demand vs. AD Demand
M7D Demand vs. AD Demand
M10D Demand vs. AD Demand
M30D Demand vs. AD Demand
SD Demand vs. AD Demand
It should be noted that estimating the MH peaking factor from hourly well pumping data for the entire year was not evaluated. Due to the buffering action from water storage reservoirs in the system, producing an accurate estimate of MH would be difficult. A
Technical Memorandum MADISON WATER UTILITY Water Demand Projections January 21, 2010 Draft
BLACK & VEATCH Project 169092.0100 Page 22
more accurate estimate of MH demand will be available once the AMI system is fully implemented.
Table 12 - Historical Peaking Characteristics from Well Pumping Data
Year
Peaking Period
MD:AD M7D:AD M10D:AD M30D:AD SD:AD
1999 1.52 1.33 1.30 1.23 1.16
2000 1.36 1.26 1.22 1.17 1.11
2001 1.62 1.49 1.43 1.31 1.14
2002 1.62 1.52 1.47 1.36 1.20
2003 1.64 1.46 1.45 1.38 1.18
2004 1.33 1.20 1.19 1.15 1.10
2005 1.67 1.46 1.45 1.31 1.19
2006 1.53 1.32 1.27 1.23 1.13
2007 1.73 1.50 1.46 1.38 1.15
2008 1.51 1.29 1.30 1.25 1.17
2009 1.48 1.23 1.23 1.16 1.12
Average 1.53 1.37 1.34 1.27 1.15
Maximum 1.73 1.52 1.47 1.38 1.20
Minimum 1.33 1.20 1.19 1.15 1.10
Figure 5 - Historical Summer Peaking Factors
Technical Memorandum MADISON WATER UTILITY Water Demand Projections January 21, 2010 Draft
BLACK & VEATCH Project 169092.0100 Page 23
The 11 years of peaking factor data shows that there is no trending and that the MD:AD factors show considerable variability. This data supports the system overall MD:AD design peaking factor of 1.74 used in the 2006 Master Plan.
5.2.7 Existing Demands by Service Zone The spatial distribution of usage by service zone was evaluated and compared to the characteristics presented in the 2006 Master Plan. Consumption and demand distribution characteristics by service zone were evaluated for the AD, M7D, and MD where SCADA data allowed for the evaluation of the spatial distribution in demand.
Table 13 presents the distribution in metered consumption for the AD condition based upon the metered sales data. As indicated in this table, the percent of total AD consumption by service zone in 2003 is similar to the percent of total AD consumption by service zone in 2008. Notable exceptions are service zones with growth and/or boundary modifications (Zone 1, Zone 3, Zone 10, and Zone 11).
Table 13 - Consumption by Service Zone (AD)
Service Zone
2003 AD Consumption
1
(mgd)
Percent of System
Consumption (%)
2008 AD Consumption
2
(mgd)
Percent of System
Consumption (%)
1 0.29 0.9 0.37 1.4
2 3 0.12 0.4
0.88 3.4 3 3 0.19 0.6
4 1.24 3.8 1.08 4.1
5 0.05 0.2 0.03 0.1
6W 4
22.54 69.6 10.13 38.7
6E 4 6.84 26.1
7 4.19 12.9 3.19 12.2
8 2.52 7.8 2.21 8.5
9 0.66 2.0 0.59 2.3
10 0.49 1.5 0.67 2.6
11 0.08 0.3 0.18 0.7
Total 32.37 100.0 26.18 100.0 1 From Metered Sales Allocated for the 2006 Master Plan
2 From 2008 Metered Sales Allocation but using current Service Zone
Boundaries 3 Zone 2 and Zone 3 were merged in 2010 (called Zone 3) with some of Zone 6E
being incorporated 4 Zone 6 was essential split by the closure of isthmus valves into Zone 6E and
Zone 6W
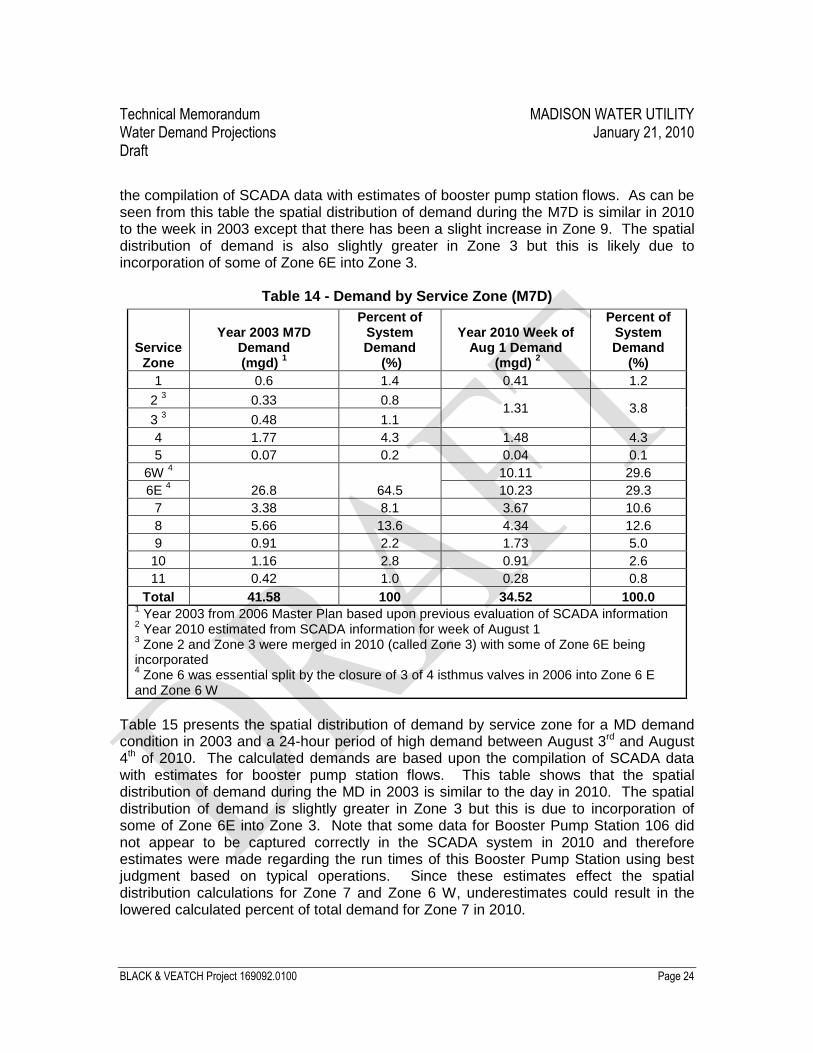
Table 14 presents the spatial distribution of demand by service zone for a M7D demand condition for 2003 and a week of high demand in August of 2010. At the time of this study not all information had been evaluated for 2010 but it is assumed that this week presents a condition comparable to a M7D demand condition. This table is based upon
Technical Memorandum MADISON WATER UTILITY Water Demand Projections January 21, 2010 Draft
BLACK & VEATCH Project 169092.0100 Page 24
the compilation of SCADA data with estimates of booster pump station flows. As can be seen from this table the spatial distribution of demand during the M7D is similar in 2010 to the week in 2003 except that there has been a slight increase in Zone 9. The spatial distribution of demand is also slightly greater in Zone 3 but this is likely due to incorporation of some of Zone 6E into Zone 3.
Table 14 - Demand by Service Zone (M7D)
Service Zone
Year 2003 M7D Demand (mgd)
1
Percent of System Demand
(%)
Year 2010 Week of Aug 1 Demand
(mgd) 2
Percent of System Demand
(%)
1 0.6 1.4 0.41 1.2
2 3 0.33 0.8
1.31 3.8 3
3 0.48 1.1
4 1.77 4.3 1.48 4.3
5 0.07 0.2 0.04 0.1
6W 4
26.8 64.5
10.11 29.6
6E 4 10.23 29.3
7 3.38 8.1 3.67 10.6
8 5.66 13.6 4.34 12.6
9 0.91 2.2 1.73 5.0
10 1.16 2.8 0.91 2.6
11 0.42 1.0 0.28 0.8
Total 41.58 100 34.52 100.0 1 Year 2003 from 2006 Master Plan based upon previous evaluation of SCADA information
2 Year 2010 estimated from SCADA information for week of August 1
3 Zone 2 and Zone 3 were merged in 2010 (called Zone 3) with some of Zone 6E being
incorporated 4 Zone 6 was essential split by the closure of 3 of 4 isthmus valves in 2006 into Zone 6 E
and Zone 6 W
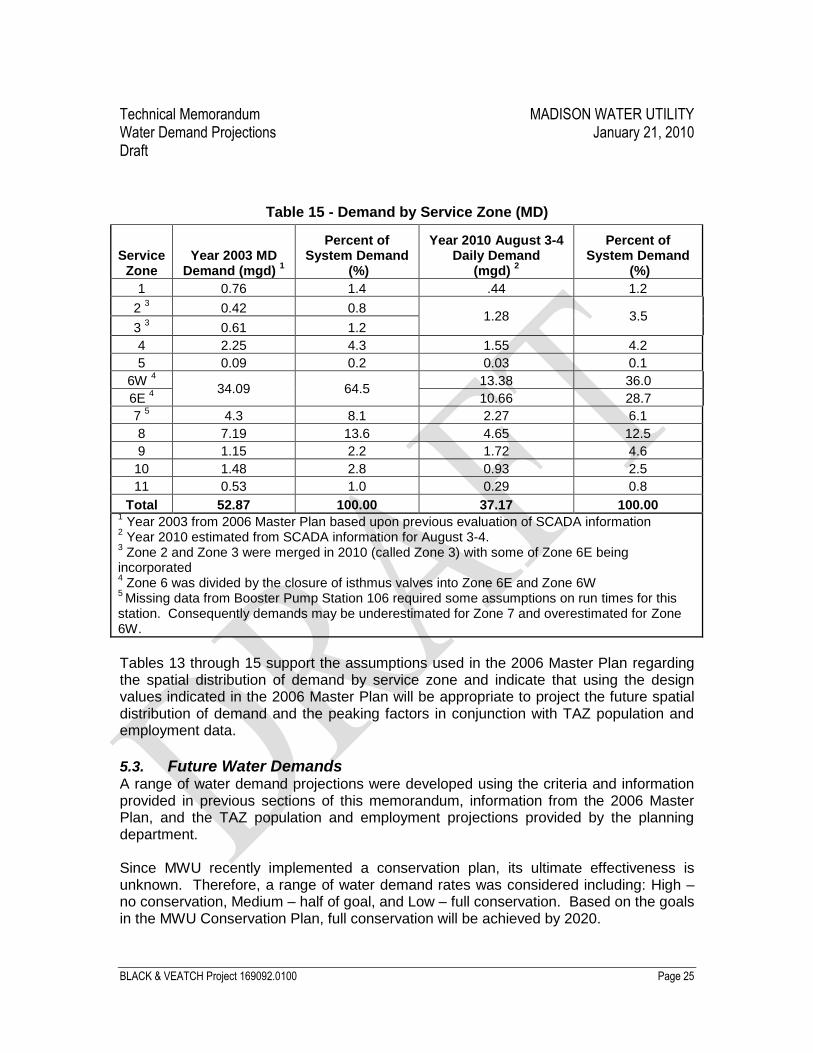
Table 15 presents the spatial distribution of demand by service zone for a MD demand condition in 2003 and a 24-hour period of high demand between August 3rd and August 4th of 2010. The calculated demands are based upon the compilation of SCADA data with estimates for booster pump station flows. This table shows that the spatial distribution of demand during the MD in 2003 is similar to the day in 2010. The spatial distribution of demand is slightly greater in Zone 3 but this is due to incorporation of some of Zone 6E into Zone 3. Note that some data for Booster Pump Station 106 did not appear to be captured correctly in the SCADA system in 2010 and therefore estimates were made regarding the run times of this Booster Pump Station using best judgment based on typical operations. Since these estimates effect the spatial distribution calculations for Zone 7 and Zone 6 W, underestimates could result in the lowered calculated percent of total demand for Zone 7 in 2010.
Technical Memorandum MADISON WATER UTILITY Water Demand Projections January 21, 2010 Draft
BLACK & VEATCH Project 169092.0100 Page 25
Table 15 - Demand by Service Zone (MD)
Service Zone
Year 2003 MD Demand (mgd)
1
Percent of System Demand
(%)
Year 2010 August 3-4 Daily Demand
(mgd) 2
Percent of System Demand
(%)
1 0.76 1.4 .44 1.2
2 3 0.42 0.8
1.28 3.5 3
3 0.61 1.2
4 2.25 4.3 1.55 4.2
5 0.09 0.2 0.03 0.1
6W 4
34.09 64.5 13.38 36.0
6E 4 10.66 28.7
7 5 4.3 8.1 2.27 6.1
8 7.19 13.6 4.65 12.5
9 1.15 2.2 1.72 4.6
10 1.48 2.8 0.93 2.5
11 0.53 1.0 0.29 0.8
Total 52.87 100.00 37.17 100.00 1 Year 2003 from 2006 Master Plan based upon previous evaluation of SCADA information
2 Year 2010 estimated from SCADA information for August 3-4.
3 Zone 2 and Zone 3 were merged in 2010 (called Zone 3) with some of Zone 6E being
incorporated 4 Zone 6 was divided by the closure of isthmus valves into Zone 6E and Zone 6W
5 Missing data from Booster Pump Station 106 required some assumptions on run times for this
station. Consequently demands may be underestimated for Zone 7 and overestimated for Zone 6W.
Tables 13 through 15 support the assumptions used in the 2006 Master Plan regarding the spatial distribution of demand by service zone and indicate that using the design values indicated in the 2006 Master Plan will be appropriate to project the future spatial distribution of demand and the peaking factors in conjunction with TAZ population and employment data.
5.3. Future Water Demands A range of water demand projections were developed using the criteria and information provided in previous sections of this memorandum, information from the 2006 Master Plan, and the TAZ population and employment projections provided by the planning department. Since MWU recently implemented a conservation plan, its ultimate effectiveness is unknown. Therefore, a range of water demand rates was considered including: High – no conservation, Medium – half of goal, and Low – full conservation. Based on the goals in the MWU Conservation Plan, full conservation will be achieved by 2020.
Technical Memorandum MADISON WATER UTILITY Water Demand Projections January 21, 2010 Draft
BLACK & VEATCH Project 169092.0100 Page 26
5.3.1 Residential Unit Demands The residential unit demands that were used to determine projected water demands are based on the information provided in Tables 11 and 12 and the recommended conservation unit demand. The residential unit demands to be used are listed below:
High: All design years (2010, 2015, 2030, and Buildout) – 80 gpcd
Mean: (halfway between the high and low residential unit demands) o 2010 – 76 gpcd o 2015 – 74.5 gpcd o 2030 and Buildout – 69 gpcd
Low: o 2010 – 72 gpcd – This value is based on the average of the last five years
of data and assumes that conservation has had a slight impact in residential unit demands in this average.
o 2015 – 69 gpcd. This value is based on the assumption that half of the conservation will be achieved by 2015 (i.e. halfway between no conservation at 2010 of 80 gpcd, and conservation goals achieved fully in 2020 or 58 gpcd. This breaks down to 80+58 divided by 2, or 69 gpcd)
o 2030 and Buildout – 58 gpcd (achieved by 2020)
5.3.2 Non-residential Demands To determine the non-residential demand component, an initial non-residential to total demand percentage of 38 percent was used for year 2010. Historically there has been a higher non-residential component of usage than this, but over the last 5 years of data the ratio of 38 percent represents both the high value of the last five years and an average value of the last 10 years, as shown in Figure 4. It was assumed that no increase in non-residential demand percentage would occur between now and 2020 and that the volume of this demand would stay constant until year 2020.
To project the non-residential water use for years 2030 and Buildout, the 2020 gallons-per-employee-per-day (gped) unit usage was calculated using the 2020 non-residential water use and the 2020 total employment from the TAZ data. The 2020 non-residential unit usage rate was calculated as 50.7 gped for the high value (12.1 mgd divided by 238,000 employess), 48.2 gped for the mean value (11.5 mgd divided by 238,000 employees), and 45.7 for the low value (10.9 mgd divided by 238,000 employees).
5.3.3 System-Wide Average Day Demands Using the residential unit demands provided in Section 5.3.1, the non-residential demand assumptions described in the previous section, and a non-revenue component of 10 percent, the range of water demands was calculated and is provided in Table 16 and is shown graphically in Figure 6. Although the low, mean, and high total demand figures in Table 16 are higher than actual for the year 2010, this is due to the fact that Table 16 indicates a typical weather year projection for water demand. Year 2010 was actually a wet cool weather year that resulted in overall lower water demands.
Technical Memorandum MADISON WATER UTILITY Water Demand Projections January 21, 2010 Draft
BLACK & VEATCH Project 169092.0100 Page 27
Table 16 – System-Wide Average Day Water Demand Projections (mgd)
Design Year
Range Category
Residential Demand
Non-Residential Demand
Non-Revenue Demand
Total Demand
Year 2010
High 19.7 12.1 3.5 35.3
Mean 18.7 11.5 3.4 33.6
Low 17.7 10.9 3.2 31.8
Year 2015
High 20.5 12.1 3.6 36.2
Mean 19.1 11.5 3.5 34.1
Low 17.7 10.9 3.3 31.9
Year 2030
High 23.0 13.3 4.0 40.3
Mean 19.8 12.6 3.7 36.1
Low 16.7 12.0 3.3 32.0
Buildout
High 30.5 16.3 5.2 52.0
Mean 26.3 15.5 4.7 46.6
Low 22.1 14.7 4.3 41.1
Figure 6 – Average Day Projected Demands
Technical Memorandum MADISON WATER UTILITY Water Demand Projections January 21, 2010 Draft
BLACK & VEATCH Project 169092.0100 Page 28
Figure 6 provides an illustration of the AD demand projections following the criteria outlined in the previous sections. This figure illustrates that for the low demand projections (conservation goals are fully achieved) the AD water use in 2030 will be approximately the same as current water use. Conservation gains will compensate for the additional projected demand resulting from residential and non-residential growth. Since MWU and the public have embraced the Conservation Plan and have already begun to see some results, the low demand assumptions will be used as the basis for the future projections. MWU should monitor progress on conservation goals and adjust demand assumptions if needed on future distribution system evaluations.
5.3.4 System Design Peaking Factors The system design peaking factors for MD, and MH are presented in the 2006 Master Plan and have not changed for this study as they have been supported by the evaluations presented in this memorandum. The M10D peaking factor, which was not used in the 2006 Master Plan, was determined for this project as the 90th percentile value (10-year return interval) using the last eleven years of data shown in Attachment D. The M10D peaking factors were added to the evaluation for use during water age hydraulic analyses. Table 17 lists the system-wide design peaking factors based on existing water usage.
Table 17 - System Peaking Factors
Condition Peaking Factor
M10D1 1.47
MD2 1.74
MH2 2.15
1 90
th percentile value from past 11 years of
data 2 From the 2006 Master Plan
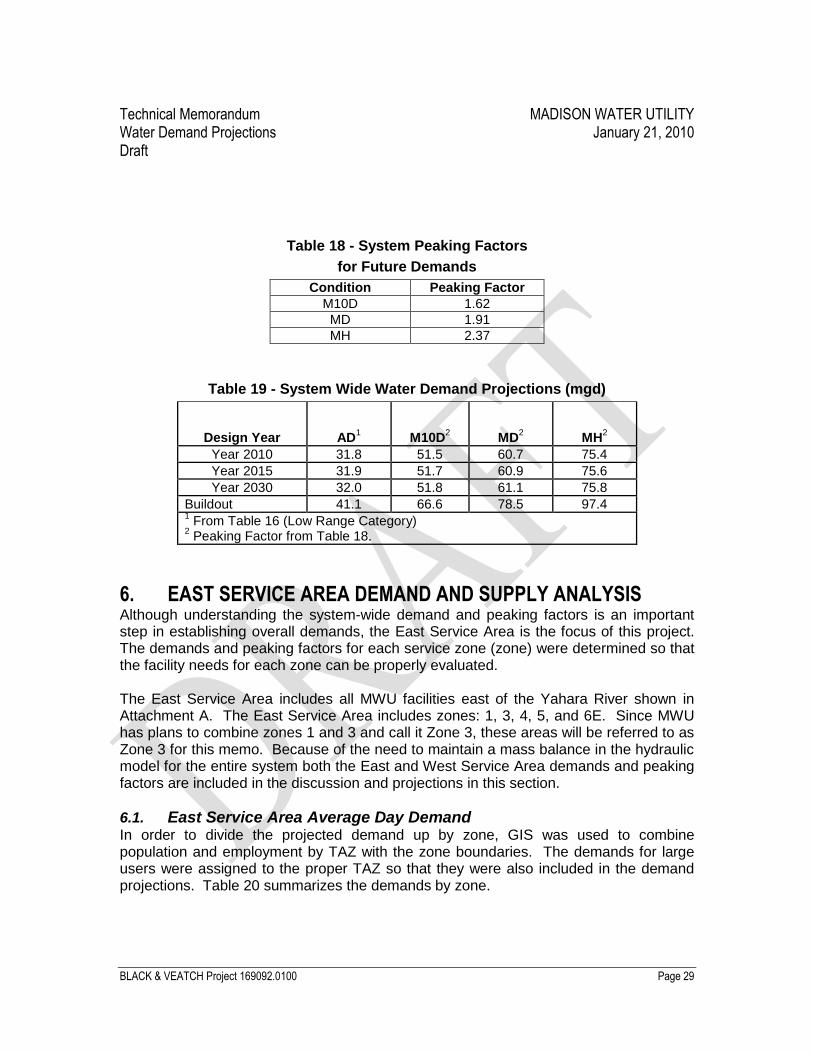
The MWU Conservation Plan outlines conservation efforts that will primarily impact indoor water usage and reduce the overall AD demand and total water pumped. The impact of the Utility’s conservation program on peaking factors is not expected to be significant but conservation is expected to result in an increase in peaking factors. Similar to projecting the impact of the conservation program, the actual impact of conservation on system peaking factors is unknown at this time. In order to insure that MWU facilities are able to handle peak water demands, a modest increase of 10 percent was incorporated into the peaking factors used in conjunction with a successful conservation program. Table 18 summarizes the peaking factors used for the projected demand and Table 19 summarizes the system-wide demand projections.
Technical Memorandum MADISON WATER UTILITY Water Demand Projections January 21, 2010 Draft
BLACK & VEATCH Project 169092.0100 Page 29
Table 18 - System Peaking Factors
for Future Demands
Condition Peaking Factor
M10D 1.62
MD 1.91
MH 2.37
Table 19 - System Wide Water Demand Projections (mgd)
Design Year AD1
M10D2 MD
2 MH
2
Year 2010 31.8 51.5 60.7 75.4
Year 2015 31.9 51.7 60.9 75.6
Year 2030 32.0 51.8 61.1 75.8
Buildout 41.1 66.6 78.5 97.4 1 From Table 16 (Low Range Category)
2 Peaking Factor from Table 18.
6. EAST SERVICE AREA DEMAND AND SUPPLY ANALYSIS Although understanding the system-wide demand and peaking factors is an important step in establishing overall demands, the East Service Area is the focus of this project. The demands and peaking factors for each service zone (zone) were determined so that the facility needs for each zone can be properly evaluated. The East Service Area includes all MWU facilities east of the Yahara River shown in Attachment A. The East Service Area includes zones: 1, 3, 4, 5, and 6E. Since MWU has plans to combine zones 1 and 3 and call it Zone 3, these areas will be referred to as Zone 3 for this memo. Because of the need to maintain a mass balance in the hydraulic model for the entire system both the East and West Service Area demands and peaking factors are included in the discussion and projections in this section.
6.1. East Service Area Average Day Demand In order to divide the projected demand up by zone, GIS was used to combine population and employment by TAZ with the zone boundaries. The demands for large users were assigned to the proper TAZ so that they were also included in the demand projections. Table 20 summarizes the demands by zone.
Technical Memorandum MADISON WATER UTILITY Water Demand Projections January 21, 2010 Draft
BLACK & VEATCH Project 169092.0100 Page 30
Table 20 – Average Day Demand Projections by Zone (mgd)
Zone 2010
2015 2030 Build Out
East Service Area
3 2.2 2.4 3.2 7.5
4 1.3 1.3 1.4 4.0
5 0.1 0.1 0.1 0.1
6E 7.0 6.9 6.5 7.3
East Service Area Total 10.6 10.7 11.2 18.9
West Service Area
6W 12.4 12.2 11.0 11.3
7 3.8 3.8 3.5 3.4
8 3.3 3.3 3.5 3.9
9 0.7 0.7 0.8 0.6
10 0.9 1.0 1.7 2.6
11 0.1 0.2 0.3 0.4
West Service Area Total 21.2 21.2 20.8 22.2
System-Wide Total 31.8 31.9 32.0 41.1
6.2. Peaking Factor by Service Zone Peaking factors vary by zone across the water distribution system as a function of the size and the mix of residential and non-residential customers. In general, as the amount of demand within a zone increases its peaking factors will decrease. This section describes the methodology used to project peaking factors for each zone. Table 21 summarizes the selected peaking factors. Developing peaking factors for each zone requires reviewing both the existing peaking factors for each zone and balancing the rate of growth between zones. In addition, in order to satisfy the mass balance equations in the hydraulic model, the weighted average of the peaking factors must match the system-wide peaking factors selected in Section 5.3.4
Technical Memorandum MADISON WATER UTILITY Water Demand Projections January 21, 2010 Draft
BLACK & VEATCH Project 169092.0100 Page 31
Table 21 – Peaking Factor by Zone
Zone M10D MD MH
East Service Area
3 1.82 2.16 2.66
4 1.67 1.98 2.45
5 3.58 4.24 5.23
6E 1.49 1.76 2.17
West Service Area
6W 1.41 1.67 2.07
7 1.78 2.11 2.61
8 1.80 2.13 2.64
9 2.23 2.64 3.26
10 2.03 2.40 2.96
11 2.79 3.30 4.08
System-Wide 1.62 1.91 2.37
6.2.1 Maximum Day Peaking Factors During the 2006 Master Plan two curves were developed that predict the MD to AD peaking factors for a zone based on the demand within the zone (2006 Master Plan, Figure 3-10). Because of water use characteristics, zones 6 and 4 use a curve with lower peaking factors than the remainder of the zones. These curves were used as the first step to predict the peaking factor for each zone. For each zone, the average AD demand for 2010, 2015, and 2030 was used and the corresponding MD/AD peaking factor read. Each peaking factor was then increased by 10 percent to account for the conservation increase (as described in Section 5.3.4). Finally, the peaking factors for all zones were used to calculate the MD demand.
6.2.2 Maximum 10 Day and Maximum Hour Peaking factors. Once the MD/AD peaking factors were determined the M10D and MH peaking factors were calculated by maintaining the same ratios of M10D/MD and MH/MD that can be derived from the peaking factors in Table 18:
M10D to MD: 0.85
MH to MD: 1.24
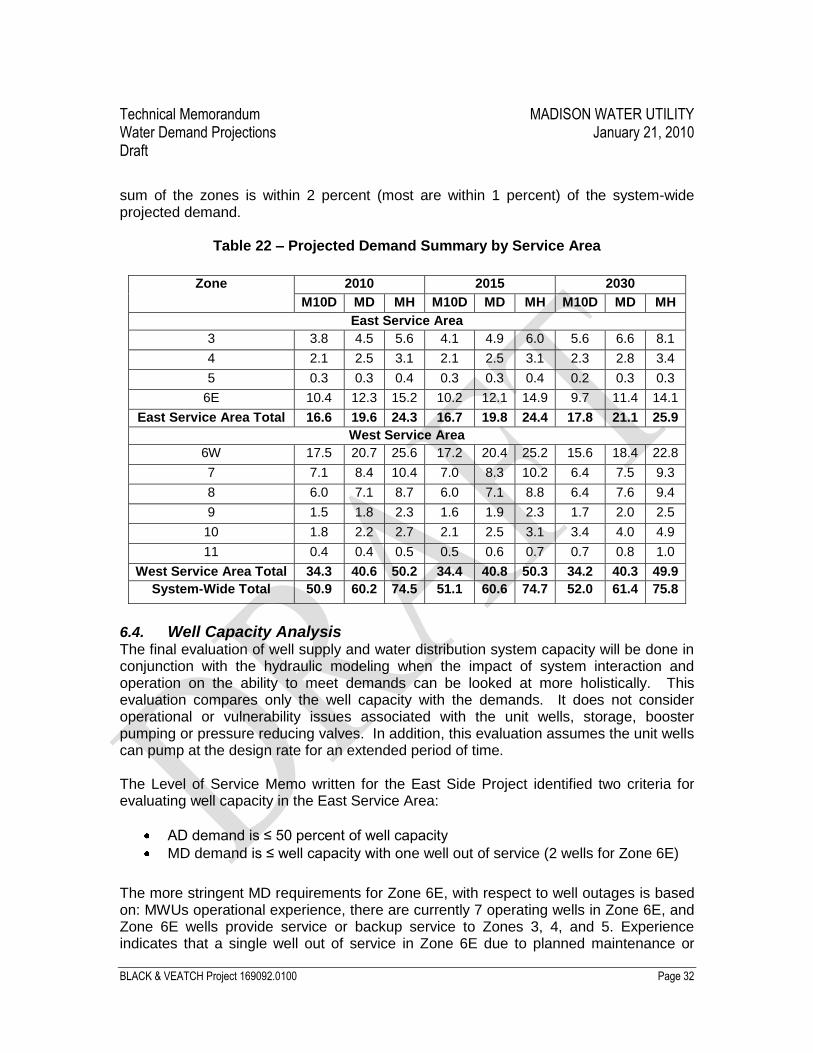
6.3. Design Demand Condition Table 22 summarizes the projected demand conditions for each service area. Note that the sum of the individual zones will not be exactly equal to the demand projected for the system-wide as a result of the methodology used to select the peaking factors by zone and the different rates of growth in the various zones. Checks made confirm that the
Technical Memorandum MADISON WATER UTILITY Water Demand Projections January 21, 2010 Draft
BLACK & VEATCH Project 169092.0100 Page 32
sum of the zones is within 2 percent (most are within 1 percent) of the system-wide projected demand.
Table 22 – Projected Demand Summary by Service Area
Zone 2010 2015 2030
M10D MD MH M10D MD MH M10D MD MH
East Service Area
3 3.8 4.5 5.6 4.1 4.9 6.0 5.6 6.6 8.1
4 2.1 2.5 3.1 2.1 2.5 3.1 2.3 2.8 3.4
5 0.3 0.3 0.4 0.3 0.3 0.4 0.2 0.3 0.3
6E 10.4 12.3 15.2 10.2 12.1 14.9 9.7 11.4 14.1
East Service Area Total 16.6 19.6 24.3 16.7 19.8 24.4 17.8 21.1 25.9
West Service Area
6W 17.5 20.7 25.6 17.2 20.4 25.2 15.6 18.4 22.8
7 7.1 8.4 10.4 7.0 8.3 10.2 6.4 7.5 9.3
8 6.0 7.1 8.7 6.0 7.1 8.8 6.4 7.6 9.4
9 1.5 1.8 2.3 1.6 1.9 2.3 1.7 2.0 2.5
10 1.8 2.2 2.7 2.1 2.5 3.1 3.4 4.0 4.9
11 0.4 0.4 0.5 0.5 0.6 0.7 0.7 0.8 1.0
West Service Area Total 34.3 40.6 50.2 34.4 40.8 50.3 34.2 40.3 49.9
6.4. Well Capacity Analysis The final evaluation of well supply and water distribution system capacity will be done in conjunction with the hydraulic modeling when the impact of system interaction and operation on the ability to meet demands can be looked at more holistically. This evaluation compares only the well capacity with the demands. It does not consider operational or vulnerability issues associated with the unit wells, storage, booster pumping or pressure reducing valves. In addition, this evaluation assumes the unit wells can pump at the design rate for an extended period of time. The Level of Service Memo written for the East Side Project identified two criteria for evaluating well capacity in the East Service Area:
AD demand is ≤ 50 percent of well capacity
MD demand is ≤ well capacity with one well out of service (2 wells for Zone 6E)
The more stringent MD requirements for Zone 6E, with respect to well outages is based on: MWUs operational experience, there are currently 7 operating wells in Zone 6E, and Zone 6E wells provide service or backup service to Zones 3, 4, and 5. Experience indicates that a single well out of service in Zone 6E due to planned maintenance or
Technical Memorandum MADISON WATER UTILITY Water Demand Projections January 21, 2010 Draft
BLACK & VEATCH Project 169092.0100 Page 33
mechanical breakdown occurs annually. For engineering planning purposes to ensure system reliability, considering a second well outage in Zone 6E due to a power outage or other natural disaster is reasonable and prudent.
Table 23 summarizes the target capacities for the various zones based on their connections to other zones and projected demands.
Table 23 – East Service Area Required Well Capacity (mgd)
Zone 2010 2015 2030
AD1 MD
2 AD
1 MD
2 AD
1 MD
2
3 4.4 4.7 4.8 5.1 6.4 6.9
4 2.6 2.5 2.6 2.5 2.8 2.8
5 -- -- -- -- -- --
6E3 14.2 12.6 14.0 12.3 13.2 11.7
East Service Area Total 21.2 19.8 - 20.8
4
21.4 19.9 - 20.9
4
22.4 21.4 - 22.4
4
1 Two times AD demand
2 MD demand
3 Totals include Zone 5 demand
4 Based on recommendations in the 2006 Water Master Plan this total includes 1.0 mgd that is
transferred to Zone 6W from Zone 6E on MD
Table 24 summarizes the available well capacity available to meet demands by zone.
Technical Memorandum MADISON WATER UTILITY Water Demand Projections January 21, 2010 Draft
BLACK & VEATCH Project 169092.0100 Page 34
Table 24 – East Service Area 2010 Well Capacity
Zone Unit Well Capacity
(mgd) Capacity with largest well
out of service
3 25 3.0 0.02
4 9 2.5 0.02
5 -- -- --
6E 7 8 11 13 15 23 29
6E Total
3.0 2.4 3.0 3.0 3.0 1.4 1.5
1
17.3
11.33
East Service Area Total 22.8 16.84 – 18.4
6
13.85 – 15.4
6
1 There are plans to expand the production capacity of this well to 3.1 mgd
2 Supply would be provided from Zone 6E
3 Two wells out of service
4 Assumes that one well is out in 6E and Well 25 is out of service
5 Assumes that two wells are out in 6E and Well 25 is out of service
6 Takes into account increasing capacity of Well 29 to 3.1 mgd
A brief evaluation of the ability of the existing unit wells to meet the level of service criteria for each zone follows.
6.4.1 Service Zone 3 Well Capacity Evaluation Well 25 is currently the only well serving Zone 3. A booster pump station near Well 29 provides limited ability to transfer water from Zone 6E. Based on the projections in Table 23 and the established supply criteria, Zone 3 relies on Zone 6E for 1.23 mgd supply on the average day. For MD, this reliance increases to 1.7 mgd. In the event that Well 25 is taken out of service, Zone 3 will be entirely dependent on Zone 6E. The Zone 3 demands will be included in the Zone 6E supply capacity analysis. The 2006 Water Master Plan provides for a new pump station to transfer water from Zone 6E to Zone 3 so this is projected to be a long term supply arrangement. Several additional wells are included in the 2006 Master Plan to meet future demands in Zone 3 and reduce reliance on Zone 6E. Currently for planning purposes, 1.5 mgd will be assumed to be provided to Zone 3 from Zone 6E.
6.4.2 Service Zone 4 Well Capacity Evaluation Zone 4 is currently served by a single well, Well 9. Current water demand projections for Zone 4 indicate that well capacity falls slightly short of meeting both the AD and MD
Technical Memorandum MADISON WATER UTILITY Water Demand Projections January 21, 2010 Draft
BLACK & VEATCH Project 169092.0100 Page 35
water supply criteria. If Well 9 is out of service, at the present time Zone 4 will be completely reliant on Zone 6E. MWU is in the process of adding a second well to Zone 4. It is anticipated that the new well will be in production by 2013 and have a capacity of 3.1 mgd. This additional well will reduce the Zone 4 reliance on Zone 6E and provide capacity to support growth in Zone 4. A pump station that would move water from Zone 4 to Zone 6E is proposed in the 2006 Water Master Plan. Following construction of the new well in Zone 4, the construction of a pump station would help to improve water supply capacity reliability in Zone 6E.
6.4.3 Service Zone 5 Well Capacity Evaluation Zone 5 does not have any unit wells and is served entirely from Zone 6E. Zone 5 serves a small area with limited growth potential. The projected water demands in Zone 5 are small and can be easily met from Zone 6E facilities.
6.4.4 Service Zone 6E Well Capacity Evaluation The existing water demand in Zone 6E is nearly double the sum of the other 3 east side zones combined. Additionally Zone 6E wells provide water supply support to the other east side pressure zones and some water also flows from Zone 6E to Zone 6W across the Yahara River on MD. To adequately assess the water supply capacity on the east side, all of these water transfers must be considered in the planning process. Projected water demand on the east side varies from 19.8 to 22.4 mgd through the year 2030. Firm supply capacity from existing wells, depending on assumptions and criteria and the increase in capacity at Well 29, range from 13.8 mgd to 18.4 mgd. This results in an estimated short fall range from 1.4 to 8.6 mgd for Zone 6E. To meet minimum estimated water supply requirements for reliability and redundancy considering that the conservation program is successful, a minimum of one well is required in Zone 6E. A second well will be required if Well 29 cannot be expanded. This well supply evaluation only takes into account the basic supply capacity of the east side wells. It does not consider the hydraulic capacity of the distribution system and its ability to effectively move water around the system. It is anticipated that system capacity and ability to move water around to where it is needed will dictate the number and location of any additional wells in Zone 6E that will be required to meet 2030 water supply demands. Computer modeling will determine siting and pumping capacity required for proposed facilities.
7. SUMMARY AND CONCLUSIONS
This memorandum presents water demand projections for a range of conditions. These water demand projections were developed based on the following data sources:
Population and employment projections and spatial distributions provided by the Madison Area Transportation and Planning Board
Technical Memorandum MADISON WATER UTILITY Water Demand Projections January 21, 2010 Draft
BLACK & VEATCH Project 169092.0100 Page 36
Population estimates from the State of Wisconsin – Department of Administration Demographic Service Center
Daily well pump data from 1999 through 2009
2006 Water Master Plan
MWU Conservation Plan
Historical usage, Production, and Meter data provided to the Public Service Commission of Wisconsin (PSCW) and presented in the Year End Reports.
The water demand projections provided in this memorandum are intended to represent a range of demands that the utility can expect to experience. Based on MWU and the community’s commitment to conservation the low projections were chosen for future AD demands. The MWU should monitor progress on conservation goals and adjust demand assumptions if needed on future distribution system evaluations. Because the items identified in the Conservation Plan are primarily aimed at reducing indoor water usage, they will primarily impact AD demands. Peak water demands associated with summer irrigation may not change significantly resulting in higher peaking factors. For future demands, a peaking factor increase of 10 percent was used In order to provide appropriate distribution system facilities to meet the peak demands. To provide a preliminary evaluation of the well capacity for the East Side, the existing well capacity was compared to the projected demands through 2030 and the level of service criteria. This evaluation only compared the well capacity with the demands. It did not consider operational or vulnerability issues associated with the unit wells, storage, booster pumping or pressure reducing valves. The well capacity evaluation highlighted the importance of Zone 6E facilities to increase the reliability of zones 3, 4, and 5 and identified an existing minimum shortfall of about 1.4 mgd in Zone 6E. Based on the information gathered and developed during this study, it is recommended:
1. As the City Conservation Plan continues to develop and evolve gather data and refine programs to aid success
2. The Utility shall continue to monitor the impact of weather patterns on outdoor water use
3. MWU plan for a replacement well for Well 3 to replace lost system capacity 4. MWU investigate the feasibility of increasing the filtration capacity of Well 29 5. In the event that the capacity at Well 29 cannot be increased, MWU should
consider adding a well in Zone 3 in the near term that can supplement supply to Zone 6E
6. More information on supply requirements regarding well location will be developed during the distribution system computer model evaluation
Technical Memorandum MADISON WATER UTILITY Water Demand Projections January 21, 2010 Draft
BLACK & VEATCH Project 169092.0100 Page 37
ATTACHMENT A
This attachment is in progress and will be completed upon review of the draft
Technical Memorandum MADISON WATER UTILITY Water Demand Projections January 21, 2010 Draft
BLACK & VEATCH Project 169092.0100 Page 38
ATTACHMENT B
This attachment is in progress and will be completed upon review of the draft
Technical Memorandum MADISON WATER UTILITY Water Demand Projections January 21, 2010 Draft
BLACK & VEATCH Project 169092.0100 Page 39
ATTACHMENT C
This attachment is in progress and will be completed upon review of the draft