GEOLOGICAL SURVEY CIRCULAR 148 November 1%1 WATER RESOURCES OF THE ATLANTA METROPOLITAN AREA By R. W. Carter and S. M. Herrick Prepared in cooperation with the GEORGIA DEPARTMENT OF MINES, MINING, AND GEOLOGY and STATE HIGHWAY DEPARTMENT OF GEORGIA
Transcript
GEOLOGICAL SURVEY CIRCULAR 148
November 1%1
WATER RESOURCES
OF THE
ATLANTA METROPOLITAN AREA
By
R. W. Carter and S. M. Herrick
Prepared in cooperation with the
GEORGIA DEPARTMENT OF MINES, MINING, AND GEOLOGY
and
STATE HIGHWAY DEPARTMENT OF GEORGIA
CONTENTS
PageIntroduction. .................................. 1Historical notes. .............................. 1Sources of water .............................. 1Water demands .............................. 4
Water-supply systems ....................... 4Atlanta water system ...................... 4DeKalb County system ..................... 4East Point water system ................... 4Atkinson power plant...................... 4Other water-supply systems. ............... 4
Summary of present water demands ........... 4Future demand for water ......... ........... 5
Ground water. ................................ 6Water-bearing formations .................... 6Occurrence ................................. 6Fluctuations of the water table ................ 6Status of water table in Atlanta area........... 7Wells..................................... 7
Effect of pumping on water levels ......... 7Progressive lowering of water levels in pump ed wells.................................. 7
Yield of wells ............................. 8Depth of wells. ............................ 8Spacing of wells ........................... 8Number and type of wells. .................. 8
Page Ground water--Continued
Quality of ground water. ..................... 8Temperature of ground water ................ 9Ground-water potential for future use. ........ 9
Average flow for month and year............ 9Minimum flow. ........................... 9Duration of flow........................... 9Flood flow................................ 11Regime of flow after completion of BufordDam.................................... 11
Other streams in the metropolitan area. ...... 14Average flow............................ 14Minimum flow .......................... 14Flood flow............................... 14
Quality and temperature of surface water ..... 16........................ 16........................ 17......................... 17........................ 17........................ 17........................ 19
Quality......Temperature.Pollution.....
Trends........Summary........References cited.
ILLUSTRATIONS
Page Plate 1. Map of Atlanta area showing yields of wells penetrating rocks of different types (in pocket)
2. Map of Atlanta and vicinity showing stream-flow information (in pocket) Figure 1. Map showing area within 20-mile radius of Atlanta as covered by this report..................... 2
2. Rainfall and runoff in the Atlanta area, by months, for an average year. ......................... 33. Average daily pumpage by Atlanta Waterworks, 1917-50........................................ 54. Ground water in crystalline rocks. ........................................................... 65. Hydrograph of average monthly elevation of water table (Well 26) at East Point, Ga................ 76. Section showing theoretical cone of water-table depression in a well. ............................. 77. Duration of daily flows, 1909-47, Chattahoochee River at Atlanta Waterworks. .................... 118. Profile of water-surface elevations for various flows of the Chattahoochee River.................. 129. Frequency of annual floods, Chattahoochee River at Atlanta Waterworks.......................... 13
10. Effect of Buford Reservoir on flow of Chattahoochee River at Atlanta, Ga., during a drought such asthat of 1925............................................................................... 13
11. Effect of Buford Reservoir on flow of Chattahoochee River at Atlanta, Ga., during normal flow...... 1412. Frequency of annual floods on streams draining the Atlanta metropolitan area...................... 1613. Relation of dissolved solids and hardness to flow, Chattahoochee River 2 miles above Atlanta Water
works, 1937-38............................................................................. 1814. Temperature of water of Chattahoochee River 2 miles above the Atlanta Waterworks................ 18
III
WATER RESOURCES OF THE ATLANTA METROPOLITAN AREA
By R. W. Carter and S. M. Herrick
INTRODUCTION
The National Association of Manufacturers recently conducted a water-use survey in Atlanta. Leaders of industry were asked, "How much water is available for future industrial expansion in Atlanta?" Forty-two percent replied frankly that they didn't know what were the potentialities for the expansion of water use. A fuller knowledge about water, vital to the growth of any industry, city, or nation, would be very advantageous, because these leaders will play an important role in the development of the region. One reason for the lack of knowledge is that the facts about water are common ly published as a mass of figures and technical language with which only the engineer is familiar.
This report attempts to answer some questions of the average citizen about water, such as: What sources of water can Atlanta use? How much water is used in Atlanta for domestic, commercial, or industrial pur poses? How much water is available for industrial ex pansion in Atlanta? Is the water table falling? Is the stream flow declining? What effect will the proposed Buford Dam have on tne flow of the Chattahoochee River at Atlanta? Will Buford Dam prevent floods at Atlanta? The citizens of Atlanta must know the answers to these questions if their water resources are to be developed wisely.
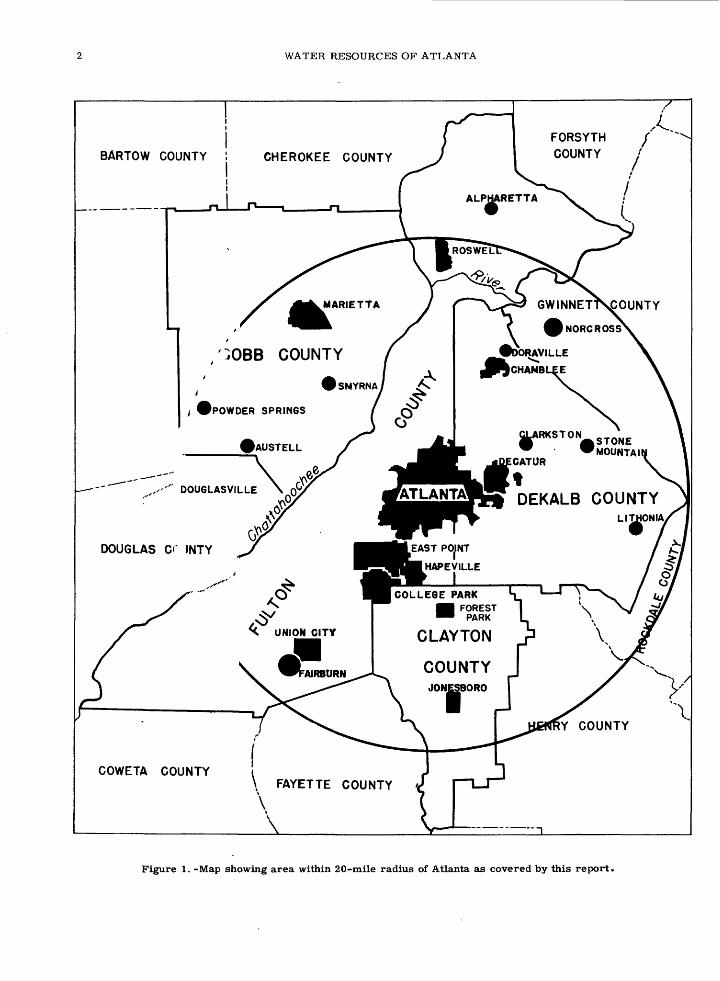
All available information on use and availability of water in the area within a 20-mile radius of downtown Atlanta is summarized in this report (see fig. 1). In formation on the water resources of the area has been collected for more than 40 years by the U. S. Geologi cal Survey in cooperation with the Georgia Department of Mines, Mining and Geology. This information in cludes the volume of stream flow and the extreme varia tion in flow to be expected during flood and drought per iods, sources of ground water and the probable yield of wells in any part of the area, variation in the elevation of the water table, and chemical quality and temperature of both ground water and. surface water. Such information is vital to the development of water supplies for indus tries and municipalities and to the proper disposal of sewage and industrial waste. Much of the information given is based on comprehensive .studies presented in other reports. A list of these reports is given for those who require more detailed information.
HISTORICAL NOTES
Economists credit Atlanta's greatness to its location. The availability of water had little to do with its growth; therefore, it is expected that there will be water-supply problems in the area. Atlanta has no harbor, no river navigation, and no large water-power developments.
Atlanta does have a strategic location close to the southern end of tne Appalachian Mountains where sev eral ridges that make excellent railway routes inter sect. This intersection was a sparsely settled forest, when, in 1837, Stephen Long drove a stake to mark the beginning of a State-owned railroad that was to run to the Tennessee River at Ross Landing. The railroads from the Atlantic Coast joined the State railroad at this point a few years later, and soon other lines from the northeast, southwest, and west appeared as naturally as spokes join a hub.
The story of the growth of Atlanta's water supply sys tem has often been told by Paul Wier, General Manager of the Atlanta Water Works. When Atlanta was a small city, well past the time of the War Between the States, her people still obtained their water supply from dug wells. Water power at small grist and saw mills took care of the limited needs of the agricultural and trading community. The mills were located at the numerous snoals of the Chattahoochee River and on Peachtree and other tributary creeks.
When dug wells proved inadequate for tne growing de mand, the city, in 1874, developed a small stream at Lakewood for public supply. The so-called artesian well at Five Points in the heart of the city was drilled in 1889.
The growing city installed a small plant, in 1893, to filter the water of the Chattahoochee River. Public opin ion was against using this supply; the people were not reconciled to drinking the "muddy river water. " How ever, these fears were soon dispelled; the small plant has grown into the magnificent system that now supplies an average of 56, 000, 000 gallons of water daily to the metropolitan area.
Electric power was first used in the city in 1885, and electric streetcars displaced the mule cars in 1889. The electric power was generated at a steam plant. By 1896, the transmission of electric energy over long dis tance was demonstrated to be feasible. This made it practical to generate hydroelectric power at inaccess ible places on the rivers. According to B. M. Hall, Jr. Consulting Engineer of Atlanta, the first hydroelectric power plant in Georgia was put into operation at Colum bus in 1896. The hydroelectric plant at Morgan Falls, 16 miles north of Atlanta, was put into operation in 1904 to supply a growing demand for power in Atlanta.
SOURCES OF WATER
The initial source of water supply in any area is pre cipitation. Of the rain, snow, sleet, etc. . that reaches the ground, part returns to the atmosphere by evapora-
WATER RESOURCES OF ATLANTA
FORSYTH COUNTYBARTOW COUNTY CHEROKEE COUNTY
GWINNETT\COUNTY
^NORCROSS
DORAVILLESOBB COUNTY
SMYRNA
POWDER SPRINGS
AUSTELLCLAw
DECATUR
DEKALB COUNTYDOUGLASVILLE
DOUGLAS Cr JNTY
COLLEGE PARK K
FOREST ]PARK L
CLAYTON P
COWETA COUNTY> FAYETTE COUNTY
Figure 1. -Map showing area within 20-mile radius of Atlanta as covered by this report,
SOURCES OF WATER
tion and by transpiration, part runs off the land and flows away immediately in streams, and the remain der percolates slowly downward through the ground, in to a zone in which all spaces between rock particles are completely filled with water. This zone is known as the zone of saturation, the top of which is called the water table if it is not under pressure,. It is water from the zone of saturation that supplies all wells and springs.
According to records of the U. S. Weather Bureau the annual rainfall in Atlanta varies from 33 to 68 inches and averages 48 inches. It is fairly well distrib uted throughout the year. The average variation of rain fall and runoff for a year is shown in figure 2. Some times there is heavy rainfall during the winter but little or no rainfall for several months during the summer or fall. However, these periods of flood and drought do not
6 -
occur too frequently in the Atlanta area. Evaporation from the land and transpiration from plant life use an average of 30 inches of the rainfall, leaving 18 inches to serve as the source of stream flow and ground water.
Metropolitan Atlanta has three basic sources of water: the ground water underlying the area, the small streams that drain the area, and the Chattahoochee River.
The Chattahoochee River is the principal source of water in the metropolitan area. The river rises in mountainous northeast Georgia and drains 1, 450 square miles of the mountain and piedmont country above At lanta. The river brings a large quantity of soft water within 6 miles of downtown Atlanta. The water is not polluted to any great extent by sewage or industrial
>EPT OCT NOV DEC JSN -FEBMARAPRWAYJUNE JULY
Figure 2. -Rainfall and runoff in the Atlanta area, by months, for an average year.
WATER RESOURCES OF ATLANTA
waste and is of excellent chemical quality for munici pal or industrial use.
The small streams in the Atlanta area offer an addi tional water supply. A study of the records of these streams reveals that they derive about two-thirds of their discharge from flood runoff and the remainder from ground-water seepage. Stream flow fluctuates greatly during the year, the minimum flow annually oc curring in October. Flow is well sustained, except in extreme droughts such as that of 1925.
In addition to surface supplies, water exists under neath the Atlanta area between grains of sand and in cracks in the bedrock. The amount of water that can be continuously withdrawn from the ground depends on the character of the rocks and on consistent replenish ment of the withdrawn water by rainfall. The charac ter of the rock formations underlying the Atlanta area permits only limited storage of ground water. The av erage production of the better wells in the area is about 40 gallons per minute. Ground water remains at about the same temperature throughout the year. This makes it ideal for use in air-conditioning systems or indus trial processes where water of constant low summer time temperature is necessary.
WATER DEMANDS
Many residents are not aware of the enormous quan tities of water used in the Atlanta metropolitan area. The daily use for domestic purposes averages about 50 gallons per day for each resident. Commercial estab lishments, such as laundries, hotels, and bakeries, use a total of 16 million gallons a day, and a number of industries require more than a million gallons a day each. The Atkinson Steam Power Plant uses 430 mil lion gallons of river water each day for cooling condens ers. The water is then returned to the river.
Industrial use of water in most cities is large, com pared with requirements for other purposes. However, water use in the Atlanta metropolitan area, with the exception of water used for cooling at the Atkinson Power Plant, is classified as 56 percent domestic, 18 percent commercial, and 26 percent industrial. The low percentage of industrial water use in Atlanta re flects the absence of manufacturing industries using large quantities of water. Atlanta is a commercial city, the distribution center for the Southeast.
The scarcity in Atlanta of manufacturing industries using large quantities of water is partly due to the lim ited amount of water available in the area at present. Modern industry requires enormous quantities of wa ter. A typical paper mill for example requires 30 mil lion gallons of treated water per day; and if the plant wastes are not to be treated an additional 1, 500 million gallons per day of untreated water will be required to dilute the wastes.
Water-Supply Systems
Most of the treated water for the Atlanta area is sup plied by the waterworks systems of Atlanta, DeKalb County, and East Point. Many industries use untreated water and obtain their supply directly from wells or the river. A brief description of the principal water sys tems of the area follows.
Atlanta water system. --The Atlanta waterworks sys tem serves the city of Atlanta and numerous unincorpo rated areas in Fulton and Cobb Counties, and nearby cit ies of Marietta and Smyrna, Hapeville and Forest Park, and military installations at Dobbins Field, Fort McPher- son, and Conley Depot.
The intake and central pumping station are on the ease bank of the Chattahoochee River just above Peachtree Creek, about 6^ miles northwest of the center of Atlanta. Storage capacity is available for 590 million gallons of raw water and 10 million gallons of treated "water. The average daily pumpage in 1950 was 56 million gallons, and the maximum daily pumpage was 68 million gallons. Use of water supplied by the city is classified as 64 per cent domestic, 20 percent commercial, and 16 percent industrial.
DeKalb County water system. DeKalb County's new water system has its intake on the Chattahoochee River, half a mile below the Fulton-Gwinnett County line. The system serves an area of 120 square miles, including Doraville, Chamblee, Decatur, Avondale, and large un incorporated sections. The availability of water in the undeveloped sections of DeKalb County has induced many industries to locate along the pipe lines. The average daily pumpage from the river in 1949 was 6. 3 million gallons.
East Point water system. --The East Point distribu tion system serves East Point and College Park, Sweet- water Creek, a tributary of the Chattahoochee River, is the source of supply. The average daily pumpage in 1949 was 2. 2 million gallons.
Atkinson power plant. --To operate at full efficiency the 240, 000-kilowatt Atkinson steam-power plant re quires 430 million gallons of cooling water per day. The power plant increases the water temperature 12° to 14° F. at full load and returns nearly all of the water to the river. Most of the water used for other purposes in At lanta is returned to the river about a mile upstream from the intake of the power plant. This water is available for cooling purposes at the power plant.
Other water-supply systems. --Many of the smaller towns in the Atlanta area obtain their water supply from wells. These wells range from 50 to 1, 000 feet in depm. The water surface is generally less than 60 feet below the ground surface and averages about 30 feet.
The rural population of the area obtains its water sup ply from either drilled or dug wells.
According to a recent survey, the total pumpage from industrial wells is estimated to be 3. 5 million gallons per day. Yields from the better wells used by industries average about 40 gallons per minute.
Summary of Present Water Demands
The peak demand for water usually occurs in Septem ber or October, when stream flow and ground-water levels are at their lowest point for the year. These de mands in the Atlanta area are summarized in millions of gallons a day (mgd) as follows:
Industrial (from private sources) . . Cooling for steam power plant .... Total ...........................
QuantitySurface Water (mgd)
50 16 1379
10 430519
Ground Water (mgd)
0.9 13
3. 5
17.4
A total of 94 million gallons per day is required for domestic, commercial, and industrial use in the area. About 80 percent of this water, or 75 million gallons
per day, is returned to the river above the steam plant and can be used for cooling. The supply required to satisfy all present demands for municipal, industrial and cooling purposes is 447 (430 +17) million gallons per day.
Future Demand for Water
Future demand for water in the Atlanta area may be estimated by studying the increase in water use during the past 30 years. The daily pumping rate of the At lanta Waterworks is a good index of water use in the area. Figure 3 shows the average daily pumping rate for each year from 1917 to 1950. The daily rate in creased 50 percent from 1940 to 1950. During this lat ter period population in the metropolitan area increas ed 25 percent. Increase of the population to the million predicted will more than double the present require ments for water.
60
50
CO^40_i <(9
Zo 3032
20
10
19
-£-^//~^ \ /
^f
15 1920 1925 1930 1935 19 YEARS
/^
//
40 1945 1950 1955
Figure 3.-Average daily pumpage by Atlanta Waterworks, 1917-50.
WATER RESOURCES OF ATLANTA
GROUND WATER
Water Bearing Formations
Three major types of water-bearing rock formations are found in the Atlanta area. These are bedrock, man tle rock, and valley alluvium.
The water-bearing bedrock of the Atlanta area is composed of crystalline igneous and metamorphic types. The metamorpnic rocks are old sedimentary rocks that were subjected to high temperature and pres sure, which caused the rocks to recrystallize. The principal types of recrystallized rocks are schist, which is characterized by tight layers glistening with mica (similar to leaves in a book), and gneiss (pro nounced nice), which'is similar in appearance to gran ite but differs from it by the presence of dark bands. The metamorphic rocks were intruded by hot molten rock which, as it cooled, crystallized into igneous rock, of which t.ie chief form in the Atlanta area is granite.
Overlying the bedrock and weathered from it is a lay er of surface-material, or mantle rock. In the Atlanta area this mantle rock has a maximum thickness of 130 feet and an average thickness of about 55 feet. The character of the mantle rock depends upon several closely related factors--namely, type of rock from which it weathered, degree of weathering, and topog raphy, the deposit being thickest in the flatter areas.
Alluvium is present only along the Chattahoochee Riv er and its main tributaries. Its maximum thickness is 30 feet. It consists of sand and gravel.
Occurrence
Ground water in the Atlanta area occurs in the myriad small openings of the mantle rock and in the cracks in the more deeply buried, unweathered bed rock (see fig. 4). The surficial mantle rock is impor tant as a source of ground water, because it acts as a giant sponge, absorbing precipitation and feeding water slowly downward to the joints of the underlying bedrock.
Fluctuations of the Water Table
The water table, shown by the water level in wells, does not remain in a fixed position in relation to the surface of the ground, but rises and falls in response to variations in replenishment of the ground water. The principal fluctuation is seasonal, but minor fluctuations may occur in days, or even hours, rather than months. Such fluctuation of the water table, for example, may be brought about artificially through pumping, land- drainage operations, and the like. If there is a general lowering of the water table over a very large area, a decrease in the amount of precipitation in the area as a whole is probably the cause.
In the Atlanta area the water table is generally high est during April and May, after the usual winter rains, and lowest in October and November, owing to the sparseness of summer and autumn rainfall and to the reduced recharge in the hot weather, when most of the rain evaporates or is consumed by vegetation. The wa ter table in the Atlanta area is generally less than 60 feet below the land surface and averages approximately 30 feet. Contrary to popular belief, the water table
Figure 4. -Ground water in crystalline rocks. (From Water-Supply Paper 232)
GROUND WATER
does not become lower each successive year, except local areas of excessive pumping (see fig. 5; also con sult water-level reports published annually by the U. S. Geological Survey).
Status of Water Table in Atlanta Area
At present the water table at well 26, Fulton County (O'Neil Bros. , East Point), is approximately 8 feet above the lowest recorded level. Over a period of 7 years the length of time in which observations have been made at this well--the water table has shown a total range of fluctuation of 12 feet. At this well, which is considered typical, the water level shows seasonal fluctuations, but has not lowered progressive ly during the period of observation.
Wells
Effect of pumping on water levels. --Pumping a well lowers the water level in the well, draws water from the water-bearing materials immediately surrounding the well, and forms what is known as a cone of depres sion in the water table (see fig. 6). As a result, ground water flows in toward the well to replenish the water removed by pumping. The area in which the water table is affected by pumping is known as the area of influence. When the rate of pumping exceeds the local rate of re plenishment, the area of influence becomes larger and the cone of depression deeper until sufficient recharge (additional water) is intercepted to balance the with drawal.
In figure 6 the water pumped came initially from the porous weathered material; the cone of depression was shallow and lowered rather slowly. When the cone of depression descended into the bedrock, more and more
Land Surface
WaterTaWe
Bed
Figure 6. -Section showing theoretical cone of water- table depression in a well,
of the water came from the bedrock, and the cone of depression became steeper and deepened more rapidly.
Progressive lowering of water levels in pumped wells. --Overpumping of wells and progressive closure of crevices feeding the wells are two possible causes of progressive lowering of pumping levels and conse quent decline in pumping yields in certain wells.
A
201 J F M A M J JASOMo'jFMAMJ JASOHo'jFHAMJ JASONo'jFMAXjJASOHo'jFMAMJJA
1946 1947 1948 "949 I9SO
Figure 5.-Hydrograph of average monthly elevation of water table (Well 26) at East Point, Ga.
WATER RESOURCES OF ATLANTA
Local overpumping may occur where a well is pumped at a rate greater than can be sustained with a pumping level at practical depth. The fault may be in the well itself it may not have intersected sufficient crevices to yield the desired supply. Or, it may be in the over all water-bearing capacity of the rock in that particular locality. This is true anywhere, not just in Atlanta. In many other areas the rocks are mtlch more productive than they are in the Atlanta area, yet individual wells or small areas can be overpumped. The answer is in holding the withdrawal to the rate found practical by hydrologic study and experience, and developing any additional water needed from other, properly spaced wells or from other sources.
Progressive closure of crevices might occur by dep osition of sediment or chemical precipitates, growth of iron bacteria or algae, or conceivably--but doubt less rarely--by weathering of the rock along the walls of crevices exposed to the air as a result of pumping drawdown. If the yield of a well falls off markedly, yet its nonpumping water level remains about the same, some sort of clogging is indicated and cleaning by a competent driller may restore the yield.
Yield of wells. Dug wells in the Atlanta area yield 2 to 5 gallons per minute. Because of their large di ameter, usually 3 to 4 feet, dug wells have a relatively large storage space, thereby supplying sufficient water for domestic use. Drilled domestic wells, usually from 6 to 12 inches in diameter, are generally much deeper than dug wells and supply from 6 to 10 gallons per min ute.
Yields of industrial and municipal drilled wells, usu ally 8 to 12 inches in diameter, range from about 2 to more than 400 gallons per minute in the Atlanta area, the average of the better wells being around 40 gallons per minute. Plate 1 shows the range in yields obtained from drilled wells penetrating different rock types in the Atlanta area. It makes clear that none of the rock units can be counted on to yield water to every single well; a "dry hole" can be obtained in any of them.
Depth of wells. Drilled wells in the Atlanta area range from 50 to more than 1, 000 feet in depth. The average depth of domestic wells is about 200 to 250 feet, and of industrial wells about 450 to 500 feet. .Be cause water-bearing fractures of any importance ' probably do not exist below a depth of 250 feet, much of the drilling that has gone into the considerably deeper industrial wells represents wasted effort. Proper pump ing tests would determine where the zone of water bearing fractures lies and would, as a consequence, produce information that eventually would lead to the elimination of much useless drilling.
\J The openings here referred to include joints, openings produced or enlarged by weathering or solution, and the like, all of which are confined to a zone lying relatively close to the surface of the ground. Other fractures, such as those due to faulting (crushing and breaking of rocks as a result of earth movements), may lie at any depth below the land surface and often yield large quantities of ground water. Fractures caused by faulting are rare in the Atlanta area and are not worth the gamble of the exploitation by deep drilling espe*- cially because even faults tend to be tighter with depth than near the surface.
Spacing of wells. --In the rocks in the Atlanta area, as elsewhere, the direction and extent of fractures or other openings is highly important, as water travels through these openings to wells. Two wells intersec - tingthesame opening or set of openings may interfere with each other; that is, one may pump out part of the water that the other would have yielded if it alone had drawn water from the opening. Therefore, the proper location and spacing of wells is necessary to obtain op timum development of the water resources in the area.
Millions of years ago a great force applie'd from the southeast pushed the rocks of the Atlanta area toward the northwest, causing them to fold and buckle as a rug does when pushed from two opposite ends. Because of this the most important openings in many rocks of this region trend northeast. The number and horizontal ex tent of these fractures vary according to rock type and even within the same rock. Because these fractures gen erally cannot be observed from the surface, the placing of one well with respect to another, in order to avoid in terference during pumping, is a difficult matter. It is usu ally a poor policy to locate one well too close southwest or northeast of another in the Atlanta area. Just what a safe spacing may be in the various types of rock has not been determined. Further, not all types of rock reflect the influence of the folding mentioned above. Among those that do not is granite, which was molten, or liquid, when forced up through other rocks in the area.
Usually it is advantageous to locate a new well south east or northwest of an existing well. If this is not pos sible and the location must be northeast or southwest of the existing well, the new one should be located at least several hundred yards from the existing well.
Eventually, improved geophysical techniques may throw light on this important problem and make it pos sible largely to avoid interference of wells.
Number and type of wells;--In rural areas the prevail ing source of ground water for domestic use is the dug well. The total number of dug wells in use in different parts of the Atlanta area is not known, but is roughly pro portional to the rural population. The number of drilled wells, for all purposes, is approximately 800 to 850, nearly half of which are in Fulton County. In metropoli tan Atlanta approximately 60 drilled wells are now being used for industrial purposes. This number may be in creased in the future, owing to the fact that industry is turning more and more to deep wells for air condition ing and other specialized uses.
Quality of Ground Water
The chemical quality of water from crystalline rocks and the related mantle rocks depends upon the type of rock from which the water is derived. In general wa ter obtained from the lighter-colored rocks is relatively soft, whereas water from darker-colored rocks is com monly harder. For example, the total hardness of water derived from granite is about 40 to 50 parts per million. The hardness of water from the darker rocks, which con tain considerable calcium and magnesium (the principal minerals producing hardness), ranges from 100 to more than 1,000 parts per million. More specifically, analy ses of water from wells penetrating granite in Cobb, Ful ton, and Gwinnett Counties showed total hardness of 48, 45, and 21 parts per million, respectively. Analyses
SURFACE WATER
of well water derived from darker-colored rocks known as pyroxenite and diorite in DeKalb and Cobb Counties showed, respectively, hardness of 111 and 253 parts per million. Well water derived from schist or gneiss ordi narily is not high in total hardness. Analyses of water from two wells penetrating mica schist and gneiss in Gwinnett County showed hardness of 21 and 58 parts respectively.
The properties that most often cause ground water to be objectionable for certain uses are excessive hard ness and excessive amounts of iron, manganese, and silica. Water from wells in the Atlanta area has a dissolved-solids content of 100 to 500 parts per million, which is not excessive. The silica pontent ranges from 11 to 45 parts per million (the latter is too high for boil er use). Iron is absent or ranges from a traceto 6. 8 parts per million (anything over 1. 0 is too high, and even smaller amounts may cause staining of clothing and fixtures).
No data are available on the quality of water in alluvi um, which so far has been penetrated by few wells.
Temperature of Ground Water
The temperature of water from deep wells in the At lanta area, as elsewhere, is relatively uniform through out the year. It ranges from 59° to 66° F. , most wells showing temperatures of 60°-62° F. Such water is ideal for air conditioning and other uses requiring low sum mertime temperatures.
Ground-Water Potential for Future Use
There is considerable potential for future develop ment of ground water in the many parts of the Atlanta area now containing few wells. One to five wells in the bedrock will generally supply a town of 2, 500, or an equivalent industrial demand. In addition, hitherto un explored and unexploited floodplain deposits (sand and gravel) along the larger surface streams of the area are thought to represent future sources of ground water whose potentiality is unknown, but probably considerable.
SURFACE WATER
The Atlanta metropolitan area lies on a ridge that divides the Chattahoochee River basin from the head waters of the Flint and Ocmulgee Rivers, and on lesser ridges of the high Piedmont Plateau. The map on plate 2 shows the location of streams in the area. The Chatta hoochee River is by far the most important stream. It drains 1, 450 square miles of mountain and high pied mont country in a long, narrow valley that gives the river good runoff rates and floods that are less severe than in many other rivers of similar size. As yet the river has not been polluted to any great-extent by sew age or industrial waste. The river approaches within 6 miles of downtown Atlanta and is the source of most of the water used in the area.
There are also many small streams in the metropoli tan area which drain into the Ocmulgee, Flint, Chatta hoochee, and Etowah Rivers. The aggregate flow of these streams is almost as great as the flow of the Chattahoochee River. As yet the streams have not been used except as a medium for disposing of the flow from sewage-treatment plants. Many of the streams are en tirely free of pollution and could serve as excellent sources of water supply.
The basis of stream-flow information is the record of daily flow at gaging stations on the rivers and small er streams. At the present time six gaging stations are maintained on streams that drain parts of the Atlanta metropolitan area. In addition, discharge measurements have been made on many of the small streams in the area during drought periods. These records of flow are published in annual Water-Supply Papers of the U. S, Geological Survey which may be consulted in refer ence libraries. For preliminary planning purposes or for developments where no great problem is involved the summarized information given herein generally will be adequate.
Because of the tremendous quantities of water in volved, stream-flow information is commonly presented in units of second-feet, the abbreviation of cubic feet per second. Flow at the rate of one cubic foot per second equals 646, 000 gallons per day or approximately 450 gallons per minute. For application to ungaged areas it is convenient to use stream flow in second-feet per square mile, which is the flow at a site divided by the number of square miles in the drainage area upstream from the site.
Chattahoochee River
The flow of the Chattahoochee River has been meas ured continuously since 1903 at gaging stations in the vicinity of Atlanta. Records from these gaging stations have been combined to represent the flow of the river at the Atlanta Waterworks. They may be used to pre dict the magnitude of future floods and droughts as long as the flow of the river remains unregulated.
The flow of the river will be greatly altered upon com pletion of Buford Dam, which is now under construction at a point 40 miles upstream from Atlanta. The pro posed regime of the river at Atlanta after completion of the dam is given in the last section.
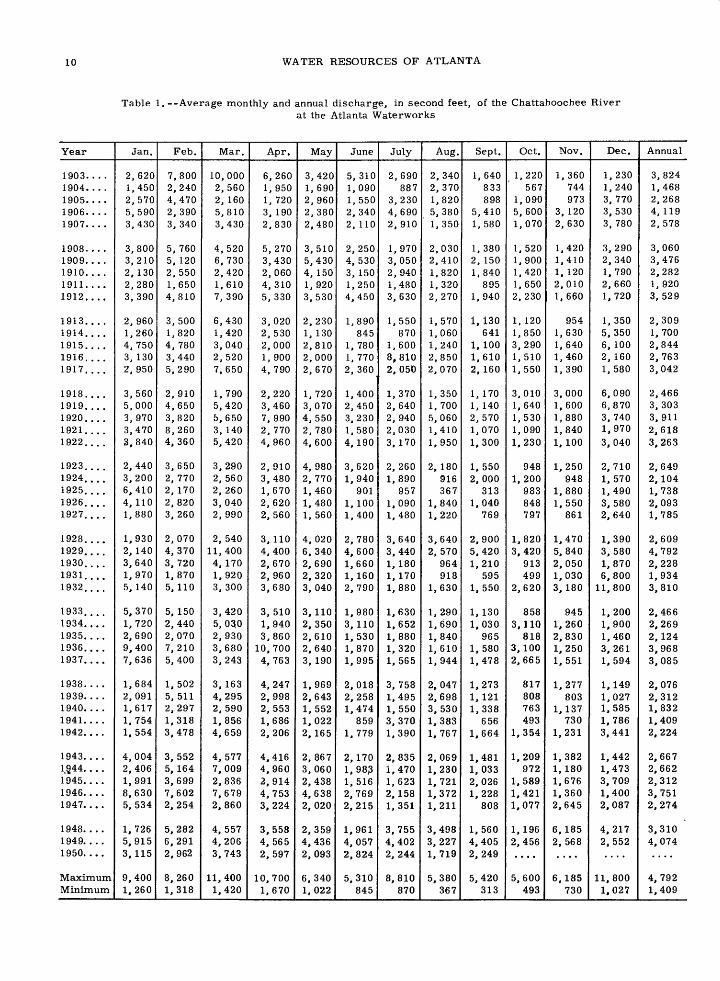
Average flow for month and year. --The average flow of the river for each month and year for the period 1903- 50 is given in table 1. The monthly mean flow varied from a. minimum of 313 second-feet in September 1925 to a maximum of 11, 800 second-feet in December 1933. The average discharge for the entire period 1903-49 was 2, 710 second-feet.
Minimum flow. --The minimum daily flow of the Chattahoochee River at Atlanta during the period 1903-49 was 154 second-feet in August 1925. However, this minimum flow was caused by regulation at two power dams which no longer exist. The lowest average dis charge for any 5-day period was 230 second-feet in Sep tember 1925. Under present-day conditions the flow of the river would not be less than 230 second-feet should a drought like that of 1925 recur.
Duration of flow. --A duration curve, which shows the percent of time that the flow is greater than any specified discharge, is given in figure 7. The curve is based on records for the period 1909-47.
Profiles of the elevation of the water surface along the river are given in figure 8 for the discharges of50 percent duration (median discharge) and 100 percent duration (minimum discharge). This information may prove useful for intake installations.
10 WATER RESOURCES OF ATLANTA
Table 1. --Average monthly and annual discharge, in second feet, of the Chattahoochee Riverat the Atlanta Waterworks
Year
1903. . . .1904. .. .1905....1906. ...1907....
1908. . . .1909... .1910... .1911. ...1912....
1913....1914. . ..1915.. ..1916. ...1917. ...
1918... .1919. ...1920. ...1921.. ..1922... .
1923.. ..1924....1925. ...1926. ...1927....
1928. ...1929... .1930. . . .1931. ...1932.. ..
1933. . . .1934....1935....1936....1937....
1938. ...1939. ...1940. .. .1941... .1942....
1943.. ..1.9.44. . . .1945. . . .1946....1947....
1948. ...1949. ...1950. ...
MaximumMinimum
Jan.
2, 6201,4502, 5705,5903,430
3,8003,2102,1302,2803, 390
2, 9601,2604, 7503, 1302, 950
3,5605,0003, 9703,4703,840
2,4403,2006,4104,1101,880
1,9302,1403,6401,9705,140
5,3701,7202,6909,4007,636
1,6842,0911,6171,7541,554
4,0042,4061,9918,6305,534
1,7265,9153,115
9,4001,260
Feb.
7,8002,2404,4702, 3903, 340
5, 7605, 1202,5501,6504,810
3,5001,8204, 7803,4405,290
2, 9104,6503,8208,2604,360
3,6502, 7702, 1702,8203, 260
2,0704,3703, 7201,8705,110
5, 1502,4402,0707,2105,400
1,5025, 5112,2971,3183,478
3,5525, 1643,6997,6022,254
5,2826,2912,962
8,2601,318
Mar.
10,0002,5602, 1605,8103,430
4,5206, 7302,4201,6107, 390
6,4301,4203,0402, 5207, 650
1, 7905,4205,6503, 1405,420
3,2902, 5602, 2603,0402, 990
2, 54011,4004, 1701,9203, 300
3,4205,03,02,9303,6803,243
3, 1634,2952,5901,8564,659
4,5777,0092,8367,6792,860
4, 5574,2063,743
11,4001,420
Apr*
6,2601, 9501, 7203, 1902,830
5, 2703,4302,0604, 3105,330
3,0202,5302,0001, 9004, 790
2, 2203,4607, 9902, 7704,960
2, 9103,4801,6702,6202,560
3, 1104,4002,6702,9603,680
3, 5101,9403,86010,7004,763
4,2472,9982,5531,6862,206
4,4164,9602,9144,7533,224
3,5584,5652,597
10,7001,670
May
3,4201, 6902, 9602,3802,480
3,5105,4304, 1501, 9203,530
2, 2301, 1302,8102,0002,670
1, 7203,0704,5502, 7804,600
4, 9802, 7701,4601,4801, 560
4,0206, 3402,6902,3203, 040
3,1102, 3502,6102,6403, 190
1,9692,6431,5521,0222,165
2,8673,0602,4384,6382,020
2,3594,4362,093
6,3401,022
June
5, 3101,0901,5502,3402, 110
2, 2504,5303, 1501,2504,450
1,890845
1, 7801, 7702, 360
1,4002,4503,2301,5804,190
3,6201,940
9011, 1001,400
2, 7804,6001,6601,1602, 790
1,9803,1101,5301,8701,995
2,0182,2581,474
8591,779
2,1701,9831,5162,7692,215
1,9614,0572,824
5,310845
July
2,690887
3,2304,6902,910
1, 9703,0502, 9401,4803, 630
1,550870
1,6008,8102,050
1,3702,6402, 9402,0303, 170
2, 2601,890
9571,0901,480
3,6403,4401,1801,1701,880
1,6301,6521,8801,3201,565
3, 7581,4951,5503,3701,390
2,8351,4701,6232,1581,351
3,7554,4022, 244
8,810870
Aug.
2,3402,3701,8205,3801,350
2,0302,4101,8201,3202, 270
1,5701,0601, 2402,8502,070
1,3501, 7005,0601,4101,950
2, 180916367
1,8401,220
3,6402,570
964918
1,630
1, 2901,6901,8401,6101,944
2,0472,6983,5301,3831,767
2,0691,2301,7211,3721,211
3,4983,2271,719
5,380367
Sept.
1,640833898
5,4101,580
1,3802, 1501, 840
8951,940
1,130641
1, 1001,6102, 160
1, 1701, 1402, 5701,0701,300
1, 5502,000
3131,040
769
2,9005,4201,210
5951,550
1, 1301,030
9651, 5801,478
1,2731,1211,338
6561,664
1,4811,0332,0261,228
808
1,5604,4052,249
5,420313
Oct.
1,220567
1,0905,6001,070
1, 5201, 9001,4201,6502,230
1, 1201,8503,2901,5101, 550
3,0101,6401,5301,0901,230
9481,200
983848797
1,8203,420
913499
2,620
8583,110818
3, 1002,665
817808763493
1,354
1,209972
1,5891,4211,077
1,1962,456
5,600493
Nov.
1,360744973
3, 1202, 630
1,4201,4101, 1202,0101,660
9541,6301,6401,4601,390
3,0001,6001,8801,8401, 100
1,250948
1,8801,550
861
1,4705,8402,0501,0303, 180
9451,2602,8301,2501,551
1,277803
1,137730
1,231
1,3821,1801,6761,3602,645
6,1852,568
6,185730
Dec.
1, 2301,2403, 7703,5303, 780
3,2902, 3401, 7902,6601,720
1, 3505, 3506, 1002, 1601,580
6,0906,8703,7401,9703,040
2,7101, 5701,4903,5802,640
1,3903,5801,8706,800
11,800
1,2001,9001,4603,2611,594
1,1491,0271,5851,7863,441
1,4421,4733,7091,4002,087
4,2172,552
11,8001,027
Annual
3,8241,4682,2684, 1192,578
3,0603,4762,2821, 9203,529
2,3091,7002,8442, 7633,042
2,4663,3033,9112,6183,263
2,6492,1041,7382,0931,785
2,6094,7922,2281,9343,810
2,4662,2692,1243,9683,085
2,0762,3121,8321,4092,224
2,6672,6622,3123,7512,274
3,3104,074
4,7921,409
SURFACE WATER 11
Flood flow. --Most of the developed residential and industrial area is located well above the level of the Chattahoochee River. However, as further expansion takes place there will be a tendency to use all available space, and unless the flood plain of the river is proper ly marked, expensive developments may be placed where they will be subject to severe damage. The two greatest floods of record occurred in 1919 and 1946. Figure 8 shows profiles of water-surface elevations along the river for the maximum flood of record and for a flood with average recurrence interval of 50 years. A graph of the average recurrence interval of any given annual flood flow of the Chattahoochee River at Atlanta is given in figure 9. Annual flood is the highest peak flow in a year; therefore, there is only one annual flood per year. The second highest flood in a given year may out rank many annual floods. Flood frequencies are usually prepared using only annual floods because much less computation is required and the results are satisfactory for most purposes. A peak flow of 25, 000 cubic feet per second will occur as an annual flood on the Chattahoochee River at Atlanta on the average of once in 3 years (fig. 9). However, a peak flow of 25, 000 cubic feet per sec ond will occur more frequently than once in 3 years be cause in some years such a flood may occur as the sec
ond or third highest. Theoretically, a peak flow of 25, 000 cubic feet per second that occurs as an annual flood once in every 3 years, will actually occur once in every 2\ years. Also, an annual flood, with a recur rence interval of 1.15 years will occur on the average once in every half a year if all floods are considered. Recurrence intervals greater than 10 years are almost the same whether annual floods or all floods are used, therefore, either type of frequency curve may be used for design purposes if the recurrence interval is great er than 10 years.
Regime of flow after completion of Buford Dam. -- The construction of Buford Dam at a point 40 miles up stream from Atlanta was begun by the Corps of Engi neers in 1950. This dam and reservoir will have a pro found effect upon the growth and development of the At lanta area, for it will reduce the flood hazard, make the production of hydroelectric power possible, increase the low flow of the river substantially, and provide a huge lake for recreational purposes.
Buford Dam was justified economically on the basis of peak production of power. The demand for electric power is much greater in the early morning and late
PERCENT OF TIME DISCHARGE EQUALED OR EXCEEDED THAT SHOWN
Figure 7.-Duration of daily flows, 1909-47, Chattahoochee River at Atlanta Waterworks.
12 WATER RESOURCES OF ATLANTA
UJ
730
DISTANCE3IN MILES
Figure 8.-Profile of water-surface elevations for various flows of the Chattahoochee River,
SURFACE WATER 13
i- 50 -
Ul
1Qz§40 ::UJ(O
02^l
(A= 30-
X1-z
$ 20 -orXoW/
o ^.
10 "tf *
g^ ^
5 ^>
^fP«** * ^
^
^^ ^
^^
^ -^ "
-
,
j
-h- --h----h---T"
:c: :i_.i_.__
r~ 0 ^*
-t- ^B - !j
^^ s
j ! i t* *
*
^*- ,
*
j^
0!^ ^
ZJ "" ?
C 5--
^^ *
f -- jWi '
j^
p-t
^
^ &
^ »^
r^ V3 2^:
^^4
- ^* *
^
s^
^^
* s "^ *
^ *^ *
^ ^^
B - *a " * "
^ p- ^*>
pi '^ '
^ ^^ "
- 1 ^
« ff * *p« * * " *"
.. . . - - . .....
1.2 1.3 1.5 2 3 4 5 6 7 8 9 10
RECURRENCE INTERVAL. IN YEARS20 30 40 50
Figure 9.-Frequency of annual floods, Chattahoochee River at Atlanta Waterworks.
WEDNESDAY SATURDAY
Figure 10. -Effect of Buford Reservoir on flow of Chattahoochee River at Atlanta, Ga., during a drought such as that of 1925 (flow pattern proposed by Corps of Engineers).
14 WATER RESOURCES OF ATLANTA
afternoon than it is during the remainder of the day and is at its lowest on Sunday. The steam-powered genera tor is handicapped in meeting these violent fluctuations of power demand because the amount of steam produced cannot be varied quickly. Generation of electric power can be varied instantly by controlling the quantity of wa ter released through the turbines. The use of steam power for the steady load and water power for the chang ing load makes an ideal combination.
The Corps of Engineers have released preliminary plans for the operation of Buford Dam. A continuous load will be carried on a 6, 000-kilowatt generator re quiring a flow of about 600 second-feet. Peak power will be generated by two 40, 000-kilowatt generators which will require a maximum flow of about 8, 000 second-feet for 5 hours each day except Saturday and Sunday.
The weekly pattern for drought conditions is compared with the flow for the lowest week during the drought of 1925 in figure 10. The water released at the dam would raise the minimum flow of the stream from 154 second- feet to 600 second-feet. The daily fluctuations in flow from Tuesday to Saturday will provide an additional average daily flow of 1, 000 second-feet for that period. This fluctuating flow could be used to dilute the con trolled release of industrial waste or sewage.
The weekly pattern for normal hydrologic conditions is compared with the natural flow of the river for a nor mal week in figure 11. The regulated flow on many days will be lower than the natural flow of the river. This may force some changes in the treatment and release of sewage in Atlanta.
The storage in Buford Reservoir reserved for flood control will be sufficient to block completely a flood as large as any that occurred during the past 60 years. This storage will reduce but not eliminate floods at At lanta. Flood flow from the 390 square miles of tributary
area between Buford and Atlanta could cause the river to overflow its banks. However, the flood periods will be of short duration and will not occur as often as in the past. The estimated frequency of floods after the completion of Buford Dam is shown in figure 9. A pro file of the water-surface elevations for the flood having a recurrence interval of 50 years after completion of Buford Dam is shown in figure 8.
Other Streams in the Metropolitan Area
There are many small streams in the metropolitan area which could serve as excellent sources of water supply. Information on the flow of these streams is presented in terms of second-feet per square mile. The information is based on continuous records at four gag ing stations on streams that drain the area, and many discharge measurements of other streams in the area during drought periods. A list of drainage areas at various points along the streams is given in table 2.
Average flow. --Streams draining the metropolitan area have an average flow of 1. 36 second-feet per square mile.
Minimum flow. --The minimum flow of streams in the area occurred in August and September 1925 and was 0. 03 second-foot per square mile. Except for this 2-month period, the flow of the streams is believed to have been at least 0. 09 second-foot per square mile during drought periods from 1890 to 1950.
Flood flow. --The flood plains of some of the smaller streams in the area are already being utilized for housing developments, usually without knowledge of the streams' flood potentials. Figure 12 shows the annual flood having average recurrence intervals of 5, 10, and 50 years for streams draining more than 20 square miles. Sufficient records to define the flood potential of drainage areas smaller than 20 square miles are not available.
WEDNESDAY SATURDAY
Figure ll.-Effect of Buford Reservoir on flow of Chattahoochee River at Atlanta, Ga., during normal flow(Flow pattern proposed by Corps of Engineers)
SURFACE WATER
Table 2. --Drainage area of streams in the Atlanta metropolitan area
At Macon DriveAt Jonesboro RoadAt Candler RoadAt State Highway 155At sewage disposal plantAt McDonough RoadAt State Highway 155At State Highway 42At State Highway 12At State Highway 212At Southern RailwayAt State Highway 42At U. S Highway 29At U. S. Highway 29At U. S. Highway 78At State Highway 124At U. S. Highway 78
Drainage area (square miles)
6.414. 562
15010.28.8
19.33. 2
27.417.024.64948
9.68.6
29.6156
Apalachicola River Basin
Soap CreekLong Island CreekRottenwood CreekNorth Fork Peachtree Creek
North Fork Peachtree Creek North Fork Peachtree Creek North Fork Peachtree Creek Montreal Branch Burnt Fork Creek
At Lower Roswell RoadAt North Side DriveAt Terrell Mill RoadAt County Road \ mile upstream from Peachtree
BranchAt Shallowford Road At Clairmont Road At La Vista RoadAt County Road 0. 3 mile west of Montreal At County Road 1^ miles upstream from
Decatur waterworks At Montreal Road At Lawrenceville Road At Cheshire Bridge Road At Southern Railway At Northside Drive At Shallowford Road At Wieuca Road At Paces Ferry Road At Fairburn Road At Fairburn Road At Wards RoadAt Blair Bridge 5| miles upstream from mouth At mouth \ mile west of Cambellton At State Highway 41 At State Highway 41 At State Highway 54 At State Highway 54
39. 57.2
14. 0
10.818.33243
1.7
3.67.5
12. 731. 175889.0
24.838.28.3
13. 75. 5
24629. 74328. 039. 364.4
Mobile River Basin
Proctor Creek
Noonday Creek
At sewer outfall, 1, 000 feet upstream fromCounty Road 1 mile south of Acworth
At County Road, lj miles southwest of Woodstock1952
\J See numbered points on plate 2
16 WATER RESOURCES OF ATLANTA
15000
10000
8000
^ 5000z84000UJ CO
2:3000
UJ <£> <£
22000 oCO
o | 500
UJo_
1000
800
800
500
7
20 30 40 50 60 80 100 150 200
DRAINAGE AREA IN SQUARE MILES
Figure 12. -Frequency of annual floods on streams draining the Atlanta metropolitan area
300
Quality and Temperature of Surface Water
Quality. --No water as found in nature is pure. When rain or snow eomes in contact with the ground it not only carries away silt in suspension but dissolves some of the minerals present in the earth's crust. The water absorbs additional impurities from decayed vegetation and from the wastes of man and industry.
The character of these impurities often limits the uses for which the water is suitable. Excessive amounts
of some minerals are harmful to man's health, calcium or magnesium salts make the water hard and unsuitable for domestic use or for use as condenser water in a steam boiler, and as little as 0. 5 part per million of iron causes rust spots on plumbing fixtures and renders the water unsuitable for laundering, dyeing, making white paper, and many other manufacturing processes.
Analyses of water are made for many purposes. A variety of chemical, physical, or bacteriological tests may be required to show whether a water is satisfac-
SUMMARY 17
tory for a proposed use. The characteristics and min eral constituents here considered include those gener ally found to iiave practical effect on the value of the water for most industrial and domestic -ases.
Information on the quality of surface water in the vi cinity of Atlanta is given in table 3. The table includes the average analysis of daily samples taken from the Chattahoochee River about 2 miles above the Atlanta Waterworks, 1937-38, and an analysis of one sample from each of four other streams in the metropolitan area.
Surface waters in the vicinity of Atlanta have a low mineral content and are very soft. No mineral or salt is found in sufficient quantity to be objectionable for in dustrial processes or human consumption. The chemi cal character of surface water in the area is relatively uniform; as shown in figure 13, the water of tne Chatta hoochee River is low in mineral content and very soft regardless of flow. All samples taken in the area show a dissolved-solids content of less than 67 parts per mil lion and a total hardness of less than 22 parts per mil lion.
Temperature. --The temperature of the water of the Chattahoochee River was measured daily from July 1937 to April 1938 at a point 2 miles upstream from the Atlanta Waterworks. This information is given in graph ic form in figure 14 and illustrates the usual range in natural temperature of the river water. Return of con denser water from the Atkinson Power Plant to the riv er raises the temperature of the river water from 5° to 20° at the point of entry during low-flow periods, accord ing to information from the Georgia Power Co.
Information on the temperature of water in the small er streams has not been obtained. However, the aver age monthly temperature of the waters of most streams is usually about the same as the mean monthly air tem perature, which ranges from 32° to 85° F. in the Atlan ta area.
Pollution. --Very little raw sewage or industrial waste is discharged to the streams in the metropolitan area. The Atlanta Metropolitan Sewer System handles most of the sewage for the Fulton-DeKalb area through its nine plants. The volume of flow from each sewage plant is listed in table 4. The point of entry of the flow into the streams is shown on plate 2. More detailed information may be secured from the Georgia Department of Public Health.
Trends
Studies of long-term records of the Chattahoochee Riv er (Langbein and others, 1950, p. 804) indicate no sig nificant changes in the flow pattern of the rive.r. How ever, turbidity observations made at the Atlanta Water works indicate that, during the past 20 years, there may have been a marked decrease in the silt load carried by the stream.
SUMMARY
The firm supply of water now available for municipal or industrial expansion in the Atlanta metropolitan area consists of: 60 million gallons per day from the Chatta hoochee River, 25 million gallons per day from small .streams, and small supplies from ground water. The amount of water intercepted for use in the area, exclud ing power generation, increased about 50 percent dur ing the past 10 years and now is about 100 million gal lons per day. Most of the water intercepted in the area is returned to the river about the Atkinson Power Plant and can be reused for condenser cooling. The power plant requires more water than is now available in drought years and would operate less efficiently or be forced to greatly reduce its output should a drought like that of 1925 recur before Buford Dam is finished.
The construction of Buford Dam or some other dam to equalize the flow of the Chattahoochee River is needed to assure the future growth and development of the area. When Buford Dam is completed it is anticipated that
Table 3. --Chemical quality of water from streams in the vicinity of Atlanta, 1937-38
JUNE AUGUST SEPTEMBER OCTOBER NOVEMBER DECEMBER JANUARY FEBRUARY MARCH
Figure 13.- Relation of dissolved solids and hardness to flow, Chattahoochee River 2 miles above AtlantaWaterworks. 1937-38.
AUS SEPT OCT NOV DEC JAN FEB MAR APR
Figure 14. -Temperature of water of Chattahoochee River 2 miles above the Atlanta Waterworks
REFERENCES CITED
Table 4. --Sewage-disposal plants in the metropolitan area
19
City
Avondale Pit.Clayton Pit.College Park Pit.Egan Park Pit.HapevilleIntrenchment Pit.South River Pit.Utoy Creek Pit.AustellAustellDecaturFairburnFairburnLithoniaMariettaSmyrnaStone Mountain
Branch to South RiverChattahoochee RiverBranch to Chattahoochee RiverFlint RiverBranch to South RiverIntrenchment CreekSouth RiverChattahoochee RiverSweetwater CreekSweetwater CreekBranch to South RiverDeep Branch CreekSpence CreekBranch to South RiverBranch to Chattahoochee RiverRottenwood CreekBranch to Yellow River
there will be enough water in the river to supply the growing city, the power plant, and almost any type of industry that wishes to locate in the area. The river will have a minimum flow, then of 400 million gallons per day, and daily fluctuations in flow will provide an additional 650 million gallons every day except Sunday and Monday. Only a small re-regulation dam would be required to smooth out the fluctuations and provide a minimum flow of 1,050 second-feet. The improved low- flow characteristics of the river should attract many large industries to Atlanta.
REFERENCES CITED
Carter, R. W., 1951, Floods in Georgia, frequency and magnitude: U. S. Geol. Survey Circ. 100.
Conservation Foundation and National Association of Manufacturers, 1950, Water in industry.
Ellis, E. E., 1909, A study of the^occurrence of water in crystalline rocks in underground water resources of Connecticut: U. S. Geol. Survey Water-Supply Paper 232, pp. 54-101.
Georgia Power Co., 1929, Year Book.
Herrick, S. M., and LeGrand, H. E., 1949, Geology and ground-water resources of the Atlanta area: Georgia Geol. Survey Bull. 55.
Lamar, W. L., 1940, Industrial quality of public water supplies in Georgia: U. S. Geol. Survey Water- Supply Paper 912.
Lamar, W. L., 1944, Chemical character of surface waters of Georgia: U. S. Geol. Survey Water-Supply Paper 889-E.
Langbein, W. B., and others, 1950, Safe yield from sur face storage reservoirs: Am. Water Works Assn. Jour., vol. 42, No. 9, pp. 799-838.
McCallie, S. W., 1908, Underground waters of Georgia: Georgia Geol. Survey Bull. 15, pp. 198'-252.
Meinzer, O. E., 1923, The occurrence of ground water in the United States, with a discussion of principles: U. S. Geol. Survey Water-Supply Paper 489.
Surface-water supply of the United States, Part 2: (pub lished annually), U. S. Geol. Survey Water-Supply Papers.
ERRATA
page 19 In line 9 read 1,050 million gallons per day.
plate 2 Morgan Fans Dam is 7 miles upstream from the indicated site.
UNITED STATES DEPARTMENT OF THE INTERIOR GEOLOGICAL SURVEY CIRCULAR 148 PLATE 1
MAP OF ATLANTA AREA SHOWING YIELDS OF WELLS PENETRATING ROCKS OF DIFFERENT TYPES
fl S«fcSS5=»irjSS=^ AL . -t~'
EXPLANATION
Biotite and muscovite granite, yields 0-30 GPM
Peridotite, yields 0-30 GPM
Augen gneiss, yields 0-30 GPM
Brevard schist, yields 0-30 GPM
Quartzite, yields 0-30 GPM
Biotite gneiss and schist, yields 0-30 GPM
Porphyritic granite, yields 0-140
GPM
Hornblende and diorite gneiss, yields 0-200 GPM
<i <
Granite gneiss, yields 0-400 GPM
10 0 20 30 Miles
UNITED STATES DEPARTMENT OF THE INTERIOR GEOLOGICAL SURVEY CIRCULAR 148 % PLATE 2