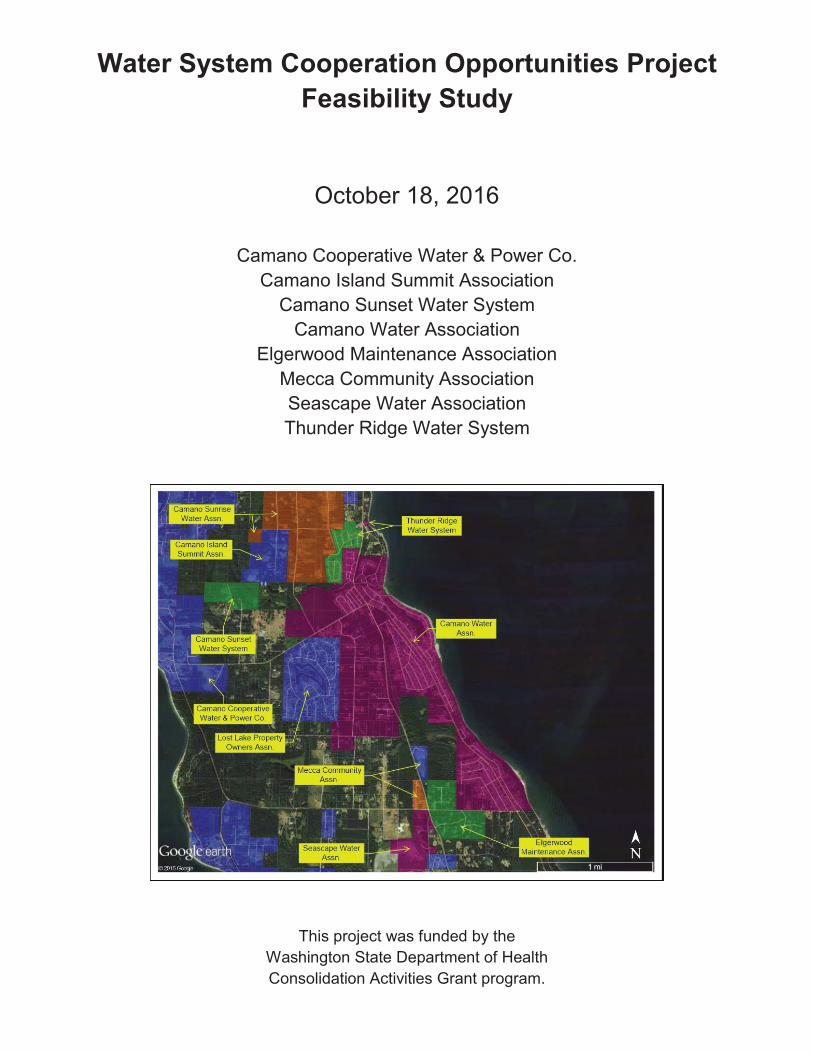
Water System Cooperation Opportunities Project Feasibility Study October 18, 2016 Camano Cooperative Water & Power Co. Camano Island Summit Association Camano Sunset Water System Camano Water Association Elgerwood Maintenance Association Mecca Community Association Seascape Water Association Thunder Ridge Water System This project was funded by the Washington State Department of Health Consolidation Activities Grant program.
Transcript
Water System Cooperation Opportunities Project Feasibility Study
October 18, 2016
Camano Cooperative Water & Power Co. Camano Island Summit Association
Camano Sunset Water System Camano Water Association
Elgerwood Maintenance Association Mecca Community Association Seascape Water Association Thunder Ridge Water System
This project was funded by the Washington State Department of Health Consolidation Activities Grant program.
Water System Cooperation Opportunities Feasibility Study, October 18, 2016 2
Executive summary With the help of a grant from the Washington State Department of Health (DOH), the Water System Cooperation Opportunities Project ran from July 2015 through August 2016. The goal was to explore opportunities for cooperative efforts among several water systems on Camano Island. This feasibility study documents this exploration and the resulting recommendations. This study looked to answer the question: “What types of cooperative working relationships among the many water systems on Camano Island might build capacity, prepare for water emergencies, and enhance operational efficiency so that a safe and abundant drinking water supply is ensured for Camano Island residents?” The assumption was that the types of cooperation could include interties, emergency preparedness, resource sharing, and selective or complete water system consolidation. Eight water systems on Camano Island participated in the feasibility study. They took part in several meetings, offered input, and shared information. A professional engineering firm worked with each water system, doing research and analysis to learn its water infrastructure, capacity, strengths, and weaknesses. This research resulted in a comprehensive capital facilities replacement plan for each system, which are included in Appendix C. At the same time, other project team members coordinated the study and met with leaders of the participating water systems to facilitate the conversation about possibilities, communicate possible outcomes, learn more about their business operations, and to uncover potential obstacles to cooperative working relationships. The results of the dialog, meetings, and research brought clarity to the benefits and challenges of various consolidation scenarios along with the impact of maintaining the status quo. The study found that it would be beneficial for all water companies on Camano Island to join as a single entity. Water customers would indeed see improved efficiencies, resource sharing leading to lower capital improvement costs, and better emergency preparedness. Roadblocks to cooperative efforts were found to be finances, reluctance on the part of specific water system leadership, and the county water system permitting process. The findings of the study were rather different from what the researchers had originally envisioned. Although there are several alternatives, stakeholders concluded that the best scenario for a safe and abundant drinking water supply for Camano Island residents is to form a local structure such as a water district or public utility district for gradual water system consolidation while also working with Island County commissioners to improve the water permit process with developers. Each water system has its unique strengths and challenges, and the chosen solution should take these into account and be sensitive to preferences of the leaders. Implementing a plan gradually over a number of years — even decades — can be part of the plan. The next step is to research the different water system structures, decide which one is most beneficial to the participating water systems and their customers, write a business plan for the new structure, and develop a project plan for implementation.
Water System Cooperation Opportunities Feasibility Study, October 18, 2016 3
Table of Contents Executive summary ............................................................................................................... 2 The current environment ....................................................................................................... 4 What kinds of cooperation might be feasible? ................................................................... 6 Implementing the feasibility study ........................................................................................ 8 Water system analysis ......................................................................................................... 10 Findings ................................................................................................................................ 12 Recommendations ............................................................................................................... 13 Next steps ............................................................................................................................. 15 Acknowledgments ............................................................................................................... 16 Appendixes ......................................................................................................................... 17 Appendix A. Data gathering phase: Sample memo and questionnaire Appendix B. Discussion of notional system consolidation Appendix C. Engineering reports for participating water systems 1. Camano Cooperative Water & Power Co. 2. Camano Island Summit Association 3. Camano Sunset Water System 4. Camano Water Association 5. Elgerwood Maintenance Association 6. Mecca Community Association 7. Seascape Water Association 8. Thunder Ridge Water System
Water System Cooperation Opportunities Feasibility Study, October 18, 2016 4
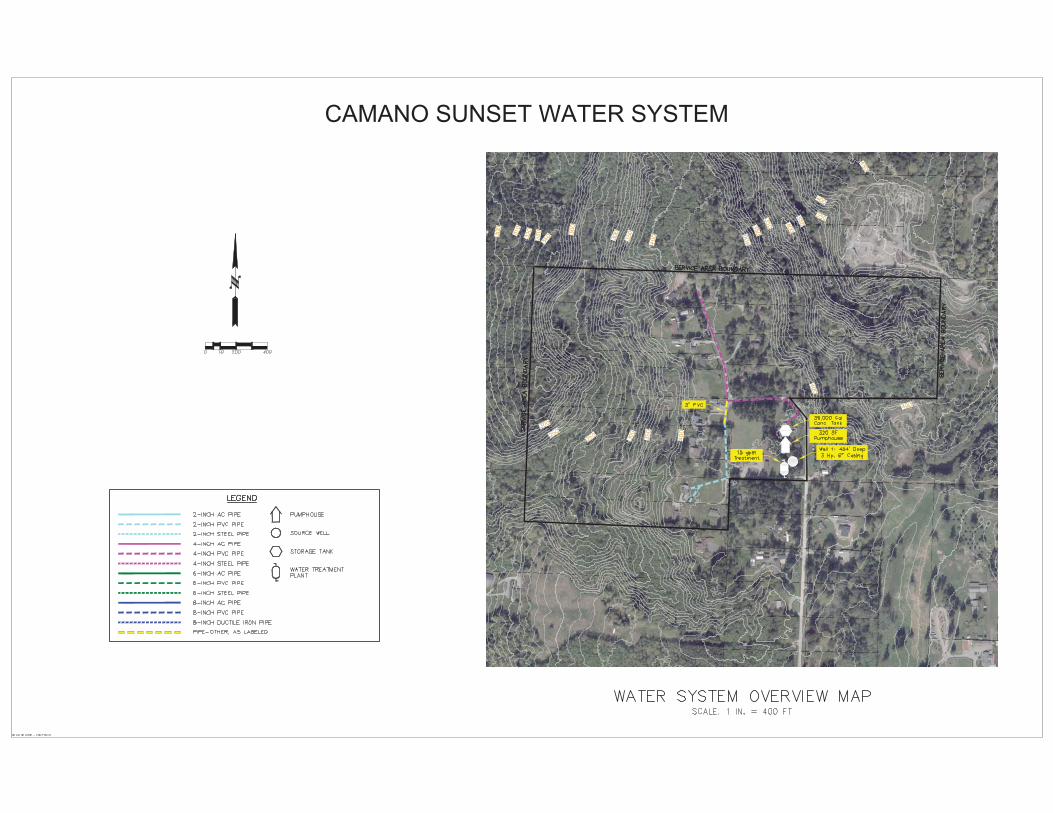
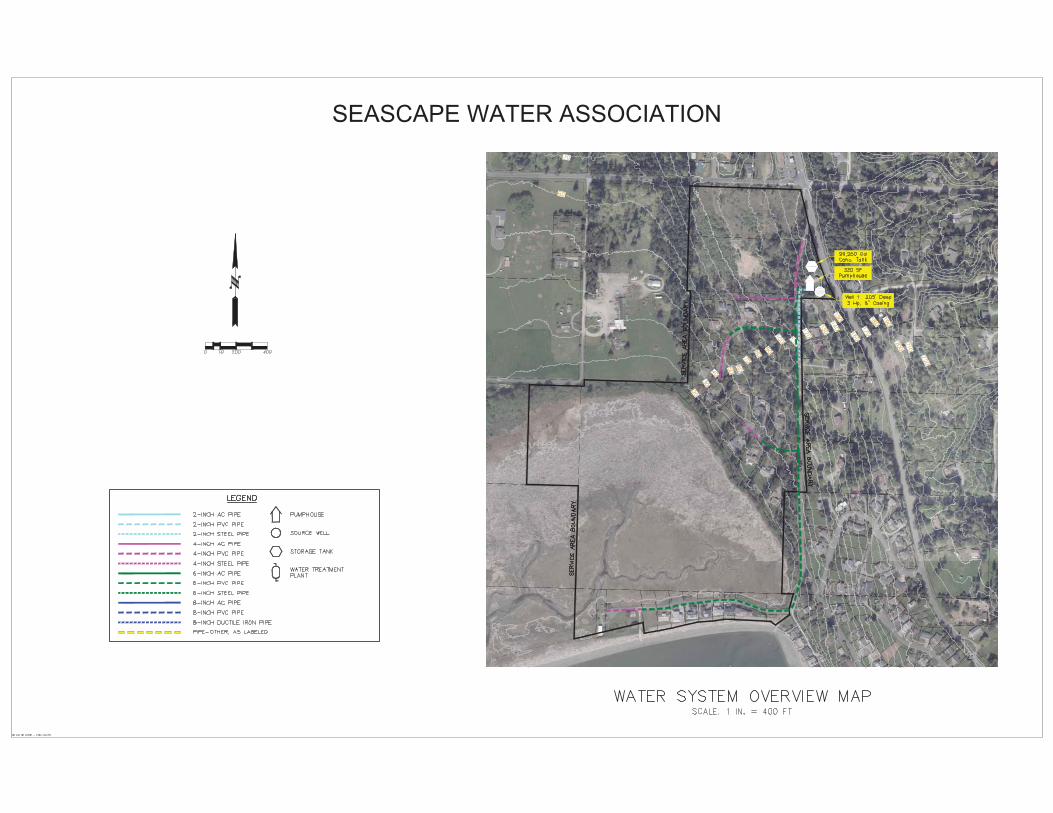
The current environment Camano Island has 329 different community water systems serving a population of about 14,000 people. Nearly all of these water systems have fewer than 100 connections. All these systems are privately owned. By contrast, the entire Seattle metropolitan area has a single water system. Ten of these Camano Island water systems are located in the central area of the island. The following map shows the service areas of the 10 central Camano Island water systems.
The Washington State Department of Health (DOH) is concerned about the proliferation of small community water systems, for the following reasons:
Many are managed by community volunteers rather than water system professionals. Most of them have limited funds for capital improvements and system maintenance. They tend to have more water quality violations and instances of regulatory
noncompliance. Some are ill-equipped to respond to water emergencies. Many are probably not able to maintain their water utility in the long-term as a
sustainable enterprise.
Water System Cooperation Opportunities Feasibility Study, October 18, 2016 5
The Washington state legislature has also expressed concern over the financial sustainability of small community water systems. The Department of Health, therefore, is motivated to consolidate water systems where it makes logical business sense. It believes that consolidated water systems can increase water source reliability and also leverage costs through economies of scale. Camano Water Association, with more than 1,000 connections, is the largest water system on the island. Several years ago, it started becoming aware of the jeopardy that multiple small water systems on the island presents to the residents, both in terms of the availability of clean and safe drinking water as well as a reliable water supply in the event of an island-wide emergency. Through informal conversations with leaders of neighboring water companies, it appeared that they shared this concern, but did not see how the problem could be solved, especially if it involved additional expenses or relinquishing control of their own community water system.
Water System Cooperation Opportunities Feasibility Study, October 18, 2016 6
What kinds of cooperation might be feasible? In February 2015, Camano Water Association applied for a consolidation grant from the Washington State Department of Health to fund the Water System Cooperation Opportunities Project. The goal was to explore opportunities and do a feasibility study for small to large cooperative efforts and capacity-building among several water systems in central Camano Island. This feasibility study report documents this exploration and the resulting recommendations. This study looked to answer the question: “What types of cooperative working relationships among the many water systems on Camano Island might build capacity, prepare for water emergencies, and enhance operational efficiency so that a safe and abundant drinking water supply is ensured for Camano Island residents?” When the project was proposed, planners expected to research up to 10 water systems in the central Camano Island area and identify each water system’s challenges and goals with regard to water safety, system sustainability, compliance, and operations. With the participating water systems, planners expected to explore opportunities to help resolve existing challenges, build capacity, or achieve organizational goals through the following types of cooperative activities:
Emergency preparedness and management Interties Resource sharing to mitigate substandard water treatment Resource sharing to mitigate unreliable or inadequate supply Resource sharing to mitigate low pressure or water outage situations Other types of resource sharing Water system consolidation or ownership transfer Other consolidation activities as yet undiscovered
It was expected that the study would clarify what was feasible in this region, along with the best options for planning and obtaining funding to implement the infrastructure improvements indicated by the study. The activities of the Water System Cooperation Opportunities Project were to:
Engage with the leaders of neighboring water systems to open the dialog about water system cooperative efforts and to participate in working meetings.
Obtain commitments from water systems who were willing to participate in the study. Conduct engineering and business operations research with each of the participating
water systems. Collate the research, analyze the findings, and make recommendations as part of the
feasibility study report.
Water System Cooperation Opportunities Feasibility Study, October 18, 2016 7
Determine the next steps for coming to consensus and the recommendations. Deliver the feasibility study report to all participating water systems, the Washington
State Department of Health as a condition of the grant, and other stakeholders. The following eight water systems committed to participate in the feasibility study:
1. Camano Cooperative Water & Power Co., #10600 2. Camano Island Summit Association, #08344 3. Camano Sunset Water System, #26951 4. Camano Water Association, #107507 5. Elgerwood Maintenance Association, #09131 6. Mecca Community Association, #22888 7. Seascape Water Association, #07095 8. Thunder Ridge Water System, #88200
The following additional water systems in the vicinity were invited but they chose not to participate in the study:
1. Camano Sunrise Water Association #1 (north area), #10746 2. Camano Sunrise Water Association #2 (south area), #29669 3. Lost Lake Property Owners Association, #48345
Because the Department of Health awarded the grant to fund the project to Camano Water Association, leaders in this water system took on the roles of project coordinator, outreach, and administration.
Water System Cooperation Opportunities Feasibility Study, October 18, 2016 8
Implementing the feasibility study The outcome of the consolidation activities for the Water Systems Cooperation Opportunities Project feasibility study was a formal analysis of the costs and benefits of initiating cooperative working relationships and building capacity among neighboring water systems up to and including system consolidation. This study consisted of multiple discussions among eight neighboring water systems and an in-depth analysis of planning, design, and engineering components for each system. The following is the timeline of major activities for implementing the Water Systems Cooperation Opportunities Feasibility Study. February 23, 2015. Camano Water Association submitted its proposal to the Department of Health Consolidation Activities Grant program, requesting $30K for the Water Association Cooperation Opportunities project. March 19, 2015. Camano Water Association received letter announcing the award of funding from the Department of Health Consolidation Activities Grant program for the full amount requested. April 9, 2015. Camano Water Association sent a letter to participating companies to inform them that grant was awarded and that work can begin with a kickoff meeting on April 22. April 22, 2015. The project kickoff meeting was held with the participating water companies. The meeting agenda included:
1. The issue of many water companies and the potential for cooperation. 2. The engineering and management research for the feasibility study. 3. The Department of Health perspective; the presentation titled “Water System
Consolidation and Restructuring” was given by DOH engineers. 4. The engineering research approach for gathering data and preparing the reports; the
presentation titled “Water System Consolidation Study” was given by consulting engineer Greg Cane.
April 29, 2015. Camano Water Association submitted the grant project scope of work and budget to the Department of Health. July 21, 2015. Engineer Greg Cane sent letters to all participants regarding the start of the data-gathering phase of the feasibility study. The letter included a questionnaire and a request to return information before the site visit. July 24, 2015. The grant contract was signed and executed by Camano Water Association Board President Dave Weir and the Department of Health. September through November 2015. Although none of the questionnaires were returned, site visits took place. Project coordinator Dave Weir, engineer Greg Cane, and others visited all
Water System Cooperation Opportunities Feasibility Study, October 18, 2016 9
participating water systems to gather data for the feasibility study and to discuss opportunities for sharing resources up to and including consolidation. December 22, 2015. A meeting was held with all participants to review project progress. Greg Cane presented a sample report for one water system. January 20, 2016. Project coordinator Dave Weir sent a letter to all participants summarizing current progress. The letter included notification of a March meeting to present preliminary engineering reports from data gathered at all systems. February 2016. Greg Cane developed the map of a possible “Central Camano Water System – 2050.” March 4, 2016. The project coordinator sent an email to all participating systems asking for their company’s overall financial information: gross revenue and expenses, capital improvements fund, and debt amount for 2015 so that financial feasibility could be assessed. The email also asked for the company’s bylaws for the assessment of legal feasibility. March 9, 2016. Greg Cane produced engineering reports (Capital Facilities Replacement Review) for all systems. March 10, 2016. A meeting was held with all participants to give a project update. Greg Cane reviewed the study’s format, results, and future possibilities. The individual reports were distributed to each company’s representatives for their review and feedback, which were requested by April 11. March 14, 2016. The project coordinator emailed all participants to request that they send a list of obstacles and concerns about moving forward with a water systems consolidation. There were no responses. April 22, 2016. No further feedback was received on the preliminary reports, and the final engineering reports were made available to all study participants. August 16, 2016. A meeting was held with local, county, and state stakeholders to discuss the findings of the feasibility study and possible next steps. This included the Water Resources Advisory Committee (WRAC), Whidbey Island Water Systems Association (WIWSA), Island County, and the Department of Health. They discussed the findings of the feasibility study, resource sharing scenarios among water systems, and possible structures for a consolidated system over the next 20-30 years. August 31, 2016. The preliminary feasibility study was delivered to the Department of Health. This marked the end of grant period.
Water System Cooperation Opportunities Feasibility Study, October 18, 2016 10
Water system analysis Before the feasibility study began, preliminary research on area water systems from records and self-reporting filed with the Washington State Department of Health specified the following known issues.
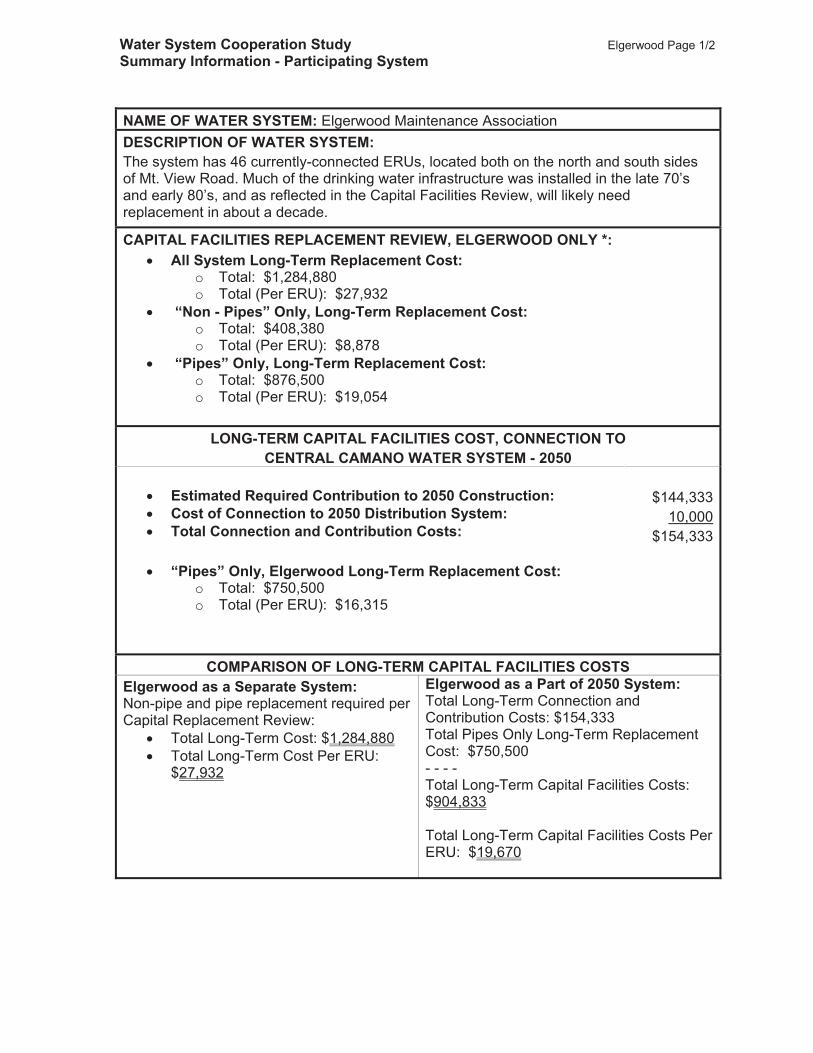
1. Elgerwood Maintenance Association Well is in an area identified as being at “very high risk” for seawater intrusion.
2. Camano Sunrise Water Association #1 (north area) (not a study participant) Some recent non-acute coliform violations.
3. Camano Sunrise Water Association #2 (south area) (not a study participant) Some nitrate impacts on well source. Recent history on non-acute coliform MCL violations.
4. Camano Sunset Water System Iron and manganese (both secondary contaminants) exceed respective MCLs. 2013 Sanitary Survey reported treatment system not functioning properly.
5. Mecca Community Association. Iron (secondary contaminant) level exceeds MCL. One recent (2013) failing total coliform test.
6. Thunder Ridge Water System 2012 Sanitary Survey recommended a second well. Recent history of non-acute coliform MCL violations. E.coli presence in the distribution system in 2011.
Eight water systems on Camano Island participated in the feasibility study. They took part in several meetings, offered input, and shared information. A professional engineering firm worked with each water system, doing research and analysis to learn its water infrastructure, capacity, strengths, and weaknesses (see Appendix A for an example of the memo, questionnaire, and preliminary research findings sent to each participating water system). This research resulted in a comprehensive capital facilities replacement plan for each system, which are included in Appendix C. This comprehensive analysis was done to thoroughly understand the resources available and the future capital requirements for each system, as this would affect opportunities for interties, resource sharing, emergency planning, and system consolidation. This analysis was also needed to determine the financial feasibility for cooperative activities. It was important to understand the resources — such as wells, water tanks, and piping — for each water facility, their age, when replacement would be necessary, how much it would cost to replace, and the number of households served. The first step of the engineering data-gathering phase consisted of collecting information from the Washington State Department of Health Sentry website, which contains public information about all water systems. The second step of the engineering data-gathering phase consisted of site visits at each of the participating water systems. The engineer visited their systems, took photos, reviewed maps,
Water System Cooperation Opportunities Feasibility Study, October 18, 2016 11
as-built drawings. He also spoke with as many water managers and board members as were available.
While the engineering research was being done, other project team members coordinated the study and met with leaders of the participating water systems to facilitate the conversation about possibilities, communicate possible outcomes, learn more about their business operations, and to uncover potential obstacles to cooperative working relationships. After the data gathering phase was complete, the second phase was data analysis and report preparation.
Water System Cooperation Opportunities Feasibility Study, October 18, 2016 12
Findings The feasibility study found that it would indeed be beneficial for all water companies on Camano Island to join as a single entity, either with coordinated management or physically consolidating. All perspectives — water systems, capital improvements, finance, and business operations — support this assertion. Water customers would indeed see improved efficiencies, resource sharing leading to lower capital improvement costs, and better emergency preparedness. Joining together as a larger water system would greatly improve a community’s ability to maintain a water utility as a sustainable enterprise in the long term. When the project was first initiated, it was expected that when all the data was gathered and analyzed, there would be a clear case for system consolidation, providing benefits for public health, customer service, and finance. The participating water systems responded initially with cooperation and degrees of enthusiasm. The principals for each system were willing to have the engineering research done on their systems. In fact, they all received, free of charge, a comprehensive water systems analysis — the Capital Facilities Replacement Review, included in Appendix C for each water system in the study. The analysis details each individual water system’s components, capabilities, and capital improvement needs and costs into future years. It also includes the number of households served. However, the project lost momentum, as meeting attendance dwindled and requests for business operations information went largely unanswered. This points to an inclination among participating parties to move more slowly, and it became clear that outcomes might not be realized for 20 years or more. The following are the key barriers to cooperative efforts that were uncovered in the study:
Finances are a roadblock to cooperation efforts. In nearly all cases, the cost to replace system components likely exceeds what the households in their service areas would be willing to pay. However, certain water systems can save a lot of money with certain interties, other joint activities, or the sharing of tanks and wells to reduce duplication.
While some leaders of individual water systems would welcome the opportunity to implement certain cooperative scenarios, others are more reluctant and even resistant. The inclination toward self-determination and autonomy might be a roadblock to cooperative efforts.
The county permitting process allows new small water systems to be easily formed. So many water systems currently exist because of the ease and low cost to drill a well, along with the state’s ease of access to water rights for an application fee of $25.
The process was invaluable to learn the capabilities of the water systems in the study area. The water infrastructure is now thoroughly understood, and there’s now a basis for informed discussion about emergency preparedness, interties, resource sharing, and consolidation. There’s also a clearer understanding about the cost savings that might be realized through certain types of relationships. This study resulted in a more open dialog among neighboring water systems.
Water System Cooperation Opportunities Feasibility Study, October 18, 2016 13
Recommendations Although there are several alternatives, the researchers and community stakeholders concluded that the best scenario for a safe and abundant drinking water supply for Camano Island residents is to establish some kind of consolidated structure that smaller water companies can join over time. Forming a water district or public utility district are possibilities for such a consolidated structure, which can ensure coordinated management and also provide the infrastructure and resources needed to physically combine wells, pipes, and other water system resources where financially advantageous. It’s also recommended that work be done with Island County commissioners to improve the water permit process with developers. Each water system has its unique strengths and challenges, and the chosen solution should take these into account and be sensitive to preferences of the leaders. Implementing a plan gradually over a number of years can be part of the plan. Over the next 20 or 30 years, it’s possible that the vision of a future “Central Camano Water System” (see the map on the next page) could become a reality. In the near term, the following actions could be considered:
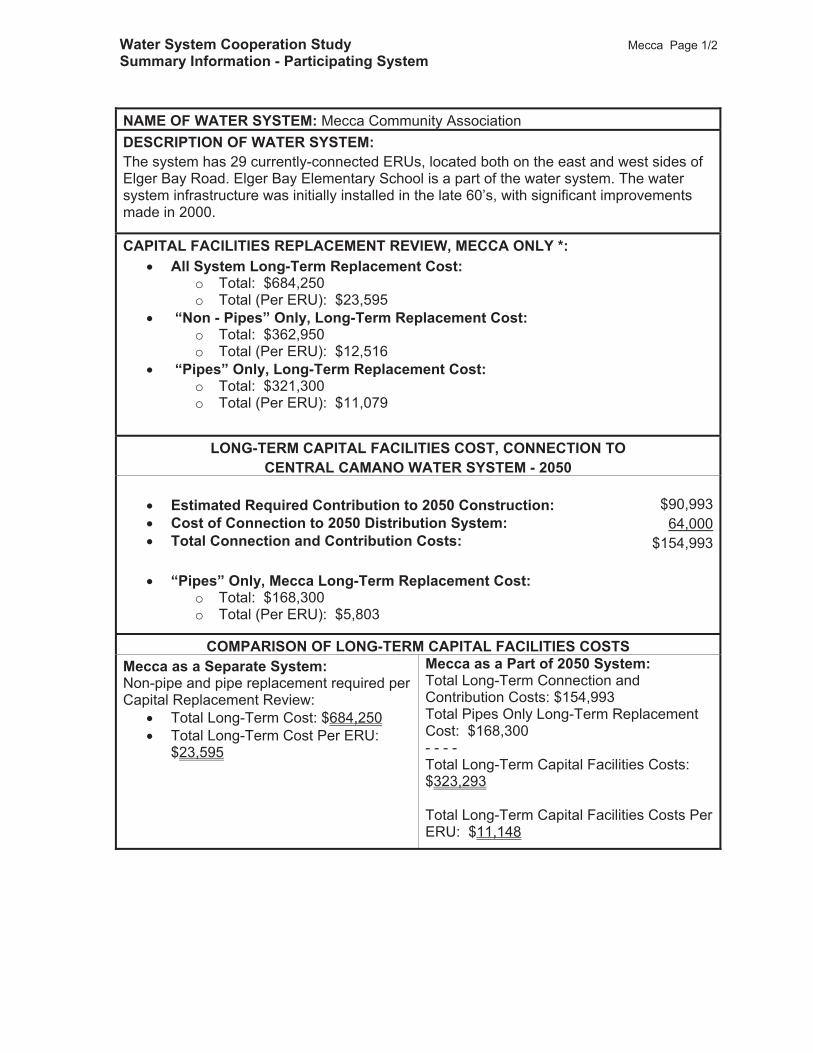
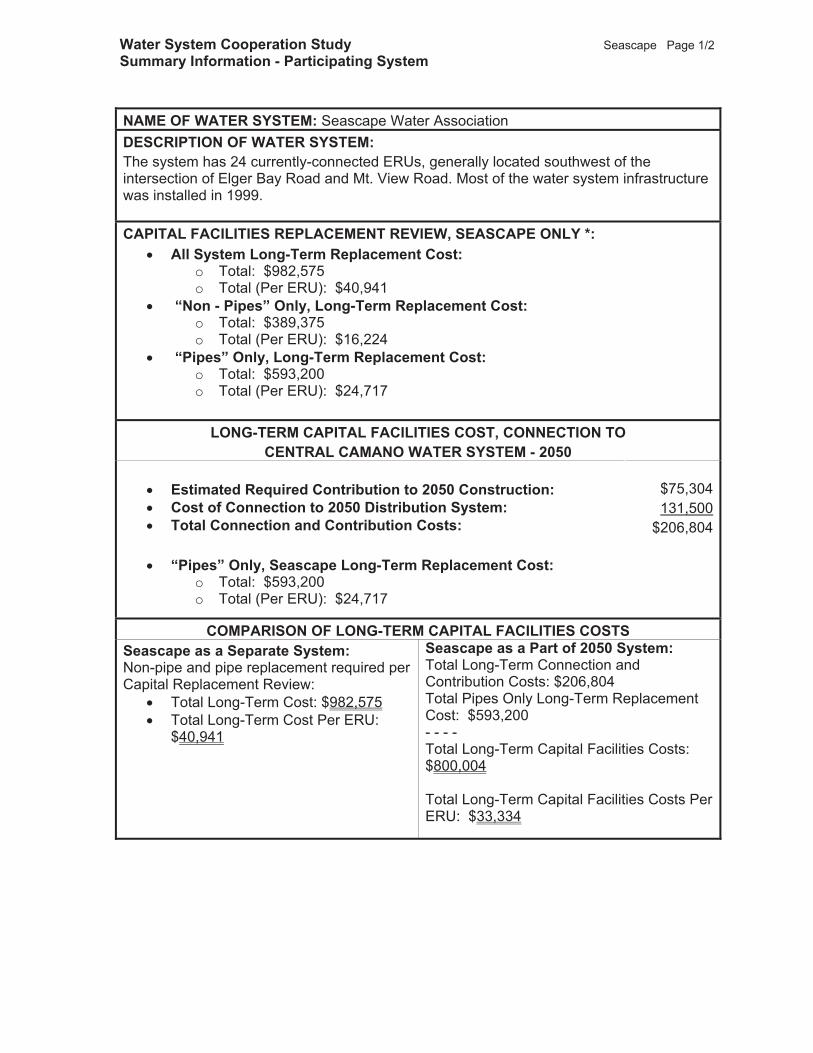
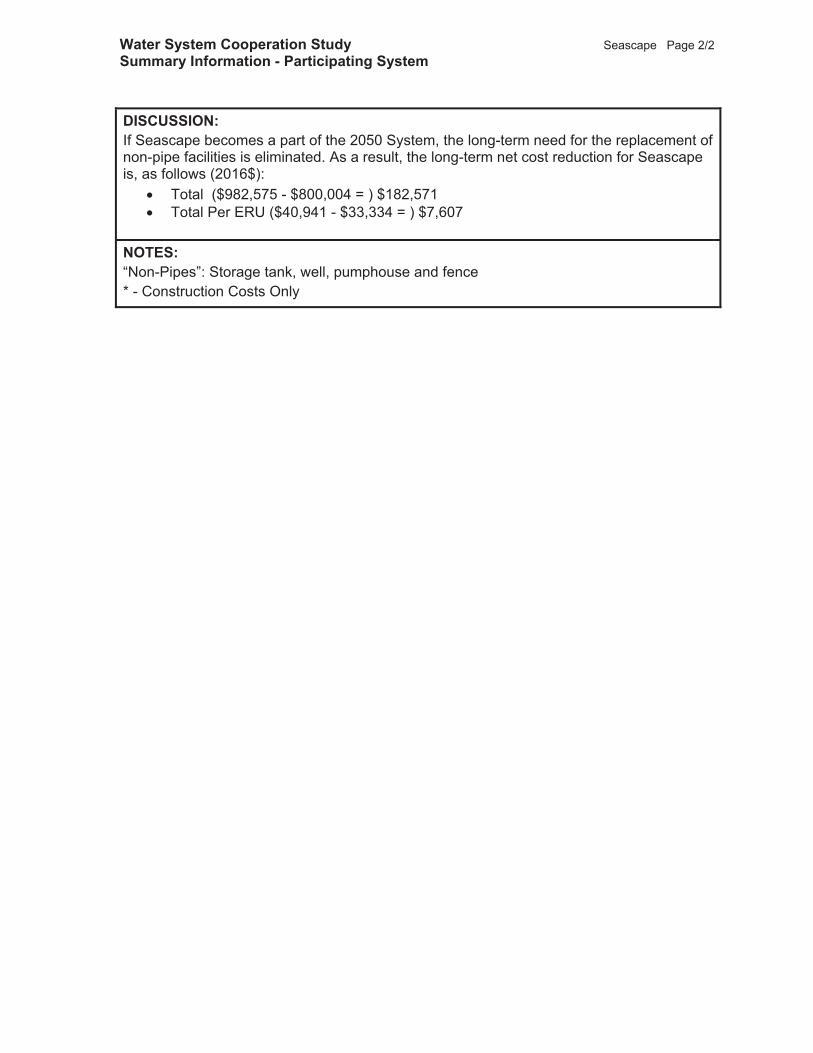
Mecca Community Association, Seascape Water Association, and Elgerwood Maintenance Association might consider sharing resources or even consolidating, as it makes good engineering as well as economic sense.
Camano Water Association and Camano Cooperative Water & Power might consider an intertie.
The other three water systems (Camano Island Summit Association, Camano Sunset Water System, and Thunder Ridge Water System) could remain unchanged for the near term, as there’s no economic sense to make any immediate changes.
For the engineering and technical details about these and other recommended actions, see Appendix B, “Central Camano Water Systems Cooperation Study: Discussion of Notional System Consolidation.” With certain incremental changes, small benefits will start to be seen in the near term. A foundation can now be laid for more far-reaching benefits in the future.
CENTRAL CAMANOWATER SYSTEM - 2050
SUMMIT:HGL 560
12 IN. WATERMAIN: 3,500 LF
SUNSET:HGL 520
THUNDER RIDGE:HGL 440
CAMANO WATER:HGL 375
MECCA (SCHOOL):HGL 290
MECCA:HGL 240
SEASCAPE:HGL 250
ELGERWOOD:HGL 370
CAMANO COOP:HGL 304
BPS: HGL 560
PRV
BPS W/ PRV: HGL 480
BPS W/ PRV: HGL 480
8 IN. WATERMAIN: 5,800 LF
PRV
PRV
PRV
12 IN. WATERMAIN: 2,700 LF
12 IN. WATERMAIN: 3,600 LF
12 IN. WATERMAIN: 2,600 LF
UPSIZECWA TANKS
Water System Cooperation Opportunities Feasibility Study, October 18, 2016 15
Next steps The following are the recommended next steps, based on the work of the feasibility study and discussions with stakeholders:
1. Research the establishment and operation of a water district, public utility district, and municipality.
2. Decide which structure is most beneficial for Camano Island water systems and their customers.
3. Develop a business plan to detail the operations, engineering, finance, legal, and personnel aspects of the new water system structure.
4. Develop the project plan to implement the new water system structure. 5. Work with Island County officials to revise the water permit process in such a way that
water system consolidation can be sustained and successful.
Water System Cooperation Opportunities Feasibility Study, October 18, 2016 16
Acknowledgments Thanks go to the following individuals for their contributions to the Water Systems Cooperation Opportunities project and this feasibility study. Dave Weir, Project Manager, Camano Water Association Robert LaLanne, Camano Water Association Duane Atkins, Camano Water Association Lenore Heffernan, Camano Water Association Peter Turner, Camano Water Association Greg Cane, P.E., Cane Engineering Jennifer Kropack, Washington State Department of Health Virpi Salo-Zieman, P.E., Washington State Department of Health Teresa Stover, Stover Writing Services
Water System Cooperation Opportunities Feasibility Study, October 18, 2016 17
Appendixes
A. Data gathering phase: Sample memo and questionnaire B. Central Camano Water Systems Cooperation Study:
Discussion of notional system consolidation C. Engineering reports for the eight participating water companies
1. Camano Cooperative Water and Power Co. 2. Camano Island Summit Association 3. Camano Sunset Water System 4. Camano Water Association 5. Elgerwood Maintenance Association 6. Mecca Community Association 7. Seascape Water Association 8. Thunder Ridge Water System
For each of the eight participating water systems, the data includes the following components as applicable:
Initial information from the Department of Health Sentry website o Water System File Report o Water Facilities Inventory Form o Pre-Adequacy Data Summary o Exceedances
Water systems overview map Final letter Capital facilities replacement review Water system components expected useful life New drilled well budget construction cost Well pump budget replacement cost Pumphouse budget construction cost Fe/Mn/As removal treatment budget cost information Reservoir budget installation cost Distribution system piping budget construction cost 4-inch PRV station (for 6” main) budget construction cost Backup generator budget installation cost Chain link fence budget replacement cost
14-05-T01 Memo w Questionnaire 09131 JL2015bg.docx
CaneEngineering
231 SE Barrington Dr, Suite 205 P.O. Box 459 Oak Harbor, WA 98277
Tel: 360-279-0615 Fax: 360-679-5046
Gregory R. Cane, P.E.
Memo To: Jeff Aschenbrenner, Elgerwood Maintenance Association
From: Gregory R. Cane, P.E.
Date: July 21, 2015
Re: Water System Consolidation Study Data Gathering Phase
Cc: Camano Water Association King Water Co.
This is in follow-up to our meeting of April 22, 2015, wherein the Water System Consolidation Study was reviewed with several water systems in the south-central Camano Island area. As I reflected at that meeting, the project will have two primary phases. The first phase (see PowerPoint slide from the presentation, below) will include data gathering. The second phase will be for analysis and report preparation. With your cooperation, I would like to begin the onsite data gathering phase. It is my hope to visit two or three water systems during each site visit.
During my site visit, I would appreciate the opportunity to talk to one or more of your Board members, as well as your Water Manager (if available).
At your earliest convenience I would appreciate if you could complete the attached questionnaire; it will help me greatly in being better prepared prior to my site visit. I have included a SASE for your convenience. Please drop the questionnaire in the mail when it is completed. We would like to have these back by August 7.
My thanks in advance. If you have questions, or need additional information, please don’t hesitate to contact me at 360-279-0615, or [email protected].
Elgerwood Maintenance Association Page 2
14-05-T01 Memo w Questionnaire 09131 JL2015bg.docx
Questionnaire:
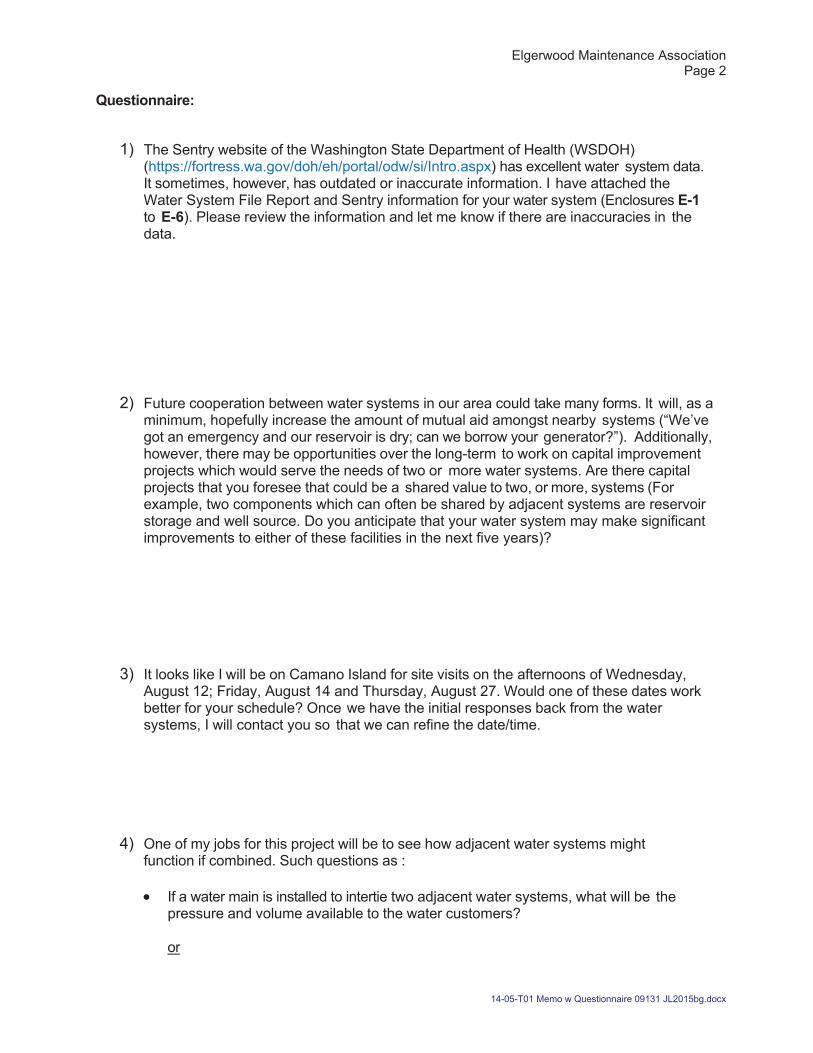
1) The Sentry website of the Washington State Department of Health (WSDOH) (https://fortress.wa.gov/doh/eh/portal/odw/si/Intro.aspx) has excellent water system data. It sometimes, however, has outdated or inaccurate information. I have attached the Water System File Report and Sentry information for your water system (Enclosures E-1to E-6). Please review the information and let me know if there are inaccuracies in the data.
2) Future cooperation between water systems in our area could take many forms. It will, as a minimum, hopefully increase the amount of mutual aid amongst nearby systems (“We’ve got an emergency and our reservoir is dry; can we borrow your generator?”). Additionally, however, there may be opportunities over the long-term to work on capital improvement projects which would serve the needs of two or more water systems. Are there capital projects that you foresee that could be a shared value to two, or more, systems (For example, two components which can often be shared by adjacent systems are reservoir storage and well source. Do you anticipate that your water system may make significant improvements to either of these facilities in the next five years)?
3) It looks like I will be on Camano Island for site visits on the afternoons of Wednesday, August 12; Friday, August 14 and Thursday, August 27. Would one of these dates work better for your schedule? Once we have the initial responses back from the water systems, I will contact you so that we can refine the date/time.
4) One of my jobs for this project will be to see how adjacent water systems might function if combined. Such questions as :
If a water main is installed to intertie two adjacent water systems, what will be the pressure and volume available to the water customers?
or
Elgerwood Maintenance Association Page 3
14-05-T01 Memo w Questionnaire 09131 JL2015bg.docx
If the well from Water System A were used to jointly serve Water Systems A and B, what size pipe would be needed to share this well supply between the two systems?
It would greatly help my work in answering these types of questions if I could receive copies of previously prepared plans, maps, and reports related to your water system. If these are available, I could make copies and return the originals to you. Or, if you prefer, there is some money in the project budget available for copying. We could reimburse your system for reproduction fees if you would like to make copies yourself. (Please let me know the approximate cost of the reproduction prior to making the copies). Does your water system have copies of plans, maps and reports that could be made available for my use?
5) During my visit, it would be very useful for me to take photographs of the various water system components. Would this be acceptable?
E-1
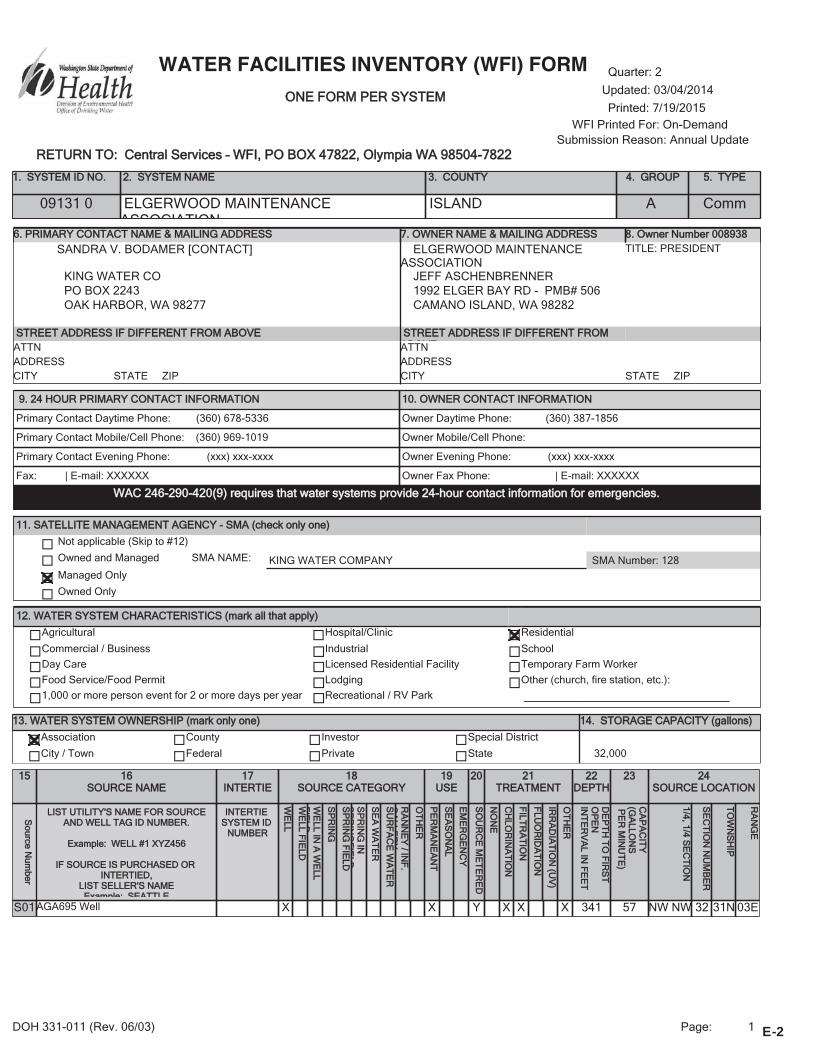
9. 24 HOUR PRIMARY CONTACT INFORMATION 110. OWNER CONTACT INFORMATION
WWAC 246-290-420(9) requires that water systems provide 24-hour contact information for emergencies.
6. PRIMARY CONTACT NAME & MAILING ADDRESS 7. OWNER NAME & MAILING ADDRESS 8. Owner Number 008938SANDRA V. BODAMER [CONTACT] ELGERWOOD MAINTENANCE
ASSOCIATIONTITLE: PRESIDENT
KING WATER CO JEFF ASCHENBRENNER PO BOX 2243 1992 ELGER BAY RD - PMB# 506 OAK HARBOR, WA 98277 CAMANO ISLAND, WA 98282
STREET ADDRESS IF DIFFERENT FROM ABOVE STREET ADDRESS IF DIFFERENT FROM ABOVEATTN ATTN
ADDRESS ADDRESS CITY STATE ZIP CITY STATE ZIP
11. SATELLITE MANAGEMENT AGENCY - SMA (check only one)
Not applicable (Skip to #12)
Owned and Managed SMA NAME: KING WATER COMPANY SMA Number: 128Managed Only
Owned Only
12. WATER SYSTEM CHARACTERISTICS (mark all that apply)
Agricultural Hospital/Clinic Residential
Commercial / Business Industrial SchoolDay Care Licensed Residential Facility Temporary Farm WorkerFood Service/Food Permit Lodging Other (church, fire station, etc.):1,000 or more person event for 2 or more days per year Recreational / RV Park ________________________________________
13. WATER SYSTEM OWNERSHIP (mark only one) 14. STORAGE CAPACITY (gallons)
Association County Investor Special District
City / Town Federal Private State 32,000
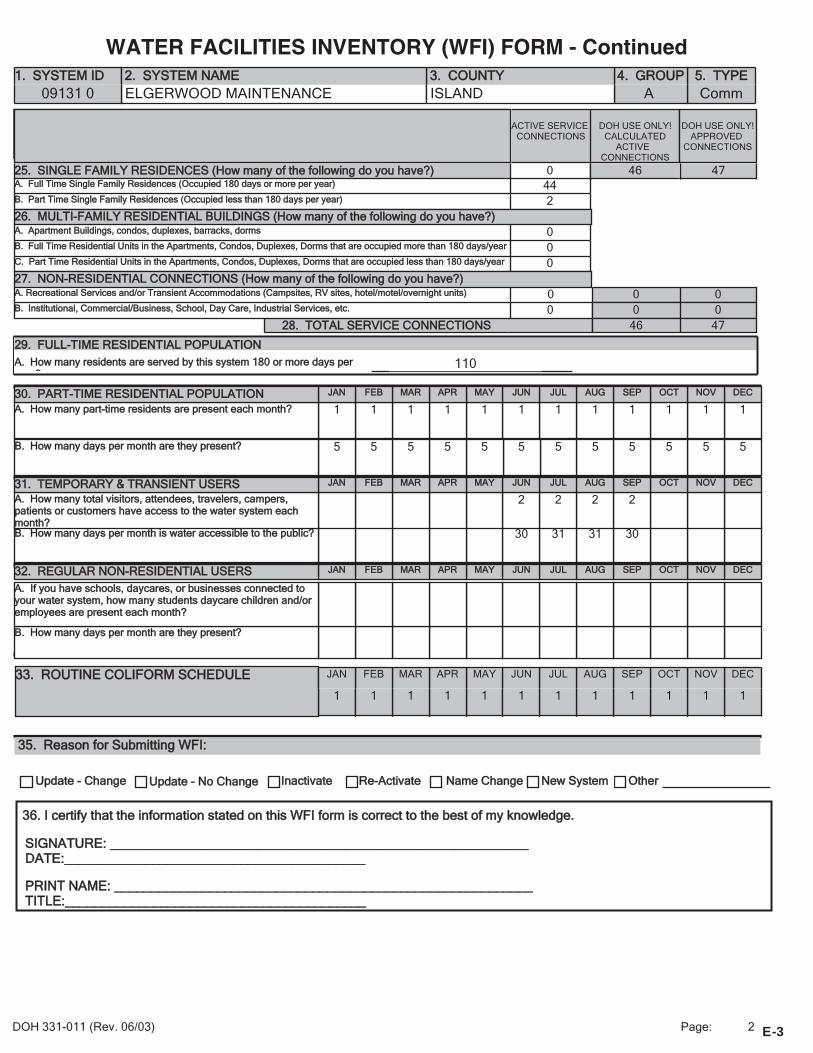
1. SYSTEM ID NO. 2. SYSTEM NAME 3. COUNTY 4. GROUP 5. TYPE
A. If you have schools, daycares, or businesses connected to your water system, how many students daycare children and/or employees are present each month?
B. How many days per month is water accessible to the public?
A. How many total visitors, attendees, travelers, campers, patients or customers have access to the water system each month?
31. TEMPORARY & TRANSIENT USERS
B. How many days per month are they present?
A. How many part-time residents are present each month?
32. REGULAR NON-RESIDENTIAL USERS
DECNOVOCTSEPAUGJULJUNMAYAPRMARFEBJAN30. PART-TIME RESIDENTIAL POPULATION
28. TOTAL SERVICE CONNECTIONS
00B. Institutional, Commercial/Business, School, Day Care, Industrial Services, etc.0A. Recreational Services and/or Transient Accommodations (Campsites, RV sites, hotel/motel/overnight units)
00
C. Part Time Residential Units in the Apartments, Condos, Duplexes, Dorms that are occupied less than 180 days/year
B. Full Time Residential Units in the Apartments, Condos, Duplexes, Dorms that are occupied more than 180 days/year0A. Apartment Buildings, condos, duplexes, barracks, dorms
244
B. Part Time Single Family Residences (Occupied less than 180 days per year)
A. Full Time Single Family Residences (Occupied 180 days or more per year)025. SINGLE FAMILY RESIDENCES (How many of the following do you have?)
26. MULTI-FAMILY RESIDENTIAL BUILDINGS (How many of the following do you have?)
27. NON-RESIDENTIAL CONNECTIONS (How many of the following do you have?)
46
046
00
47
DOH USE ONLY!APPROVED
CONNECTIONS
47
ACTIVE SERVICE CONNECTIONS
OtherNew System Name Change
Inactivate Update - No Change
Update - Change Re-Activate
Page: 2DOH 331-011 (Rev. 06/03) E-3
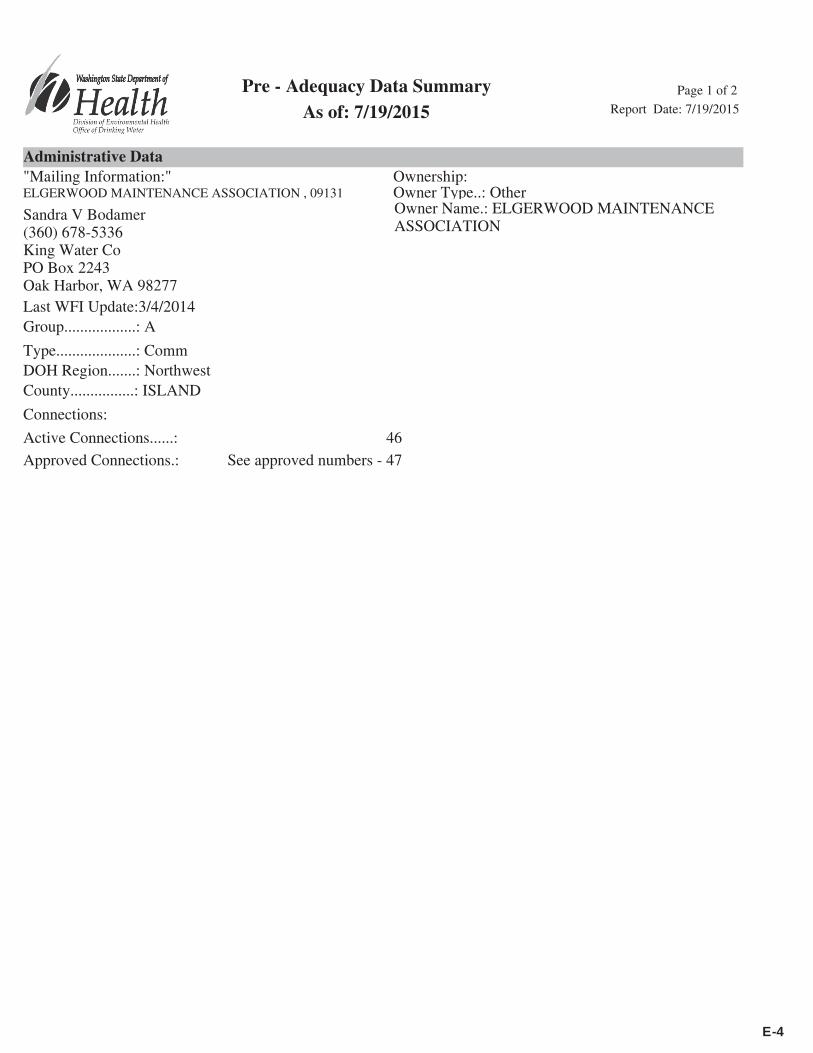
Last WFI Update:3/4/2014
See approved numbers - 47Approved Connections.:
46Active Connections......:
Connections:
County................: ISLANDDOH Region.......: NorthwestType....................: Comm
Group..................: A
Owner Type..: OtherOwner Name.: ELGERWOOD MAINTENANCE ASSOCIATION
Ownership:
Sandra V Bodamer(360) 678-5336King Water CoPO Box 2243Oak Harbor, WA 98277
"Mailing Information:"ELGERWOOD MAINTENANCE ASSOCIATION , 09131
Administrative Data
As of: 7/19/2015 Report Date: 7/19/2015
Pre - Adequacy Data Summary Page 1 of 2
E-4
Operating Permit Description
Current and Valid Operating Permit (Yes/No) - Yes
Permit Category Color.: GreenDOH Recommendation:
Green: Systems in this category are considered adequate for existing uses and new service connections up to the number of approved service connections.
*** No Current Violation Found for Water System ***
Water Quality Violations
Incident Date Severity
In Compliance
Not Required
Water System Plan Requirement
Operator Certification Requirement
Compliance Actions
*** No Current Compliance Actions Found ***
Action Status Issue Date Reason
Regional Staff Comments
This is a DOH Pre - Adequacy Data Summary for this water system that is based on information available at this time. Other entities such as Local Building, Planning and Health Jurisdictions, or financial institutions have alternative authority to make final decisions involving development, building permits and financing.
Disclaimer
** End of Report **
As of: 7/19/2015 Report Date: 7/19/2015
Pre - Adequacy Data Summary Page 2 of 2
E-5
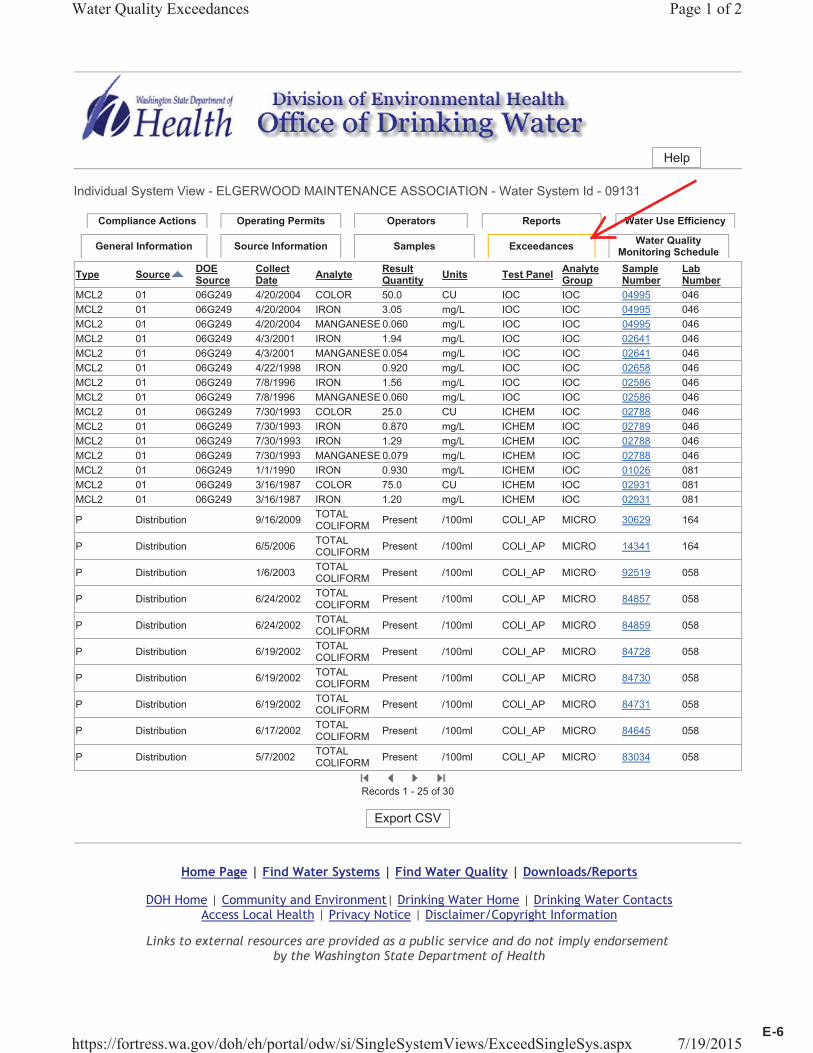
Help
Individual System View - ELGERWOOD MAINTENANCE ASSOCIATION - Water System Id - 09131
Compliance Actions Operating Permits Operators Reports Water Use Efficiency
General Information Source Information Samples Exceedances Water Quality Monitoring Schedule
Type Source DOE Source
Collect Date Analyte Result
Quantity Units Test Panel Analyte Group
Sample Number
Lab Number
MCL2 01 06G249 4/20/2004 COLOR 50.0 CU IOC IOC 04995 046MCL2 01 06G249 4/20/2004 IRON 3.05 mg/L IOC IOC 04995 046MCL2 01 06G249 4/20/2004 MANGANESE 0.060 mg/L IOC IOC 04995 046MCL2 01 06G249 4/3/2001 IRON 1.94 mg/L IOC IOC 02641 046MCL2 01 06G249 4/3/2001 MANGANESE 0.054 mg/L IOC IOC 02641 046MCL2 01 06G249 4/22/1998 IRON 0.920 mg/L IOC IOC 02658 046MCL2 01 06G249 7/8/1996 IRON 1.56 mg/L IOC IOC 02586 046MCL2 01 06G249 7/8/1996 MANGANESE 0.060 mg/L IOC IOC 02586 046MCL2 01 06G249 7/30/1993 COLOR 25.0 CU ICHEM IOC 02788 046MCL2 01 06G249 7/30/1993 IRON 0.870 mg/L ICHEM IOC 02789 046MCL2 01 06G249 7/30/1993 IRON 1.29 mg/L ICHEM IOC 02788 046MCL2 01 06G249 7/30/1993 MANGANESE 0.079 mg/L ICHEM IOC 02788 046MCL2 01 06G249 1/1/1990 IRON 0.930 mg/L ICHEM IOC 01026 081MCL2 01 06G249 3/16/1987 COLOR 75.0 CU ICHEM IOC 02931 081MCL2 01 06G249 3/16/1987 IRON 1.20 mg/L ICHEM IOC 02931 081
P Distribution 9/16/2009 TOTAL COLIFORM Present /100ml COLI_AP MICRO 30629 164
P Distribution 6/5/2006 TOTAL COLIFORM Present /100ml COLI_AP MICRO 14341 164
P Distribution 1/6/2003 TOTAL COLIFORM Present /100ml COLI_AP MICRO 92519 058
P Distribution 6/24/2002 TOTAL COLIFORM Present /100ml COLI_AP MICRO 84857 058
P Distribution 6/24/2002 TOTAL COLIFORM Present /100ml COLI_AP MICRO 84859 058
P Distribution 6/19/2002 TOTAL COLIFORM Present /100ml COLI_AP MICRO 84728 058
P Distribution 6/19/2002 TOTAL COLIFORM Present /100ml COLI_AP MICRO 84730 058
P Distribution 6/19/2002 TOTAL COLIFORM Present /100ml COLI_AP MICRO 84731 058
P Distribution 6/17/2002 TOTAL COLIFORM Present /100ml COLI_AP MICRO 84645 058
P Distribution 5/7/2002 TOTAL COLIFORM Present /100ml COLI_AP MICRO 83034 058
Records 1 - 25 of 30
Export CSV
Home Page | Find Water Systems | Find Water Quality | Downloads/Reports
DOH Home | Community and Environment| Drinking Water Home | Drinking Water ContactsAccess Local Health | Privacy Notice | Disclaimer/Copyright Information
Links to external resources are provided as a public service and do not imply endorsementby the Washington State Department of Health
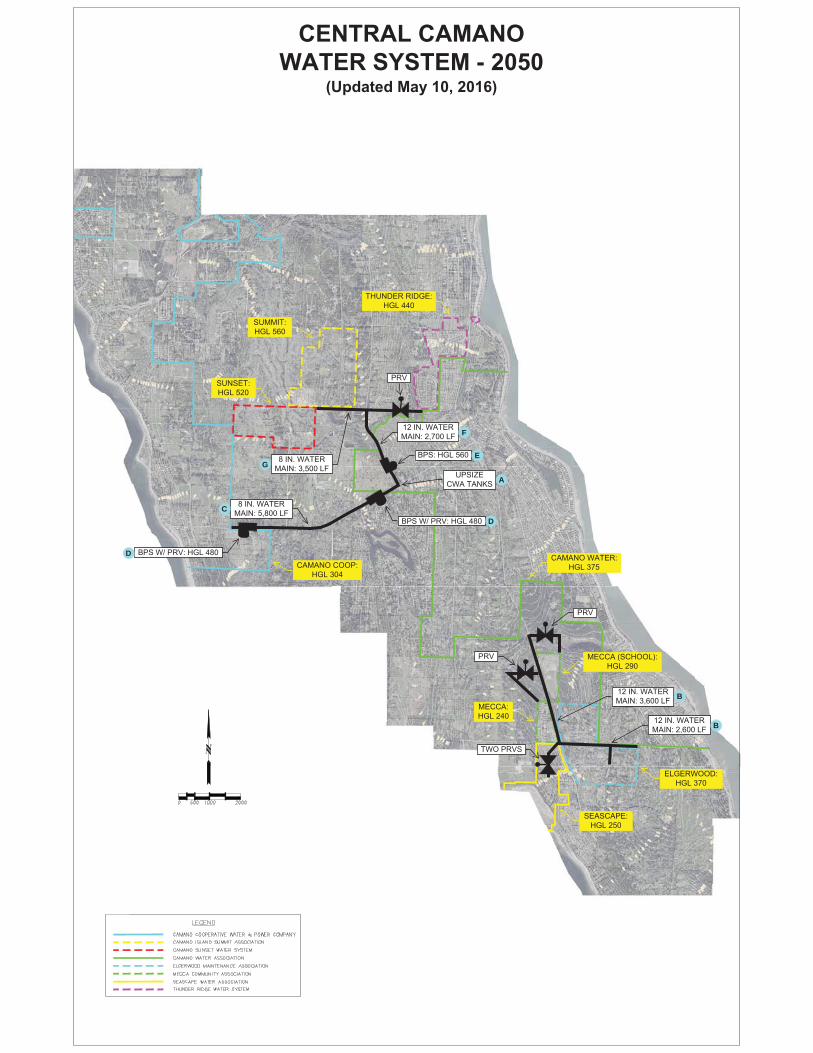
Discussion of Notional System Consolidation(Central Camano Water System - 2050)
INTRODUCTION
Lacking an imperfect “crystal ball”, there is no way of knowing what the configuration of the eight participating water systems will be in 2050, 34 years from now. In fulfillment, however, of the stated goal of the Study to provide an example of a consolidated water system, a notional Central Camano Water System (CCWS) - 2050 was created. This is just one possibility out of many reflecting how the water supply facilities in this area may be configured in the future. Given the numerous options, it is more than likely that in 34 years the water systems in this area will be different from the concept discussed here. Having said that, there is value in taking an in-depth look at the CCWS. Information relative to the improvements required and the shared and participant-specific costs/benefits, will be useful for any number of potential scenarios.
In future years, if individual systems desire to consolidate, required improvements, costs and benefits will be evaluated on a case-by-case basis.
As noted above, there are costs and benefits associated with the creation of a Central CamanoWater System. Four enclosures are provided herein which describe these costs/benefits, both from the standpoint of CCWS as a whole, and the eight study participants individually. The enclosures are listed here and are described below:
Conceptual Plan: Central Camano Water System - 2050 (Updated May 10, 2016)Table I: System-Wide ImprovementsTable II: Internal System Costs and SavingsTable III: Summary of Costs and Benefits
As a note, in order to facilitate the following discussion, the participating systems have been numbered, as follows:
System 1: Camano Water Association (CWA)System 2: Camano Cooperative Water and Power Co. (Co-op)System 3: Camano Island Summit Association (Summit)System 4: Camano Sunset Water System (Sunset)System 5: Thunder Ridge Water System (Thunder Ridge)System 6: Mecca Community Association (Mecca)System 7: Seascape Water Association (Seascape)System 8: Elgerwood Maintenance Association (Elgerwood)
CCWS - 2050 Page 1/5
DESCRIPTION OF ENCLOSURES
Conceptual Plan - Central Camano Water System - 2050
This plan graphically shows the shared improvements that would be required in order to create the CCWS combined water supply facilities. Project ID lettering isincluded in order to facilitate coordination with the report tables.
Table I: System-Wide Improvements
Improvements detailed in this table provide benefits to multiple participating water systems, as follows:
Improvement A:
106,000 gallons of additional storage volume is required if Water Systems 3 through 8 are connected to the Central Camano Water System (CCWS). Costs are shared on a per-ERU basis by the noted systems.
Improvement B:
Improvement B is the installation of a twelve (12) inch transmission main along Elger Bay and Mt. View Roads. The benefitting systems include CWA, Mecca, Seascape and Elgerwood. A possible cost sharing formula is suggested in Table III.
Improvements C and D:
These improvements include the construction of an eight (8) inch main, and associated booster pump stations, which will interconnect CWA and the Co-op. The construction of this main will add valuable source and storage redundancy for all of the CCWS. As such, costs are shared equally by all CCWS ERUs. The new main passes through an area which is currently unserved by any existing water system. Collection of latecomers fees, therefore, would be possible when future connections are made to the water main.
Improvements E to G:
These combined improvements represent the transmission main and booster station construction that will be required to serve the higher elevation water systems at the north end of CCWS. These improvements are needed in order to connect the Summit, Sunset and Thunder Ridgewater systems. Costs for the noted improvements would be shared on a per-ERU basis by these systems.
CCWS - 2050 Page 2/5
Table II: Internal System Costs and Savings
> Background:
As further discussed below, the systems are grouped according to their common characteristics:
Large Systems:
System 1: Camano Water AssociationSystem 2: Camano Cooperative Water and Power Co.
The Large Systems will retain both their pipe1 and non-pipe2
infrastructure. Analysis shows that, with minor improvements, CWA and the Co-op have adequate source, storage and water treatment capacity to serve the entire Central Camano Water System.
North Systems:
System 3: Camano Island Summit AssociationSystem 4: Camano Sunset Water SystemSystem 5: Thunder Ridge Water System
These are the higher elevation systems. A pressure boosting station and transmission mains are required to connect these to CCWS.
South Systems:
System 6: Mecca Community AssociationSystem 7: Seascape Water AssociationSystem 8: Elgerwood Maintenance Association
The South Systems are generally at lower elevations. In some cases, pressure reducing valve vaults will be required to serve the customers in these areas. Additionally, these systems are near the location of a proposed transmission main, currently slated for construction by the Camano Water Association (circa 2020).
1 Distribution system piping (and appurtenances). 2 All water system facilities except distribution system piping including, but not limited to, storage tanks, pumphouses, wells, water treatment, fencing and back-up generators.
CCWS - 2050 Page 3/5
> Internal System Costs Related to Inclusion in CCWS:
For inclusion into CCWS, each of the North and South systems will require two types of capital expenditures:
1) Improvements within their service area required to connect to CCWS, and
2) Contributions to “offsite improvements” common to CCWS in proportion to their benefit from these shared improvements.
This table evaluates internal improvements and their related costs, as described in (1), above.
> Internal System Savings Related to Inclusion in CCWS:
By connecting to CCWS, the North and South Systems will, over the long-term, be able to discontinue the use of their non-pipe infrastructure. These systems will benefit from the cost savings resulting from not havingto replace these components at the end of their useful life.
The internal improvements, and their associated costs, are reflected for the respective water systems in Columns C and D of this table. The infrastructure eliminated over the long-term, and the value of those components, is reflected in Columns E and F.
Table III: Summary of Costs and Benefits
This table provides an overview of the impacts to each of the participating water systems resulting from inclusion into CCWS, and takes into account:
The cost of internal improvements required in order to connect to CCWS.Non-pipe infrastructure eliminated, and the associated long-term savingsderived from not having to replace these components at the end of their useful life.The proportioned share of participant costs of the system-wide CCWS improvements.
The Discussion column provides a description of possible cost sharing formulas.
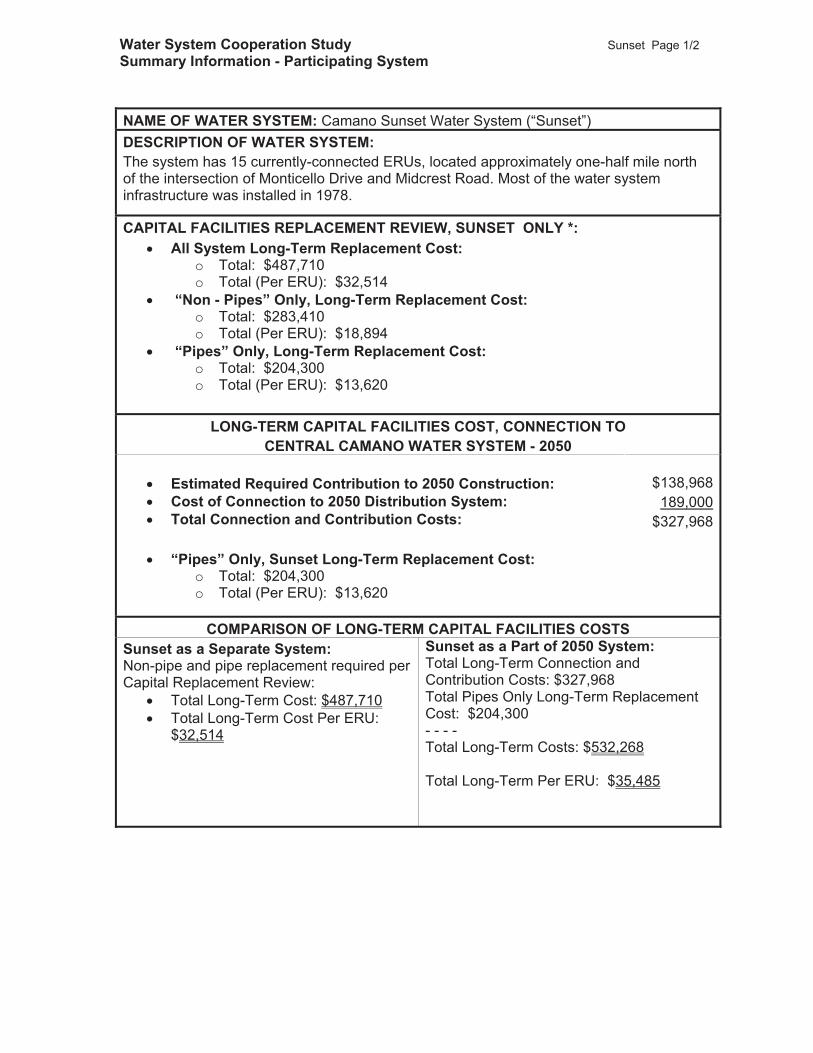
STUDY PARTICIPANTS - SUMMARY INFORMATION
For convenience, summary pages have been prepared for each of the study participants. As reflected in Figure 1, these summaries take into account the results of the Capital Facilities Replacement Review and the current analysis in order to determine the long-term additional cost (or conversely the long-term savings) associated with inclusion into the Central Camano Water System.
CCWS - 2050 Page 4/5
FIGURE 1
Water System Cooperation Study Sample Page 1/1Summary Information - Participating System
NAME OF WATER SYSTEM: Sample Water AssociationDESCRIPTION OF WATER SYSTEM:The system has 40 currently-connected ERUs, located on Appian Way, just north of Mt. Vesuvius. Much of the drinking water infrastructure was installed circa 250 BC.
CAPITAL FACILITIES REPLACEMENT REVIEW, SAMPLE SYSTEM ONLY *: All System Long-Term Replacement Cost:
o Total: $1,500,500o Total (Per ERU): $37,513
“Non - Pipes” Only, Long-Term Replacement Cost: o Total: $500,250o Total (Per ERU): $12,506
“Pipes” Only, Long-Term Replacement Cost: o Total: $1,000,250o Total (Per ERU): $25,007
LONG-TERM CAPITAL FACILITIES COST, CONNECTION TO CENTRAL CAMANO WATER SYSTEM - 2050
Estimated Required Contribution to 2050 Construction:Cost of Connection to 2050 Distribution System: Total Connection and Contribution Costs:
“Pipes” Only, Sample Long-Term Replacement Cost: o Total: $1,000,250o Total (Per ERU): $25,007
$155,00020,000
$175,000
COMPARISON OF LONG-TERM CAPITAL FACILITIES COSTSSample as a Separate System: Non-pipe and pipe replacement required per Capital Replacement Review:
Total Long-Term Cost: $1,500,500 Total Long-Term Cost Per ERU:
$37,513
Sample as a Part of 2050 System: Total Long-Term Connection and Contribution Costs: $175,000 Total Pipes Only Long-Term Replacement Cost: $1,000,250- - - - Total Long-Term Capital Facilities Costs:$1,175,250
Total Long-Term Capital Facilities Costs Per ERU: $29,381
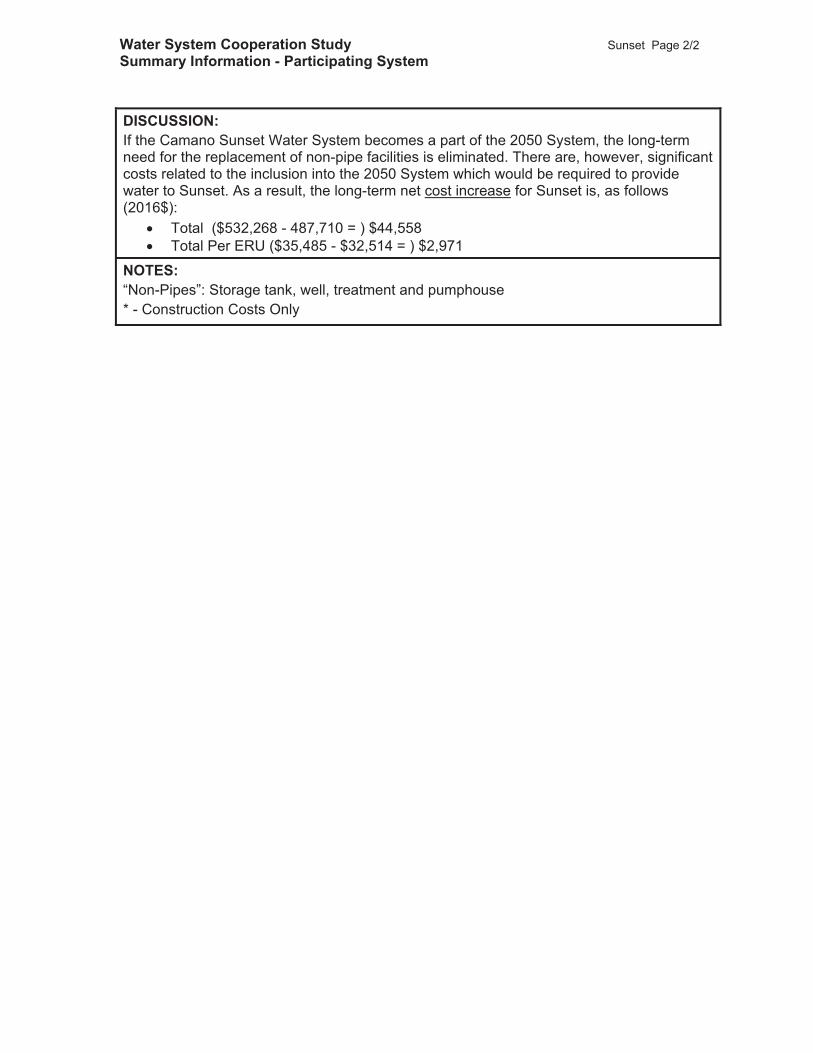
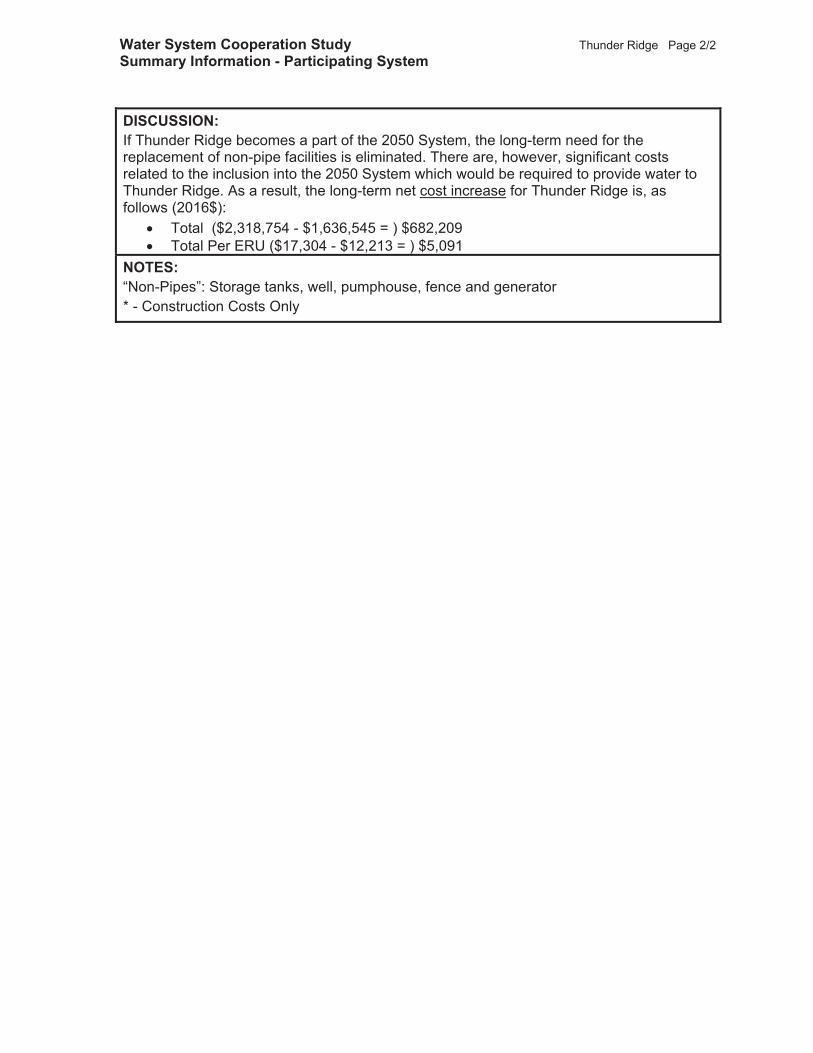
DISCUSSION:If Sample becomes a part of the 2050 System, the long-term need for the replacement of non-pipe facilities is eliminated. As a result, the long-term net cost reduction for Sample is, as follows (2016$):
Total ($1,500,500 - $1,175,250 = ) $325,250 Total Per ERU ($37,513 - $29,381 = ) $8,132
NOTES: “Non-Pipes”: Cistern tank, well, and windmill * - Construction Costs Only
CCWS - 2050 Page 5/5
This is the construction-onlyreplacement cost of the watersystem, as determined by theCapital Facilities Replacement
Review enclosed with thisCooperation Study.
"Pipes" is all distribution systempiping and appurtenances. "Non-Pipes" is all other infrastructure,
generally including the well, storagetank and pumphouse.
Proportioned share ofimprovements to "core" 2050System. These improvements
will be needed in order toserve the 2050 System as a
whole.
These costs are for the connection to the 2050 distributionsystem for work required inside the the service areas of
the respective systems. Connection costs vary widely andcan range from a simple tap onto an adjacent water main,
to a long water main extension.
The replacement cost for pipes is the same for bothoptions (Separate System, or part of the 2050 System).
In the long-term, it is less expensive for the SampleSystem to be included in the 2050 System (the long-termcost savings will be $325,250). For other water systems,the cost of inclusion may be greater than if they were to
remain separate.
CENTRAL CAMANOWATER SYSTEM - 2050
(Updated May 10, 2016)
SUMMIT:HGL 560
8 IN. WATERMAIN: 3,500 LF
SUNSET:HGL 520
THUNDER RIDGE:HGL 440
CAMANO WATER:HGL 375
MECCA (SCHOOL):HGL 290
MECCA:HGL 240
SEASCAPE:HGL 250
ELGERWOOD:HGL 370
CAMANO COOP:HGL 304
BPS: HGL 560
PRV
BPS W/ PRV: HGL 480
BPS W/ PRV: HGL 480
8 IN. WATERMAIN: 5,800 LF
PRV
PRV
TWO PRVS
12 IN. WATERMAIN: 2,700 LF
12 IN. WATERMAIN: 3,600 LF
12 IN. WATERMAIN: 2,600 LF
UPSIZECWA TANKS A
B
C
B
D
D
E
F
G
Improvement ID2050 System Improvement
Description2050 System
Improvement CostMisc Notes
AAdditional Storage at Monticello Site(266 ERUs X 400 Gal/ERU=) 106,400
Gal. ; Assume $1.25/gal$133,000
Storage for 266 additional ERUS: Cost based on current required capacity of areasystems (Camano Co op: 373 Gal/ERU; CWA 382 Gal/ERU)
B6,200 LF of 12" Water Main on Elger
Bay and Mt. View:1,230,000 From CWA June 4, 2015 Improvement Plan
C 8" Pipe Intertie, CWA/Coop; 5,800 LF 667,000 Use $115/LF
DTwo BPS/PRV Stations (HGL 480);
CWA/Coop Intertie; 440 SF each @$670 / SF
589,600 BPS to HGL 480; PRV to respective CWA/Coop storage tank WSL.
EBPS to North (HGL 560); 440 SF @
$670/SF294,800
Incl. fire pump capable of 500 gpm @ 200 ft. Possible pump:Aurora No. 3x4x9b (50 hp)
EGenset for BPS to North for 50 hp 3 ph
pump (125 Kw); Use $800/kw100,000 Ref CE Notes and City of Paducah Bid Tab (6/10/14)
F2,700 LF of 12" Water Main to North @
$205/LF553,500 Use $205/LF based on Elger Bay estimate
G8" Pipe; North Transmission;
3,500 LF402,500 Use $115/LF
Total 2050 SystemWide Improvements $3,970,400
SYSTEM WIDE IMPROVEMENTSCENTRAL CAMANOWATER SYSTEM
TABLE I
Column A Column B Column C Column D Column E Column F
System No. Water SystemInternal Improvement
Description
InternalImprovement
CostInfrastructure Eliminated
Total Value ofInfrastructureEliminated
1 Camano Water None NA None NA2 Camano Cooperative None NA None NA
3 Summit600 LF of 6" pipe to connect
to mains63,000
Well; Well Pump; Pumphouse; StorageTank
163,950
4 Sunset1,800 LF of 6" pipe to
connect to mains189,000
Well; Well Pump; Pumphouse; Treatment;Storage Tank
283,410
5 Thunder Ridge200 LF of 8" pipe to connect
to mains23,000
Well; Well Pump; Pumphouse; Fence; TwoStorage Tanks; Standby Generator
582,245
6 Mecca One 6" PRV; One 4" PRV 64,000Well; Well Pump; Pumphouse; Fence;
7 SeascapeTwo 4" PRVs; 700 LF of 6"pipe to connect to mains
131,500Well; Well Pump; Pumphouse; Fence;
Storage Tank389,375
8 Elgerwood Two Interties 10,000Well; Well Pump; Pumphouse; StorageTank; Treatment; Standby Generator;
1,200 LF of 6" Pipe534,380
INTERNAL SYSTEM COSTS/SAVINGS ASSOCIATED WITH INCLUSION IN THE CENTRAL CAMANOWATER SYSTEMTABLE II
Discussion
System-Specific
Add'l
System -SpecificDeduct
Share of 2050
System
System-Specific
Add'l
System -SpecificDeduct
Share of 2050
System
System-Specific
Add'l
System -SpecificDeduct
Share of 2050
System
System-Specific
Add'l
System -SpecificDeduct
Share of 2050
System
System-Specific
Add'l
System -SpecificDeduct
Share of 2050
System
System-Specific
Add'l
System -SpecificDeduct
Share of 2050
System
System-Specific
Add'l
System -SpecificDeduct
Share of 2050
System
System-Specific
Add'l
System -SpecificDeduct
Share of 2050
System
Cost Shared by Systems 3 through 8 Total
1 - Cam
ano Water
(1055 ERU
s)
2 - Cam
ano Cooperative
(538 ERU
s)
3 - Summ
it (18 ER
Us)
4 - Sunset (15 ER
Us)
5 - Thunder Ridge
(134 ERU
s)
6 - Mecca
(29 ERU
s)
CENTRAL CAMANO WATER SYSTEM - 2050
SUMMARY OF COSTS AND BENEFITS
7 - Seascape (24 ER
Us)
8 - Elgerwood
(46 ERU
s)
TABLE III
System
2050 System Improvement
A - Increase Storage 9,000 7,500 67,000 14,500 12,000 23,000Cost Shared by Systems 3 through 8. TotalProject Cost: $133,000. Cost Per ERU: (133,000/266=) $500
B - 12" Main to Southeast 1,035,790 56,890 47,081 90,239
Assume one half of System 1 ERUs Benefit from this improvement. Other Systems Benefitting are 6, 7 and 8. Total ERUS Benefitting: (528+29+24+46=) 627. Cost Per ERU: (1,230,000/627=) $1,962
C - 8" Main on Monticello 378,528 193,032 6,458 5,382 48,079 10,405 8,611 16,505Source and Storage Reliability Improvement. This Work Shared by all Eight Systems. Cost Per ERU: (667,000/1,859=) $359
D - Two BPS for Monticello Main 334,604 170,632 5,709 4,757 42,499 9,198 7,612 14,589Source and Storage Reliability Improvement. This Work Shared by all Eight Systems. Cost Per ERU: (589,600/1,859=) $317
E - BPS and Genset for North 42,553 35,461 316,786Costs Shared by Systems 3,4 and 5. Total Project Cost: $394,800. Cost Per ERU: (394,800/167=) $2,364
F - 12" Main to North 59,659 49,715 444,126Costs Shared by Systems 3,4 and 5. Total Project Cost: $553,500. Cost Per ERU: (553,500/167=) $3,314
G - 8" Main @ North 43,383 36,153 322,964Costs Shared by Systems 3,4 and 5. Total Project Cost: $402,500. Cost Per ERU: (402,500/167=) $2,410
231 SE Barrington Dr, Suite 205P.O. Box 459Oak Harbor, WA 98277
Tel: 360-279-0615Fax: 360-679-5046
Gregory R. Cane, P.E.
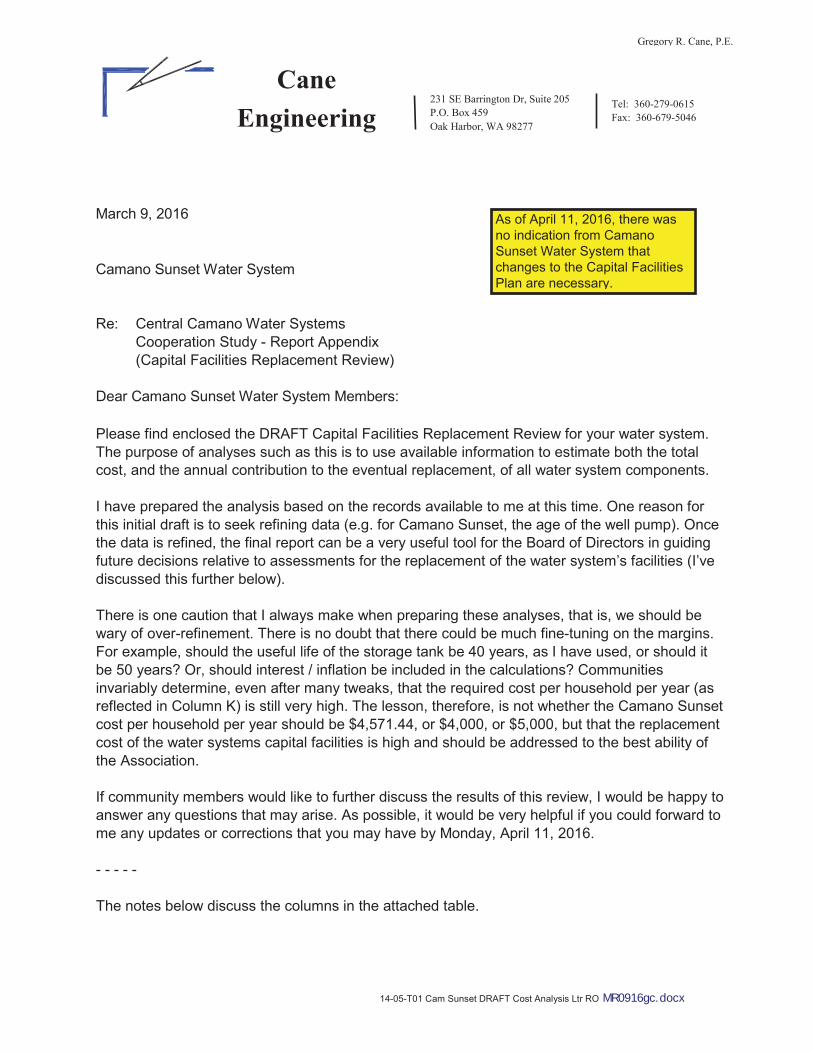
March 9, 2016
Camano Cooperative Water and Power Co.
Re: Central Camano Water SystemsCooperation Study - Report Appendix(Capital Facilities Replacement Review)
Dear Camano Cooperative Members:
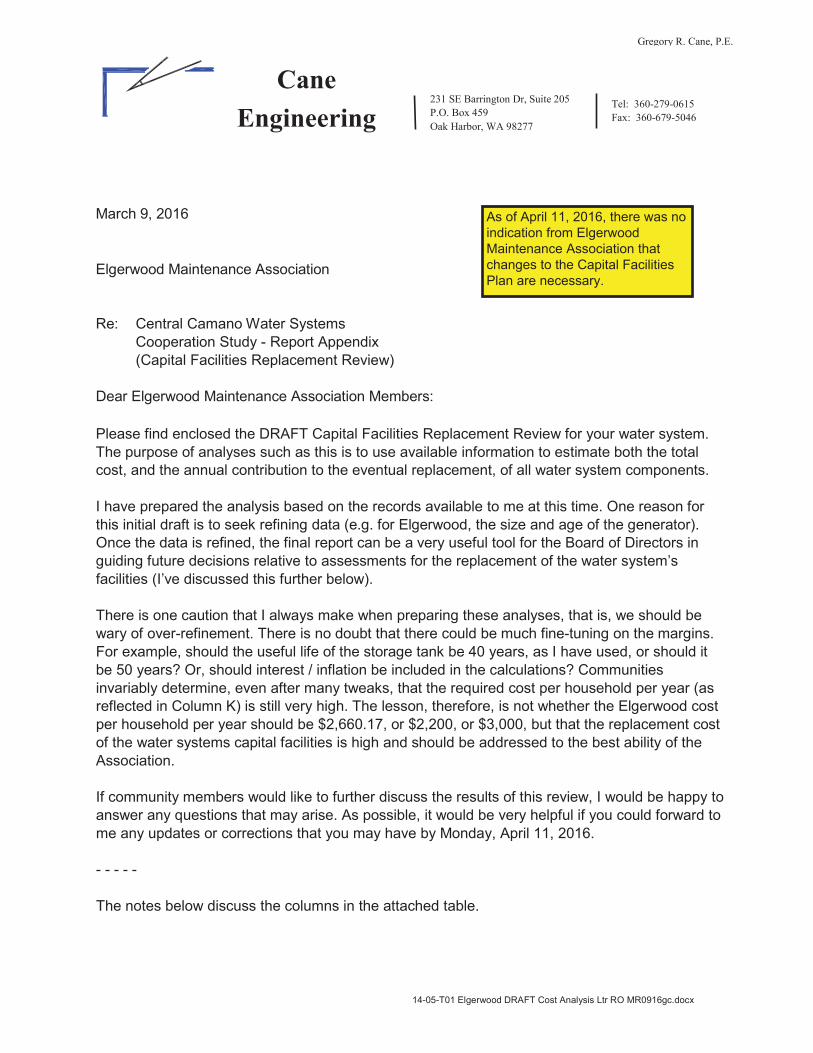
Please find enclosed the DRAFT Capital Facilities Replacement Review for your water system.The purpose of analyses such as this is to use available information to estimate both the total cost, and the annual contribution to the eventual replacement, of all water system components.
I have prepared the analysis based on the records available to me at this time. One reason for this initial draft is to seek refining data (e.g. for Camano Cooperative, the age of the Indian Beach pressure reducing valve). Once the data is refined, the final report can be a very useful tool for the Board of Directors in guiding future decisions relative to assessments for the replacement of the water system’s facilities (I’ve discussed this further below).
There is one caution that I always make when preparing these analyses, that is, we should be wary of over-refinement. There is no doubt that there could be much fine-tuning on the margins. For example, should the useful life of the storage tank be 40 years, as I have used, or should it be 50 years? Or, should interest / inflation be included in the calculations? Communities invariably determine, even after many tweaks, that the required cost per household per year (as reflected in Column K) is still very high. The lesson, therefore, is not whether the Co-op’s cost per household per year should be $1,065.27, or $900, or $1,200, but that the replacement cost of the water systems capital facilities is high and should be addressed to the best ability of the Association.
If community members would like to further discuss the results of this review, I would be happy toanswer any questions that may arise. As possible, it would be very helpful if you could forward to me any updates or corrections that you may have by Monday, April 11, 2016.
- - - - -
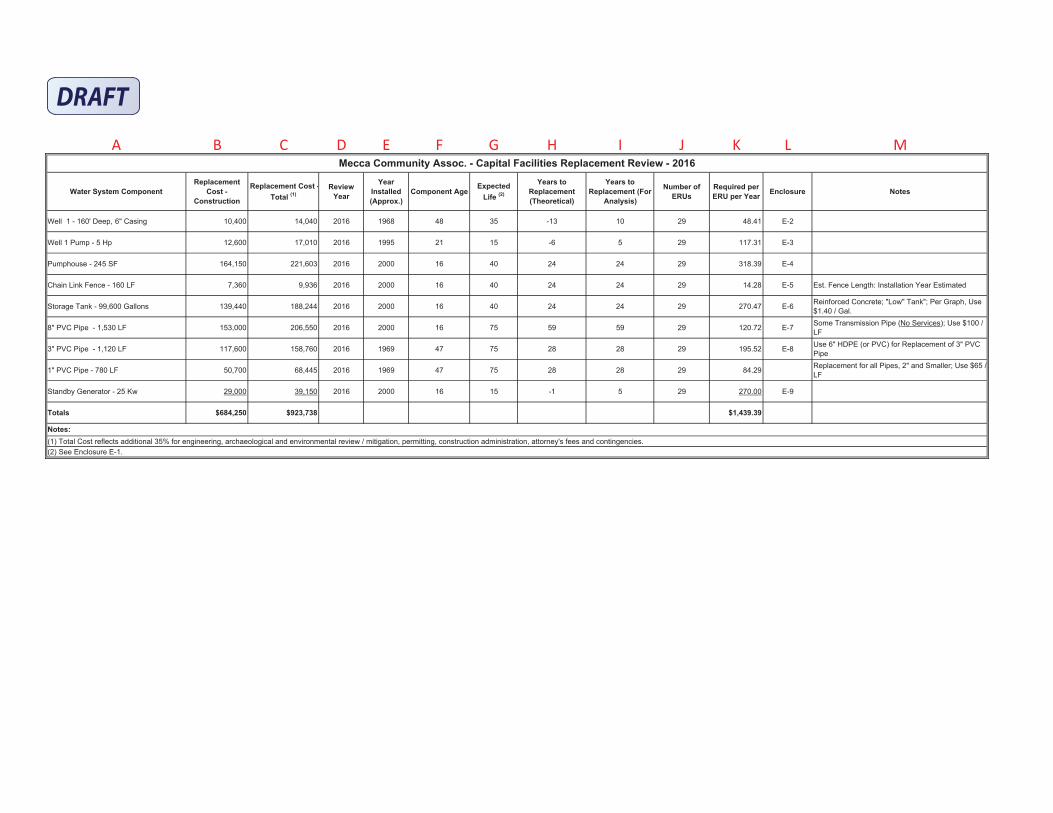
The notes below discuss the columns in the attached table.
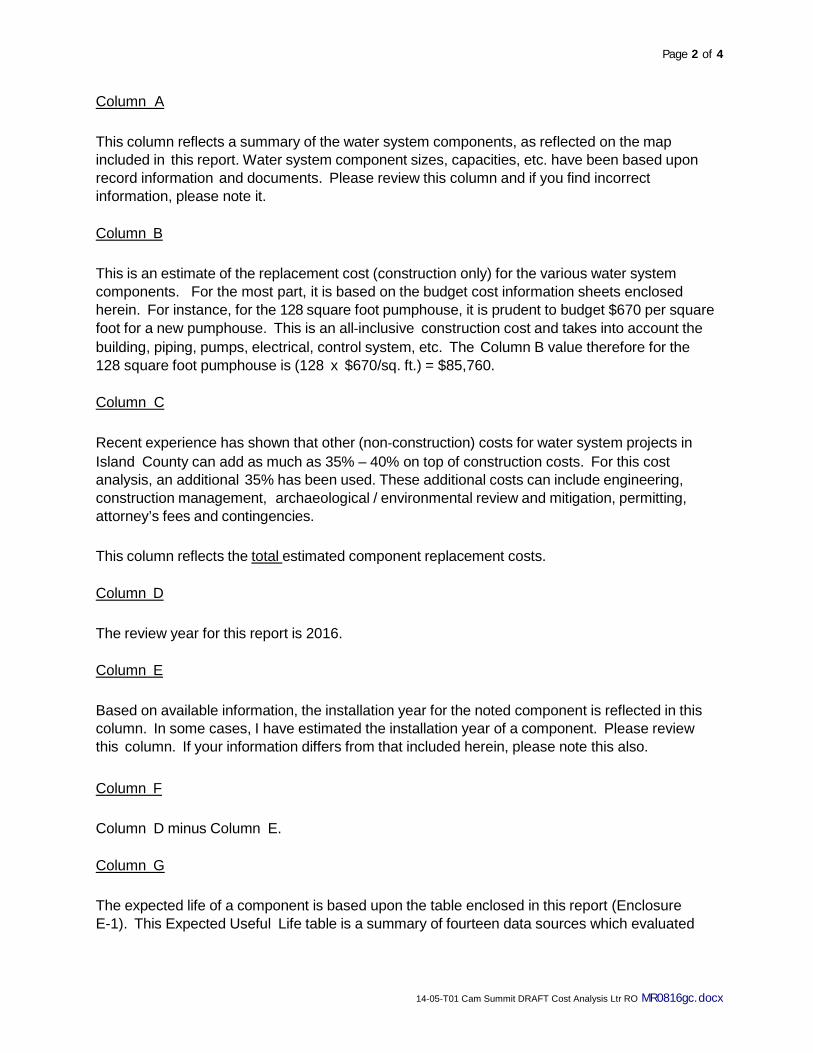
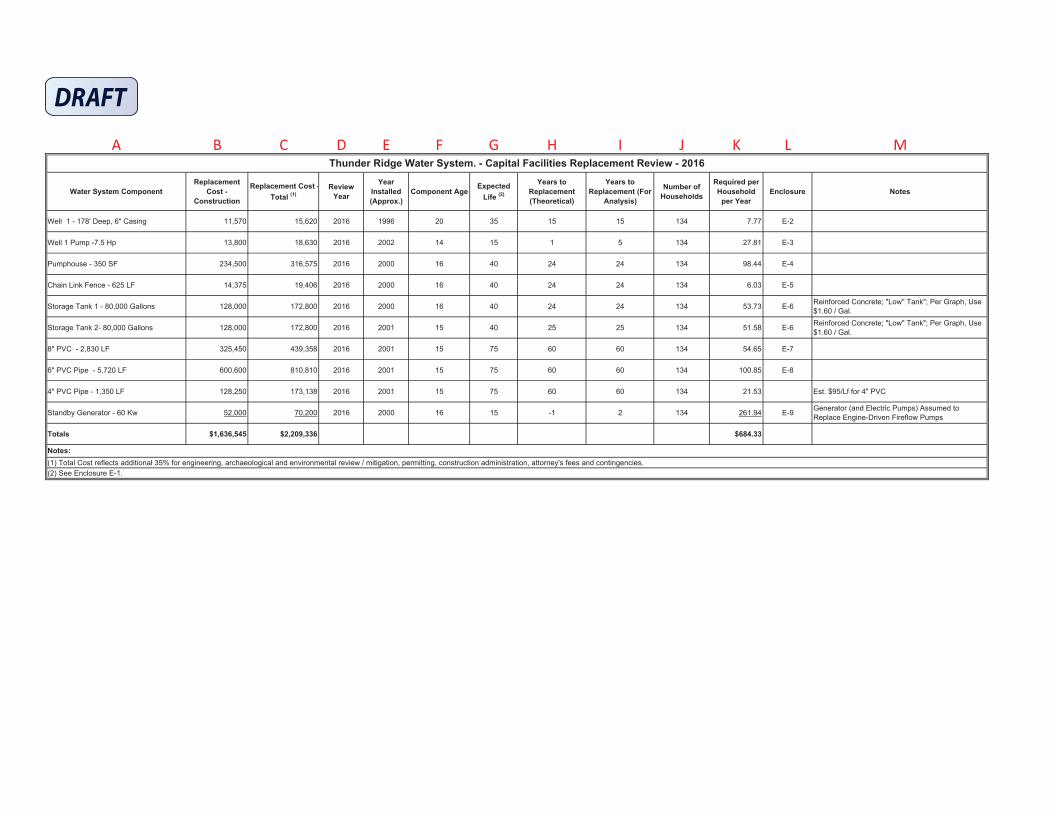
As of April 11, 2016, there was noindication from Camano Cooperative Water and Power Co. that changes to the Capital Facilities Plan are necessary.
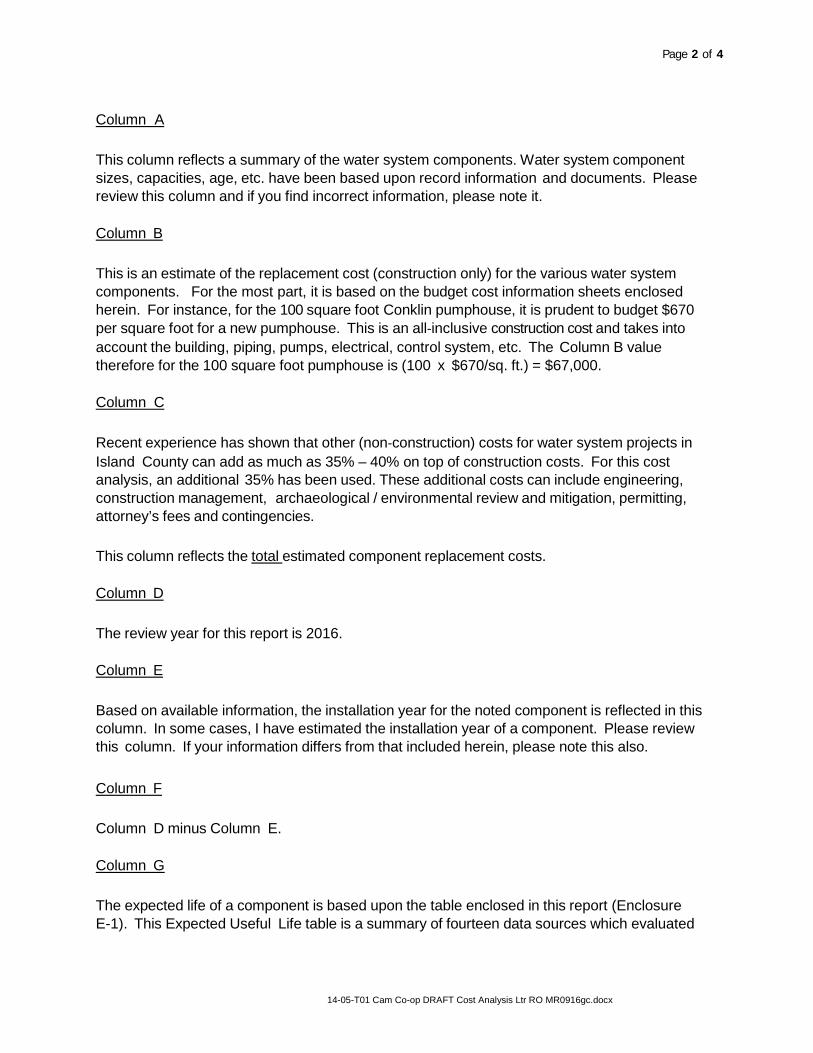
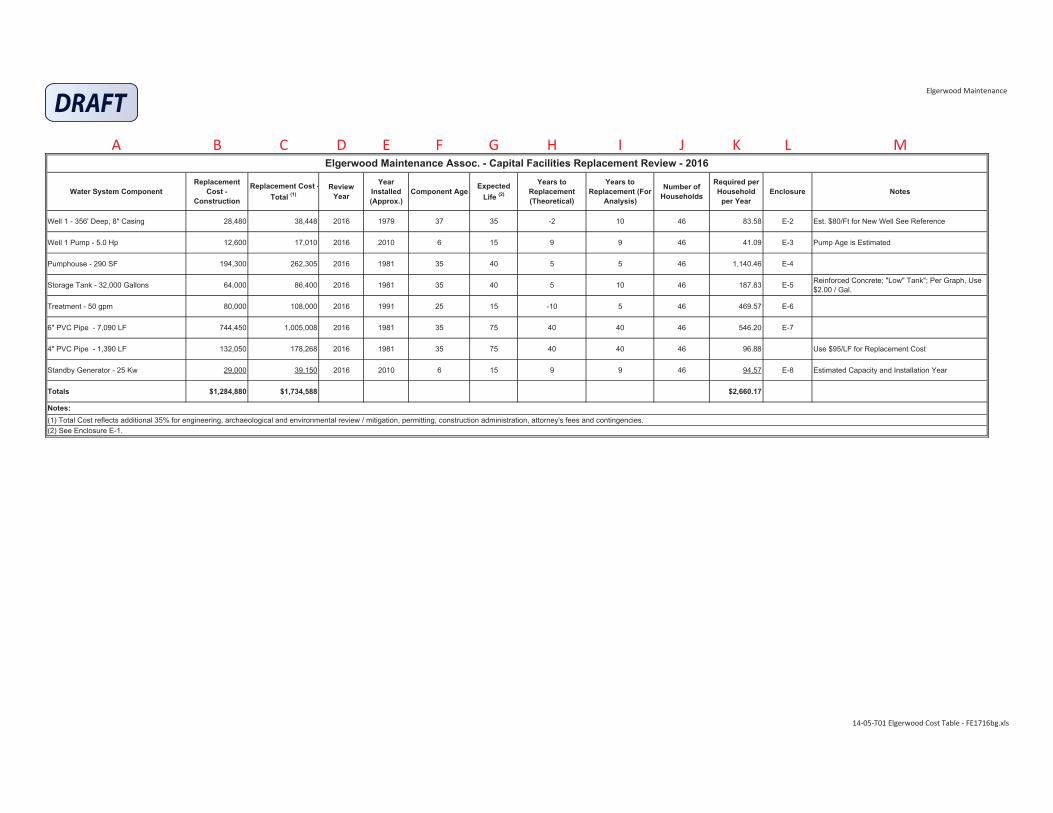
This column reflects a summary of the water system components. Water system component sizes, capacities, age, etc. have been based upon record information and documents. Please review this column and if you find incorrect information, please note it.
Column B
This is an estimate of the replacement cost (construction only) for the various water system components. For the most part, it is based on the budget cost information sheets enclosed herein. For instance, for the 100 square foot Conklin pumphouse, it is prudent to budget $670 per square foot for a new pumphouse. This is an all‐inclusive construction cost and takes into account the building, piping, pumps, electrical, control system, etc. The Column B value therefore for the 100 square foot pumphouse is (100 x $670/sq. ft.) = $67,000.
Column C
Recent experience has shown that other (non‐construction) costs for water system projects in Island County can add as much as 35% – 40% on top of construction costs. For this cost analysis, an additional 35% has been used. These additional costs can include engineering, construction management, archaeological / environmental review and mitigation, permitting, attorney’s fees and contingencies. This column reflects the total estimated component replacement costs.
Column D
The review year for this report is 2016.
Column E
Based on available information, the installation year for the noted component is reflected in this column. In some cases, I have estimated the installation year of a component. Please review this column. If your information differs from that included herein, please note this also. Column F
Column D minus Column E.
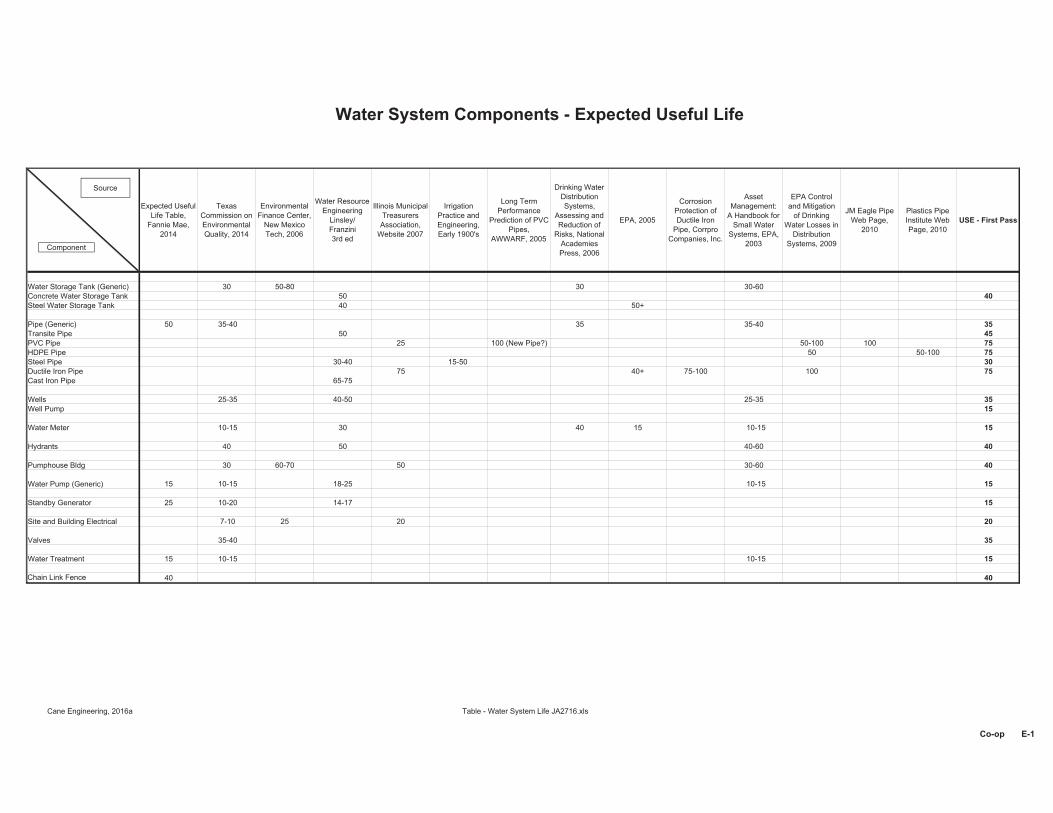
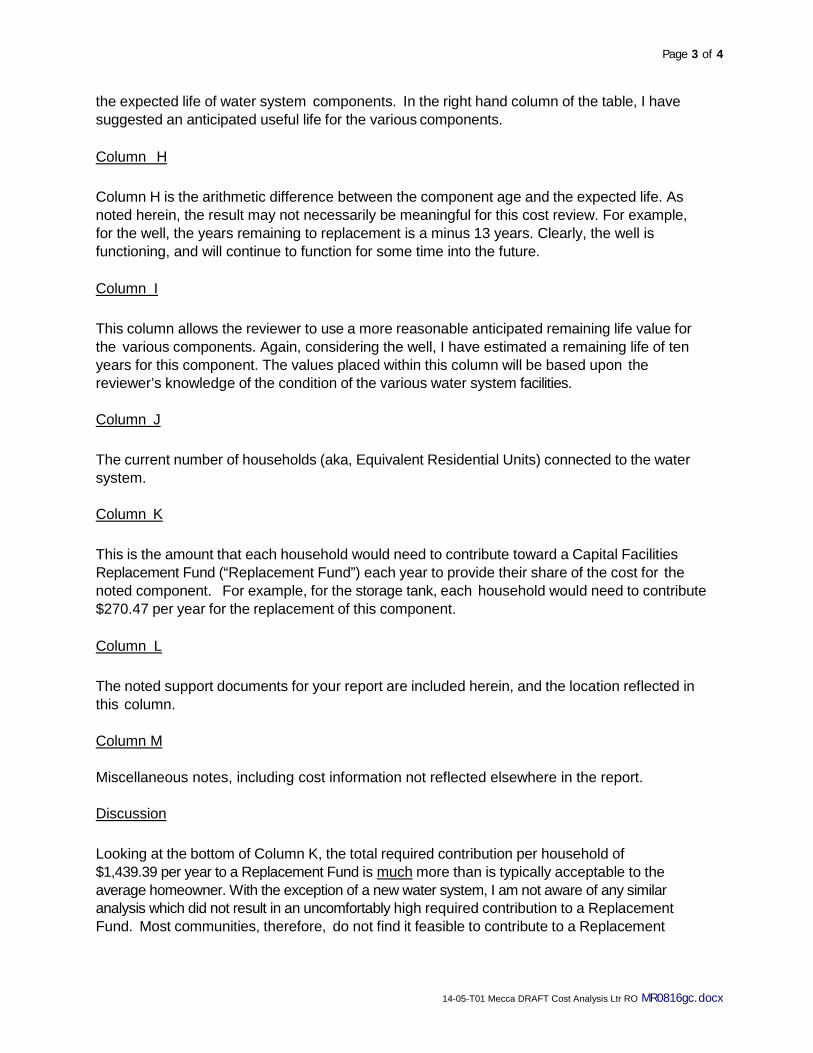
Column G
The expected life of a component is based upon the table enclosed in this report (Enclosure E-1). This Expected Useful Life table is a summary of fourteen data sources which evaluated
the expected life of water system components. In the right hand column of the table, I have suggested an anticipated useful life for the various components. Column H
Column H is the arithmetic difference between the component age and the expected life. As noted herein, the result may not necessarily be meaningful for this cost review. For example, for the Monticello Storage Tank, the years remaining to replacement is zero. Clearly, the tank is functioning, and will continue to function for some time into the future.
Column I
This column allows the reviewer to use a more reasonable anticipated remaining life value for the various components. Again, considering the Monticello storage tank, I have estimated a remaining life of ten years for this component. The values placed within this column will be based upon the reviewer’s knowledge of the condition of the various water system facilities.
Column J
The current number of households (aka, Equivalent Residential Units) connected to the water system.
Column K
This is the amount that each household would need to contribute toward a Capital Facilities Replacement Fund (“Replacement Fund”) each year to provide their share of the cost for the noted component. For example, for the Monticello storage tank, each household would need to contribute $22.19 per year for the replacement of this component.
Column L
The noted support documents for your report are included herein, and the location reflected in this column.
Column M Miscellaneous notes, including cost information not reflected elsewhere in the report.
Discussion
Looking at the bottom of Column K, the total required contribution per household of $1,065.27 per year to a Replacement Fund is much more than is typically acceptable to the average homeowner. With the exception of a new water system, I am not aware of any similar analysis which did not result in an uncomfortably high required contribution to a Replacement Fund. Most communities, therefore, do not find it feasible to contribute to a Replacement
Having said that, however, one should not cast aside the results of this analysis as it does a reasonably good job of providing a long‐term replacement cost of a community’s water system. Most communities of which I am aware, have utilized the results of these analyses to increase (or to initiate) contributions to a Replacement Fund. If a given component were to fail and require replacement before there is sufficient money in the Fund, a water system may elect to finance these capital replacements through one of a number of loan programs available.
Sincerely,
Cane Engineering
Gregory R. Cane, P.E.
Encl
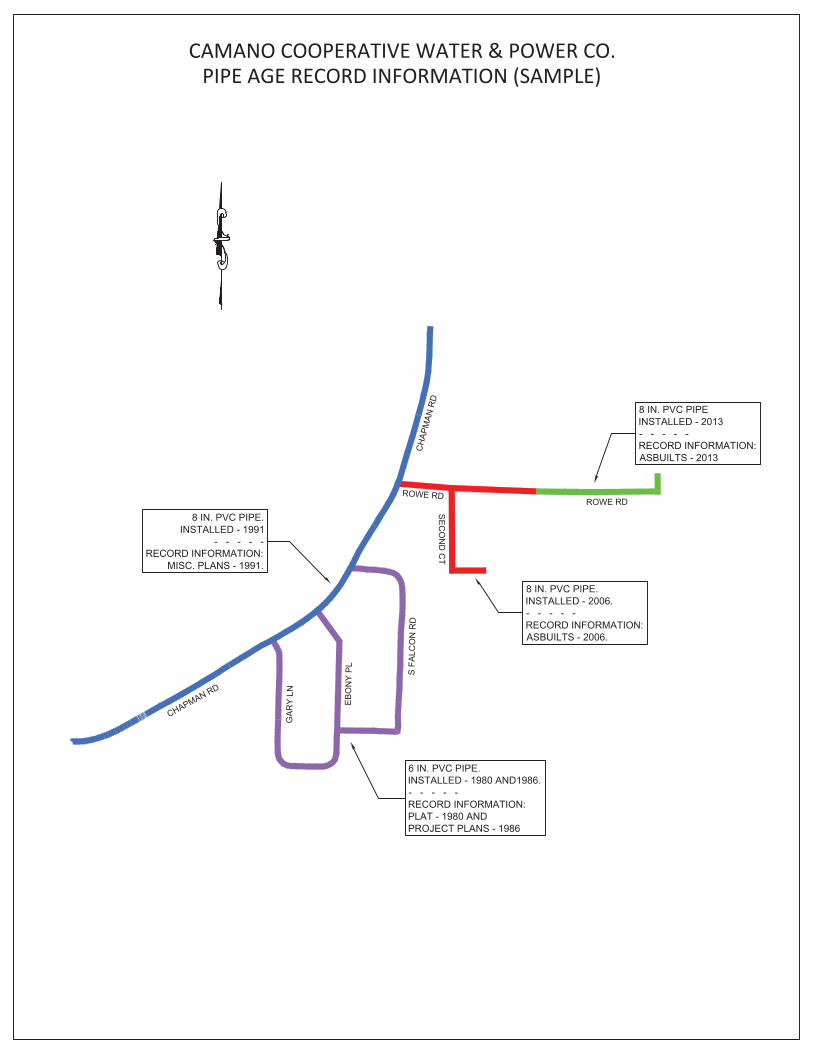
CAMANO COOPERATIVE WATER & POWER CO.PIPE AGE RECORD INFORMATION (SAMPLE)
Camano Cooperative Water & Power Co. - Capital Facilities Replacement Review - 2016
(1) Total Cost reflects additional 35% for engineering, archaeological and environmental review / mitigation, permitting, construction administration, attorney's fees and contingencies.(2) See Enclosure E-1.
Expected Useful Life Table,
Fannie Mae, 2014
TexasCommission on EnvironmentalQuality, 2014
EnvironmentalFinance Center,
New Mexico Tech, 2006
Water Resource Engineering
Linsley/Franzini3rd ed
Illinois Municipal TreasurersAssociation,
Website 2007
IrrigationPractice and Engineering,Early 1900's
Long Term Performance
Prediction of PVC Pipes,
AWWARF, 2005
Drinking Water DistributionSystems,
Assessing and Reduction of
Risks, National AcademiesPress, 2006
EPA, 2005
CorrosionProtection of Ductile Iron
Pipe, Corrpro Companies, Inc.
AssetManagement:
A Handbook for Small Water
Systems, EPA, 2003
EPA Control and Mitigation
of Drinking Water Losses in
DistributionSystems, 2009
JM Eagle Pipe Web Page,
2010
Plastics Pipe Institute Web Page, 2010
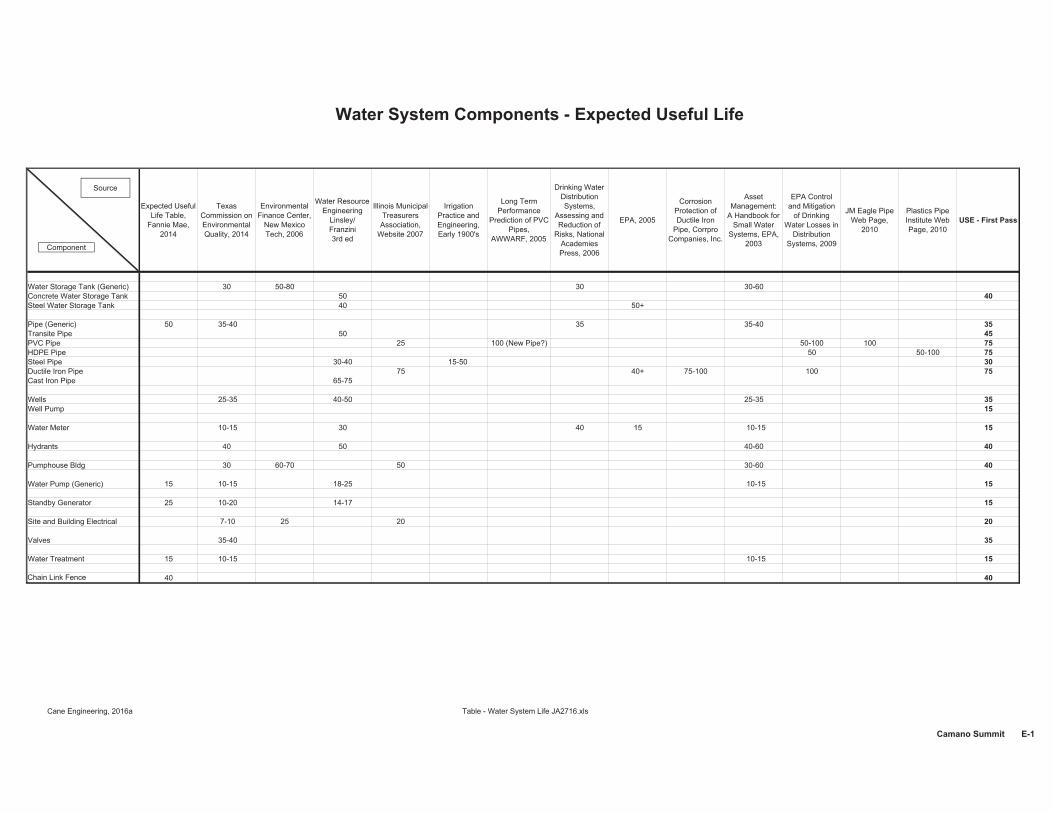
USE - First Pass
Water Storage Tank (Generic) 30 50-80 30 30-60Concrete Water Storage Tank 50Steel Water Storage Tank 40 50+
Cane Engineering, 201 a Table - Water System Life .xls
Co-op E-1
Water System Components - Expected Useful Life
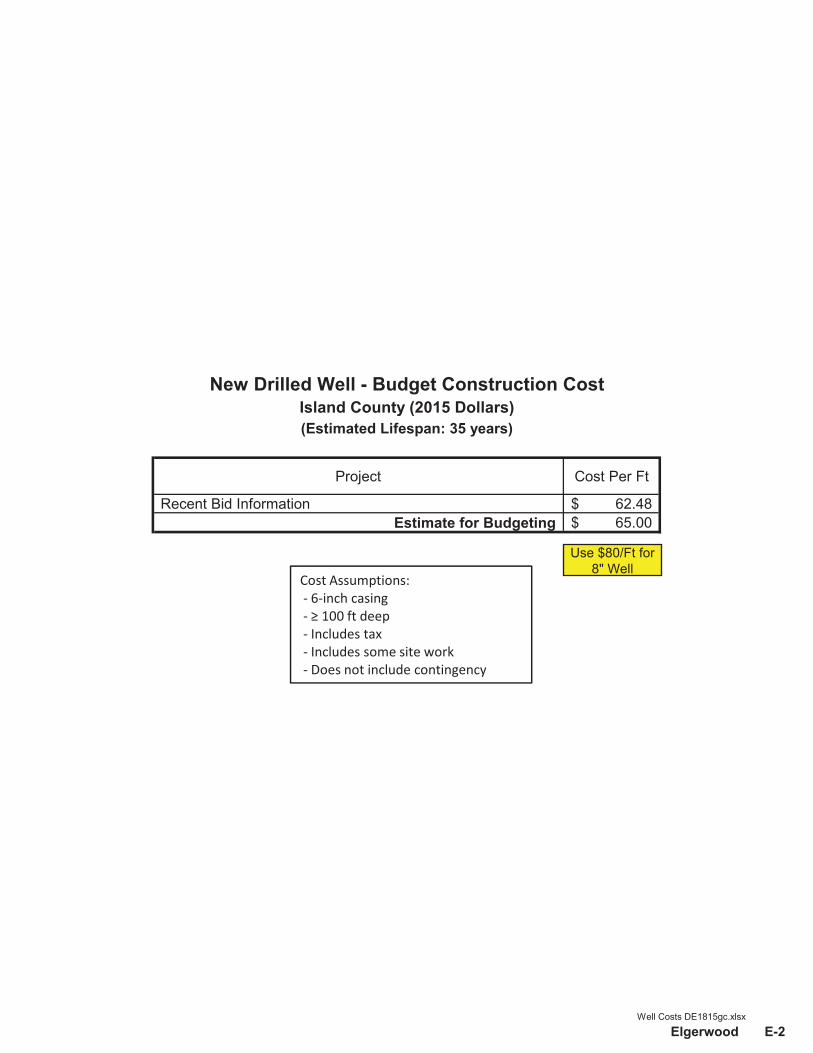
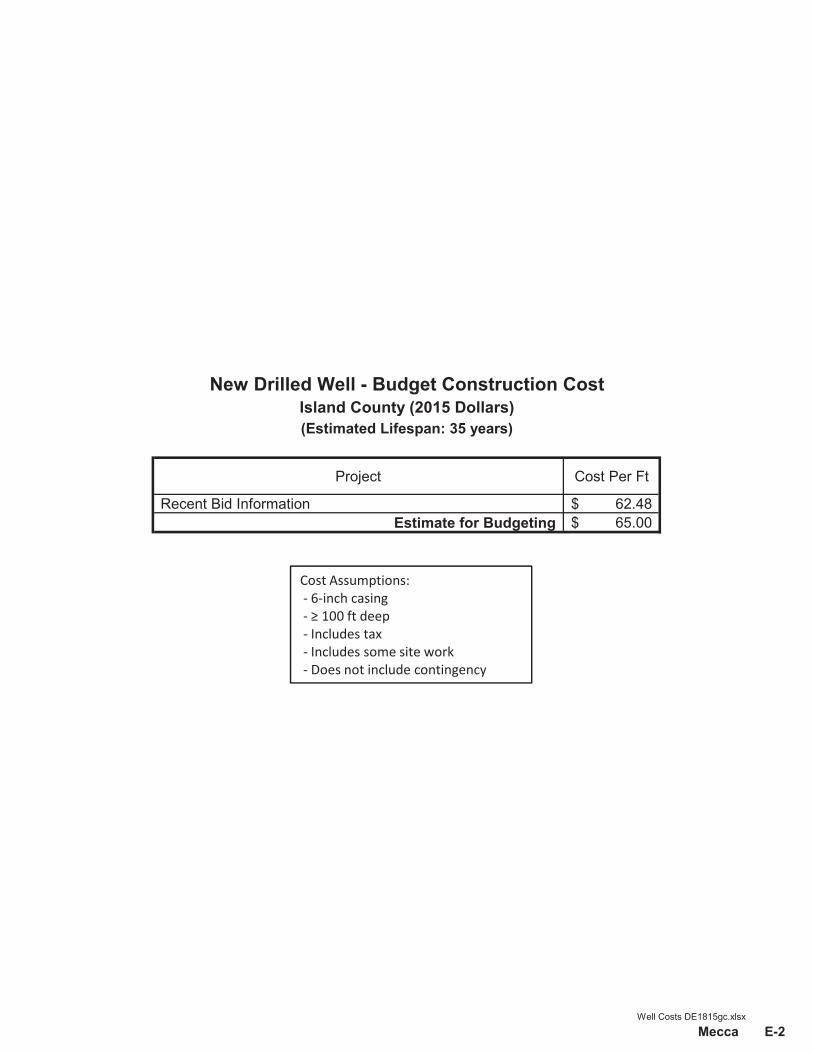
Project Cost Per Ft
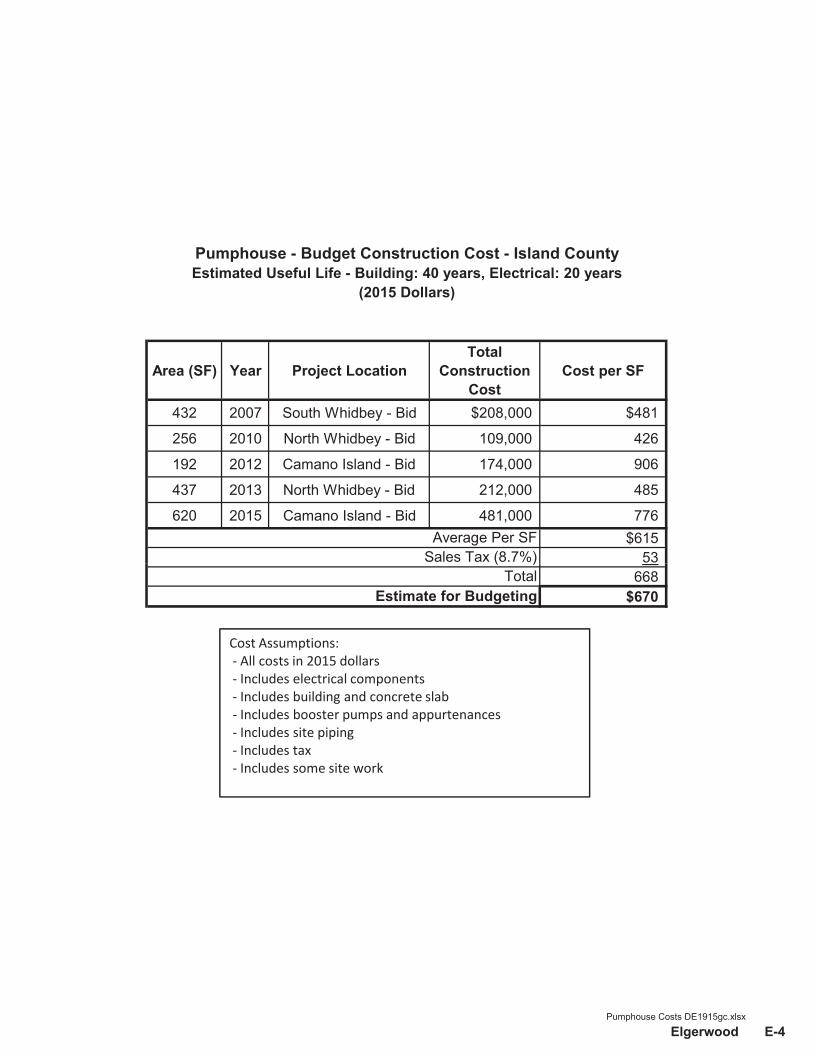
Recent Bid Information 62.48$ Estimate for Budgeting 65.00$
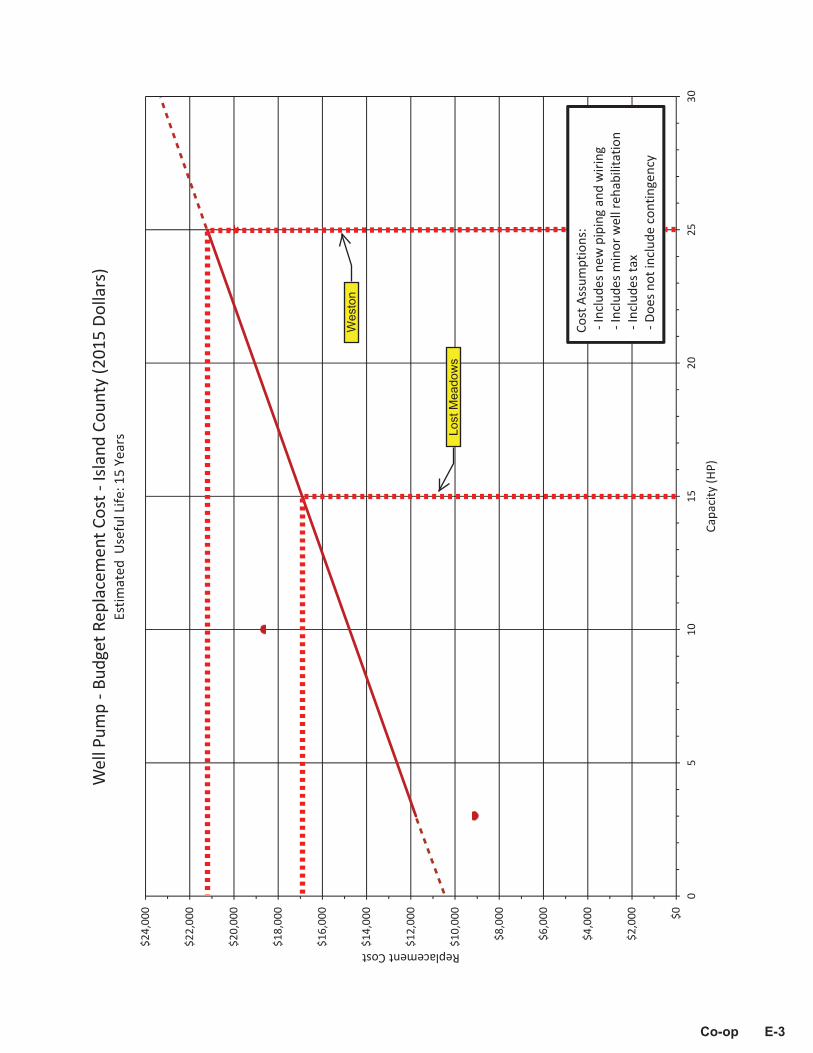
New Drilled Well - Budget Construction Cost
(Estimated Lifespan: 35 years)Island County (2015 Dollars)
Cost Assumptions:6 inch casing
100 ft deepIncludes taxIncludes some site workDoes not include contingency
Well Costs DE1815gc.xlsx
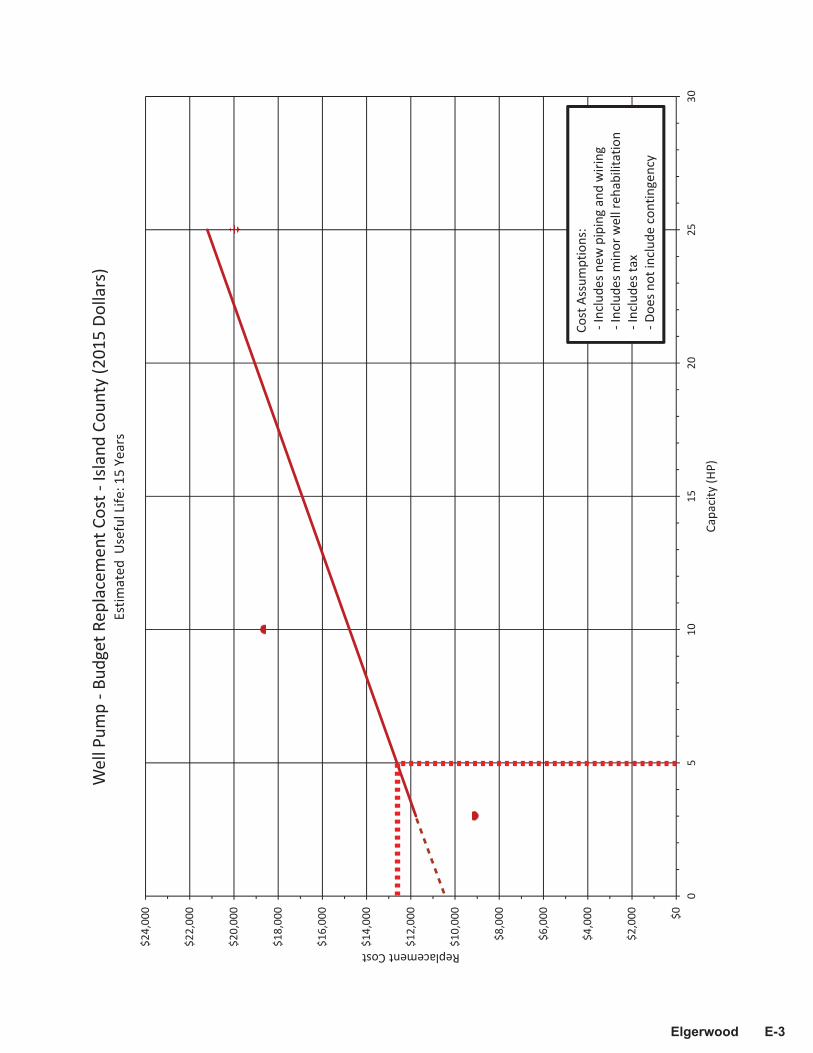
Co-op E-2
Use $80/Ft for 8" Well
$10
000
$12,
000
$14,
000
$16,
000
$18,
000
$20,
000
$22,
000
$24,
000
eplacementCostW
ellP
ump
Budg
etRe
plac
emen
tCos
tIs
land
Coun
ty(2
015
Dolla
rs)
Estim
ated
Use
fulL
ife:1
5Ye
ars
$0
$2,0
00
$4,0
00
$6,0
00
$8,0
00
$10,
000
05
1015
2025
30
R
Capa
city
(HP)
Cost
Assu
mpt
ions
:In
clud
esne
wpi
ping
and
wiri
ngIn
clud
esm
inor
wel
lreh
abili
tatio
nIn
clud
esta
xDo
esno
tinc
lude
cont
inge
ncy
Co-op E-3
Wes
ton
Lost
Mea
dow
s
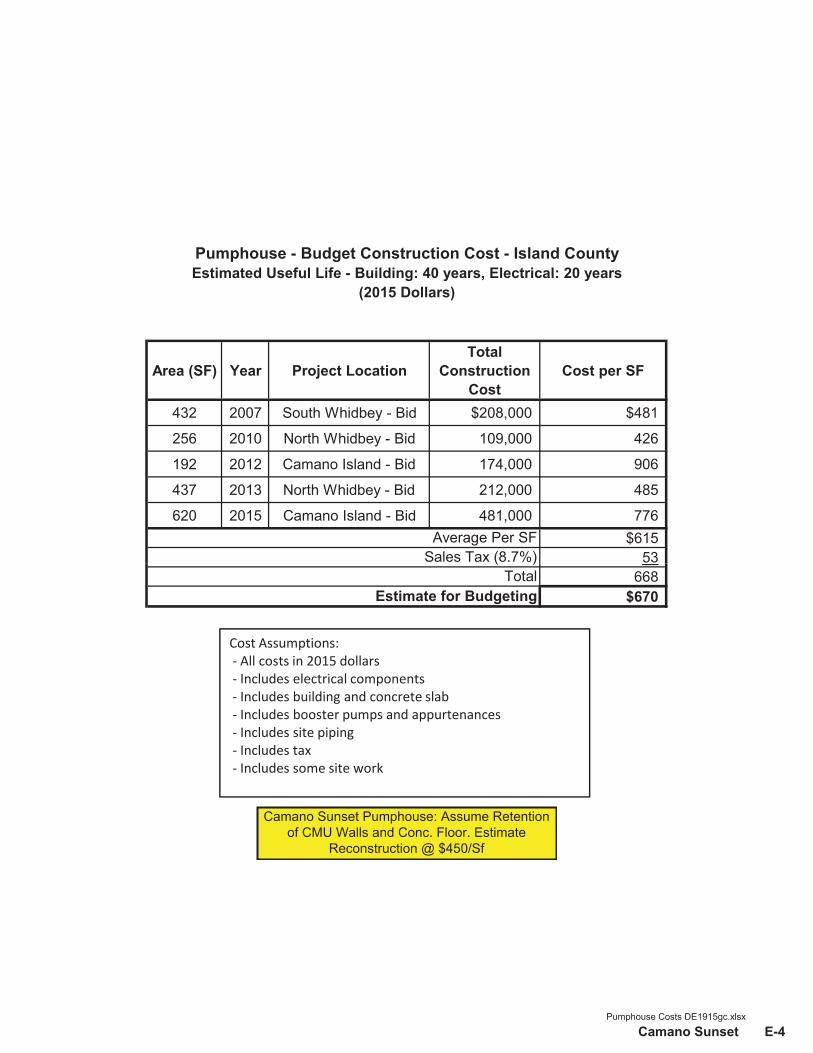
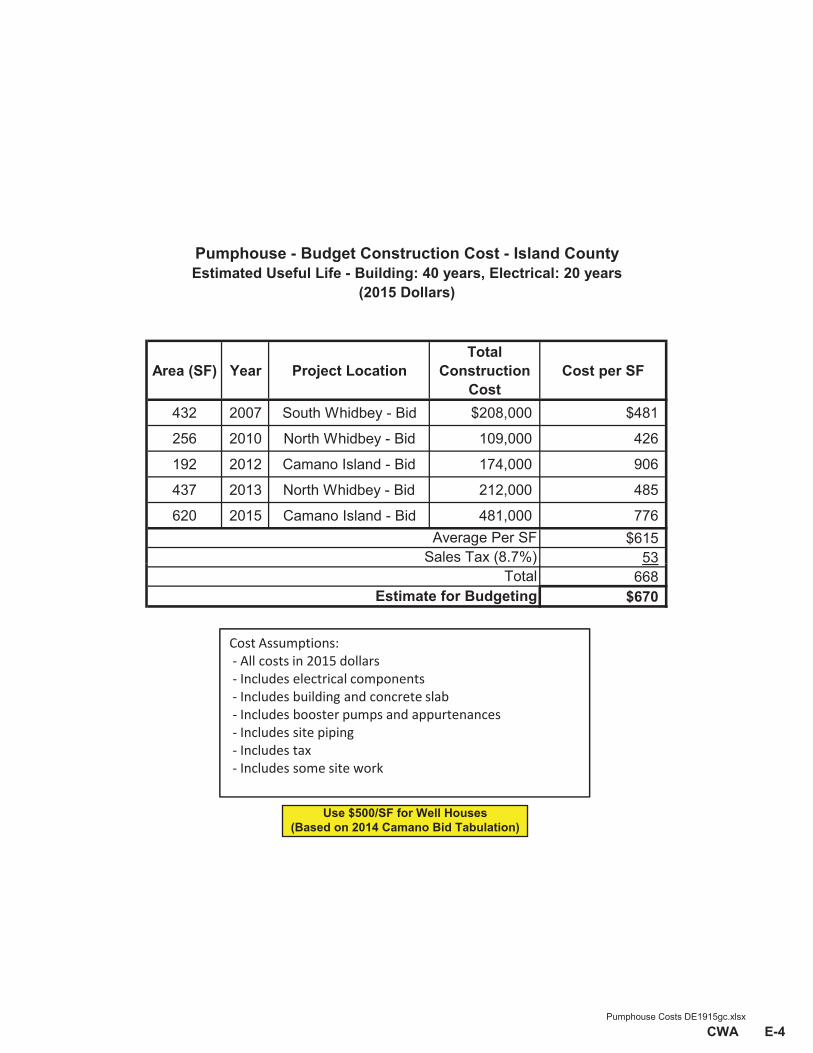
Area (SF) Year Project LocationTotal
Construction Cost
Cost per SF
432 2007 South Whidbey - Bid $208,000 $481
256 2010 North Whidbey - Bid 109,000 426
192 2012 Camano Island - Bid 174,000 906
437 2013 North Whidbey - Bid 212,000 485
620 2015 Camano Island - Bid 481,000 776$615
53
Pumphouse - Budget Construction Cost - Island CountyEstimated Useful Life - Building: 40 years, Electrical: 20 years
(2015 Dollars)
Average Per SFSales Tax (8.7%)
668$670
( )Total
Estimate for Budgeting
Cost Assumptions:All costs in 2015 dollarsIncludes electrical componentsIncludes building and concrete slabIncludes booster pumps and appurtenancesIncludes site pipingIncludes taxIncludes some site work
Pumphouse Costs DE1915gc.xlsx
Co-op E-4
Use $500/SF for Well Houses(Based on 2014 Camano Bid Tabulation)
1,40
01,
500
1,60
01,
700
1,80
01,
900
2,00
02,
100
2,20
02,
300
Pergpm(2015$)
Fe/M
n/As
RemovalTreatm
ent
Budget
CostInform
ationforIslan
dCo
unty
(201
5Do
llars)
(DesignFlow
GreaterT
han100gpm)
USEPA
2015
CostEvalua
tion:
Includ
esEq
uipm
ent,Installatio
n,Pu
mph
ouse,
Engine
eringan
dPe
rmits
.
700
800
900
1,00
01,
100
1,20
01,
300
100
150
200
250
Cost
Design
Flow
Rate
gpm
Use
forIslan
dCo
unty
for
100
150gp
m.Treatmen
tSystem
Equipm
enta
ndInstallatio
nOnly.
Co-op E-5
20'D
x15
'H20
'Dx
19'H
20'D
x25
'H
30'D
x20
'H
20'
x20
'H
14'D
x50
'H
14'D
x55
'H
20'D
x50
'H
$1.5
0
$2.0
0
$2.5
0
$3.0
0
$3.5
0
CostperGallonRe
serv
oir
Budg
etIn
stal
latio
nCo
stIsl
and
Coun
ty(2
015
Dolla
rs)
(Est
imat
edU
sefu
lLife
:Ye
ars)
Low
Tank
High
Tank
30'D
x20
'H30
'Dx
40'H
$0.0
0
$0.5
0
$1.0
0
020
,000
40,0
0060
,000
80,0
0010
0,00
012
0,00
014
0,00
016
0,00
018
0,00
020
0,00
0
Size
(Gal
lons
)
Cost
Assu
mpt
ions
:Re
info
rced
Conc
rete
Tank
Incl
udes
Pipi
ngU
nder
Tank
Incl
udes
Som
eSi
tePr
epar
atio
nIn
clud
esTa
xDo
esN
otIn
clud
eCo
ntin
genc
y(N
ote:
High
Tank
>32'
H)
Co-op E-6
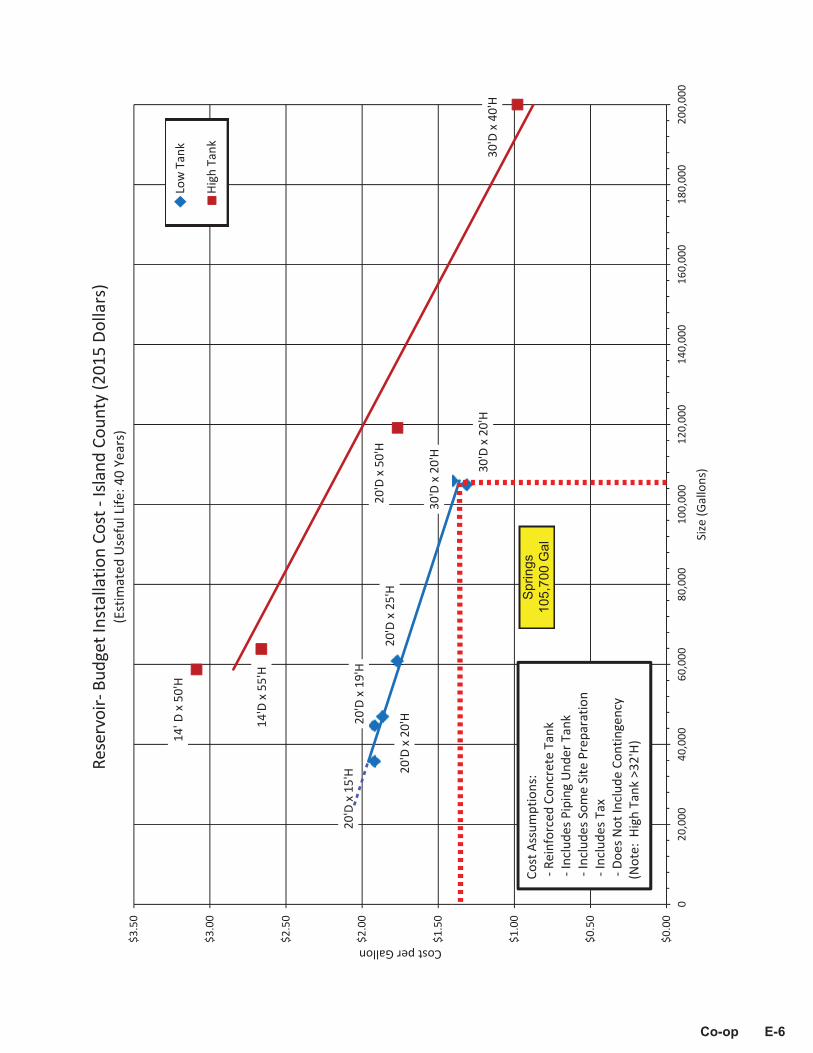
Spr
ings
10
5,70
0 G
al
20'D
x15
'H20
'Dx
19'H
20'D
x25
'H
30'D
x20
'H
20'
x20
'H
14'D
x50
'H
14'D
x55
'H
20'D
x50
'H
$1.5
0
$2.0
0
$2.5
0
$3.0
0
$3.5
0
CostperGallonRe
serv
oir
Budg
etIn
stal
latio
nCo
stIsl
and
Coun
ty(2
015
Dolla
rs)
(Est
imat
edU
sefu
lLife
:Ye
ars)
Low
Tank
High
Tank
30'D
x20
'H30
'Dx
40'H
$0.0
0
$0.5
0
$1.0
0
020
,000
40,0
0060
,000
80,0
0010
0,00
012
0,00
014
0,00
016
0,00
018
0,00
020
0,00
0
Size
(Gal
lons
)
Cost
Assu
mpt
ions
:Re
info
rced
Conc
rete
Tank
Incl
udes
Pipi
ngU
nder
Tank
Incl
udes
Som
eSi
tePr
epar
atio
nIn
clud
esTa
xDo
esN
otIn
clud
eCo
ntin
genc
y(N
ote:
High
Tank
>32'
H)
Co-op E-7
Wes
ton
104,
100
Gal
20'D
x15
'H20
'Dx
19'H
20'D
x25
'H
30'D
x20
'H
20'
x20
'H
14'D
x50
'H
14'D
x55
'H
20'D
x50
'H
$1.5
0
$2.0
0
$2.5
0
$3.0
0
$3.5
0
CostperGallonRe
serv
oir
Budg
etIn
stal
latio
nCo
stIsl
and
Coun
ty(2
015
Dolla
rs)
(Est
imat
edU
sefu
lLife
:Ye
ars)
Low
Tank
High
Tank
30'D
x20
'H30
'Dx
40'H
$0.0
0
$0.5
0
$1.0
0
020
,000
40,0
0060
,000
80,0
0010
0,00
012
0,00
014
0,00
016
0,00
018
0,00
020
0,00
0
Size
(Gal
lons
)
Cost
Assu
mpt
ions
:Re
info
rced
Conc
rete
Tank
Incl
udes
Pipi
ngU
nder
Tank
Incl
udes
Som
eSi
tePr
epar
atio
nIn
clud
esTa
xDo
esN
otIn
clud
eCo
ntin
genc
y(N
ote:
High
Tank
>32'
H)
Co-op E-8
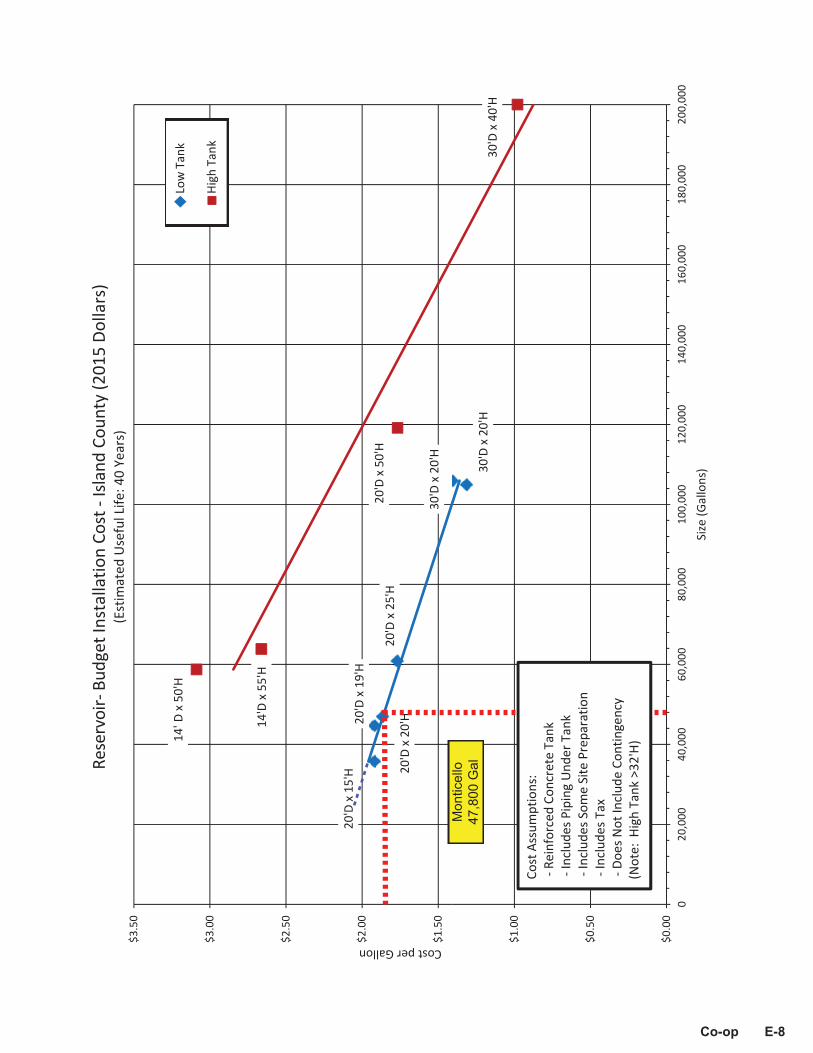
Mon
ticel
lo
47,8
00 G
al
20'D
x15
'H20
'Dx
19'H
20'D
x25
'H
30'D
x20
'H
20'
x20
'H
14'D
x50
'H
14'D
x55
'H
20'D
x50
'H
$1.5
0
$2.0
0
$2.5
0
$3.0
0
$3.5
0
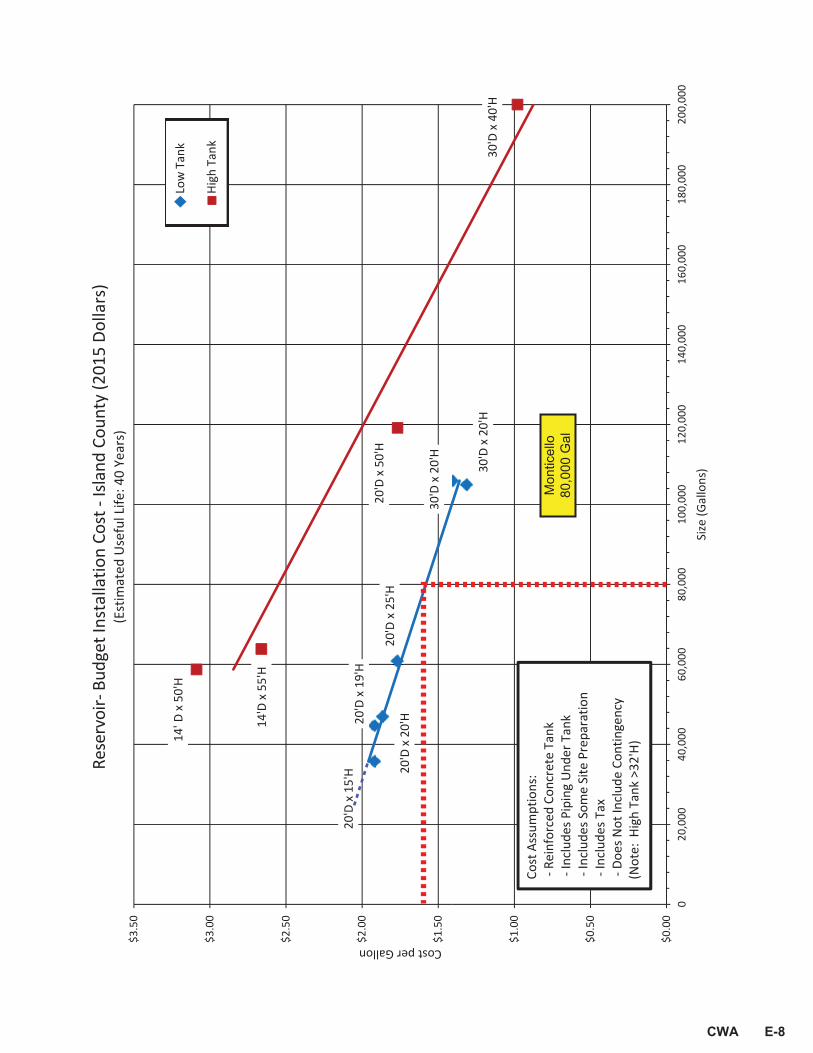
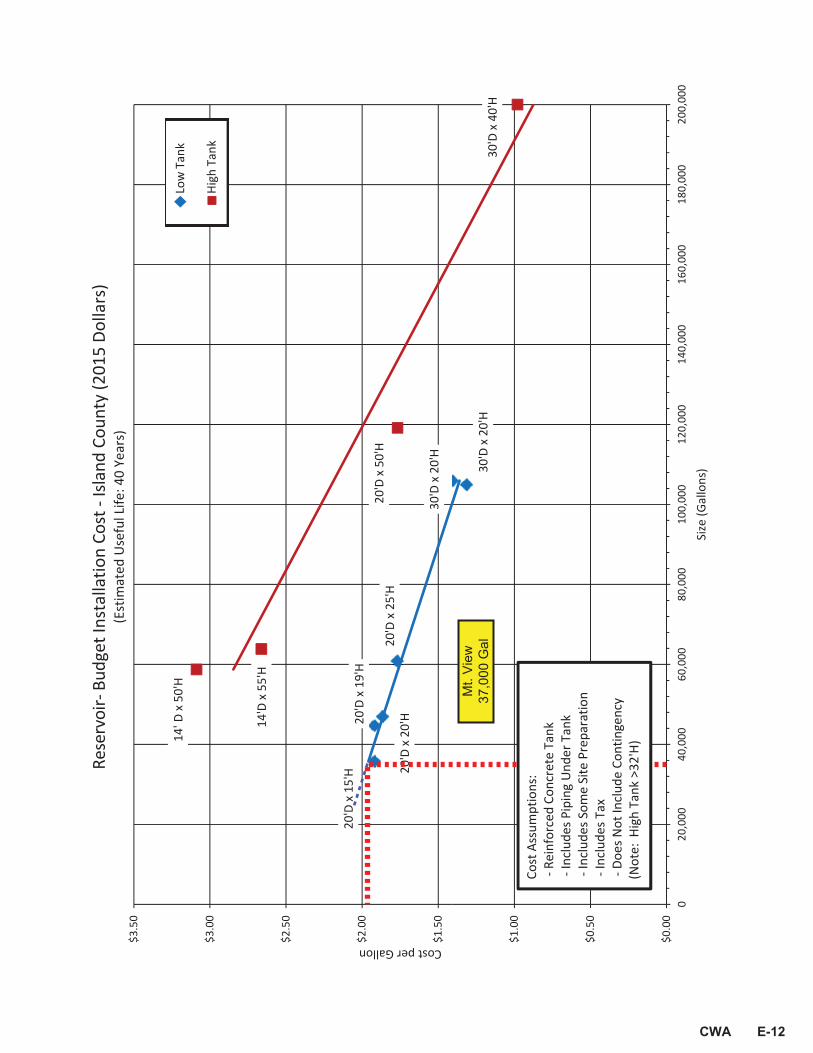
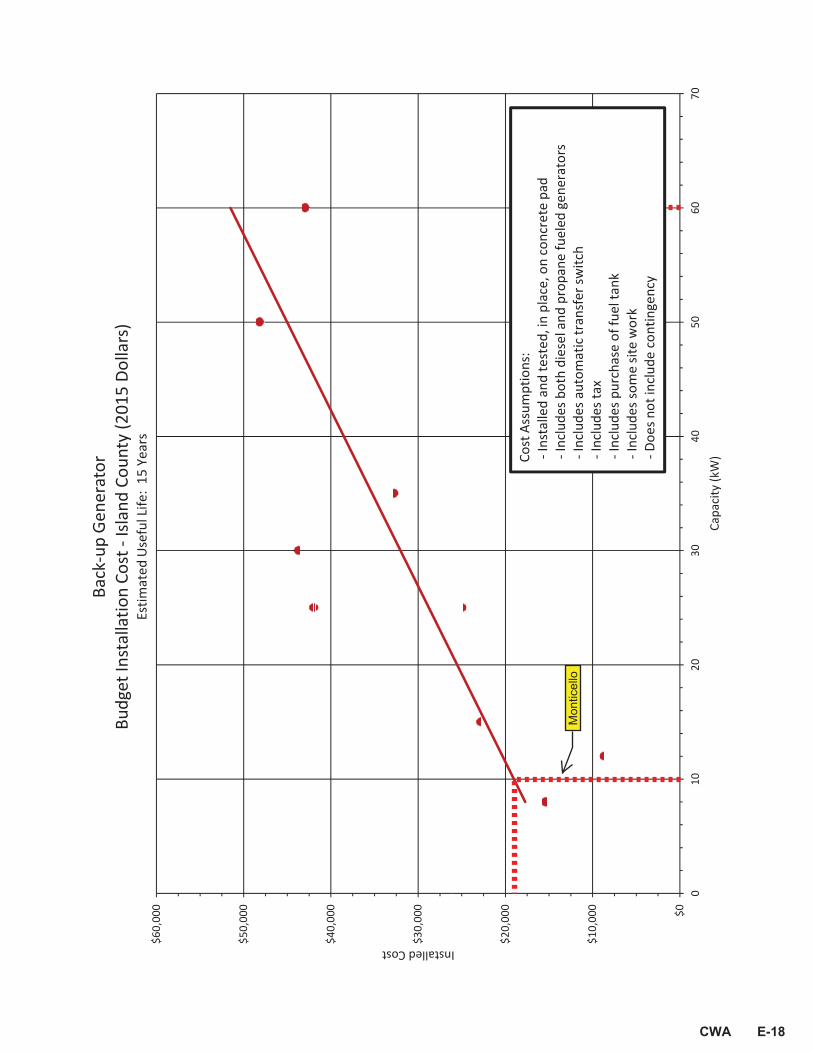
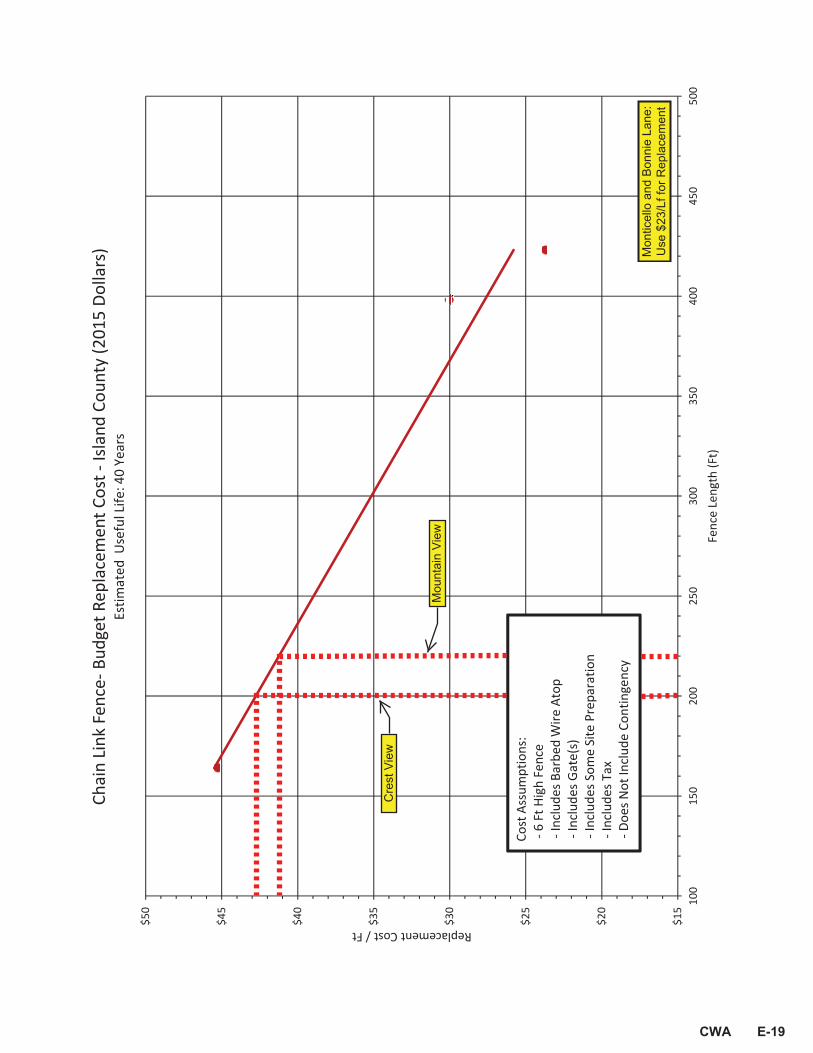
CostperGallonRe
serv
oir
Budg
etIn
stal
latio
nCo
stIsl
and
Coun
ty(2
015
Dolla
rs)
(Est
imat
edU
sefu
lLife
:Ye
ars)
Low
Tank
High
Tank
30'D
x20
'H30
'Dx
40'H
$0.0
0
$0.5
0
$1.0
0
020
,000
40,0
0060
,000
80,0
0010
0,00
012
0,00
014
0,00
016
0,00
018
0,00
020
0,00
0
Size
(Gal
lons
)
Cost
Assu
mpt
ions
:Re
info
rced
Conc
rete
Tank
Incl
udes
Pipi
ngU
nder
Tank
Incl
udes
Som
eSi
tePr
epar
atio
nIn
clud
esTa
xDo
esN
otIn
clud
eCo
ntin
genc
y(N
ote:
High
Tank
>32'
H)
Co-op E-9
Lost
Mea
dow
s 31
,300
Gal
Area (SF) Year Project LocationTotal
Construction Cost
Cost per SF
432 2007 South Whidbey - Bid $208,000 $481
256 2010 North Whidbey - Bid 109,000 426
192 2012 Camano Island - Bid 174,000 906
437 2013 North Whidbey - Bid 212,000 485
620 2015 Camano Island - Bid 481,000 776$615
53
Pumphouse - Budget Construction Cost - Island CountyEstimated Useful Life - Building: 40 years, Electrical: 20 years
(2015 Dollars)
Average Per SFSales Tax (8.7%)
668$670
( )Total
Estimate for Budgeting
Cost Assumptions:All costs in 2015 dollarsIncludes electrical componentsIncludes building and concrete slabIncludes booster pumps and appurtenancesIncludes site pipingIncludes taxIncludes some site work
Pumphouse Costs DE1915gc.xlsx
Co-op E-10
Description Unit Quantity Unit Price TotalMobilization LS 1 11,000.00 $11,000.00Removal of Structure & Obstruction LS 1 5,000.00 5,000.008-Inch HDPE Pipe LF 1,000 36.00 36,000.008-Inch Gate Valve EA. 2 1,400.00 2,800.008-Inch Tees, Bends & Fittings EA. 4 500.00 2,000.006 Inch Hydrant Assembly EA. 1 3,700.00 3,700.00Air Vacuum Valve Assembly EA. 1 1,900.00 1,900.00Single Service - Near Side EA. 10 900.00 9,000.00Single Service - Far Side EA. 10 1,800.00 18,000.00Connect Main to Existing System EA. 2 1,800.00 3,600.00Crushed Surfacing TN 75 32.00 2,400.00Commercial HMA - Pavement Patch TN 10 275.00 2,750.00Topsoil / Bark Mulch CY 20 45.00 900.00
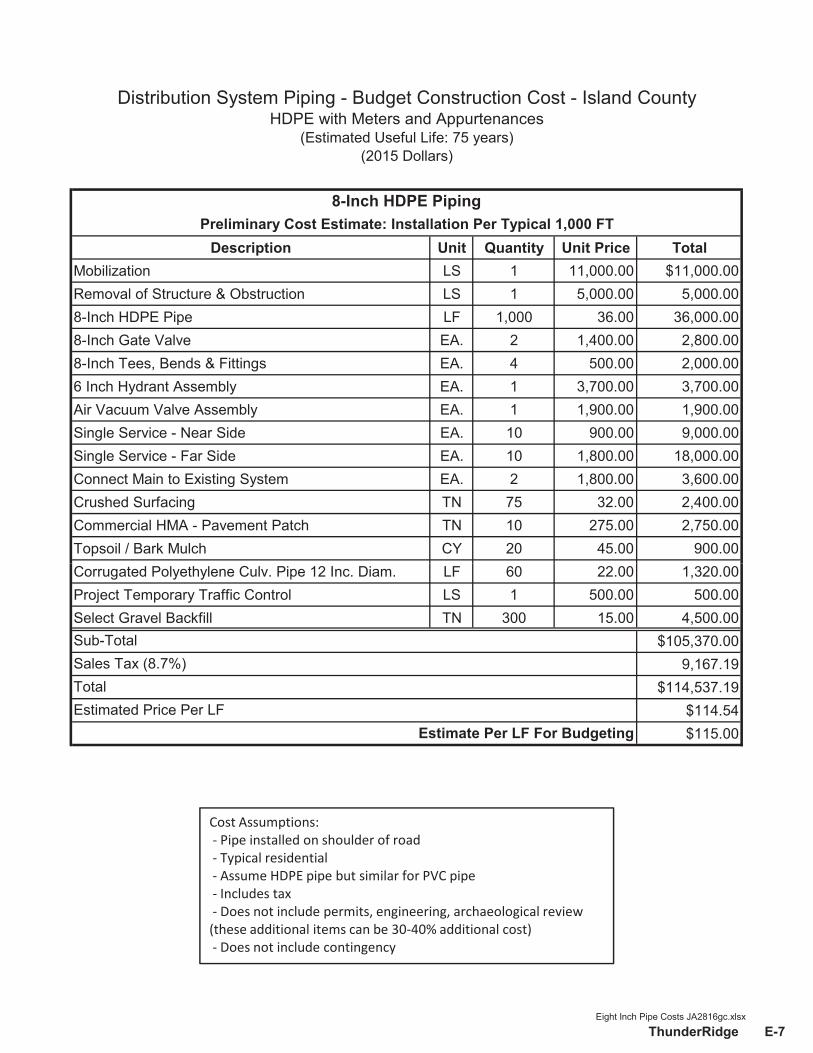
8-Inch HDPE PipingPreliminary Cost Estimate: Installation Per Typical 1,000 FT
Distribution System Piping - Budget Construction Cost - Island CountyHDPE with Meters and Appurtenances
(Estimated Useful Life: 75 years)(2015 Dollars)
Corrugated Polyethylene Culv. Pipe 12 Inc. Diam. LF 60 22.00 1,320.00Project Temporary Traffic Control LS 1 500.00 500.00Select Gravel Backfill TN 300 15.00 4,500.00
$105,370.009,167.19
$114,537.19$114.54$115.00
Estimated Price Per LFEstimate Per LF For Budgeting
Sub-TotalSales Tax (8.7%)Total
Cost Assumptions:Pipe installed on shoulder of roadTypical residentialAssume HDPE pipe but similar for PVC pipeIncludes taxDoes not include permits, engineering, archaeological review
(these additional items can be 30 40% additional cost)Does not include contingency
Eight Inch Pipe Costs JA2816gc.xlsx
Co-op E-11
Description Unit Quantity Unit Price TotalMobilization LS 1 10,000.00 $10,000.00Removal of Structure & Obstruction LS 1 5,000.00 5,000.006-Inch HDPE Pipe LF 1,000 28.00 28,000.006-Inch Gate Valve EA. 2 900.00 1,800.006-Inch Tees, Bends & Fittings EA. 4 500.00 2,000.006 Inch Hydrant Assembly EA. 1 3,700.00 3,700.00Air Vacuum Valve Assembly EA. 1 1,900.00 1,900.00Single Service - Near Side EA. 10 900.00 9,000.00Single Service - Far Side EA. 10 1,800.00 18,000.00Connect Main to Existing System EA. 2 1,800.00 3,600.00Crushed Surfacing TN 75 32.00 2,400.00Commercial HMA - Pavement Patch TN 10 275.00 2,750.00Topsoil / Bark Mulch CY 20 45.00 900.00
6-Inch HDPE PipingPreliminary Cost Estimate: Installation Per Typical 1,000 FT
Distribution System Piping - Budget Construction Cost - Island CountyHDPE with Meters and Appurtenances
(Estimated Useful Life: 75 years)(2015 Dollars)
Corrugated Polyethylene Culv. Pipe 12 Inc. Diam. LF 60 22.00 1,320.00Project Temporary Traffic Control LS 1 500.00 500.00Select Gravel Backfill TN 300 15.00 4,500.00
$95,370.008,297.19
$103,667.19$103.67$105.00
Estimated Price Per LFEstimate Per LF For Budgeting
Sub-TotalSales Tax (8.7%)Total
Cost Assumptions:Pipe installed on shoulder of roadTypical residentialAssume HDPE pipe but similar for PVC pipeIncludes taxDoes not include permits, engineering, archaeological review
(these additional items can be 30 40% additional cost)Does not include contingency
Six Inch Pipe Costs JA2816gc.xlsx
Co-op E-12
Year Project Name Cost2006 North Whidbey - Bid $34,6522010 North Whidbey - Estimate 27,9402011 North Whidbey - Bid 19,4352013 Camano Island - Bid 23,033
$26,2652,285
28 550T t lSales Tax (8.7%)Average
4-Inch PRV Station (For 6" Main)
(Estimated Useful Life: 35 Years)Island County Budget Construction Cost (2015 Dollars)
28,550$29,000Estimate for Budgeting
Total
Cost Assumptions:Includes taxIncludes some site workDoes not include contingency
231 SE Barrington Dr, Suite 205P.O. Box 459Oak Harbor, WA 98277
Tel: 360-279-0615Fax: 360-679-5046
Gregory R. Cane, P.E.
March 8, 2016
Camano Island Summit Association
Re: Central Camano Water SystemsCooperation Study - Report Appendix(Capital Facilities Replacement Review)
Dear Camano Island Summit Association Members: Please find enclosed the DRAFT Capital Facilities Replacement Review for your water system.The purpose of analyses such as this is to use available information to estimate both the total cost, and the annual contribution to the eventual replacement, of all water system components.
I have prepared the analysis based on the records available to me at this time. One reason for this initial draft is to seek refining data (e.g. for the Camano Island Summit Assn., the age of the well pump). Once the data is refined, the final report can be a very useful tool for the Board of Directors in guiding future decisions relative to assessments for the replacement of the water system’s facilities (I’ve discussed this further below).
There is one caution that I always make when preparing these analyses, that is, we should bewary of over-refinement. There is no doubt that there could be much fine-tuning on the margins. For example, should the useful life of the storage tank be 40 years, as I have used, or should it be 50 years? Or, should interest / inflation be included in the calculations? Communitiesinvariably determine, even after many tweaks, that the required cost per household per year (as reflected in Column K) is still very high. The lesson, therefore, is not whether the Summit Assn.cost per household per year should be $1,907.34, or $1,700, or $2,100, but that the replacement cost of the water systems capital facilities is high and should be addressed to the best ability of the Association.
If community members would like to further discuss the results of this review, I would be happy toanswer any questions that may arise. As possible, it would be very helpful if you could forward to me any updates or corrections that you may have by Monday, April 11, 2016.
- - - - -
The notes below discuss the columns in the attached table.
As of April 11, 2016, there was no indication from Camano Island Summit Association that changes to the Capital Facilities Plan are necessary.
Column A This column reflects a summary of the water system components, as reflected on the map included in this report. Water system component sizes, capacities, etc. have been based upon record information and documents. Please review this column and if you find incorrect information, please note it.
Column B
This is an estimate of the replacement cost (construction only) for the various water system components. For the most part, it is based on the budget cost information sheets enclosed herein. For instance, for the 128 square foot pumphouse, it is prudent to budget $670 per square foot for a new pumphouse. This is an all‐inclusive construction cost and takes into account the building, piping, pumps, electrical, control system, etc. The Column B value therefore for the 128 square foot pumphouse is (128 x $670/sq. ft.) = $85,760.
Column C
Recent experience has shown that other (non‐construction) costs for water system projects in Island County can add as much as 35% – 40% on top of construction costs. For this cost analysis, an additional 35% has been used. These additional costs can include engineering, construction management, archaeological / environmental review and mitigation, permitting, attorney’s fees and contingencies. This column reflects the total estimated component replacement costs.
Column D
The review year for this report is 2016.
Column E
Based on available information, the installation year for the noted component is reflected in this column. In some cases, I have estimated the installation year of a component. Please review this column. If your information differs from that included herein, please note this also. Column F
Column D minus Column E.
Column G
The expected life of a component is based upon the table enclosed in this report (Enclosure E-1). This Expected Useful Life table is a summary of fourteen data sources which evaluated
the expected life of water system components. In the right hand column of the table, I have suggested an anticipated useful life for the various components.
Column H
Column H is the arithmetic difference between the component age and the expected life. As noted herein, the result may not necessarily be meaningful for this cost review. For example, for the well the remaining useful life is noted as zero. Clearly, the well is functioning and will continue to function for some time into the future.
Column I
This column allows the reviewer to use a more reasonable anticipated remaining life value for the various components. Again, considering the well, I have estimated a remaining life of ten years for this component. The values placed within this column will be based upon the reviewer’s knowledge of the condition of the various water system facilities.
Column J
The current number of households (aka, Equivalent Residential Units) connected to the water system.
Column K
This is the amount that each household would need to contribute toward a Capital Facilities Replacement Fund (“Replacement Fund”) each year to provide their share of the cost for the noted component. For example, for the storage tank, each household would need to contribute $450.00 per year for the replacement of this component.
Column L
The noted support documents for your report are included herein, and the location reflected in this column.
Column M Miscellaneous notes, including cost information not reflected elsewhere in the report.
Discussion
Looking at the bottom of Column K, the total required contribution per household of $1,907.34 per year to a Replacement Fund is much more than is typically acceptable to the average homeowner. With the exception of a new water system, I am not aware of any similar analysis which did not result in an uncomfortably high required contribution to a Replacement Fund. Most communities, therefore, do not find it feasible to contribute to a Replacement
Having said that, however, one should not cast aside the results of this analysis as it does a reasonably good job of providing a long‐term replacement cost of a community’s water system. Most communities of which I am aware, have utilized the results of these analyses to increase (or to initiate) contributions to a Replacement Fund. If a given component were to fail and require replacement before there is sufficient money in the Fund, a water system may elect to finance these capital replacements through one of a number of loan programs available.
Camano Island Summit Assoc. - Capital Facilities Replacement Review - 2016
Notes:(1) Total Cost reflects additional 35% for engineering, archaeological and environmental review / mitigation, permitting, construction administration, attorney's fees and contingencies.(2) See Enclosure E-1.
Expected Useful Life Table,
Fannie Mae, 2014
TexasCommission on EnvironmentalQuality, 2014
EnvironmentalFinance Center,
New Mexico Tech, 2006
Water Resource Engineering
Linsley/Franzini3rd ed
Illinois Municipal TreasurersAssociation,
Website 2007
IrrigationPractice and Engineering,Early 1900's
Long Term Performance
Prediction of PVC Pipes,
AWWARF, 2005
Drinking Water DistributionSystems,
Assessing and Reduction of
Risks, National AcademiesPress, 2006
EPA, 2005
CorrosionProtection of Ductile Iron
Pipe, Corrpro Companies, Inc.
AssetManagement:
A Handbook for Small Water
Systems, EPA, 2003
EPA Control and Mitigation
of Drinking Water Losses in
DistributionSystems, 2009
JM Eagle Pipe Web Page,
2010
Plastics Pipe Institute Web Page, 2010
USE - First Pass
Water Storage Tank (Generic) 30 50-80 30 30-60Concrete Water Storage Tank 50Steel Water Storage Tank 40 50+
Cane Engineering, 201 a Table - Water System Life .xls
Camano Summit E-1
Water System Components - Expected Useful Life
Project Cost Per Ft
Recent Bid Information 62.48$ Estimate for Budgeting 65.00$
New Drilled Well - Budget Construction Cost
(Estimated Lifespan: 35 years)Island County (2015 Dollars)
Cost Assumptions:6 inch casing
100 ft deepIncludes taxIncludes some site workDoes not include contingency
Well Costs DE1815gc.xlsx
Camano Summit E-2
$10
000
$12,
000
$14,
000
$16,
000
$18,
000
$20,
000
$22,
000
$24,
000
eplacementCostW
ellP
ump
Budg
etRe
plac
emen
tCos
tIs
land
Coun
ty(2
015
Dolla
rs)
Estim
ated
Use
fulL
ife:1
5Ye
ars
$0
$2,0
00
$4,0
00
$6,0
00
$8,0
00
$10,
000
05
1015
2025
30
R
Capa
city
(HP)
Cost
Assu
mpt
ions
:In
clud
esne
wpi
ping
and
wiri
ngIn
clud
esm
inor
wel
lreh
abili
tatio
nIn
clud
esta
xDo
esno
tinc
lude
cont
inge
ncy
Camano Summit E-3
Area (SF) Year Project LocationTotal
Construction Cost
Cost per SF
432 2007 South Whidbey - Bid $208,000 $481
256 2010 North Whidbey - Bid 109,000 426
192 2012 Camano Island - Bid 174,000 906
437 2013 North Whidbey - Bid 212,000 485
620 2015 Camano Island - Bid 481,000 776$615
53
Pumphouse - Budget Construction Cost - Island CountyEstimated Useful Life - Building: 40 years, Electrical: 20 years
(2015 Dollars)
Average Per SFSales Tax (8.7%)
668$670
( )Total
Estimate for Budgeting
Cost Assumptions:All costs in 2015 dollarsIncludes electrical componentsIncludes building and concrete slabIncludes booster pumps and appurtenancesIncludes site pipingIncludes taxIncludes some site work
Pumphouse Costs DE1915gc.xlsx
Camano Summit E-4
20'D
x15
'H20
'Dx
19'H
20'D
x25
'H
30'D
x20
'H
20'
x20
'H
14'D
x50
'H
14'D
x55
'H
20'D
x50
'H
$1.5
0
$2.0
0
$2.5
0
$3.0
0
$3.5
0
CostperGallonRe
serv
oir
Budg
etIn
stal
latio
nCo
stIsl
and
Coun
ty(2
015
Dolla
rs)
(Est
imat
edU
sefu
lLife
:Ye
ars)
Low
Tank
High
Tank
30'D
x20
'H30
'Dx
40'H
$0.0
0
$0.5
0
$1.0
0
020
,000
40,0
0060
,000
80,0
0010
0,00
012
0,00
014
0,00
016
0,00
018
0,00
020
0,00
0
Size
(Gal
lons
)
Cost
Assu
mpt
ions
:Re
info
rced
Conc
rete
Tank
Incl
udes
Pipi
ngU
nder
Tank
Incl
udes
Som
eSi
tePr
epar
atio
nIn
clud
esTa
xDo
esN
otIn
clud
eCo
ntin
genc
y(N
ote:
High
Tank
>32'
H)
Camano Summit E-5
Description Unit Quantity Unit Price TotalMobilization LS 1 10,000.00 $10,000.00Removal of Structure & Obstruction LS 1 5,000.00 5,000.006-Inch HDPE Pipe LF 1,000 28.00 28,000.006-Inch Gate Valve EA. 2 900.00 1,800.006-Inch Tees, Bends & Fittings EA. 4 500.00 2,000.006 Inch Hydrant Assembly EA. 1 3,700.00 3,700.00Air Vacuum Valve Assembly EA. 1 1,900.00 1,900.00Single Service - Near Side EA. 10 900.00 9,000.00Single Service - Far Side EA. 10 1,800.00 18,000.00Connect Main to Existing System EA. 2 1,800.00 3,600.00Crushed Surfacing TN 75 32.00 2,400.00Commercial HMA - Pavement Patch TN 10 275.00 2,750.00Topsoil / Bark Mulch CY 20 45.00 900.00
6-Inch HDPE PipingPreliminary Cost Estimate: Installation Per Typical 1,000 FT
Distribution System Piping - Budget Construction Cost - Island CountyHDPE with Meters and Appurtenances
(Estimated Useful Life: 75 years)(2015 Dollars)
Corrugated Polyethylene Culv. Pipe 12 Inc. Diam. LF 60 22.00 1,320.00Project Temporary Traffic Control LS 1 500.00 500.00Select Gravel Backfill TN 300 15.00 4,500.00
$95,370.008,297.19
$103,667.19$103.67$105.00
Estimated Price Per LFEstimate Per LF For Budgeting
Sub-TotalSales Tax (8.7%)Total
Cost Assumptions:Pipe installed on shoulder of roadTypical residentialAssume HDPE pipe but similar for PVC pipeIncludes taxDoes not include permits, engineering, archaeological review
(these additional items can be 30 40% additional cost)Does not include contingency
231 SE Barrington Dr, Suite 205P.O. Box 459Oak Harbor, WA 98277
Tel: 360-279-0615Fax: 360-679-5046
Gregory R. Cane, P.E.
March 9, 2016
Camano Sunset Water System
Re: Central Camano Water SystemsCooperation Study - Report Appendix(Capital Facilities Replacement Review)
Dear Camano Sunset Water System Members: Please find enclosed the DRAFT Capital Facilities Replacement Review for your water system.The purpose of analyses such as this is to use available information to estimate both the total cost, and the annual contribution to the eventual replacement, of all water system components.
I have prepared the analysis based on the records available to me at this time. One reason for this initial draft is to seek refining data (e.g. for Camano Sunset, the age of the well pump). Once the data is refined, the final report can be a very useful tool for the Board of Directors in guiding future decisions relative to assessments for the replacement of the water system’s facilities (I’ve discussed this further below).
There is one caution that I always make when preparing these analyses, that is, we should be wary of over-refinement. There is no doubt that there could be much fine-tuning on the margins. For example, should the useful life of the storage tank be 40 years, as I have used, or should it be 50 years? Or, should interest / inflation be included in the calculations? Communities invariably determine, even after many tweaks, that the required cost per household per year (as reflected in Column K) is still very high. The lesson, therefore, is not whether the Camano Sunset cost per household per year should be $4,571.44, or $4,000, or $5,000, but that the replacement cost of the water systems capital facilities is high and should be addressed to the best ability of the Association.
If community members would like to further discuss the results of this review, I would be happy toanswer any questions that may arise. As possible, it would be very helpful if you could forward to me any updates or corrections that you may have by Monday, April 11, 2016.
- - - - -
The notes below discuss the columns in the attached table.
As of April 11, 2016, there was no indication from Camano Sunset Water System that changes to the Capital Facilities Plan are necessary.
This column reflects a summary of the water system components, as shown on the map included in this report. Water system component sizes, capacities, etc. have been based upon record information and documents. Please review this column and if you find incorrect information, please note it.
Column B
This is an estimate of the replacement cost (construction only) for the various water system components. For the most part, it is based on the budget cost information sheets enclosed herein. For instance, for the 320 square foot pumphouse, it is prudent to budget $450 per square foot for a reconstructed pumphouse. This is an all‐inclusive cost of reconstruction and takes into account the renovated building, and new piping, pumps, electrical, control system, etc. The Column B value therefore for the 320 square foot pumphouse is (320 x $450/sq. ft.) = $144,000.
Column C
Recent experience has shown that other (non‐construction) costs for water system projects in Island County can add as much as 35% – 40% on top of construction costs. For this cost analysis, an additional 35% has been used. These additional costs can include engineering, construction management, archaeological / environmental review and mitigation, permitting, attorney’s fees and contingencies. This column reflects the total estimated component replacement costs.
Column D
The review year for this report is 2016.
Column E
Based on available information, the installation year for the noted component is reflected in this column. In some cases, I have estimated the installation year of a component. Please review this column. If your information differs from that included herein, please note this also. Column F
Column G The expected life of a component is based upon the table enclosed in this report (Enclosure E-1). This Expected Useful Life table is a summary of fourteen data sources which evaluated the expected life of water system components. In the right hand column of the table, I have suggested an anticipated useful life for the various components. Column H
Column H is the arithmetic difference between the component age and the expected life. As noted herein, the result may not necessarily be meaningful for this cost review. For example, for the well, the years remaining to replacement is a minus 3 years. Clearly, the well is functioning, and will continue to function for some time into the future.
Column I
This column allows the reviewer to use a more reasonable anticipated remaining life value for the various components. Again, considering the well, I have estimated a remaining life of ten years for this component. The values placed within this column will be based upon the reviewer’s knowledge of the condition of the various water system facilities.
Column J
The current number of households (aka, Equivalent Residential Units) connected to the water system.
Column K
This is the amount that each household would need to contribute toward a Capital Facilities Replacement Fund (“Replacement Fund”) each year to provide their share of the cost for the noted component. For example, for the storage tank, each household would need to contribute $666.90 per year for the replacement of this component.
Column L
The noted support documents for your report are included herein, and the location reflected in this column.
Column M Miscellaneous notes, including cost information not reflected elsewhere in the report.
Discussion Looking at the bottom of Column K, the total required contribution per household of $4,571.44 per year to a Replacement Fund is much more than is typically acceptable to the average homeowner. With the exception of a new water system, I am not aware of any similar analysis which did not result in an uncomfortably high required contribution to a Replacement Fund. Most communities, therefore, do not find it feasible to contribute to a Replacement Fund at the level provided in these analyses.
Having said that, however, one should not cast aside the results of this analysis as it does a reasonably good job of providing a long‐term replacement cost of a community’s water system. Most communities of which I am aware, have utilized the results of these analyses to increase (or to initiate) contributions to a Replacement Fund. If a given component were to fail and require replacement before there is sufficient money in the Fund, a water system may elect to finance these capital replacements through one of a number of loan programs available.
Camano Sunset Water System. - Capital Facilities Replacement Review - 2016
Notes:(1) Total Cost reflects additional 35% for engineering, archaeological and environmental review / mitigation, permitting, construction administration, attorney's fees and contingencies.(2) See Enclosure E-1.
Expected Useful Life Table,
Fannie Mae, 2014
TexasCommission on EnvironmentalQuality, 2014
EnvironmentalFinance Center,
New Mexico Tech, 2006
Water Resource Engineering
Linsley/Franzini3rd ed
Illinois Municipal TreasurersAssociation,
Website 2007
IrrigationPractice and Engineering,Early 1900's
Long Term Performance
Prediction of PVC Pipes,
AWWARF, 2005
Drinking Water DistributionSystems,
Assessing and Reduction of
Risks, National AcademiesPress, 2006
EPA, 2005
CorrosionProtection of Ductile Iron
Pipe, Corrpro Companies, Inc.
AssetManagement:
A Handbook for Small Water
Systems, EPA, 2003
EPA Control and Mitigation
of Drinking Water Losses in
DistributionSystems, 2009
JM Eagle Pipe Web Page,
2010
Plastics Pipe Institute Web Page, 2010
USE - First Pass
Water Storage Tank (Generic) 30 50-80 30 30-60Concrete Water Storage Tank 50Steel Water Storage Tank 40 50+
Cane Engineering, 201 a Table - Water System Life .xls
Camano Sunset E-1
Water System Components - Expected Useful Life
Project Cost Per Ft
Recent Bid Information 62.48$ Estimate for Budgeting 65.00$
New Drilled Well - Budget Construction Cost
(Estimated Lifespan: 35 years)Island County (2015 Dollars)
Cost Assumptions:6 inch casing
100 ft deepIncludes taxIncludes some site workDoes not include contingency
Well Costs DE1815gc.xlsx
Camano Sunset E-2
$10
000
$12,
000
$14,
000
$16,
000
$18,
000
$20,
000
$22,
000
$24,
000
eplacementCostW
ellP
ump
Budg
etRe
plac
emen
tCos
tIs
land
Coun
ty(2
015
Dolla
rs)
Estim
ated
Use
fulL
ife:1
5Ye
ars
$0
$2,0
00
$4,0
00
$6,0
00
$8,0
00
$10,
000
05
1015
2025
30
R
Capa
city
(HP)
Cost
Assu
mpt
ions
:In
clud
esne
wpi
ping
and
wiri
ngIn
clud
esm
inor
wel
lreh
abili
tatio
nIn
clud
esta
xDo
esno
tinc
lude
cont
inge
ncy
Camano Sunset E-3
Area (SF) Year Project LocationTotal
Construction Cost
Cost per SF
432 2007 South Whidbey - Bid $208,000 $481
256 2010 North Whidbey - Bid 109,000 426
192 2012 Camano Island - Bid 174,000 906
437 2013 North Whidbey - Bid 212,000 485
620 2015 Camano Island - Bid 481,000 776$615
53
Pumphouse - Budget Construction Cost - Island CountyEstimated Useful Life - Building: 40 years, Electrical: 20 years
(2015 Dollars)
Average Per SFSales Tax (8.7%)
668$670
( )Total
Estimate for Budgeting
Cost Assumptions:All costs in 2015 dollarsIncludes electrical componentsIncludes building and concrete slabIncludes booster pumps and appurtenancesIncludes site pipingIncludes taxIncludes some site work
Pumphouse Costs DE1915gc.xlsx
Camano Sunset E-4
Camano Sunset Pumphouse: Assume Retention of CMU Walls and Conc. Floor. Estimate
Reconstruction @ $450/Sf
2,00
0
2,25
0
2,50
0
2,75
0
Pergpm(2015$)
Fe/M
n/As
RemovalTreatm
ent
Budget
CostInform
ationforIslan
dCo
unty
(201
5Do
llars)
(DesignFlow
Less
Than
100gpm)
USEPA
2015
CostEvalua
tion:
Includ
esEq
uipm
ent,Installatio
n,Pu
mph
ouse,
Engine
eringan
dPe
rmits
.
1,25
0
1,50
0
1,75
0
1020
3040
5060
7080
9010
0
CostP
Design
Flow
Rate
gpmU
seforIslan
dCo
unty
for
2050
gpm.Treatmen
tSystem
Equipm
enta
ndInstallatio
nOnly.
Camano Sunset E-5
20'D
x15
'H20
'Dx
19'H
20'D
x25
'H
30'D
x20
'H
20'
x20
'H
14'D
x50
'H
14'D
x55
'H
20'D
x50
'H
$1.5
0
$2.0
0
$2.5
0
$3.0
0
$3.5
0
CostperGallonRe
serv
oir
Budg
etIn
stal
latio
nCo
stIsl
and
Coun
ty(2
015
Dolla
rs)
(Est
imat
edU
sefu
lLife
:Ye
ars)
Low
Tank
High
Tank
30'D
x20
'H30
'Dx
40'H
$0.0
0
$0.5
0
$1.0
0
020
,000
40,0
0060
,000
80,0
0010
0,00
012
0,00
014
0,00
016
0,00
018
0,00
020
0,00
0
Size
(Gal
lons
)
Cost
Assu
mpt
ions
:Re
info
rced
Conc
rete
Tank
Incl
udes
Pipi
ngU
nder
Tank
Incl
udes
Som
eSi
tePr
epar
atio
nIn
clud
esTa
xDo
esN
otIn
clud
eCo
ntin
genc
y(N
ote:
High
Tank
>32'
H)
Camano Sunset E-6
Description Unit Quantity Unit Price TotalMobilization LS 1 10,000.00 $10,000.00Removal of Structure & Obstruction LS 1 5,000.00 5,000.006-Inch HDPE Pipe LF 1,000 28.00 28,000.006-Inch Gate Valve EA. 2 900.00 1,800.006-Inch Tees, Bends & Fittings EA. 4 500.00 2,000.006 Inch Hydrant Assembly EA. 1 3,700.00 3,700.00Air Vacuum Valve Assembly EA. 1 1,900.00 1,900.00Single Service - Near Side EA. 10 900.00 9,000.00Single Service - Far Side EA. 10 1,800.00 18,000.00Connect Main to Existing System EA. 2 1,800.00 3,600.00Crushed Surfacing TN 75 32.00 2,400.00Commercial HMA - Pavement Patch TN 10 275.00 2,750.00Topsoil / Bark Mulch CY 20 45.00 900.00
6-Inch HDPE PipingPreliminary Cost Estimate: Installation Per Typical 1,000 FT
Distribution System Piping - Budget Construction Cost - Island CountyHDPE with Meters and Appurtenances
(Estimated Useful Life: 75 years)(2015 Dollars)
Corrugated Polyethylene Culv. Pipe 12 Inc. Diam. LF 60 22.00 1,320.00Project Temporary Traffic Control LS 1 500.00 500.00Select Gravel Backfill TN 300 15.00 4,500.00
$95,370.008,297.19
$103,667.19$103.67$105.00
Estimated Price Per LFEstimate Per LF For Budgeting
Sub-TotalSales Tax (8.7%)Total
Cost Assumptions:Pipe installed on shoulder of roadTypical residentialAssume HDPE pipe but similar for PVC pipeIncludes taxDoes not include permits, engineering, archaeological review
(these additional items can be 30 40% additional cost)Does not include contingency
231 SE Barrington Dr, Suite 205P.O. Box 459Oak Harbor, WA 98277
Tel: 360-279-0615Fax: 360-679-5046
Gregory R. Cane, P.E.
March 9, 2016
Camano Water Association
Re: Central Camano Water SystemsCooperation Study - Report Appendix(Capital Facilities Replacement Review)
Dear Camano Water Association Members: Please find enclosed the DRAFT Capital Facilities Replacement Review for your water system.The purpose of analyses such as this is to use available information to estimate both the total cost, and the annual contribution to the eventual replacement, of all water system components.
I have prepared the analysis based on the records available to me at this time. One reason for this initial draft is to seek refining data (e.g. for Camano Water Association (CWA), the size and age of the Monticello generator). Once the data is refined, the final report can be a very useful tool for the Board of Directors in guiding future decisions relative to assessments for the replacement of the water system’s facilities (I’ve discussed this further below).
There is one caution that I always make when preparing these analyses, that is, we should bewary of over-refinement. There is no doubt that there could be much fine-tuning on the margins. For example, should the useful life of the storage tank be 40 years, as I have used, or should it be 50 years? Or, should interest / inflation be included in the calculations? Communitiesinvariably determine, even after many tweaks, that the required cost per household per year (as reflected in Column K) is still very high. The lesson, therefore, is not whether the CWA cost per household per year should be $1,157.79, or $1,000, or $1,400, but that the replacement cost of the water systems capital facilities is high and should be addressed to the best ability of the Association.
If community members would like to further discuss the results of this review, I would be happy toanswer any questions that may arise. As possible, it would be very helpful if you could forward to me any updates or corrections that you may have by Monday, April 11, 2016.
- - - - -
The notes below discuss the columns in the attached table.
As of April 11, 2016, Camano Water Association indicated that the Capital Facilities Plan is acceptable as is.
This column reflects a summary of the water system components. Water system facility sizes, capacities, etc. have been based upon record information and documents. Please review this column and if you find incorrect information, please note it.
Column B
This is an estimate of the replacement cost (construction only) for the various water system components. For the most part, it is based on the budget cost information sheets enclosed herein. For instance, for the 950 square foot Bonnie Lane pumphouse, it is prudent to budget $670 per square foot for a new pumphouse. This is an all‐inclusive construction cost and takes into account the building, piping, pumps, electrical, control system, etc. The Column B value therefore for the 950 square foot pumphouse is (950 x $670/sq. ft.) = $636,500.
Column C
Recent experience has shown that other (non‐construction) costs for water system projects in Island County can add as much as 35% – 40% on top of construction costs. For this cost analysis, an additional 35% has been used. These additional costs can include engineering, construction management, archaeological / environmental review and mitigation, permitting, attorney’s fees and contingencies. This column reflects the total estimated component replacement costs.
Column D
The review year for this report is 2016.
Column E
Based on available information, the installation year for the noted component is reflected in this column. In some cases, I have estimated the installation year of a component. Please review this column. If your information differs from that included herein, please note this also. Column F
Column D minus Column E.
Column G
The expected life of a component is based upon the table enclosed in this report (Enclosure E-1). This Expected Useful Life table is a summary of fourteen data sources which evaluated
the expected life of water system components. In the right hand column of the table, I have suggested an anticipated useful life for the various components. Column H
Column H is the arithmetic difference between the component age and the expected life. As noted herein, the result may not necessarily be meaningful for this cost review. For example, for some galvanized steel pipe, the years remaining to replacement is a minus 31 years. Clearly, the steel pipe is functioning, and will continue to function for some time into the future.
Column I
This column allows the reviewer to use a more reasonable anticipated remaining life value for the various components. Again, considering the galvanized steel pipe, I have estimated a remaining life of five years for even the oldest steel pipe. The values placed within this column will be based upon the reviewer’s knowledge of the condition of the various water system facilities.
Column J
The current number of households (aka, Equivalent Residential Units) connected to the water system.
Column K
This is the amount that each household would need to contribute toward a Capital Facilities Replacement Fund (“Replacement Fund”) each year to provide their share of the cost for the noted component. For example, for the Bonnie Lane pumphouse, each household would need to contribute $42.87 per year for the replacement of this component.
Column L
The noted support documents for your report are included herein, and the location reflected in this column.
Column M Miscellaneous notes, including cost information not reflected elsewhere in the report.
Discussion
Looking at the bottom of Column K, the total required contribution per household of $1,157.79 per year to a Replacement Fund is much more than is typically acceptable to the average homeowner. With the exception of a new water system, I am not aware of any similar analysis which did not result in an uncomfortably high required contribution to a Replacement
Fund. Most communities, therefore, do not find it feasible to contribute to a Replacement Fund at the level provided in these analyses.
Having said that, however, one should not cast aside the results of this analysis as it does a reasonably good job of providing a long‐term replacement cost of a community’s water system. Most communities of which I am aware, have utilized the results of these analyses to increase (or to initiate) contributions to a Replacement Fund. If a given component were to fail and require replacement before there is sufficient money in the Fund, a water system may elect to finance these capital replacements through one of a number of loan programs available.
Corporate Office - Storage (2500 SF) 250,000 337,500 2016 1990 26 50 24 24 1055 13.33 Age is Estimated. Use $100/SF Replacement Cost.
Totals $14,576,712 $19,678,561 $1,157.79
Camano Water Assn. - Capital Facilities Replacement Review - 2016
Notes:(1) Total Cost reflects additional 35% for engineering, archaeological and environmental review / mitigation, permitting, construction administration, attorney's fees and contingencies.(2) See Enclosure E-1.
WATER SERVICE AREA FOR
CAMANO WATER ASSOCIATION 1 of 54
ED
GE
WO
OD
DR
.
3" AC
6" AC
2" GI
2" PVC
2" PVC
NEXT PAGE(TYP.)
Sample for Pipe Length/Size/Age Data CollectionMethod. Pipes for Each of
54 Sheets Reviewed toDetermine Pipe
Characteristics in AreaShown.
Expected Useful Life Table,
Fannie Mae, 2014
TexasCommission on EnvironmentalQuality, 2014
EnvironmentalFinance Center,
New Mexico Tech, 2006
Water Resource Engineering
Linsley/Franzini3rd ed
Illinois Municipal TreasurersAssociation,
Website 2007
IrrigationPractice and Engineering,Early 1900's
Long Term Performance
Prediction of PVC Pipes,
AWWARF, 2005
Drinking Water DistributionSystems,
Assessing and Reduction of
Risks, National AcademiesPress, 2006
EPA, 2005
CorrosionProtection of Ductile Iron
Pipe, Corrpro Companies, Inc.
AssetManagement:
A Handbook for Small Water
Systems, EPA, 2003
EPA Control and Mitigation
of Drinking Water Losses in
DistributionSystems, 2009
JM Eagle Pipe Web Page,
2010
Plastics Pipe Institute Web Page, 2010
USE - First Pass
Water Storage Tank (Generic) 30 50-80 30 30-60Concrete Water Storage Tank 50Steel Water Storage Tank 40 50+
Cane Engineering, 201 a Table - Water System Life .xls
CWA E-1
Water System Components - Expected Useful Life
Project Cost Per Ft
Recent Bid Information 62.48$ Estimate for Budgeting 65.00$
New Drilled Well - Budget Construction Cost
(Estimated Lifespan: 35 years)Island County (2015 Dollars)
Cost Assumptions:6 inch casing
100 ft deepIncludes taxIncludes some site workDoes not include contingency
Well Costs DE1815gc.xlsx
CWA E-2
Use $80/Ft for 8" Well
$10
000
$12,
000
$14,
000
$16,
000
$18,
000
$20,
000
$22,
000
$24,
000
eplacementCostW
ellP
ump
Budg
etRe
plac
emen
tCos
tIs
land
Coun
ty(2
015
Dolla
rs)
Estim
ated
Use
fulL
ife:1
5Ye
ars
$0
$2,0
00
$4,0
00
$6,0
00
$8,0
00
$10,
000
05
1015
2025
30
R
Capa
city
(HP)
Cost
Assu
mpt
ions
:In
clud
esne
wpi
ping
and
wiri
ngIn
clud
esm
inor
wel
lreh
abili
tatio
nIn
clud
esta
xDo
esno
tinc
lude
cont
inge
ncy
CWA E-3
Wel
ls6,
7an
d8
Wel
ls4
&5
Area (SF) Year Project LocationTotal
Construction Cost
Cost per SF
432 2007 South Whidbey - Bid $208,000 $481
256 2010 North Whidbey - Bid 109,000 426
192 2012 Camano Island - Bid 174,000 906
437 2013 North Whidbey - Bid 212,000 485
620 2015 Camano Island - Bid 481,000 776$615
53
Pumphouse - Budget Construction Cost - Island CountyEstimated Useful Life - Building: 40 years, Electrical: 20 years
(2015 Dollars)
Average Per SFSales Tax (8.7%)
668$670
( )Total
Estimate for Budgeting
Cost Assumptions:All costs in 2015 dollarsIncludes electrical componentsIncludes building and concrete slabIncludes booster pumps and appurtenancesIncludes site pipingIncludes taxIncludes some site work
Pumphouse Costs DE1915gc.xlsx
CWA E-4
Use $500/SF for Well Houses(Based on 2014 Camano Bid Tabulation)
Equi
pmen
t Cos
ts: $
/ gpm
vs
Size
($/g
pm)
Des
ign
Flow
Rat
e -
gpm
010
020
030
040
050
060
070
080
0
Equipment Cost - $/gpm
0
500
1000
1500
2000
2500
3000
3500
IR S
yste
ms
IR A
M S
yste
ms
C/F
Sys
tem
sIX
Sys
tem
s AM
Sys
tem
s
CWA E-5
Sour
ce: U
SEPA
Jan
uary
27,
20
15 W
ebin
ar -
Tom
Sor
g, P
E (R
ed L
ines
by
Can
e)
$400
/gpm
20'D
x15
'H20
'Dx
19'H
20'D
x25
'H
30'D
x20
'H
20'
x20
'H
14'D
x50
'H
14'D
x55
'H
20'D
x50
'H
$1.5
0
$2.0
0
$2.5
0
$3.0
0
$3.5
0
CostperGallonRe
serv
oir
Budg
etIn
stal
latio
nCo
stIsl
and
Coun
ty(2
015
Dolla
rs)
(Est
imat
edU
sefu
lLife
:Ye
ars)
Low
Tank
High
Tank
30'D
x20
'H30
'Dx
40'H
$0.0
0
$0.5
0
$1.0
0
020
,000
40,0
0060
,000
80,0
0010
0,00
012
0,00
014
0,00
016
0,00
018
0,00
020
0,00
0
Size
(Gal
lons
)
Cost
Assu
mpt
ions
:Re
info
rced
Conc
rete
Tank
Incl
udes
Pipi
ngU
nder
Tank
Incl
udes
Som
eSi
tePr
epar
atio
nIn
clud
esTa
xDo
esN
otIn
clud
eCo
ntin
genc
y(N
ote:
High
Tank
>32'
H)
CWA E-6
Mon
ticel
lo
150,
000
Gal
20'D
x15
'H20
'Dx
19'H
20'D
x25
'H
30'D
x20
'H
20'
x20
'H
14'D
x50
'H
14'D
x55
'H
20'D
x50
'H
$1.5
0
$2.0
0
$2.5
0
$3.0
0
$3.5
0
CostperGallonRe
serv
oir
Budg
etIn
stal
latio
nCo
stIsl
and
Coun
ty(2
015
Dolla
rs)
(Est
imat
edU
sefu
lLife
:Ye
ars)
Low
Tank
High
Tank
30'D
x20
'H30
'Dx
40'H
$0.0
0
$0.5
0
$1.0
0
020
,000
40,0
0060
,000
80,0
0010
0,00
012
0,00
014
0,00
016
0,00
018
0,00
020
0,00
0
Size
(Gal
lons
)
Cost
Assu
mpt
ions
:Re
info
rced
Conc
rete
Tank
Incl
udes
Pipi
ngU
nder
Tank
Incl
udes
Som
eSi
tePr
epar
atio
nIn
clud
esTa
xDo
esN
otIn
clud
eCo
ntin
genc
y(N
ote:
High
Tank
>32'
H)
CWA E-7
Mon
ticel
lo
100,
000
Gal
20'D
x15
'H20
'Dx
19'H
20'D
x25
'H
30'D
x20
'H
20'
x20
'H
14'D
x50
'H
14'D
x55
'H
20'D
x50
'H
$1.5
0
$2.0
0
$2.5
0
$3.0
0
$3.5
0
CostperGallonRe
serv
oir
Budg
etIn
stal
latio
nCo
stIsl
and
Coun
ty(2
015
Dolla
rs)
(Est
imat
edU
sefu
lLife
:Ye
ars)
Low
Tank
High
Tank
30'D
x20
'H30
'Dx
40'H
$0.0
0
$0.5
0
$1.0
0
020
,000
40,0
0060
,000
80,0
0010
0,00
012
0,00
014
0,00
016
0,00
018
0,00
020
0,00
0
Size
(Gal
lons
)
Cost
Assu
mpt
ions
:Re
info
rced
Conc
rete
Tank
Incl
udes
Pipi
ngU
nder
Tank
Incl
udes
Som
eSi
tePr
epar
atio
nIn
clud
esTa
xDo
esN
otIn
clud
eCo
ntin
genc
y(N
ote:
High
Tank
>32'
H)
CWA E-8
Mon
ticel
lo
80,0
00 G
al
20'D
x15
'H20
'Dx
19'H
20'D
x25
'H
30'D
x20
'H
20'
x20
'H
14'D
x50
'H
14'D
x55
'H
20'D
x50
'H
$1.5
0
$2.0
0
$2.5
0
$3.0
0
$3.5
0
CostperGallonRe
serv
oir
Budg
etIn
stal
latio
nCo
stIsl
and
Coun
ty(2
015
Dolla
rs)
(Est
imat
edU
sefu
lLife
:Ye
ars)
Low
Tank
High
Tank
30'D
x20
'H30
'Dx
40'H
$0.0
0
$0.5
0
$1.0
0
020
,000
40,0
0060
,000
80,0
0010
0,00
012
0,00
014
0,00
016
0,00
018
0,00
020
0,00
0
Size
(Gal
lons
)
Cost
Assu
mpt
ions
:Re
info
rced
Conc
rete
Tank
Incl
udes
Pipi
ngU
nder
Tank
Incl
udes
Som
eSi
tePr
epar
atio
nIn
clud
esTa
xDo
esN
otIn
clud
eCo
ntin
genc
y(N
ote:
High
Tank
>32'
H)
CWA E-9
Bon
nie
Lane
86
,000
Gal
20'D
x15
'H20
'Dx
19'H
20'D
x25
'H
30'D
x20
'H
20'
x20
'H
14'D
x50
'H
14'D
x55
'H
20'D
x50
'H
$1.5
0
$2.0
0
$2.5
0
$3.0
0
$3.5
0
CostperGallonRe
serv
oir
Budg
etIn
stal
latio
nCo
stIsl
and
Coun
ty(2
015
Dolla
rs)
(Est
imat
edU
sefu
lLife
:Ye
ars)
Low
Tank
High
Tank
30'D
x20
'H30
'Dx
40'H
$0.0
0
$0.5
0
$1.0
0
020
,000
40,0
0060
,000
80,0
0010
0,00
012
0,00
014
0,00
016
0,00
018
0,00
020
0,00
0
Size
(Gal
lons
)
Cost
Assu
mpt
ions
:Re
info
rced
Conc
rete
Tank
Incl
udes
Pipi
ngU
nder
Tank
Incl
udes
Som
eSi
tePr
epar
atio
nIn
clud
esTa
xDo
esN
otIn
clud
eCo
ntin
genc
y(N
ote:
High
Tank
>32'
H)
CWA E-10
Bon
nie
Lane
40
,000
Gal
20'D
x15
'H20
'Dx
19'H
20'D
x25
'H
30'D
x20
'H
20'
x20
'H
14'D
x50
'H
14'D
x55
'H
20'D
x50
'H
$1.5
0
$2.0
0
$2.5
0
$3.0
0
$3.5
0
CostperGallonRe
serv
oir
Budg
etIn
stal
latio
nCo
stIsl
and
Coun
ty(2
015
Dolla
rs)
(Est
imat
edU
sefu
lLife
:Ye
ars)
Low
Tank
High
Tank
30'D
x20
'H30
'Dx
40'H
$0.0
0
$0.5
0
$1.0
0
020
,000
40,0
0060
,000
80,0
0010
0,00
012
0,00
014
0,00
016
0,00
018
0,00
020
0,00
0
Size
(Gal
lons
)
Cost
Assu
mpt
ions
:Re
info
rced
Conc
rete
Tank
Incl
udes
Pipi
ngU
nder
Tank
Incl
udes
Som
eSi
tePr
epar
atio
nIn
clud
esTa
xDo
esN
otIn
clud
eCo
ntin
genc
y(N
ote:
High
Tank
>32'
H)
CWA E-11
Cre
st V
iew
80
,000
Gal
20'D
x15
'H20
'Dx
19'H
20'D
x25
'H
30'D
x20
'H
20'
x20
'H
14'D
x50
'H
14'D
x55
'H
20'D
x50
'H
$1.5
0
$2.0
0
$2.5
0
$3.0
0
$3.5
0
CostperGallonRe
serv
oir
Budg
etIn
stal
latio
nCo
stIsl
and
Coun
ty(2
015
Dolla
rs)
(Est
imat
edU
sefu
lLife
:Ye
ars)
Low
Tank
High
Tank
30'D
x20
'H30
'Dx
40'H
$0.0
0
$0.5
0
$1.0
0
020
,000
40,0
0060
,000
80,0
0010
0,00
012
0,00
014
0,00
016
0,00
018
0,00
020
0,00
0
Size
(Gal
lons
)
Cost
Assu
mpt
ions
:Re
info
rced
Conc
rete
Tank
Incl
udes
Pipi
ngU
nder
Tank
Incl
udes
Som
eSi
tePr
epar
atio
nIn
clud
esTa
xDo
esN
otIn
clud
eCo
ntin
genc
y(N
ote:
High
Tank
>32'
H)
CWA E-12
Mt.
Vie
w
37,0
00 G
al
Area (SF) Year Project LocationTotal
Construction Cost
Cost per SF
432 2007 South Whidbey - Bid $208,000 $481
256 2010 North Whidbey - Bid 109,000 426
192 2012 Camano Island - Bid 174,000 906
437 2013 North Whidbey - Bid 212,000 485
620 2015 Camano Island - Bid 481,000 776$615
53
Pumphouse - Budget Construction Cost - Island CountyEstimated Useful Life - Building: 40 years, Electrical: 20 years
(2015 Dollars)
Average Per SFSales Tax (8.7%)
668$670
( )Total
Estimate for Budgeting
Cost Assumptions:All costs in 2015 dollarsIncludes electrical componentsIncludes building and concrete slabIncludes booster pumps and appurtenancesIncludes site pipingIncludes taxIncludes some site work
Pumphouse Costs DE1915gc.xlsx
CWA E-13
Description Unit Quantity Unit Price TotalMobilization LS 1 11,000.00 $11,000.00Removal of Structure & Obstruction LS 1 5,000.00 5,000.008-Inch HDPE Pipe LF 1,000 36.00 36,000.008-Inch Gate Valve EA. 2 1,400.00 2,800.008-Inch Tees, Bends & Fittings EA. 4 500.00 2,000.006 Inch Hydrant Assembly EA. 1 3,700.00 3,700.00Air Vacuum Valve Assembly EA. 1 1,900.00 1,900.00Single Service - Near Side EA. 10 900.00 9,000.00Single Service - Far Side EA. 10 1,800.00 18,000.00Connect Main to Existing System EA. 2 1,800.00 3,600.00Crushed Surfacing TN 75 32.00 2,400.00Commercial HMA - Pavement Patch TN 10 275.00 2,750.00Topsoil / Bark Mulch CY 20 45.00 900.00
8-Inch HDPE PipingPreliminary Cost Estimate: Installation Per Typical 1,000 FT
Distribution System Piping - Budget Construction Cost - Island CountyHDPE with Meters and Appurtenances
(Estimated Useful Life: 75 years)(2015 Dollars)
Corrugated Polyethylene Culv. Pipe 12 Inc. Diam. LF 60 22.00 1,320.00Project Temporary Traffic Control LS 1 500.00 500.00Select Gravel Backfill TN 300 15.00 4,500.00
$105,370.009,167.19
$114,537.19$114.54$115.00
Estimated Price Per LFEstimate Per LF For Budgeting
Sub-TotalSales Tax (8.7%)Total
Cost Assumptions:Pipe installed on shoulder of roadTypical residentialAssume HDPE pipe but similar for PVC pipeIncludes taxDoes not include permits, engineering, archaeological review
(these additional items can be 30 40% additional cost)Does not include contingency
Eight Inch Pipe Costs JA2816gc.xlsx
CWA E-14
Description Unit Quantity Unit Price TotalMobilization LS 1 10,000.00 $10,000.00Removal of Structure & Obstruction LS 1 5,000.00 5,000.006-Inch HDPE Pipe LF 1,000 28.00 28,000.006-Inch Gate Valve EA. 2 900.00 1,800.006-Inch Tees, Bends & Fittings EA. 4 500.00 2,000.006 Inch Hydrant Assembly EA. 1 3,700.00 3,700.00Air Vacuum Valve Assembly EA. 1 1,900.00 1,900.00Single Service - Near Side EA. 10 900.00 9,000.00Single Service - Far Side EA. 10 1,800.00 18,000.00Connect Main to Existing System EA. 2 1,800.00 3,600.00Crushed Surfacing TN 75 32.00 2,400.00Commercial HMA - Pavement Patch TN 10 275.00 2,750.00Topsoil / Bark Mulch CY 20 45.00 900.00
6-Inch HDPE PipingPreliminary Cost Estimate: Installation Per Typical 1,000 FT
Distribution System Piping - Budget Construction Cost - Island CountyHDPE with Meters and Appurtenances
(Estimated Useful Life: 75 years)(2015 Dollars)
Corrugated Polyethylene Culv. Pipe 12 Inc. Diam. LF 60 22.00 1,320.00Project Temporary Traffic Control LS 1 500.00 500.00Select Gravel Backfill TN 300 15.00 4,500.00
$95,370.008,297.19
$103,667.19$103.67$105.00
Estimated Price Per LFEstimate Per LF For Budgeting
Sub-TotalSales Tax (8.7%)Total
Cost Assumptions:Pipe installed on shoulder of roadTypical residentialAssume HDPE pipe but similar for PVC pipeIncludes taxDoes not include permits, engineering, archaeological review
(these additional items can be 30 40% additional cost)Does not include contingency
Six Inch Pipe Costs JA2816gc.xlsx
CWA E-15
Year Project Name Cost2006 North Whidbey - Bid $34,6522010 North Whidbey - Estimate 27,9402011 North Whidbey - Bid 19,4352013 Camano Island - Bid 23,033
$26,2652,285
28 550T t lSales Tax (8.7%)Average
4-Inch PRV Station (For 6" Main)
(Estimated Useful Life: 35 Years)Island County Budget Construction Cost (2015 Dollars)
28,550$29,000Estimate for Budgeting
Total
Cost Assumptions:Includes taxIncludes some site workDoes not include contingency
Four Inch PRV Costs DE1915gc.xlsx
CWA E-16
CWA 110 kw Genset Cost Est.docx
Camano Water Association 110 KW Generator - Replacement Cost
February 11, 2016
Capacity Purchase Cost (w/ Transfer Switch) Installed Cost
Ratio(Installed Cost vs.
Purchase Cost)
12 KW $3,100.00 $20,000.00 6.5 : 1
38 KW 16,000.00 37,000.00 2.3 : 1
60 KW 20,400.00 52,000.00 2.5 : 1
Use 2.5 : 1 Ratio to Estimate Installation Cost for 110 KW Generator
110 KW 32,200.00 80,500.00 2.5 : 1
Cost Assumptions:Installed and tested, in place, on concrete padIncludes both diesel and propane fueled generatorsIncludes automatic transfer switchIncludes taxIncludes purchase of fuel tankIncludes some site workDoes not include contingency
231 SE Barrington Dr, Suite 205P.O. Box 459Oak Harbor, WA 98277
Tel: 360-279-0615Fax: 360-679-5046
Gregory R. Cane, P.E.
March 9, 2016
Elgerwood Maintenance Association
Re: Central Camano Water SystemsCooperation Study - Report Appendix(Capital Facilities Replacement Review)
Dear Elgerwood Maintenance Association Members: Please find enclosed the DRAFT Capital Facilities Replacement Review for your water system.The purpose of analyses such as this is to use available information to estimate both the total cost, and the annual contribution to the eventual replacement, of all water system components.
I have prepared the analysis based on the records available to me at this time. One reason for this initial draft is to seek refining data (e.g. for Elgerwood, the size and age of the generator). Once the data is refined, the final report can be a very useful tool for the Board of Directors in guiding future decisions relative to assessments for the replacement of the water system’sfacilities (I’ve discussed this further below).
There is one caution that I always make when preparing these analyses, that is, we should bewary of over-refinement. There is no doubt that there could be much fine-tuning on the margins. For example, should the useful life of the storage tank be 40 years, as I have used, or should it be 50 years? Or, should interest / inflation be included in the calculations? Communitiesinvariably determine, even after many tweaks, that the required cost per household per year (as reflected in Column K) is still very high. The lesson, therefore, is not whether the Elgerwood costper household per year should be $2,660.17, or $2,200, or $3,000, but that the replacement cost of the water systems capital facilities is high and should be addressed to the best ability of the Association.
If community members would like to further discuss the results of this review, I would be happy toanswer any questions that may arise. As possible, it would be very helpful if you could forward to me any updates or corrections that you may have by Monday, April 11, 2016.
- - - - -
The notes below discuss the columns in the attached table.
As of April 11, 2016, there was no indication from Elgerwood Maintenance Association that changes to the Capital Facilities Plan are necessary.
Column A This column reflects a summary of the water system components, as reflected on the map included in this report. Water system component sizes, capacities, etc. have been based upon record information and documents. Please review this column and if you find incorrect information, please note it.
Column B
This is an estimate of the replacement cost (construction only) for the various water system components. For the most part, it is based on the budget cost information sheets enclosed herein. For instance, for the 290 square foot pumphouse, it is prudent to budget $670 per square foot for a new pumphouse. This is an all‐inclusive construction cost and takes into account the building, piping, pumps, electrical, control system, etc. The Column B value therefore for the 290 square foot pumphouse is (290 x $670/sq. ft.) = $194,300.
Column C
Recent experience has shown that other (non‐construction) costs for water system projects in Island County can add as much as 35% – 40% on top of construction costs. For this cost analysis, an additional 35% has been used. These additional costs can include engineering, construction management, archaeological / environmental review and mitigation, permitting, attorney’s fees and contingencies. This column reflects the total estimated component replacement costs.
Column D
The review year for this report is 2016.
Column E
Based on available information, the installation year for the noted component is reflected in this column. In some cases, I have estimated the installation year of a component. Please review this column. If your information differs from that included herein, please note this also. Column F
Column D minus Column E.
Column G
The expected life of a component is based upon the table enclosed in this report (Enclosure E-1). This Expected Useful Life table is a summary of fourteen data sources which evaluated the expected life of water system components. In the right hand column of the table, I have suggested an anticipated useful life for the various components.
Column H is the arithmetic difference between the component age and the expected life. As noted herein, the result may not necessarily be meaningful for this cost review. For example, for the well, the years remaining to replacement is a minus 2 years. Clearly, the well is functioning, and will continue to function for some time into the future.
Column I
This column allows the reviewer to use a more reasonable anticipated remaining life value for the various components. Again, considering the well, I have estimated a remaining life of ten years for this component. The values placed within this column will be based upon the reviewer’s knowledge of the condition of the various water system facilities.
Column J
The current number of households (aka, Equivalent Residential Units) connected to the water system.
Column K
This is the amount that each household would need to contribute toward a Capital Facilities Replacement Fund (“Replacement Fund”) each year to provide their share of the cost for the noted component. For example, for the storage tank, each household would need to contribute $187.83 per year for the replacement of this component.
Column L
The noted support documents for your report are included herein, and the location reflected in this column.
Column M Miscellaneous notes, including cost information not reflected elsewhere in the report.
Discussion
Looking at the bottom of Column K, the total required contribution per household of $2,660.17 per year to a Replacement Fund is much more than is typically acceptable to the average homeowner. With the exception of a new water system, I am not aware of any similar analysis which did not result in an uncomfortably high required contribution to a Replacement Fund. Most communities, therefore, do not find it feasible to contribute to a Replacement Fund at the level provided in these analyses.
Having said that, however, one should not cast aside the results of this analysis as it does a reasonably good job of providing a long‐term replacement cost of a community’s water
system. Most communities of which I am aware, have utilized the results of these analyses to increase (or to initiate) contributions to a Replacement Fund. If a given component were to fail and require replacement before there is sufficient money in the Fund, a water system may elect to finance these capital replacements through one of a number of loan programs available.
Sincerely,
Cane Engineering
Gregory R. Cane, P.E.
Encl
Elgerwood Maintenance
A B C D E F G H I J K L M
Water System ComponentReplacement
Cost - Construction
Replacement Cost -Total (1)
ReviewYear
YearInstalled(Approx.)
Component AgeExpected
Life (2)
Years to Replacement(Theoretical)
Years to Replacement (For
Analysis)
Number of Households
Required per Household
per YearEnclosure Notes
Well 1 - 356' Deep, 8" Casing 28,480 38,448 2016 1979 37 35 -2 10 46 83.58 E-2 Est. $80/Ft for New Well See Reference
Well 1 Pump - 5.0 Hp 12,600 17,010 2016 2010 6 15 9 9 46 41.09 E-3 Pump Age is Estimated
Elgerwood Maintenance Assoc. - Capital Facilities Replacement Review - 2016
Notes:(1) Total Cost reflects additional 35% for engineering, archaeological and environmental review / mitigation, permitting, construction administration, attorney's fees and contingencies.(2) See Enclosure E-1.
14 05 T01 Elgerwood Cost Table FE1716bg.xls
Expected Useful Life Table,
Fannie Mae, 2014
TexasCommission on EnvironmentalQuality, 2014
EnvironmentalFinance Center,
New Mexico Tech, 2006
Water Resource Engineering
Linsley/Franzini3rd ed
Illinois Municipal TreasurersAssociation,
Website 2007
IrrigationPractice and Engineering,Early 1900's
Long Term Performance
Prediction of PVC Pipes,
AWWARF, 2005
Drinking Water DistributionSystems,
Assessing and Reduction of
Risks, National AcademiesPress, 2006
EPA, 2005
CorrosionProtection of Ductile Iron
Pipe, Corrpro Companies, Inc.
AssetManagement:
A Handbook for Small Water
Systems, EPA, 2003
EPA Control and Mitigation
of Drinking Water Losses in
DistributionSystems, 2009
JM Eagle Pipe Web Page,
2010
Plastics Pipe Institute Web Page, 2010
USE - First Pass
Water Storage Tank (Generic) 30 50-80 30 30-60Concrete Water Storage Tank 50Steel Water Storage Tank 40 50+
Cane Engineering, 201 a Table - Water System Life .xls
Elgerwood E-1
Water System Components - Expected Useful Life
Project Cost Per Ft
Recent Bid Information 62.48$ Estimate for Budgeting 65.00$
New Drilled Well - Budget Construction Cost
(Estimated Lifespan: 35 years)Island County (2015 Dollars)
Cost Assumptions:6 inch casing
100 ft deepIncludes taxIncludes some site workDoes not include contingency
Well Costs DE1815gc.xlsx
Elgerwood E-2
Use $80/Ft for 8" Well
$10
000
$12,
000
$14,
000
$16,
000
$18,
000
$20,
000
$22,
000
$24,
000
eplacementCostW
ellP
ump
Budg
etRe
plac
emen
tCos
tIs
land
Coun
ty(2
015
Dolla
rs)
Estim
ated
Use
fulL
ife:1
5Ye
ars
$0
$2,0
00
$4,0
00
$6,0
00
$8,0
00
$10,
000
05
1015
2025
30
R
Capa
city
(HP)
Cost
Assu
mpt
ions
:In
clud
esne
wpi
ping
and
wiri
ngIn
clud
esm
inor
wel
lreh
abili
tatio
nIn
clud
esta
xDo
esno
tinc
lude
cont
inge
ncy
Elgerwood E-3
Area (SF) Year Project LocationTotal
Construction Cost
Cost per SF
432 2007 South Whidbey - Bid $208,000 $481
256 2010 North Whidbey - Bid 109,000 426
192 2012 Camano Island - Bid 174,000 906
437 2013 North Whidbey - Bid 212,000 485
620 2015 Camano Island - Bid 481,000 776$615
53
Pumphouse - Budget Construction Cost - Island CountyEstimated Useful Life - Building: 40 years, Electrical: 20 years
(2015 Dollars)
Average Per SFSales Tax (8.7%)
668$670
( )Total
Estimate for Budgeting
Cost Assumptions:All costs in 2015 dollarsIncludes electrical componentsIncludes building and concrete slabIncludes booster pumps and appurtenancesIncludes site pipingIncludes taxIncludes some site work
Pumphouse Costs DE1915gc.xlsx
Elgerwood E-4
20'D
x15
'H20
'Dx
19'H
20'D
x25
'H
30'D
x20
'H
20'
x20
'H
14'D
x50
'H
14'D
x55
'H
20'D
x50
'H
$1.5
0
$2.0
0
$2.5
0
$3.0
0
$3.5
0
CostperGallonRe
serv
oir
Budg
etIn
stal
latio
nCo
stIsl
and
Coun
ty(2
015
Dolla
rs)
(Est
imat
edU
sefu
lLife
:Ye
ars)
Low
Tank
High
Tank
30'D
x20
'H30
'Dx
40'H
$0.0
0
$0.5
0
$1.0
0
020
,000
40,0
0060
,000
80,0
0010
0,00
012
0,00
014
0,00
016
0,00
018
0,00
020
0,00
0
Size
(Gal
lons
)
Cost
Assu
mpt
ions
:Re
info
rced
Conc
rete
Tank
Incl
udes
Pipi
ngU
nder
Tank
Incl
udes
Som
eSi
tePr
epar
atio
nIn
clud
esTa
xDo
esN
otIn
clud
eCo
ntin
genc
y(N
ote:
High
Tank
>32'
H)
Elgerwood E-5
2,00
0
2,25
0
2,50
0
2,75
0
Pergpm(2015$)
Fe/M
n/As
RemovalTreatm
ent
Budget
CostInform
ationforIslan
dCo
unty
(201
5Do
llars)
(DesignFlow
Less
Than
100gpm)
USEPA
2015
CostEvalua
tion:
Includ
esEq
uipm
ent,Installatio
n,Pu
mph
ouse,
Engine
eringan
dPe
rmits
.
1,25
0
1,50
0
1,75
0
1020
3040
5060
7080
9010
0
CostP
Design
Flow
Rate
gpmU
seforIslan
dCo
unty
for
2050
gpm.Treatmen
tSystem
Equipm
enta
ndInstallatio
nOnly.
Elgerwood E-6
Description Unit Quantity Unit Price TotalMobilization LS 1 10,000.00 $10,000.00Removal of Structure & Obstruction LS 1 5,000.00 5,000.006-Inch HDPE Pipe LF 1,000 28.00 28,000.006-Inch Gate Valve EA. 2 900.00 1,800.006-Inch Tees, Bends & Fittings EA. 4 500.00 2,000.006 Inch Hydrant Assembly EA. 1 3,700.00 3,700.00Air Vacuum Valve Assembly EA. 1 1,900.00 1,900.00Single Service - Near Side EA. 10 900.00 9,000.00Single Service - Far Side EA. 10 1,800.00 18,000.00Connect Main to Existing System EA. 2 1,800.00 3,600.00Crushed Surfacing TN 75 32.00 2,400.00Commercial HMA - Pavement Patch TN 10 275.00 2,750.00Topsoil / Bark Mulch CY 20 45.00 900.00
6-Inch HDPE PipingPreliminary Cost Estimate: Installation Per Typical 1,000 FT
Distribution System Piping - Budget Construction Cost - Island CountyHDPE with Meters and Appurtenances
(Estimated Useful Life: 75 years)(2015 Dollars)
Corrugated Polyethylene Culv. Pipe 12 Inc. Diam. LF 60 22.00 1,320.00Project Temporary Traffic Control LS 1 500.00 500.00Select Gravel Backfill TN 300 15.00 4,500.00
$95,370.008,297.19
$103,667.19$103.67$105.00
Estimated Price Per LFEstimate Per LF For Budgeting
Sub-TotalSales Tax (8.7%)Total
Cost Assumptions:Pipe installed on shoulder of roadTypical residentialAssume HDPE pipe but similar for PVC pipeIncludes taxDoes not include permits, engineering, archaeological review
(these additional items can be 30 40% additional cost)Does not include contingency
231 SE Barrington Dr, Suite 205P.O. Box 459Oak Harbor, WA 98277
Tel: 360-279-0615Fax: 360-679-5046
Gregory R. Cane, P.E.
March 8, 2016
Mecca Community Association
Re: Central Camano Water SystemsCooperation Study - Report Appendix(Capital Facilities Replacement Review)
Dear Mecca Community Association Members: Please find enclosed the DRAFT Capital Facilities Replacement Review for your water system.The purpose of analyses such as this is to use available information to estimate both the total cost, and the annual contribution to the eventual replacement, of all water system components.
I have prepared the analysis based on the records available to me at this time. One reason for this initial draft is to seek refining data (e.g. for the Mecca Community Assn., the age and length of the chain link fence). Once the data is refined, the final report can be a very useful tool for the Board of Directors in guiding future decisions relative to assessments for the replacement of thewater system’s facilities (I’ve discussed this further below).
There is one caution that I always make when preparing these analyses, that is, we should bewary of over-refinement. There is no doubt that there could be much fine-tuning on the margins. For example, should the useful life of the storage tank be 40 years, as I have used, or should it be 50 years? Or, should interest / inflation be included in the calculations? Communitiesinvariably determine, even after many tweaks, that the required cost per household per year (as reflected in Column K) is still very high. The lesson, therefore, is not whether the Mecca cost per household per year should be $1,439.39, or $1,200, or $1,600, but that the replacement cost of the water systems capital facilities is high and should be addressed to the best ability of the Association.
If community members would like to further discuss the results of this review, I would be happy toanswer any questions that may arise. As possible, it would be very helpful if you could forward to me any updates or corrections that you may have by Monday, April 11, 2016.
- - - - -
The notes below discuss the columns in the attached table.
As of April 11, 2016, there was no indication from Mecca Community Association that changes to the Capital Facilites Plan are necessary.
Column A This column reflects a summary of the water system components, as reflected on the map included in this report. Water system component sizes, capacities, etc. have been based upon record information and documents. Please review this column and if you find incorrect information, please note it.
Column B
This is an estimate of the replacement cost (construction only) for the various water system components. For the most part, it is based on the budget cost information sheets enclosed herein. For instance, for the 245 square foot pumphouse it is prudent to budget $670 per square foot for a new pumphouse. This is an all‐inclusive construction cost and takes into account the building, piping, pumps, electrical, control system, etc. The Column B value therefore for the 245 square foot pumphouse is (245 x $670/sq. ft.) = $164,150.
Column C
Recent experience has shown that other (non‐construction) costs for water system projects in Island County can add as much as 35% – 40% on top of construction costs. For this cost analysis, an additional 35% has been used. These additional costs can include engineering, construction management, archaeological / environmental review and mitigation, permitting, attorney’s fees and contingencies. This column reflects the total estimated component replacement costs.
Column D
The review year for this report is 2016.
Column E
Based on available information, the installation year for the noted component is reflected in this column. In some cases, I have estimated the installation year of a component. Please review this column. If your information differs from that included herein, please note this also. Column F
Column D minus Column E.
Column G
The expected life of a component is based upon the table enclosed in this report (Enclosure E-1). This Expected Useful Life table is a summary of fourteen data sources which evaluated
the expected life of water system components. In the right hand column of the table, I have suggested an anticipated useful life for the various components.
Column H
Column H is the arithmetic difference between the component age and the expected life. As noted herein, the result may not necessarily be meaningful for this cost review. For example, for the well, the years remaining to replacement is a minus 13 years. Clearly, the well is functioning, and will continue to function for some time into the future.
Column I
This column allows the reviewer to use a more reasonable anticipated remaining life value for the various components. Again, considering the well, I have estimated a remaining life of ten years for this component. The values placed within this column will be based upon the reviewer’s knowledge of the condition of the various water system facilities.
Column J
The current number of households (aka, Equivalent Residential Units) connected to the water system.
Column K
This is the amount that each household would need to contribute toward a Capital Facilities Replacement Fund (“Replacement Fund”) each year to provide their share of the cost for the noted component. For example, for the storage tank, each household would need to contribute $270.47 per year for the replacement of this component.
Column L
The noted support documents for your report are included herein, and the location reflected in this column.
Column M Miscellaneous notes, including cost information not reflected elsewhere in the report.
Discussion
Looking at the bottom of Column K, the total required contribution per household of $1,439.39 per year to a Replacement Fund is much more than is typically acceptable to the average homeowner. With the exception of a new water system, I am not aware of any similar analysis which did not result in an uncomfortably high required contribution to a Replacement Fund. Most communities, therefore, do not find it feasible to contribute to a Replacement
Having said that, however, one should not cast aside the results of this analysis as it does a reasonably good job of providing a long‐term replacement cost of a community’s water system. Most communities of which I am aware, have utilized the results of these analyses to increase (or to initiate) contributions to a Replacement Fund. If a given component were to fail and require replacement before there is sufficient money in the Fund, a water system may elect to finance these capital replacements through one of a number of loan programs available.
Mecca Community Assoc. - Capital Facilities Replacement Review - 2016
Notes:(1) Total Cost reflects additional 35% for engineering, archaeological and environmental review / mitigation, permitting, construction administration, attorney's fees and contingencies.(2) See Enclosure E-1.
Expected Useful Life Table,
Fannie Mae, 2014
TexasCommission on EnvironmentalQuality, 2014
EnvironmentalFinance Center,
New Mexico Tech, 2006
Water Resource Engineering
Linsley/Franzini3rd ed
Illinois Municipal TreasurersAssociation,
Website 2007
IrrigationPractice and Engineering,Early 1900's
Long Term Performance
Prediction of PVC Pipes,
AWWARF, 2005
Drinking Water DistributionSystems,
Assessing and Reduction of
Risks, National AcademiesPress, 2006
EPA, 2005
CorrosionProtection of Ductile Iron
Pipe, Corrpro Companies, Inc.
AssetManagement:
A Handbook for Small Water
Systems, EPA, 2003
EPA Control and Mitigation
of Drinking Water Losses in
DistributionSystems, 2009
JM Eagle Pipe Web Page,
2010
Plastics Pipe Institute Web Page, 2010
USE - First Pass
Water Storage Tank (Generic) 30 50-80 30 30-60Concrete Water Storage Tank 50Steel Water Storage Tank 40 50+
Cane Engineering, 201 a Table - Water System Life .xls
Mecca E-1
Water System Components - Expected Useful Life
Project Cost Per Ft
Recent Bid Information 62.48$ Estimate for Budgeting 65.00$
New Drilled Well - Budget Construction Cost
(Estimated Lifespan: 35 years)Island County (2015 Dollars)
Cost Assumptions:6 inch casing
100 ft deepIncludes taxIncludes some site workDoes not include contingency
Well Costs DE1815gc.xlsx
Mecca E-2
$10
000
$12,
000
$14,
000
$16,
000
$18,
000
$20,
000
$22,
000
$24,
000
eplacementCostW
ellP
ump
Budg
etRe
plac
emen
tCos
tIs
land
Coun
ty(2
015
Dolla
rs)
Estim
ated
Use
fulL
ife:1
5Ye
ars
$0
$2,0
00
$4,0
00
$6,0
00
$8,0
00
$10,
000
05
1015
2025
30
R
Capa
city
(HP)
Cost
Assu
mpt
ions
:In
clud
esne
wpi
ping
and
wiri
ngIn
clud
esm
inor
wel
lreh
abili
tatio
nIn
clud
esta
xDo
esno
tinc
lude
cont
inge
ncy
Mecca E-3
Area (SF) Year Project LocationTotal
Construction Cost
Cost per SF
432 2007 South Whidbey - Bid $208,000 $481
256 2010 North Whidbey - Bid 109,000 426
192 2012 Camano Island - Bid 174,000 906
437 2013 North Whidbey - Bid 212,000 485
620 2015 Camano Island - Bid 481,000 776$615
53
Pumphouse - Budget Construction Cost - Island CountyEstimated Useful Life - Building: 40 years, Electrical: 20 years
(2015 Dollars)
Average Per SFSales Tax (8.7%)
668$670
( )Total
Estimate for Budgeting
Cost Assumptions:All costs in 2015 dollarsIncludes electrical componentsIncludes building and concrete slabIncludes booster pumps and appurtenancesIncludes site pipingIncludes taxIncludes some site work
Pumphouse Costs DE1915gc.xlsx
Mecca E-4
$30
$35
$40
$45
$50
placementCost/FtCh
ain
Link
Fenc
eBu
dget
Repl
acem
entC
ost
Isla
ndCo
unty
(201
5Do
llars
)Es
timat
edU
sefu
lLife
:40
Year
s
$15
$20
$25
$30
100
150
200
250
300
350
400
450
500
Rep
Fenc
eLe
ngth
(Ft)
Cost
Assu
mpt
ions
:6
FtHi
ghFe
nce
Incl
udes
Barb
edW
ireAt
opIn
clud
esG
ate(
s)In
clud
esSo
me
Site
Prep
arat
ion
Incl
udes
Tax
Does
Not
Incl
ude
Cont
inge
ncy
Mecca E-5
20'D
x15
'H20
'Dx
19'H
20'D
x25
'H
30'D
x20
'H
20'
x20
'H
14'D
x50
'H
14'D
x55
'H
20'D
x50
'H
$1.5
0
$2.0
0
$2.5
0
$3.0
0
$3.5
0
CostperGallonRe
serv
oir
Budg
etIn
stal
latio
nCo
stIsl
and
Coun
ty(2
015
Dolla
rs)
(Est
imat
edU
sefu
lLife
:Ye
ars)
Low
Tank
High
Tank
30'D
x20
'H30
'Dx
40'H
$0.0
0
$0.5
0
$1.0
0
020
,000
40,0
0060
,000
80,0
0010
0,00
012
0,00
014
0,00
016
0,00
018
0,00
020
0,00
0
Size
(Gal
lons
)
Cost
Assu
mpt
ions
:Re
info
rced
Conc
rete
Tank
Incl
udes
Pipi
ngU
nder
Tank
Incl
udes
Som
eSi
tePr
epar
atio
nIn
clud
esTa
xDo
esN
otIn
clud
eCo
ntin
genc
y(N
ote:
High
Tank
>32'
H)
Mecca E-6
Description Unit Quantity Unit Price TotalMobilization LS 1 11,000.00 $11,000.00Removal of Structure & Obstruction LS 1 5,000.00 5,000.008-Inch HDPE Pipe LF 1,000 36.00 36,000.008-Inch Gate Valve EA. 2 1,400.00 2,800.008-Inch Tees, Bends & Fittings EA. 4 500.00 2,000.006 Inch Hydrant Assembly EA. 1 3,700.00 3,700.00Air Vacuum Valve Assembly EA. 1 1,900.00 1,900.00Single Service - Near Side EA. 10 900.00 9,000.00Single Service - Far Side EA. 10 1,800.00 18,000.00Connect Main to Existing System EA. 2 1,800.00 3,600.00Crushed Surfacing TN 75 32.00 2,400.00Commercial HMA - Pavement Patch TN 10 275.00 2,750.00Topsoil / Bark Mulch CY 20 45.00 900.00
8-Inch HDPE PipingPreliminary Cost Estimate: Installation Per Typical 1,000 FT
Distribution System Piping - Budget Construction Cost - Island CountyHDPE with Meters and Appurtenances
(Estimated Useful Life: 75 years)(2015 Dollars)
Corrugated Polyethylene Culv. Pipe 12 Inc. Diam. LF 60 22.00 1,320.00Project Temporary Traffic Control LS 1 500.00 500.00Select Gravel Backfill TN 300 15.00 4,500.00
$105,370.009,167.19
$114,537.19$114.54$115.00
Estimated Price Per LFEstimate Per LF For Budgeting
Sub-TotalSales Tax (8.7%)Total
Cost Assumptions:Pipe installed on shoulder of roadTypical residentialAssume HDPE pipe but similar for PVC pipeIncludes taxDoes not include permits, engineering, archaeological review
(these additional items can be 30 40% additional cost)Does not include contingency
Eight Inch Pipe Costs JA2816gc.xlsx
Mecca E-7
Description Unit Quantity Unit Price TotalMobilization LS 1 10,000.00 $10,000.00Removal of Structure & Obstruction LS 1 5,000.00 5,000.006-Inch HDPE Pipe LF 1,000 28.00 28,000.006-Inch Gate Valve EA. 2 900.00 1,800.006-Inch Tees, Bends & Fittings EA. 4 500.00 2,000.006 Inch Hydrant Assembly EA. 1 3,700.00 3,700.00Air Vacuum Valve Assembly EA. 1 1,900.00 1,900.00Single Service - Near Side EA. 10 900.00 9,000.00Single Service - Far Side EA. 10 1,800.00 18,000.00Connect Main to Existing System EA. 2 1,800.00 3,600.00Crushed Surfacing TN 75 32.00 2,400.00Commercial HMA - Pavement Patch TN 10 275.00 2,750.00Topsoil / Bark Mulch CY 20 45.00 900.00
6-Inch HDPE PipingPreliminary Cost Estimate: Installation Per Typical 1,000 FT
Distribution System Piping - Budget Construction Cost - Island CountyHDPE with Meters and Appurtenances
(Estimated Useful Life: 75 years)(2015 Dollars)
Corrugated Polyethylene Culv. Pipe 12 Inc. Diam. LF 60 22.00 1,320.00Project Temporary Traffic Control LS 1 500.00 500.00Select Gravel Backfill TN 300 15.00 4,500.00
$95,370.008,297.19
$103,667.19$103.67$105.00
Estimated Price Per LFEstimate Per LF For Budgeting
Sub-TotalSales Tax (8.7%)Total
Cost Assumptions:Pipe installed on shoulder of roadTypical residentialAssume HDPE pipe but similar for PVC pipeIncludes taxDoes not include permits, engineering, archaeological review
(these additional items can be 30 40% additional cost)Does not include contingency
231 SE Barrington Dr, Suite 205P.O. Box 459Oak Harbor, WA 98277
Tel: 360-279-0615Fax: 360-679-5046
Gregory R. Cane, P.E.
March 8, 2016
Seascape Water Association
Re: Central Camano Water SystemsCooperation Study - Report Appendix(Capital Facilities Replacement Review)
Dear Seascape Water Association Members: Please find enclosed the DRAFT Capital Facilities Replacement Review for your water system.The purpose of analyses such as this is to use available information to estimate both the total cost, and the annual contribution to the eventual replacement, of all water system components.
I have prepared the analysis based on the records available to me at this time. One reason for this initial draft is to seek refining data (e.g. for the Seascape Water Assn., the size and age of the well pump). Once the data is refined, the final report can be a very useful tool for the Board of Directors in guiding future decisions relative to assessments for the replacement of the water system’s facilities (I’ve discussed this further below).
There is one caution that I always make when preparing these analyses, that is, we should bewary of over-refinement. There is no doubt that there could be much fine-tuning on the margins. For example, should the useful life of the storage tank be 40 years, as I have used, or should it be 50 years? Or, should interest / inflation be included in the calculations? Communitiesinvariably determine, even after many tweaks, that the required cost per household per year (as reflected in Column K) is still very high. The lesson, therefore, is not whether the Seascape costper household per year should be $1,589.36, or $1,200, or $1,800, but that the replacement cost of the water systems capital facilities is high and should be addressed to the best ability of the Association.
If community members would like to further discuss the results of this review, I would be happy toanswer any questions that may arise. As possible, it would be very helpful if you could forward to me any updates or corrections that you may have by Monday, April 11, 2016.
- - - - -
The notes below discuss the columns in the attached table.
As of April 11, 2016, there was no indication from Seascape Water Association that changes to the Capital Facilities Plan are necessary.
Column A This column reflects a summary of the water system components, as reflected on the map included in this report. Water system component sizes, capacities, etc. have been based upon record information and documents. Please review this column and if you find incorrect information, please note it.
Column B
This is an estimate of the replacement cost (construction only) for the various water system components. For the most part, it is based on the budget cost information sheets enclosed herein. For instance, for the 320 square foot pumphouse, it is prudent to budget $670 per square foot for a new pumphouse. This is an all‐inclusive construction cost and takes into account the building, piping, pumps, electrical, control system, etc. The Column B value therefore for the 320 square foot pumphouse is (320 x $670/sq. ft.) = $214,400.
Column C
Recent experience has shown that other (non‐construction) costs for water system projects in Island County can add as much as 35% – 40% on top of construction costs. For this cost analysis, an additional 35% has been used. These additional costs can include engineering, construction management, archaeological / environmental review and mitigation, permitting, attorney’s fees and contingencies. This column reflects the total estimated component replacement costs.
Column D
The review year for this report is 2016.
Column E
Based on available information, the installation year for the noted component is reflected in this column. In some cases, I have estimated the installation year of a component. Please review this column. If your information differs from that included herein, please note this also. Column F
Column D minus Column E.
Column G
The expected life of a component is based upon the table enclosed in this report (Enclosure E-1). This Expected Useful Life table is a summary of fourteen data sources which evaluated the expected life of water system components. In the right hand column of the table, I have suggested an anticipated useful life for the various components.
Column H is the arithmetic difference between the component age and the expected life.
Column I
This column allows the reviewer to use a more reasonable anticipated remaining life value for the various components, if the value in Column H is unreasonably low (For older water systems some components may have a negative useful life in Column H). The values placed within this column will be based upon the reviewer’s knowledge of the condition of the various water system facilities.
Column J
The current number of households (aka, Equivalent Residential Units) connected to the water system.
Column K
This is the amount that each household would need to contribute toward a Capital Facilities Replacement Fund (“Replacement Fund”) each year to provide their share of the cost for the noted component. For example, for the storage tank, each household would need to contribute $339.82 per year for the replacement of this component.
Column L
The noted support documents for your report are included herein, and the location reflected in this column.
Column M Miscellaneous notes, including cost information not reflected elsewhere in the report.
Discussion
Looking at the bottom of Column K, the total required contribution per household of $1,589.36 per year to a Replacement Fund is much more than is typically acceptable to the average homeowner. With the exception of a new water system, I am not aware of any similar analysis which did not result in an uncomfortably high required contribution to a Replacement Fund. Most communities, therefore, do not find it feasible to contribute to a Replacement Fund at the level provided in these analyses.
Having said that, however, one should not cast aside the results of this analysis as it does a reasonably good job of providing a long‐term replacement cost of a community’s water system. Most communities of which I am aware, have utilized the results of these analyses to increase (or to initiate) contributions to a Replacement Fund. If a given component were
to fail and require replacement before there is sufficient money in the Fund, a water system may elect to finance these capital replacements through one of a number of loan programs available.
2" PVC Pipe - 500 LF 32,500 43,875 2016 1999 17 75 58 58 24 31.52 Replacement for all Pipes, 2" and Smaller; Use $65 / LF
Totals $982,575 $1,326,476 $1,589.36
Seascape Water Assoc. - Capital Facilities Replacement Review - 2016
Notes:
(2) See Enclosure E-1.(1) Total Cost reflects additional 35% for engineering, archaeological and environmental review / mitigation, permitting, construction administration, attorney's fees and contingencies.
14 05 T01 Seascape Cost Table FE1716bg.xls
Expected Useful Life Table,
Fannie Mae, 2014
TexasCommission on EnvironmentalQuality, 2014
EnvironmentalFinance Center,
New Mexico Tech, 2006
Water Resource Engineering
Linsley/Franzini3rd ed
Illinois Municipal TreasurersAssociation,
Website 2007
IrrigationPractice and Engineering,Early 1900's
Long Term Performance
Prediction of PVC Pipes,
AWWARF, 2005
Drinking Water DistributionSystems,
Assessing and Reduction of
Risks, National AcademiesPress, 2006
EPA, 2005
CorrosionProtection of Ductile Iron
Pipe, Corrpro Companies, Inc.
AssetManagement:
A Handbook for Small Water
Systems, EPA, 2003
EPA Control and Mitigation
of Drinking Water Losses in
DistributionSystems, 2009
JM Eagle Pipe Web Page,
2010
Plastics Pipe Institute Web Page, 2010
USE - First Pass
Water Storage Tank (Generic) 30 50-80 30 30-60Concrete Water Storage Tank 50Steel Water Storage Tank 40 50+
Cane Engineering, 201 a Table - Water System Life .xls
Seascape E-1
Water System Components - Expected Useful Life
Project Cost Per Ft
Recent Bid Information 62.48$ Estimate for Budgeting 65.00$
New Drilled Well - Budget Construction Cost
(Estimated Lifespan: 35 years)Island County (2015 Dollars)
Cost Assumptions:6 inch casing
100 ft deepIncludes taxIncludes some site workDoes not include contingency
Well Costs DE1815gc.xlsx
Seascape E-2
$10
000
$12,
000
$14,
000
$16,
000
$18,
000
$20,
000
$22,
000
$24,
000
eplacementCostW
ellP
ump
Budg
etRe
plac
emen
tCos
tIs
land
Coun
ty(2
015
Dolla
rs)
Estim
ated
Use
fulL
ife:1
5Ye
ars
$0
$2,0
00
$4,0
00
$6,0
00
$8,0
00
$10,
000
05
1015
2025
30
R
Capa
city
(HP)
Cost
Assu
mpt
ions
:In
clud
esne
wpi
ping
and
wiri
ngIn
clud
esm
inor
wel
lreh
abili
tatio
nIn
clud
esta
xDo
esno
tinc
lude
cont
inge
ncy
Seascape E-3
Area (SF) Year Project LocationTotal
Construction Cost
Cost per SF
432 2007 South Whidbey - Bid $208,000 $481
256 2010 North Whidbey - Bid 109,000 426
192 2012 Camano Island - Bid 174,000 906
437 2013 North Whidbey - Bid 212,000 485
620 2015 Camano Island - Bid 481,000 776$615
53
Pumphouse - Budget Construction Cost - Island CountyEstimated Useful Life - Building: 40 years, Electrical: 20 years
(2015 Dollars)
Average Per SFSales Tax (8.7%)
668$670
( )Total
Estimate for Budgeting
Cost Assumptions:All costs in 2015 dollarsIncludes electrical componentsIncludes building and concrete slabIncludes booster pumps and appurtenancesIncludes site pipingIncludes taxIncludes some site work
Pumphouse Costs DE1915gc.xlsx
Seascape E-4
$30
$35
$40
$45
$50
placementCost/FtCh
ain
Link
Fenc
eBu
dget
Repl
acem
entC
ost
Isla
ndCo
unty
(201
5Do
llars
)Es
timat
edU
sefu
lLife
:40
Year
s
$15
$20
$25
$30
100
150
200
250
300
350
400
450
500
Rep
Fenc
eLe
ngth
(Ft)
Cost
Assu
mpt
ions
:6
FtHi
ghFe
nce
Incl
udes
Barb
edW
ireAt
opIn
clud
esG
ate(
s)In
clud
esSo
me
Site
Prep
arat
ion
Incl
udes
Tax
Does
Not
Incl
ude
Cont
inge
ncy
Seascape E-5
Sea
scap
e:
Use
$22
/Lf f
or
Rep
lace
men
t
20'
x15
'H20
'Dx
19'H
20'D
x25
'H
30'D
x20
'H
20'
x20
'H
14'D
x50
'H
14'D
x55
'H
20'D
x50
'H
$1.5
0
$2.0
0
$2.5
0
$3.0
0
$3.5
0
CostperGallonRe
serv
oir
Budg
etIn
stal
latio
nCo
stIsl
and
Coun
ty(2
015
Dolla
rs)
(Est
imat
edU
sefu
lLife
:Ye
ars)
Low
Tank
High
Tank
30'D
x20
'H30
'Dx
40'H
$0.0
0
$0.5
0
$1.0
0
020
,000
40,0
0060
,000
80,0
0010
0,00
012
0,00
014
0,00
016
0,00
018
0,00
020
0,00
0
Size
(Gal
lons
)
Cost
Assu
mpt
ions
:Re
info
rced
Conc
rete
Tank
Incl
udes
Pipi
ngU
nder
Tank
Incl
udes
Som
eSi
tePr
epar
atio
nIn
clud
esTa
xDo
esN
otIn
clud
eCo
ntin
genc
y(N
ote:
High
Tank
>32'
H)
Seascape E-6
Description Unit Quantity Unit Price TotalMobilization LS 1 10,000.00 $10,000.00Removal of Structure & Obstruction LS 1 5,000.00 5,000.006 Inch HDPE Pipe LF 1,000 28.00 28,000.006-Inch Gate Valve EA. 2 900.00 1,800.006-Inch Tees, Bends & Fittings EA. 4 500.00 2,000.006 Inch Hydrant Assembly EA. 1 3,700.00 3,700.00Air Vacuum Valve Assembly EA. 1 1,900.00 1,900.00Single Service - Near Side EA. 10 900.00 9,000.00Single Service - Far Side EA. 10 1,800.00 18,000.00Connect Main to Existing System EA. 2 1,800.00 3,600.00Crushed Surfacing TN 75 32.00 2,400.00Commercial HMA - Pavement Patch TN 10 275.00 2,750.00Topsoil / Bark Mulch CY 20 45.00 900.00
6-Inch HDPE PipingPreliminary Cost Estimate: Installation Per Typical 1,000 FT
Distribution System Piping - Budget Construction Cost - Island CountyHDPE with Meters and Appurtenances
(Estimated Useful Life: 65 years)
Corrugated Polyethylene Culv. Pipe 12 Inc. Diam. LF 60 22.00 1,320.00Project Temporary Traffic Control LS 1 500.00 500.00Select Gravel Backfill TN 300 15.00 4,500.00
$95,370.008,297.19
$103,667.19$103.67$105.00
Estimated Price Per LFEstimate Per LF For Budgeting
Sub-TotalSales Tax (8.7%)Total
Cost Assumptions:Pipe installed on shoulder of roadTypical residentialAssume HDPE pipe but similar for PVC pipeIncludes taxDoes not include permits, engineering, archaeological review
(these additional items can be 30 40% additional cost)Does not include contingency
231 SE Barrington Dr, Suite 205P.O. Box 459Oak Harbor, WA 98277
Tel: 360-279-0615Fax: 360-679-5046
Gregory R. Cane, P.E.
March 9, 2016
Thunder Ridge Water System
Re: Central Camano Water SystemsCooperation Study - Report Appendix(Capital Facilities Replacement Review)
Dear Thunder Ridge Water System: Please find enclosed the DRAFT Capital Facilities Replacement Review for your water system.The purpose of analyses such as this is to use available information to estimate both the total cost, and the annual contribution to the eventual replacement, of all water system components.
I have prepared the analysis based on the records available to me at this time. One reason for this initial draft is to seek refining data (e.g. for Thunder Ridge, the age of the well pump). Once the data is refined, the final report can be a very useful tool for the Water System Owners in guiding future decisions relative to assessments for the replacement of the water system’s facilities (I’ve discussed this further below).
There is one caution that I always make when preparing these analyses, that is, we should be wary of over-refinement. There is no doubt that there could be much fine-tuning on the margins. For example, should the useful life of the storage tank be 40 years, as I have used, or should it be 50 years? Or, should interest / inflation be included in the calculations? Communities invariably determine, even after many tweaks, that the required cost per household per year (as reflected in Column K) is still very high. The lesson, therefore, is not whether the Thunder Ridge cost per household per year should be $684.33, or $600, or $800, but that the replacement cost of the water systems capital facilities is high and should be addressed to the best ability of your organization.
If you would like to further discuss the results of this review, I would be happy to answer any questions that may arise. As possible, it would be very helpful if you could forward to me any updates or corrections that you may have by Monday, April 11, 2016.
- - - - -
The notes below discuss the columns in the attached table.
As of April 11, 2016, there was no indication from Thunder Ridge Water System that changes to the Capital Facilities Plan are necessary.
This column reflects a summary of the water system components. Water system component sizes, capacities, age, etc. have been based upon record information and documents. Please review this column and if you find incorrect information, please note it.
Column B
This is an estimate of the replacement cost (construction only) for the various water system components. For the most part, it is based on the budget cost information sheets enclosed herein. For instance, for the 350 square foot pumphouse, it is prudent to budget $670 per square foot for a new pumphouse. This is an all‐inclusive construction cost and takes into account the building, piping, pumps, electrical, control system, etc. The Column B value therefore for the 350 square foot pumphouse is (350 x $670/sq. ft.) = $234,500.
Column C
Recent experience has shown that other (non‐construction) costs for water system projects in Island County can add as much as 35% – 40% on top of construction costs. For this cost analysis, an additional 35% has been used. These additional costs can include engineering, construction management, archaeological / environmental review and mitigation, permitting, attorney’s fees and contingencies. This column reflects the total estimated component replacement costs.
Column D
The review year for this report is 2016.
Column E
Based on available information, the installation year for the noted component is reflected in this column. In some cases, I have estimated the installation year of a component. Please review this column. If your information differs from that included herein, please note this also. Column F
Column D minus Column E.
Column G
The expected life of a component is based upon the table enclosed in this report (Enclosure E-1). This Expected Useful Life table is a summary of fourteen data sources which evaluated
the expected life of water system components. In the right hand column of the table, I have suggested an anticipated useful life for the various components. Column H
Column H is the arithmetic difference between the component age and the expected life. As noted herein, the result may not necessarily be meaningful for this cost review. For example, for the well pump, the time remaining to replacement is 1 year. The well pump is functioning, and will likely continue to function for some time into the future.
Column I
This column allows the reviewer to use a more reasonable anticipated remaining life value for the various components. Again, considering the well pump, I have estimated a remaining life of five years for this component. The values placed within this column will be based upon the reviewer’s knowledge of the condition of the various water system facilities.
Column J
The current number of households (aka, Equivalent Residential Units) connected to the water system.
Column K
This is the amount that each household would need to contribute toward a Capital Facilities Replacement Fund (“Replacement Fund”) each year to provide their share of the cost for the noted component. For example, for Storage Tank 1, each household would need to contribute $53.73 per year for the replacement of this component.
Column L
The noted support documents for your report are included herein, and the location reflected in this column.
Column M Miscellaneous notes, including cost information not reflected elsewhere in the report.
Discussion
Looking at the bottom of Column K, the total required contribution per household of $684.33 per year to a Replacement Fund is much more than is typically acceptable to the average homeowner. With the exception of a new water system, I am not aware of any similar analysis which did not result in an uncomfortably high required contribution to a Replacement Fund. Most communities, therefore, do not find it feasible to contribute to a Replacement Fund at
Having said that, however, one should not cast aside the results of this analysis as it does a reasonably good job of providing a long‐term replacement cost of a community’s water system. Most communities of which I am aware, have utilized the results of these analyses to increase (or to initiate) contributions to a Replacement Fund. If a given component were to fail and require replacement before there is sufficient money in the Fund, a water system may elect to finance these capital replacements through one of a number of loan programs available.
Thunder Ridge Water System. - Capital Facilities Replacement Review - 2016
Notes:(1) Total Cost reflects additional 35% for engineering, archaeological and environmental review / mitigation, permitting, construction administration, attorney's fees and contingencies.(2) See Enclosure E-1.
Expected Useful Life Table,
Fannie Mae, 2014
TexasCommission on EnvironmentalQuality, 2014
EnvironmentalFinance Center,
New Mexico Tech, 2006
Water Resource Engineering
Linsley/Franzini3rd ed
Illinois Municipal TreasurersAssociation,
Website 2007
IrrigationPractice and Engineering,Early 1900's
Long Term Performance
Prediction of PVC Pipes,
AWWARF, 2005
Drinking Water DistributionSystems,
Assessing and Reduction of
Risks, National AcademiesPress, 2006
EPA, 2005
CorrosionProtection of Ductile Iron
Pipe, Corrpro Companies, Inc.
AssetManagement:
A Handbook for Small Water
Systems, EPA, 2003
EPA Control and Mitigation
of Drinking Water Losses in
DistributionSystems, 2009
JM Eagle Pipe Web Page,
2010
Plastics Pipe Institute Web Page, 2010
USE - First Pass
Water Storage Tank (Generic) 30 50-80 30 30-60Concrete Water Storage Tank 50Steel Water Storage Tank 40 50+
Cane Engineering, 201 a Table - Water System Life .xls
ThunderRidge E-1
Water System Components - Expected Useful Life
Project Cost Per Ft
Recent Bid Information 62.48$ Estimate for Budgeting 65.00$
New Drilled Well - Budget Construction Cost
(Estimated Lifespan: 35 years)Island County (2015 Dollars)
Cost Assumptions:6 inch casing
100 ft deepIncludes taxIncludes some site workDoes not include contingency
Well Costs DE1815gc.xlsx
ThunderRidge E-2
$10
000
$12,
000
$14,
000
$16,
000
$18,
000
$20,
000
$22,
000
$24,
000
eplacementCostW
ellP
ump
Budg
etRe
plac
emen
tCos
tIs
land
Coun
ty(2
015
Dolla
rs)
Estim
ated
Use
fulL
ife:1
5Ye
ars
$0
$2,0
00
$4,0
00
$6,0
00
$8,0
00
$10,
000
05
1015
2025
30
R
Capa
city
(HP)
Cost
Assu
mpt
ions
:In
clud
esne
wpi
ping
and
wiri
ngIn
clud
esm
inor
wel
lreh
abili
tatio
nIn
clud
esta
xDo
esno
tinc
lude
cont
inge
ncy
ThunderRidge E-3
Area (SF) Year Project LocationTotal
Construction Cost
Cost per SF
432 2007 South Whidbey - Bid $208,000 $481
256 2010 North Whidbey - Bid 109,000 426
192 2012 Camano Island - Bid 174,000 906
437 2013 North Whidbey - Bid 212,000 485
620 2015 Camano Island - Bid 481,000 776$615
53
Pumphouse - Budget Construction Cost - Island CountyEstimated Useful Life - Building: 40 years, Electrical: 20 years
(2015 Dollars)
Average Per SFSales Tax (8.7%)
668$670
( )Total
Estimate for Budgeting
Cost Assumptions:All costs in 2015 dollarsIncludes electrical componentsIncludes building and concrete slabIncludes booster pumps and appurtenancesIncludes site pipingIncludes taxIncludes some site work
Pumphouse Costs DE1915gc.xlsx
ThunderRidge E-4
$30
$35
$40
$45
$50
placementCost/FtCh
ain
Link
Fenc
eBu
dget
Repl
acem
entC
ost
Isla
ndCo
unty
(201
5Do
llars
)Es
timat
edU
sefu
lLife
:40
Year
s
$15
$20
$25
$30
100
150
200
250
300
350
400
450
500
Rep
Fenc
eLe
ngth
(Ft)
Cost
Assu
mpt
ions
:6
FtHi
ghFe
nce
Incl
udes
Barb
edW
ireAt
opIn
clud
esG
ate(
s)In
clud
esSo
me
Site
Prep
arat
ion
Incl
udes
Tax
Does
Not
Incl
ude
Cont
inge
ncy
ThunderRidge E-5
Thun
der R
idge
: U
se $
23/L
f for
R
epla
cem
ent
20'D
x15
'H20
'Dx
19'H
20'D
x25
'H
30'D
x20
'H
20'
x20
'H
14'D
x50
'H
14'D
x55
'H
20'D
x50
'H
$1.5
0
$2.0
0
$2.5
0
$3.0
0
$3.5
0
CostperGallonRe
serv
oir
Budg
etIn
stal
latio
nCo
stIsl
and
Coun
ty(2
015
Dolla
rs)
(Est
imat
edU
sefu
lLife
:Ye
ars)
Low
Tank
High
Tank
30'D
x20
'H30
'Dx
40'H
$0.0
0
$0.5
0
$1.0
0
020
,000
40,0
0060
,000
80,0
0010
0,00
012
0,00
014
0,00
016
0,00
018
0,00
020
0,00
0
Size
(Gal
lons
)
Cost
Assu
mpt
ions
:Re
info
rced
Conc
rete
Tank
Incl
udes
Pipi
ngU
nder
Tank
Incl
udes
Som
eSi
tePr
epar
atio
nIn
clud
esTa
xDo
esN
otIn
clud
eCo
ntin
genc
y(N
ote:
High
Tank
>32'
H)
ThunderRidge E-6
Description Unit Quantity Unit Price TotalMobilization LS 1 11,000.00 $11,000.00Removal of Structure & Obstruction LS 1 5,000.00 5,000.008-Inch HDPE Pipe LF 1,000 36.00 36,000.008-Inch Gate Valve EA. 2 1,400.00 2,800.008-Inch Tees, Bends & Fittings EA. 4 500.00 2,000.006 Inch Hydrant Assembly EA. 1 3,700.00 3,700.00Air Vacuum Valve Assembly EA. 1 1,900.00 1,900.00Single Service - Near Side EA. 10 900.00 9,000.00Single Service - Far Side EA. 10 1,800.00 18,000.00Connect Main to Existing System EA. 2 1,800.00 3,600.00Crushed Surfacing TN 75 32.00 2,400.00Commercial HMA - Pavement Patch TN 10 275.00 2,750.00Topsoil / Bark Mulch CY 20 45.00 900.00
8-Inch HDPE PipingPreliminary Cost Estimate: Installation Per Typical 1,000 FT
Distribution System Piping - Budget Construction Cost - Island CountyHDPE with Meters and Appurtenances
(Estimated Useful Life: 75 years)(2015 Dollars)
Corrugated Polyethylene Culv. Pipe 12 Inc. Diam. LF 60 22.00 1,320.00Project Temporary Traffic Control LS 1 500.00 500.00Select Gravel Backfill TN 300 15.00 4,500.00
$105,370.009,167.19
$114,537.19$114.54$115.00
Estimated Price Per LFEstimate Per LF For Budgeting
Sub-TotalSales Tax (8.7%)Total
Cost Assumptions:Pipe installed on shoulder of roadTypical residentialAssume HDPE pipe but similar for PVC pipeIncludes taxDoes not include permits, engineering, archaeological review
(these additional items can be 30 40% additional cost)Does not include contingency
Eight Inch Pipe Costs JA2816gc.xlsx
ThunderRidge E-7
Description Unit Quantity Unit Price TotalMobilization LS 1 10,000.00 $10,000.00Removal of Structure & Obstruction LS 1 5,000.00 5,000.006-Inch HDPE Pipe LF 1,000 28.00 28,000.006-Inch Gate Valve EA. 2 900.00 1,800.006-Inch Tees, Bends & Fittings EA. 4 500.00 2,000.006 Inch Hydrant Assembly EA. 1 3,700.00 3,700.00Air Vacuum Valve Assembly EA. 1 1,900.00 1,900.00Single Service - Near Side EA. 10 900.00 9,000.00Single Service - Far Side EA. 10 1,800.00 18,000.00Connect Main to Existing System EA. 2 1,800.00 3,600.00Crushed Surfacing TN 75 32.00 2,400.00Commercial HMA - Pavement Patch TN 10 275.00 2,750.00Topsoil / Bark Mulch CY 20 45.00 900.00
6-Inch HDPE PipingPreliminary Cost Estimate: Installation Per Typical 1,000 FT
Distribution System Piping - Budget Construction Cost - Island CountyHDPE with Meters and Appurtenances
(Estimated Useful Life: 75 years)(2015 Dollars)
Corrugated Polyethylene Culv. Pipe 12 Inc. Diam. LF 60 22.00 1,320.00Project Temporary Traffic Control LS 1 500.00 500.00Select Gravel Backfill TN 300 15.00 4,500.00
$95,370.008,297.19
$103,667.19$103.67$105.00
Estimated Price Per LFEstimate Per LF For Budgeting
Sub-TotalSales Tax (8.7%)Total
Cost Assumptions:Pipe installed on shoulder of roadTypical residentialAssume HDPE pipe but similar for PVC pipeIncludes taxDoes not include permits, engineering, archaeological review
(these additional items can be 30 40% additional cost)Does not include contingency