10
Water vapour soundings in the upper troposphere Geraint Vaughan University of Wales, Aberystwyth With thanks to: Clare Cambridge, Alan Phillips, Les Dean, Graham Hansford and Rod Jones
| Date post: | 02-Jan-2016 |
| Category: |
Documents |
| Upload: | montana-bond |
| View: | 21 times |
| Download: | 0 times |
Water vapour soundings in the upper troposphere
Geraint Vaughan
University of Wales, Aberystwyth
With thanks to: Clare Cambridge, Alan Phillips, Les Dean, Graham Hansford and Rod Jones
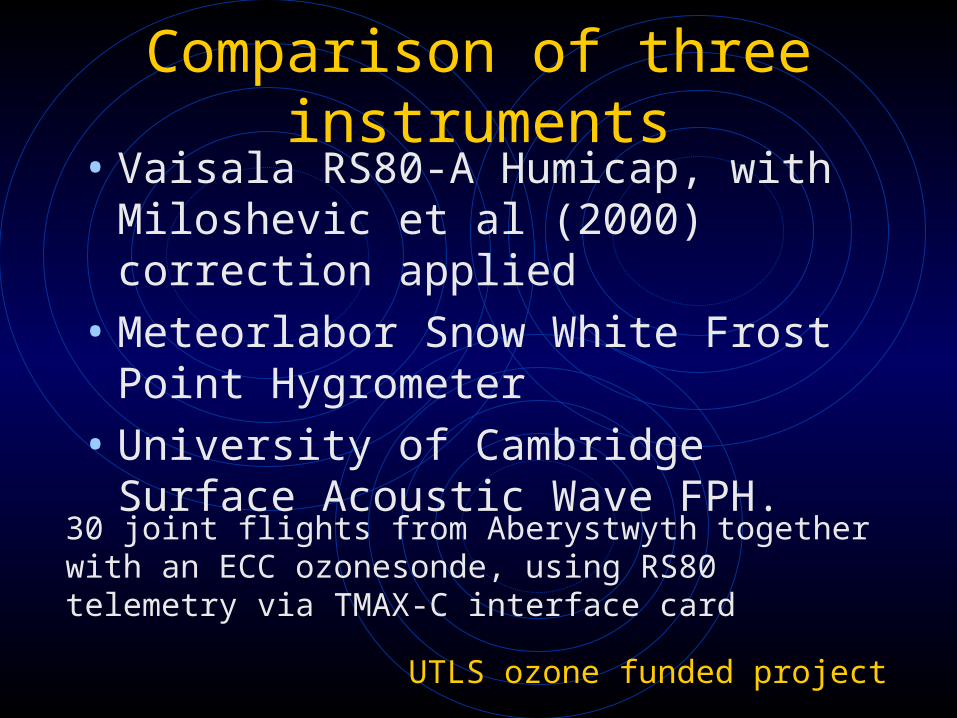
Comparison of three instruments• Vaisala RS80-A Humicap, with Miloshevic
et al (2000) correction applied
• Meteorlabor Snow White Frost Point Hygrometer
• University of Cambridge Surface Acoustic Wave FPH.
30 joint flights from Aberystwyth together with an ECC ozonesonde, using RS80 telemetry via TMAX-C interface card
UTLS ozone funded project

Snow White, ECC and RS80
RS80
ECC ozonesonde
SNOW WHITE
Air inlet
Peltier cooler and chilled mirror
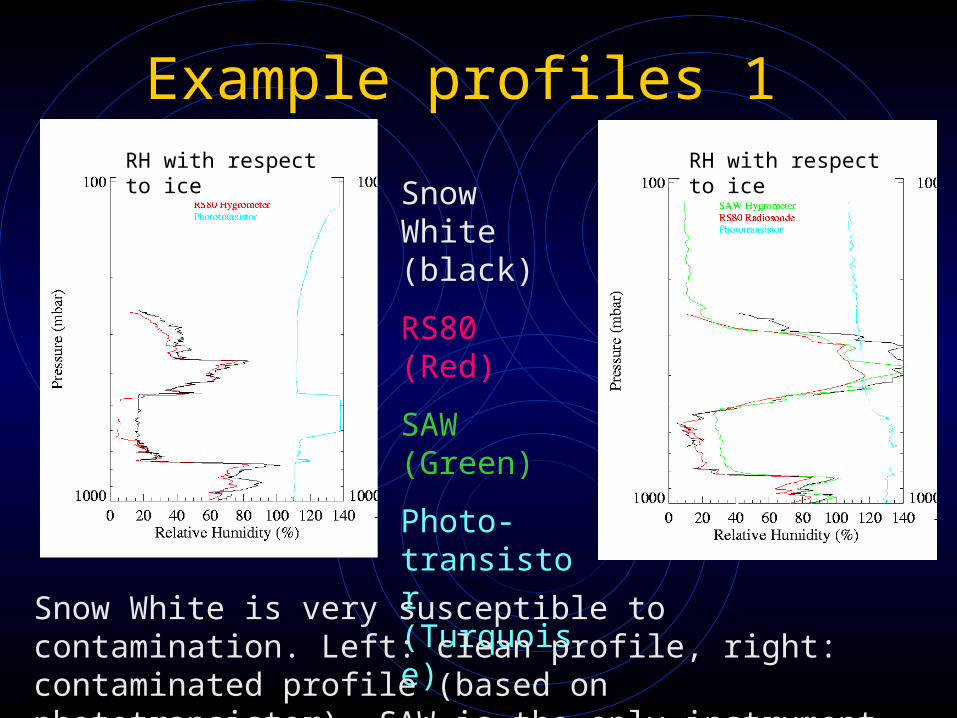
Example profiles 1
Snow White (black)
RS80 (Red)
SAW (Green)
Photo-transistor (Turquoise)
Snow White is very susceptible to contamination. Left: clean profile, right: contaminated profile (based on phototransistor). SAW is the only instrument capable of stratospheric measurements.
RH with respect to ice RH with respect to ice
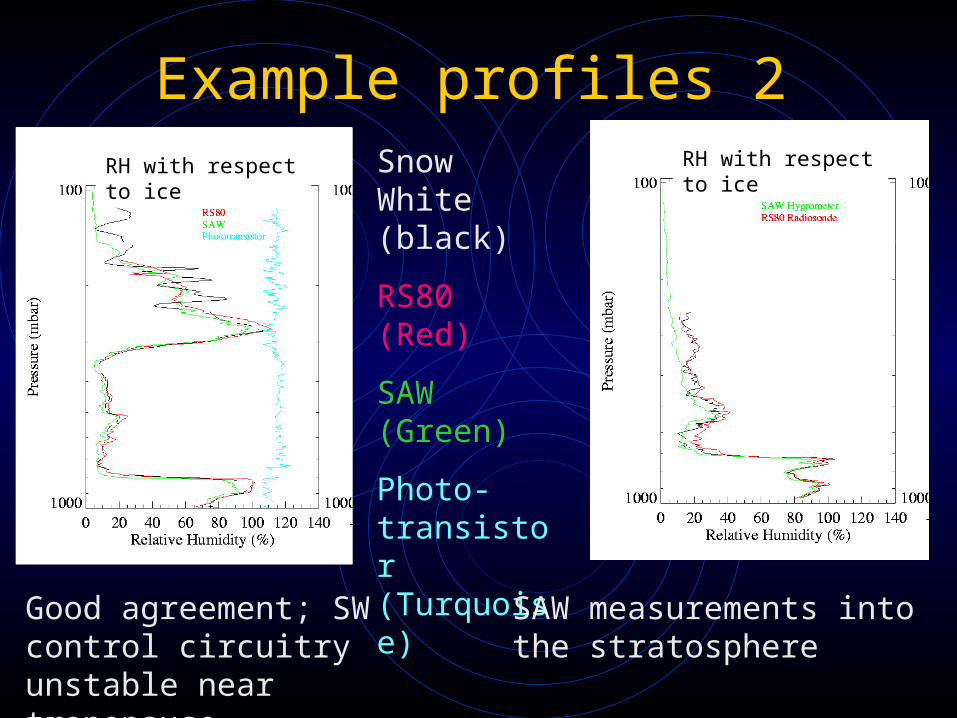
Example profiles 2Snow White (black)
RS80 (Red)
SAW (Green)
Photo-transistor (Turquoise)
Good agreement; SW control circuitry unstable near tropopause
SAW measurements into the stratosphere
RH with respect to ice RH with respect to ice

Comparison between Snow White and RS80 in UT
Conclusion: No evidence of systematic bias in radiosondes.
With respect to ice
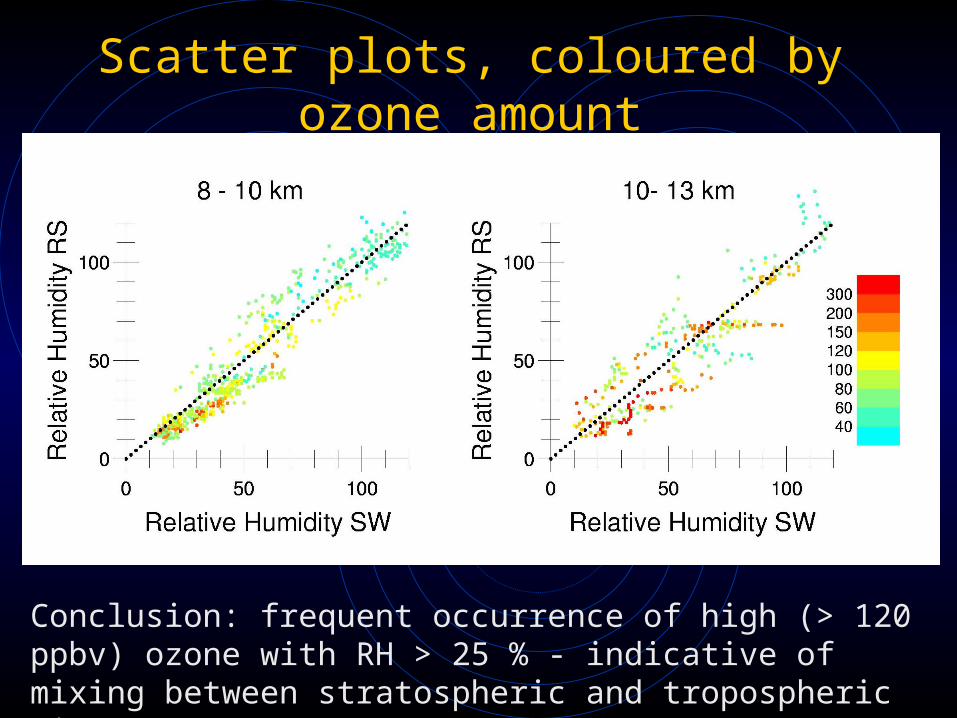
Scatter plots, coloured by ozone amount
Conclusion: frequent occurrence of high (> 120 ppbv) ozone with RH > 25 % - indicative of mixing between stratospheric and tropospheric air

Extension to ozonesonde databaseApply Miloshevic correction to RH measured on 324 ozonesonde profiles launched from Aberystwyth between 1991 and 2002
0
50
100
150
200
250
0 20 40 60 80 100 120 140 160Relative Humidity (ice) / %
Nu
mb
er
Relative Humidity (ice): Summer, 10-11km
0
100
200
300
400
500
0 20 40 60 80 100 120 140 160Relative Humidity (ice) / %
Nu
mb
er
Relative Humidity (ice): Winter, 10-11km
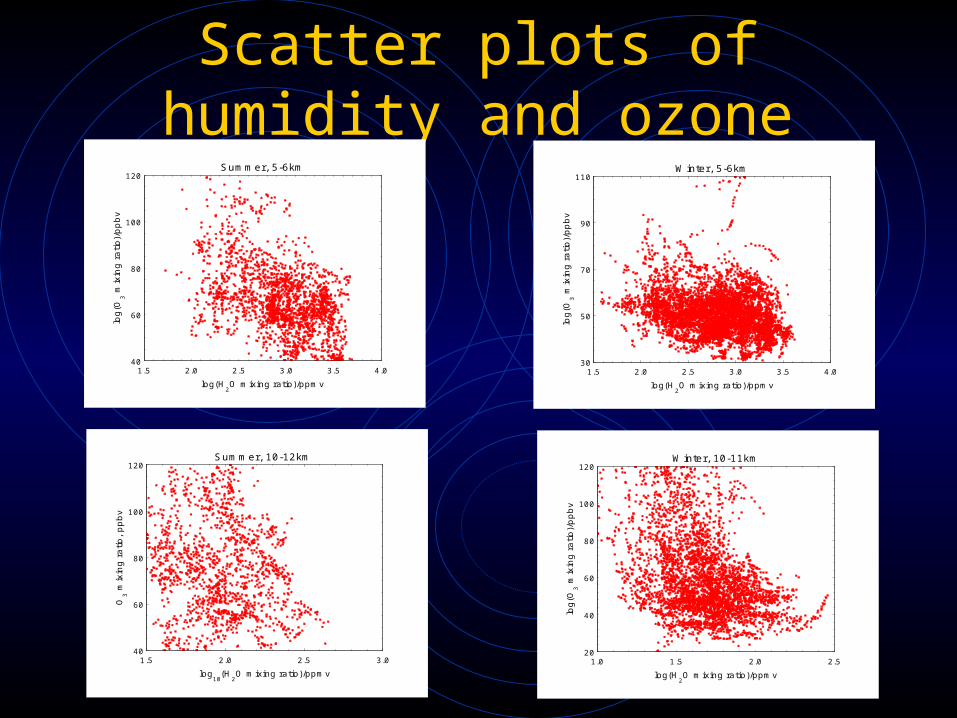
Scatter plots of humidity and ozone
40
60
80
100
120
1.5 2.0 2.5 3.0
log10
(H2O mixing ratio)/ppmv
O3 m
ixin
g ra
tio, p
pbv
Summer, 10-12km
40
60
80
100
120
1.5 2.0 2.5 3.0 3.5 4.0
log(H2O mixing ratio)/ppmv
log(
O3 m
ixin
g r
atio
)/p
pbv
Summer, 5-6km
30
50
70
90
110
1.5 2.0 2.5 3.0 3.5 4.0
log(H2O mixing ratio)/ppmv
log(
O3 m
ixin
g ra
tio)/
ppb
v
Winter, 5-6km
20
40
60
80
100
120
1.0 1.5 2.0 2.5
log(H2O mixing ratio)/ppmv
log(
O3 m
ixin
g r
atio
)/p
pbv
Winter, 10-11km
Conclusions
• Reasonable agreement between the three techniques
• RS80A profiles do not exhibit bias at high altitude if corrected according to Miloshevic et al (2000)
• Frequent instances of RHice>100% at high altitudes
• Frequent instances of high ozone mixing ratio and RH > 25% above 10 km


