\\private\dfs\ProjectData\P2017\0763\A10\Deliverables\TechMemo2_WTM\TM2_WTM_draft_20180515_jb.docx Attachment A Watershed Treatment Model Model Parameter Values, Input Data, and Model Results
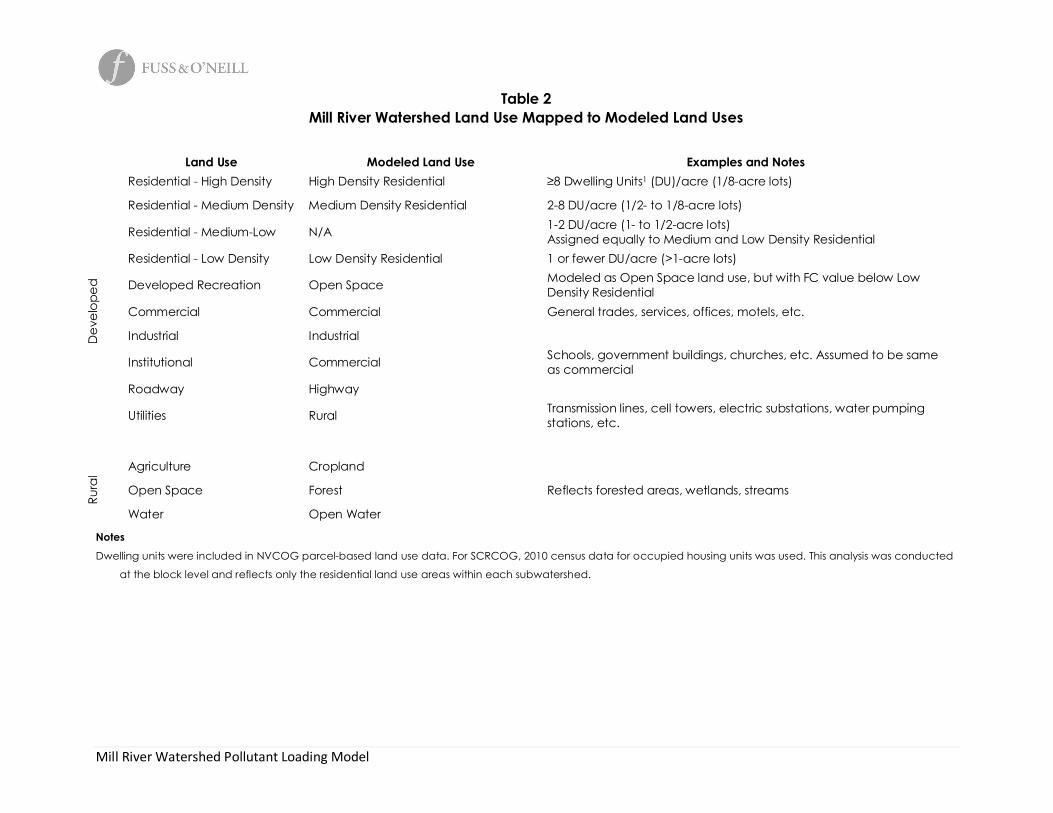
Table 2Mill River Watershed Land Use Mapped to Modeled Land Uses
Land Use Modeled Land Use Examples and Notes
Dev
elop
ed
Residential - High Density High Density Residential ≥8 Dwelling Units1 (DU)/acre (1/8-acre lots)
Residential - Medium Density Medium Density Residential 2-8 DU/acre (1/2- to 1/8-acre lots)
Residential - Medium-Low N/A 1-2 DU/acre (1- to 1/2-acre lots)Assigned equally to Medium and Low Density Residential
Residential - Low Density Low Density Residential 1 or fewer DU/acre (>1-acre lots)
Developed Recreation Open Space Modeled as Open Space land use, but with FC value below LowDensity Residential
Commercial Commercial General trades, services, offices, motels, etc.
Industrial Industrial
Institutional Commercial Schools, government buildings, churches, etc. Assumed to be sameas commercial
Roadway Highway
Utilities Rural Transmission lines, cell towers, electric substations, water pumpingstations, etc.
Rura
l Agriculture Cropland
Open Space Forest Reflects forested areas, wetlands, streams
Water Open Water
Notes
Dwelling units were included in NVCOG parcel-based land use data. For SCRCOG, 2010 census data for occupied housing units was used. This analysis was conducted
at the block level and reflects only the residential land use areas within each subwatershed.
Mill River Watershed Pollutant Loading Model
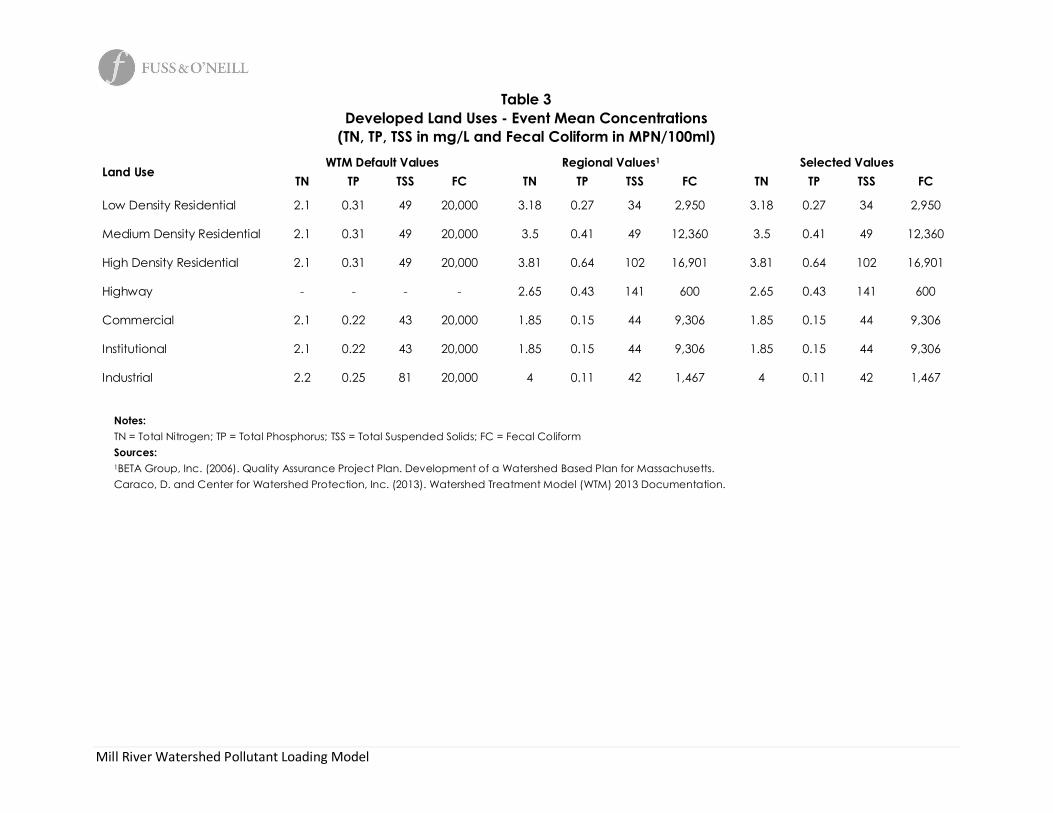
Table 3Developed Land Uses - Event Mean Concentrations
(TN, TP, TSS in mg/L and Fecal Coliform in MPN/100ml)
Land UseWTM Default Values Regional Values1 Selected Values
Notes:TN = Total Nitrogen; TP = Total Phosphorus; TSS = Total Suspended Solids; FC = Fecal ColiformSources:1BETA Group, Inc. (2006). Quality Assurance Project Plan. Development of a Watershed Based Plan for Massachusetts.Caraco, D. and Center for Watershed Protection, Inc. (2013). Watershed Treatment Model (WTM) 2013 Documentation.
Mill River Watershed Pollutant Loading Model
Table 4Rural Land Uses - Export Coefficients
(TN, TP, and TSS in lb/ac/yr and Fecal Coliform in billion/ac/yr)
Selected TN, TP, and TSSbased on regional sources forpasture and row crops; FCassumed same as Rural landuse
Notes:TN = Total Nitrogen; TP = Total Phosphorus; TSS = Total Suspended Solids; FC = Fecal ColiformConversion equation used for Pasture/OrchardNSQD (2005) and MA DEP QAPP do not provide rural land use data.Cropland export coefficients are based on regional values. This category includes both pasture and crop land. Pasture land and hay fields are about as prevalent as
nurseries and row crops in the Mill River Watershed, so the selected coefficients represent an approximate average of those values.
Sources:Maestre & Pitt and Center for Watershed Protection (2005). The National Stormwater Quality Database, Version 1.1.Caraco, D. and Center for Watershed Protection, Inc. (2013). Watershed Treatment Model (WTM) 2013 Documentation.
Regional values identified by number:1. BETA Group, Inc. (2006). Quality Assurance Project Plan. Development of a Watershed Based Plan for Massachusetts. Converted values presented in mg/L into
lb/ac/yr assuming 0% impervious area for Forest and 2% impervious area, 46 inches of rain per year, for agricultural land uses.2. Reckhow et al. (1980): “Modeling Phosphorus Loading and Lake Response under Uncertainty: A Manual and Compilation of Export Coefficients.” From Lin, J. (2005)
Review of Published Export Coefficient and Event Mean Concentration (EMC) Data. Converted values from kg/ha/yr to lb/ac/yr.3. CH2M HILL (2001). PLOAD version 3.0, An ArcView GIS Tool to Calculate Nonpoint Sources of Pollution in Watershed and Stormwater Projects: User’s Manual.
Mill River Watershed Pollutant Loading Model
Table 5Sources and Model Assumptions
Parameter Sources Model Assumptions & NotesPrimary SourcesSubwatershedBoundary
CTDEEP – Local basins Smaller local basins with similar characteristics were grouped for this analysis. Wheresubwatershed boundaries do not follow local basins, they reflect impaired uses and followcontours based on 2000 LiDAR data
Land Use NVCOG – Land Use 2016SCRCOG – Land Use 2017US Census 2010CTECO – 2016 3-inch Orthophotography
NVCOG land use classifications were simplified for input into WTM. Acreage for variousclassifications was determined in ArcGIS by intersecting the land use with theSubwatersheds. NVCOG land use classifications include Medium-Low Density Residential,which was equally divided and split between Medium Density and Low DensityResidential. Residential density is based on dwelling units per acre. This information wasincluded in NVCOG parcel-based land use data. For SCRCOG, 2010 census data foroccupied housing units was used. This analysis was conducted at the census block leveland reflects only the residential land use areas within the Mill River watershed. SCRCOGland use included two categories of Other and Mixed Use. These areas were manuallyassigned to modeled land uses via aerial imagery. Most “Other” areas were combinedwith open space. Mixed Use was combined with Commercial. Where roadways were notincluded in land use coverage, the difference in area between subwatersheds andsubwatershed land use coverage was assigned to the “Highway” category. Somemunicipalities classify this land use based on the surrounding land use (e.g. a residentialstreet is classified as Residential)
Pollutant EventMeanConcentrations(EMCs) and ExportCoefficients
WTM Default Values, Selected RegionalValues used in MA Watershed Based Plan(2006)
Selected regional EMCs were used for residential, transitional, commercial, highway, andindustrial land use categories. WTM default values were used for rural, powerlines, andopen water land use categories.
Impervious % CT ECO 2016 The impervious surface data set was available from CT Environmental Conditions Online(CTECO) as a statewide dataset representing impervious surfaces digitized from 2012orthophotography. The percent impervious for land use classes in each subwatershed wasdetermined by intersecting the raster with available land use data.
Annual Rainfall Northeast Regional Climate Center Weather station on Mt Carmel, Hamden. Period of record 1936-2018.
Stream Length CTDEEP Hydrography Line Stream lengths in each subwatershed were calculated based on intersecting the CTDEEPHydrography Line data layer with the Subwatershed boundaries.
Mill River Watershed Pollutant Loading Model
Parameter Sources Model Assumptions & NotesSoils Information CTDEEP Soils Data – NRCS SSURGO-
Certified Soils 2009Hydrologic Soils Group data were available from SSURGO and matched to CTDEEP soilsdata based on the Soil Map Unit Key (MUKey) field. Where the sum of categorypercentages is less than 100%, the balance is water, which does not receive HSGclassification, but is most similar in infiltration characteristics to Category D.An estimate of the depth to groundwater was made by converting USDA drainageclasses, which are essentially an estimate of seasonal high water table. Depth togroundwater was estimated at 3-5 ft across the watershed.
Runoff Coefficients Virginia Erosion & Sediment ControlHandbook, 1980.
Runoff coefficients for Rural Land Uses were selected from a range of values listed in theVirginia Erosion & Sediment Control Handbook. Values for Cropland ranged from 0.15 to0.4 and from 0.12 to 0.35 for Pasture/Orchard, etc.
Secondary SourcesGeneral SewageData
GNHWPCA, North Haven WPCA, CheshireWater Pollution Control Dept, WallingfordSewer Division, NVCOG parcel-basedland use and WTM defaults
Watershed parcels in residential areas were excluded based on proximity to sanitarysewer piping.
NutrientConcentration inStream Channels
Haith et al. 1992 A mid- range value of 0.15 was used for Soil P (%) and Soil TN (%). See figures 4.1 and 4.2 inthe WTM 2013 Documentation.
On-Site SewageDisposal (OSDS)
GNHWPCA, North Haven WPCA, CheshireWater Pollution Control Dept, WallingfordSewer Division, NVCOG parcel-basedland use, Local Health Districts, and WTMdefaults
All dwelling units assumed to be served by OSDS unless the parcel is within an area servedby sanitary sewers. Unsewered areas were set to Clay/Mixed Soils. A failure rate of 1% wasselected based on regional estimates and data on local system failure from Quinnipiacand Chesprocott Health Districts. Septic system type was set to 100% conventional, withmedium maintenance. Typical separation from groundwater was assumed to be 3-5 ft.The OSDS density was set at 1-2 per acre based on calculated dwelling unit density inunsewered areas.
CSOs GNHWPCA Consent Order WC5509Annual Progress Report 2017West River Watershed Based Plan, 2015
Three CSOs exist in the Mill River watershed, all within the Lower Mill River subwatershed.Meters installed at these outfalls in 2012 monitor discharge volumes for each storm eventthat causes a discharge. Sufficient data has now been collected for the WPCA toestimate a “typical year” of discharges based on both precipitation and on averagemonthly overflow events.Rather than use the default CSO contribution calculated by the WTM by applying theSimple Method, the availability of data in this watershed, coupled with estimates ofpollutant concentrations applied in the neighboring West River Watershed Based Plan,allowed for the direct estimation of annual loading from CSOs.
SSOs GNHWPCA, North Haven WPCA, CheshireWater Pollution Control Dept, WallingfordSewer Division
SSOs must be reported in MS4 Annual Reports. Per these reports and in discussion withrelevant municipal personnel, SSOs were only reported in the GNHWPCA sanitary sewerarea. In the past three years, 150 gallons of sanitary sewage has been discharged to thestorm sewer system. An annual discharge of 50 gallons was assumed, and distributedevenly across all subwatersheds served by GNHWPCA.
Mill River Watershed Pollutant Loading Model
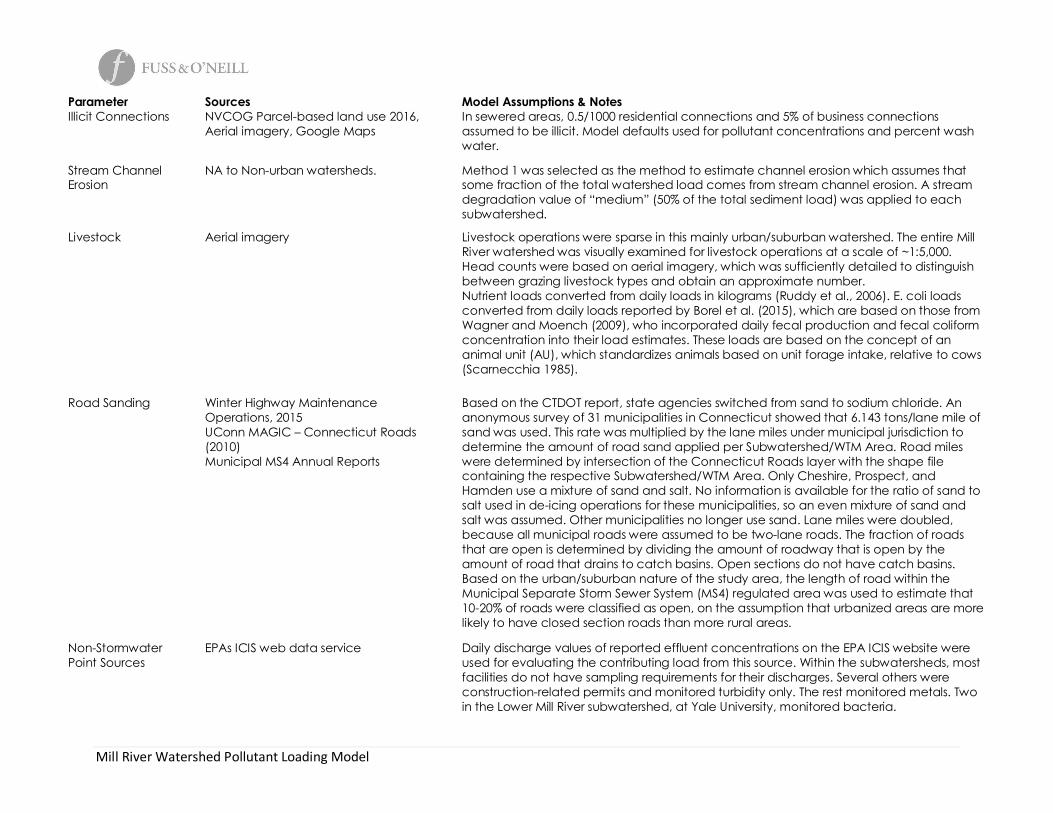
Parameter Sources Model Assumptions & NotesIllicit Connections NVCOG Parcel-based land use 2016,
Aerial imagery, Google MapsIn sewered areas, 0.5/1000 residential connections and 5% of business connectionsassumed to be illicit. Model defaults used for pollutant concentrations and percent washwater.
Stream ChannelErosion
NA to Non-urban watersheds. Method 1 was selected as the method to estimate channel erosion which assumes thatsome fraction of the total watershed load comes from stream channel erosion. A streamdegradation value of “medium” (50% of the total sediment load) was applied to eachsubwatershed.
Livestock Aerial imagery Livestock operations were sparse in this mainly urban/suburban watershed. The entire MillRiver watershed was visually examined for livestock operations at a scale of ~1:5,000.Head counts were based on aerial imagery, which was sufficiently detailed to distinguishbetween grazing livestock types and obtain an approximate number.Nutrient loads converted from daily loads in kilograms (Ruddy et al., 2006). E. coli loadsconverted from daily loads reported by Borel et al. (2015), which are based on those fromWagner and Moench (2009), who incorporated daily fecal production and fecal coliformconcentration into their load estimates. These loads are based on the concept of ananimal unit (AU), which standardizes animals based on unit forage intake, relative to cows(Scarnecchia 1985).
Based on the CTDOT report, state agencies switched from sand to sodium chloride. Ananonymous survey of 31 municipalities in Connecticut showed that 6.143 tons/lane mile ofsand was used. This rate was multiplied by the lane miles under municipal jurisdiction todetermine the amount of road sand applied per Subwatershed/WTM Area. Road mileswere determined by intersection of the Connecticut Roads layer with the shape filecontaining the respective Subwatershed/WTM Area. Only Cheshire, Prospect, andHamden use a mixture of sand and salt. No information is available for the ratio of sand tosalt used in de-icing operations for these municipalities, so an even mixture of sand andsalt was assumed. Other municipalities no longer use sand. Lane miles were doubled,because all municipal roads were assumed to be two-lane roads. The fraction of roadsthat are open is determined by dividing the amount of roadway that is open by theamount of road that drains to catch basins. Open sections do not have catch basins.Based on the urban/suburban nature of the study area, the length of road within theMunicipal Separate Storm Sewer System (MS4) regulated area was used to estimate that10-20% of roads were classified as open, on the assumption that urbanized areas are morelikely to have closed section roads than more rural areas.
Non-StormwaterPoint Sources
EPAs ICIS web data service Daily discharge values of reported effluent concentrations on the EPA ICIS website wereused for evaluating the contributing load from this source. Within the subwatersheds, mostfacilities do not have sampling requirements for their discharges. Several others wereconstruction-related permits and monitored turbidity only. The rest monitored metals. Twoin the Lower Mill River subwatershed, at Yale University, monitored bacteria.
Mill River Watershed Pollutant Loading Model
Borel, K, R Karthikeyan, TA Berthold, and K Wagner. 2015. Estimating E. coli and Enterococcus loads in a coastal Texas watershed. Texas WaterJournal 6: 33-44.
Haith, DA, R Mandel, and RS Wu. 1992. Generalized Watershed Loading Functions, Version 2.0 User’s Manual. Department of Agricultural andBiological Engineering, Cornell University, Ithaca, NY.
Northeast Regional Climate Center. 2015. CLIMOD2: Woodbury, CT Precipitation Record 1967 – 2008.Ruddy, BC, DL Lorenz, and DK Mueller. County-level estimates of nutrient inputs to the land surface of the conterminous United States, 1982-2001.
USGS SIR 2006-5012.Scarnecchia, DL. 1985. The animal-unit and animal-unit equivalent concepts in range science. Journal of Range Management 38: 346-349.USGS. 2011. National Land Cover Dataset.Virginia Erosion and Sediment Control Handbook, 1980. Virginia Soil and Water Conservation Committee.Wagner, K and E Moench. 2009. Education Program for Improved Water Quality in Copano Bay: Task Two Report. Texas Water Resources Institute
Technical Report 347.Winter Highway Maintenance Operations, 2015. Connecticut Academy of Science and Engineering report to the Connecticut Department of
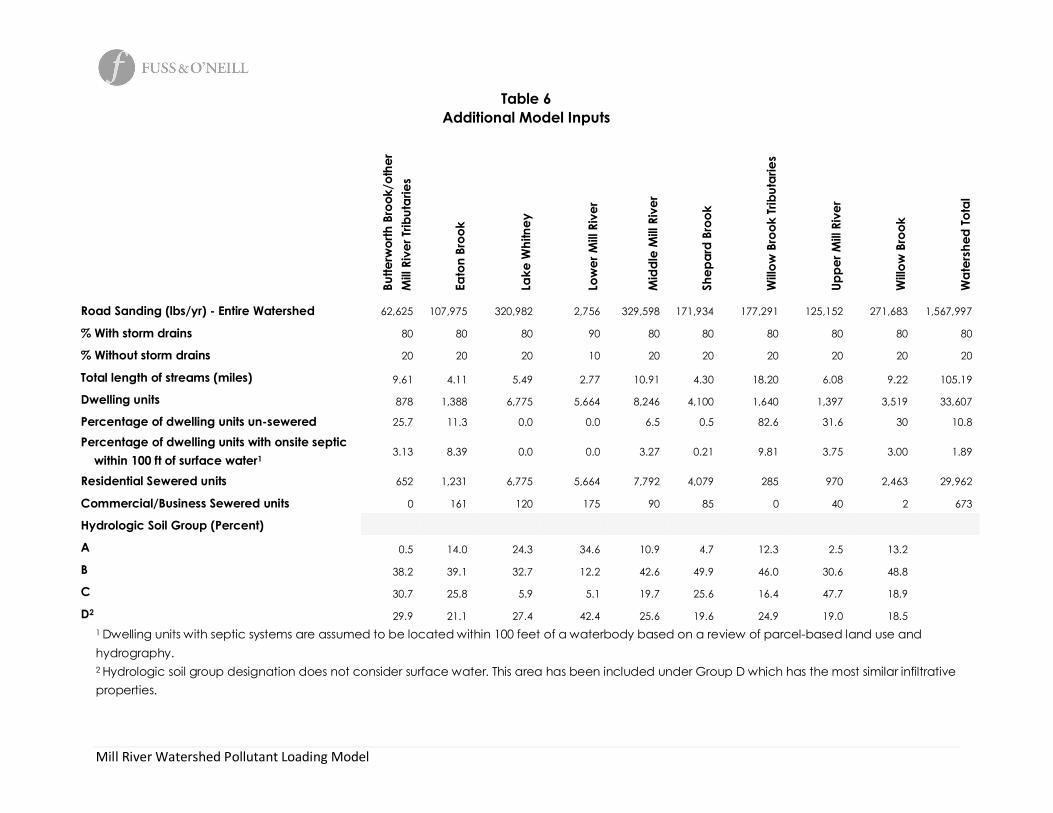
D2 29.9 21.1 27.4 42.4 25.6 19.6 24.9 19.0 18.51 Dwelling units with septic systems are assumed to be located within 100 feet of a waterbody based on a review of parcel-based land use andhydrography.2 Hydrologic soil group designation does not consider surface water. This area has been included under Group D which has the most similar infiltrativeproperties.
1 Ruddy et al (2006). Loads converted from daily loads in kilograms.2 E. coli loads converted from daily loads reported by Borel et al. (2015), which are based on those from Wagner and Moench (2009), who incorporated daily fecal
production and fecal coliform concentration into their load estimates. These loads are based on the concept of an animal unit (AU), which standardizes animals based
on unit forage intake, relative to cows (Scarnecchia 1985).
Table 8Estimated Head of Livestock by Drainage Basin
Livestock Butte
rwor
thBr
ook/
othe
rM
illRi
verT
ribut
arie
s
Willo
wBr
ook
Bovine 0 0Equine 45 10
Ovine 0 0
Poultry 0 0
Notes:Head counts were based on aerial imagery, which was sufficiently detailed to distinguish among grazing livestock types and obtain an approximatenumber. It was assumed that most but likely not all head of livestock were grazing when aerial imagery was captured. This incorporates Giant ValleyPolo Club and two hobby farms.
Mill River Watershed Pollutant Loading Model
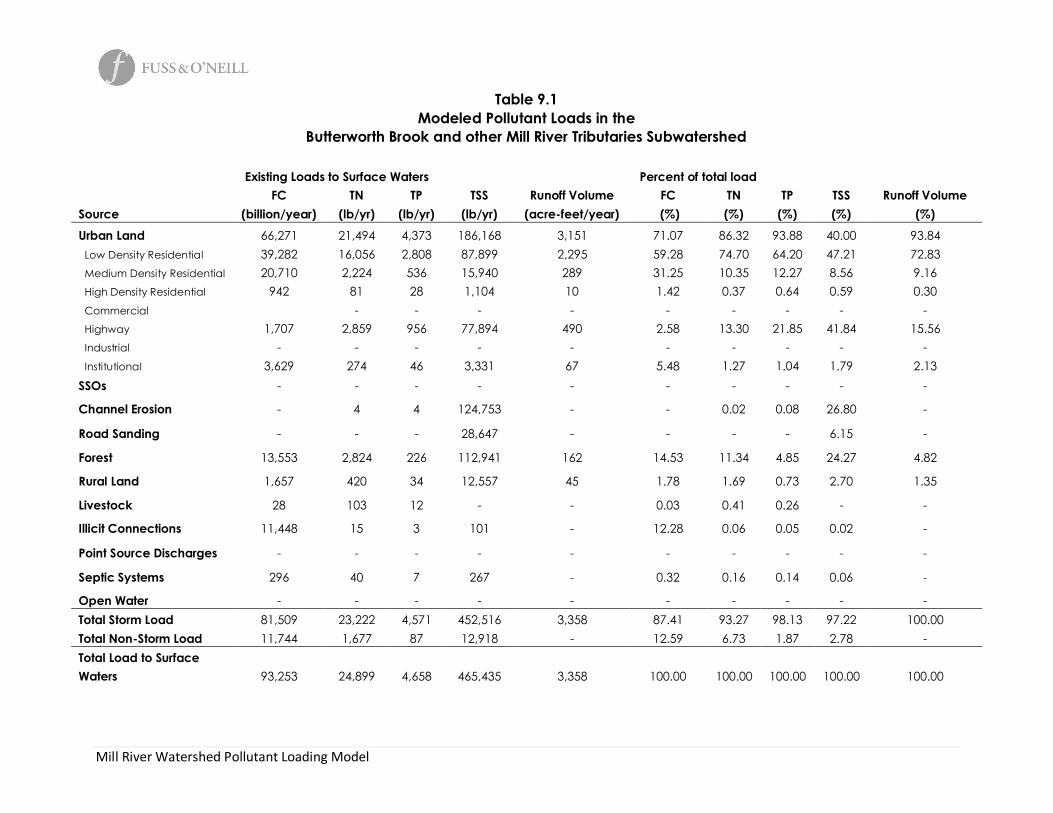
Table 9.1Modeled Pollutant Loads in the
Butterworth Brook and other Mill River Tributaries Subwatershed
Existing Loads to Surface Waters Percent of total load
TO: Nicole Davis and Gwen Macdonald, Save the Sound
FROM: Erik Mas, P.E, Julianne Busa, Ph.D., and Stefan Bengtson, MSc, Fuss & O’Neill, Inc.
DATE: June 28, 2018
RE: Technical Memorandum 3—Low Impact Development and Green InfrastructureAssessmentMill River Watershed-Based Plan
1. Introduction
Urban stormwater runoff is a significant source of pollutants and a leading cause of water qualityimpairments in the Mill River. Stormwater runoff from developed areas and other nonpoint sourcesof pollution in the watershed are major contributors of bacteria, sediment, and nutrients.Stormwater runoff collected by the combined sanitary and storm sewer system in the City of NewHaven also contributes to three remaining Combined Sewer Overflow (CSO) discharges to the MillRiver during periods of heavy rainfall, when the combined sewer system becomes overwhelmed.CSO discharges therefore contribute additional pollutant loads to the Mill River during wetweather.
Low Impact Development (LID) is a site design strategy that maintains, mimics, or replicates pre-development hydrology through the use of numerous site design principles and small-scaletreatment practices distributed throughout a site to manage runoff volume and water quality at thesource. Similarly, “green infrastructure” refers to systems and practices that reduce runoff throughthe use of vegetation, soils, and natural processes to manage water and create healthier urban andsuburban environments (EPA, 2014). When applied to sites or neighborhoods, LID and greeninfrastructure (referred to hereafter as simply “green infrastructure”) include stormwatermanagement practices such as rain gardens, permeable pavement, green and blue roofs, greenstreets, infiltration planters, trees and tree boxes, and rainwater harvesting. These practicescapture, manage, and/or reuse rainfall close to where it falls, thereby reducing stormwater runoffand keeping it out of receiving waters.
In addition to reducing polluted runoff and improving water quality, green infrastructure has beenshown to provide other social and economic benefits relative to reduced energy consumption,improved air quality, carbon reduction and sequestration, improved property values, recreationalopportunities, overall economic vitality, and adaptation to climate change. For these reasons,many communities are exploring the use of and are adopting green infrastructure within theirmunicipal infrastructure programs.
An important objective of the Mill River Watershed Management Plan is to reduce runoff volumesand pollutant loads through the use of green infrastructure by building on the previous and ongoing
LID and green infrastructure initiatives in the watershed and region and targeting areas of knownwater quality impairments.
2. Assessment Approach
An assessment was performed to identify opportunities and develop concepts for site-specificgreen infrastructure retrofits in the Mill River watershed. The assessment consisted of four primarytasks:
1. Identification of existing green infrastructure practices in the Mill River watershed,2. Screening evaluation to quickly identify areas of the watershed with the greatest feasibility
for and potential benefits from green infrastructure retrofits,3. Field inventories of the most promising green infrastructure retrofit opportunities in the
watershed identified from the screening step,4. Green infrastructure concept designs for selected retrofit sites.
3. Existing Green Infrastructure Practices
There are a number of ongoing green infrastructure initiatives in the greater New Haven area.Implementation of green infrastructure is a key objective of the Greater New Haven WaterPollution Control Authority (GNHWPCA) strategic plan (GNHWPCA, 2017). GNHWPCA requires theuse of green infrastructure stormwater management practices (e.g., infiltrators and drywells, rainwater storage tanks, bioswales and tree wells, water features) for development and redevelopmentprojects within combined sewer areas (Table 1) in accordance with the GNHWPCA Permitting andDesign Criteria Manual. GNHWPCA and the City of New Haven, working with CFE/Save the Soundand other groups, are also installing bioswales at numerous locations throughout the City withinthe public right-of-w ay to reduce runoff to the combined sewer system and reduce pollutant loadsto surface waters. The City of New Haven has also adopted regulatory requirements to reducestormwater runoff from development projects contributing to the City’s combined sewer system.
The Town of Hamden has also been active in pursuing green infrastructure projects. The Town hasapplied for 319 funding for a project at Town Center Park which would involve installation of astormwater treatment wetland to manage runoff from 88 acres of surrounding commercial andresidential land. The Town has also adopted regulations and practices that directly support LID,including stormwater regulations that reference the DEEP stormwater manual, parking regulationsthat require any parking areas above and beyond the required minimum to be created withpervious materials and aim, more generally, at reducing paved surfaces, and landscape regulationsthat directly address stormwater quality issues. The Town has established impervious covermaximums and works closely with the RWA to coordinate stormwater efforts.
Area universities and other key facilities serve as visible demonstration sites for greeninfrastructure practices in and around the watershed. Over the past decade, Yale University hasincorporated infiltration and water reuse at a number of buildings that are either within the MillRiver watershed or contributing to the sewershed of CSO #011 (which outfalls to the Mill River).These include the Yale School of Forestry and Environmental Studies, Greenberg ConferenceCenter, Yale School of Management, Yale Divinity School, and several science buildings (Table 1).
Similarly, Quinnipiac University has incorporated permeable pavement into some of its parkingareas, including an overflow lot on Sherman Avenue, and is actively exploring additionalsustainability improvements. Throughout the South Central Basin, the UConn CT NEMO program isworking on a pilot project focused on incorporating green infrastructure into local projects. TheRegional Water Authority has been another advocate for water quality improvements in thewatershed; the Whitney Water Treatment Facility features a 30,000 square foot extensive greenroof that captures stormwater and reduces runoff.
During site visits, the field team also noted that Elim Park Retirement Community, one of the sitesidentified as a priority site during the green infrastructure screening process (described below),already managed stormwater using an existing treatment wetland and pond. There are likely
2007 Yale School of Forestry &Environmental Studies Sachem & Prospect Streets* Storage Tanks, Water Feature
2008 Albertus Magnus College Parking Lot 900 Prospect Street Infiltrators2008 St. Donato's Expansion 501 Lombard Street* Infiltrators2008 Yale Greenberg Conference Center Prospect Street Infiltrators
2008 Yale Ingalls Rink Expansion 73 Sachem Street Bioswale, Tree wells,infiltrators
2008 Yale School of Manage ment 155 Whitney Avenue Irrigation Storage Tank,Infiltrators
2008 Yale Divinity School 409 Prospect Street Drywells
2011 Murray Place Housing 191 Saltonstall Avenue Infiltrators2012 Lovell House Apartments 45 Nash Street Infiltrators2012 Albertus Magnus College Drainage 700 Prospect Street Drywells and curtain drain
2014 Community Building 72 James Street Infiltrators2014 315 Whitney Avenue 315 Whitney Avenue Pervious Pavers, Infiltrators2014 1040 State Street 1040 State Street Infiltrators2016 Yale Science Building 260 Whitney Avenue* Infiltrators
2015 Esplanade Apartments 396 Prospect Street* Perforated pipe, water qualitychamber
2017 District NHV, LLC 470 James Street Retention Basins2017 Wright Lab Renovation 266 Whitney Avenue* Rip Rap Swales2017 Bender Showroom 335 East Street Infiltrators2018 New Haven Housing 703 Whitney Avenue Infiltrators
Under Review Unicast Development 620 Grand Avenue Infiltratorsfield visit 6/2018 St Joseph Church (St Mary's) 129 Edwards St Infiltratorsfield visit 6/2018 United Church of the Redeemer 185 Cold Spring Street Infiltrators
* An asterisk after the address indicates sites which are outside the watershed, but inside the sewershed of CSO#11
other, scattered green infrastructure practices in use on private properties throughout thewatershed.
4. Assessment Methods and Findings
The remainder of this technical memorandum documents the methods and findings of the greeninfrastructure screening evaluation, field inventories, and concept designs.Screening Evaluation
A GIS-based screening evaluation was conducted to quickly identify specific parcel-based locationswithin the watershed where green infrastructure retrofits can be implemented that would providewater quality (i.e., pollutant reduction) and quantity (i.e., runoff reduction) benefits in thewatershed. The types of green infrastructure retrofits with potential applicability in the Mill Riverwatershed include:
· Permeable pavement· Bioretention/bioswales· Infiltration/filtration including tree box filters· Green/blue roofs· Tree planting· Water harvesting/reuse
Green infrastructure retrofit opportunities exist on sites or parcels and within street rights-of-way,as evidenced by the ongoing “green streets” or “complete streets” retrofits by the City of NewHaven and the GNHWPCA. Right-of-way projects were included in the screening process; however,the primary focus of the analysis was on parcel-based green infrastructure opportunities onpublicly-owned land and privately-owned institutional properties.
The following screening criteria and data sources were used to create an initial list of the mostfeasible sites for green infrastructure retrofits in the target subwatersheds:
· Target Subwatersheds – Subwatersheds with impaired water bodies, as defined in the2016 Integrated Water Quality Report were prioritized, since green infrastructure retrofitsin these areas would have the greatest water quality benefits. The following subwatershedswere identified as target areas for further consideration:
The Lower Mill River subwatershed also encompasses those areas of the Mill Riverwatershed with combined sewers, thereby providing additional benefits related to CSOdischarges by reducing the amount of runoff entering the combined sewer system (Figure1).
· Land Ownership – Publicly-owned (e.g., municipal) parcels are most favorable because theyavoid the cost of land acquisition and provide direct control over green infrastructureconstruction, maintenance, and monitoring by the municipality. Other publicly-ownedparcels such as schools, universities, state facilities, and federal facilities are also potentialgreen infrastructure candidates. Certain types of private parcels (e.g., private universities,churches) may be suitable and were also included in the analysis. In the screening process,land ownership attribution was based on land use classifications from both the SouthCentral Regional Council of Governments (SCRCOG) and the Naugatuck Valley Council ofGovernments (NVCOG). Approximately 489 parcels in the Mill River watershed wereidentified as possible sites given land use classifications of community facility, institutional,recreational, open space, or utilities. Of those parcels, 231 occur in targetedsubwatersheds.1
· Subsurface Conditions – Subsurface conditions are key considerations for greeninfrastructure retrofits that rely on infiltration of stormwater runoff and where runoffreduction is desired. Soil infiltration capacity, depth to groundwater, depth to restrictivelayers (bedrock, dense till), soil bulk density, and inundation of soils due to flooding areimportant soil-based characteristics that can affect the feasibility of infiltration-based greeninfrastructure retrofits.2 For the purposes of this desktop screening evaluation, we usedhydrologic soil groups (HSGs), as mapped by the Natural Resources Conservation Service(NRCS), to identify candidate sites for green infrastructure retrofits. HSGs provide an initialestimate of infiltration rate and storage capacity of soils on a site. Sites where mappedHSGs have high infiltration rates (A and B soils) are most suitable for infiltration stormwaterpractices. While soil maps provide initial estimates of infiltration potential, fieldinvestigations will be necessary to verify soil conditions for final feasibility determinationsand design purposes. Note also that while the analysis generally focused on sites with Aand B soils, input from the steering committee led us to include a number of sites in NewHaven that are mapped as D soils, but where experience has shown that the soils in factexhibit good infiltration characteristics.
Screening Results
The most feasible sites for green infrastructure retrofits were initially defined as those where allthree screening criteria coincided, based on GIS analysis. Specifically, candidate sites for greeninfrastructure retrofits were identified as:
· Within impaired subwatersheds; and· On publicly-owned land or higher-priority private institutional land (e.g., churches and
private schools); and· Having HSG A or B soils (or sites in New Haven, as described above).
1 Note that, although given a lower priority here, private properties also offer considerable opportunities forGI/LID. Individual landowners should be encouraged to pursue green infrastructure, and municipalities canfurther encourage adoption of GI practices through review and revision of land use regulations.
2 Other site-specific factors such as land area, impervious area, drainage area, subsurface utilities, subsurfacecontamination, and storm drainage system capacity are also important considerations for greeninfrastructure retrofits.
Candidate sites were then further screened for degree of impervious cover, such that open spaceareas that are essentially wooded conservation land with no existing buildings, roads, or parkingareas (and therefore little expectation of generating pollutants) were considered lower priority andexcluded from the list.
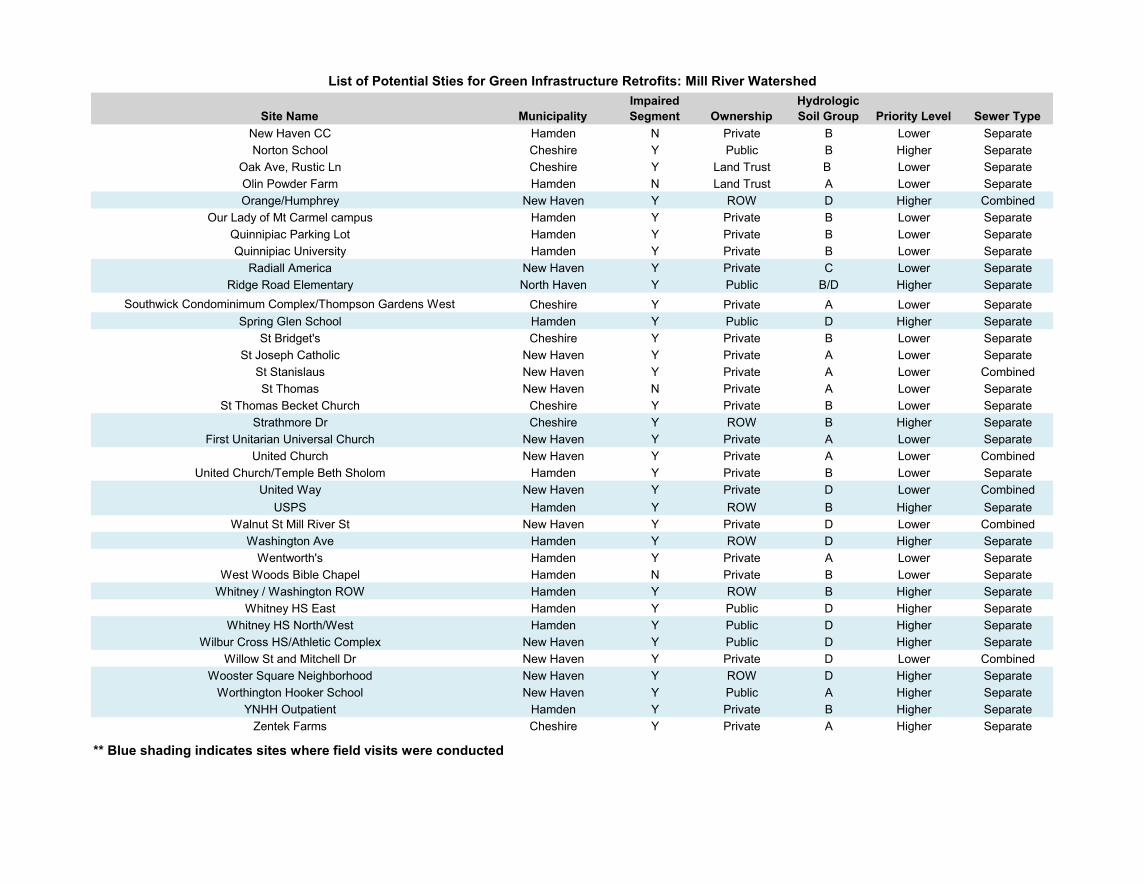
All sites meeting the above criteria were included on a list of potential sites (Attachment A). Thesesites were further divided into higher priority and lower priority sites, with public sites givenpriority due to the advantage conveyed by public ownership when actually trying to fund andimplement retrofit projects. The list was further refined with input from Save the Sound staff andprojects suggested by the Steering Committee. The final list of priority sites (Attachment A)included a total of 78 sites, 38 of which were identified as higher priority, and 40 of which wereidentified as lower priority.
Field Inventories
Site visits were conducted at 30 of the higher priority sites, as well as 6 of the lower priority sites,with visits attended by staff from Fuss & O’Neill, Connecticut Fund for the Environment/Save theSound (CFE/STS), or a team consisting of representatives from both organizations. Most site visitswere conducted on June 12 and 13, 2018, with some follow-up visits conducted by CFE/STS thefollowing week. The sites and adjacent street areas were walked and visually inspected forpotential green infrastructure retrofit opportunities (i.e., impervious surfaces connected to the on-site drainage system, available green space to accommodate new green infrastructure practices,existing drainage features that could be enhanced or improved) and physical site characteristicssuch as site configuration, drainage patterns, current use, slope, landscaping, subsurface utilities,design complexity, and maintenance access considerations. Notes were recorded and photographstaken at each site.
Sites Selected for Concept Designs
Based on the findings of the field inventories, green infrastructure retrofit opportunities wereidentified at the majority of the sites visited. The following 10 sites were selected for developmentof concept designs, as these sites are believed to (1) have the greatest feasibility for greeninfrastructure retrofits and the greatest potential pollution reduction impact, (2) represent a cross-section of common retrofit types and serve to demonstrate a variety of green infrastructureapproaches, and (3) are distributed geographically throughout the targeted areas of the Mill Riverwatershed (Figure 2):
1. Elm City College Preparatory Elementary School, New Haven2. James Street, New Haven3. John S. Martinez School and Exchange Street, New Haven4. Wilbur Cross High School, New Haven5. Livingston Street at East Rock Road, New Haven6. Bartlem Recreation Area, Cheshire7. Strathmore Drive, Cheshire8. YNHH Outpatient Services, Hamden9. Whitney High School North/West, Hamden10. Counter Weight Brewery, Spring Glen Nursery, and Raccio Park Road, Hamden
The site-specific green infrastructure retrofit concepts presented in this section are intended toserve as potential on-the-ground projects for future implementation. They also provide examples ofthe types of projects that could be implemented at similar sites throughout the watershed. It isimportant to note that the concepts presented in this section are examples of potentialopportunities, yet do not reflect site-specific project designs. Individual project proponents (e.g.,municipalities, private property owners, developers) are responsible for evaluating the ultimatefeasibility of, as well as design and permitting for, these and similar site-specific concepts.
Preliminary, planning-level costs were estimated for the site-specific concepts presented in thissection. These estimates are based upon unit costs derived from published sources, engineeringexperience, and the proposed concept designs. Capital (construction, design, permitting, andcontingency) and operation and maintenance costs are included in the estimates, and totalannualized costs are presented based on the anticipated design life of each green infrastructurepractice. A range of likely costs is presented for each concept, reflecting the inherent uncertainty inthese planning-level cost estimates. A detailed breakdown of these estimated costs is included inAttachment C.
In some cases, costs are presented for multiple alternative project approaches, for example, both asubsurface infiltration option and a pervious pavement option3. Subsurface infiltration chambersare a far more expensive option, but have the benefit of increased potential infiltration capacity incertain soils and the ability to accept stormwater that is already in an underground drainagesystem, whereas pervious pavement is limited to infiltrating surface flows. Pervious pavement alsoposes increased maintenance concerns over subsurface infiltration options, as the pavement can bedamaged by snow removal operations and must be kept clean of silt and other fine materials thatwould clog the pavement and reduce its ability to infiltrate.
Where bioretention/rain gardens are recommended, pricing assumes the ‘bioretention’ rate (seeAppendix C), which utilizes contracted labor for design and implementation. Simple raingardens canalso be constructed using volunteer labor for hand-digging and planting at reduced costs thatwould be more in line with the ‘raingarden’ pricing rate (see Appendix C).
Preliminary sizing calculations are also provided for each practice and are based on the goal ofcapturing and treating/infiltrating the water quality volume (WQV), generally defined as the firstone-inch of runoff from the contributing drainage area. Approximate drainage areas are providedfor each practice within the designs, along with the expected WQV to be generated from thatdrainage area.
The table in Attachment D contains information on site characteristics and potential greeninfrastructure opportunities for the other sites visited during the field inventories that weredeemed to have good potential for green infrastructure retrofits.
3 Note that pervious pavement costs presented in the memo and in Appendix C are based upon a porousasphalt design. More decorative alternatives, such as pervious pavers, will have increased costs (seeAppendix C).
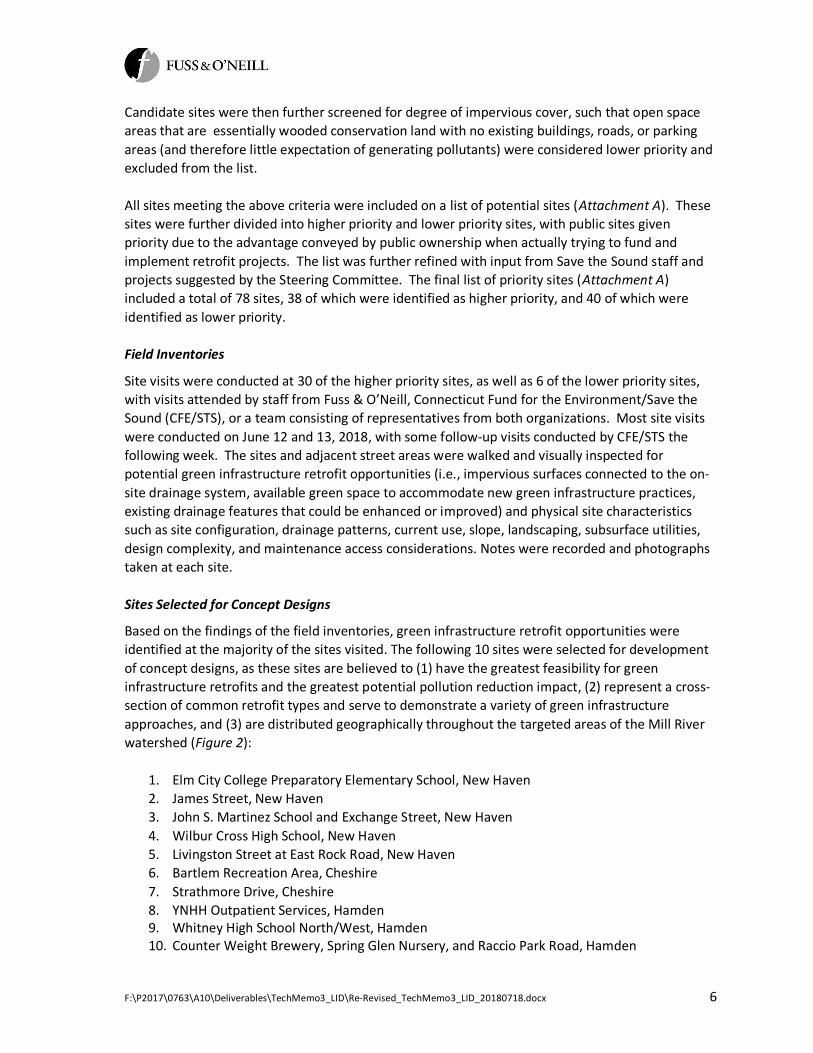
Figure 1. Maps of screening criteria. Impaired subwatersheds are outlined, while non-impaired subwatersheds are maskedin purple. On the left, parcels meeting the land ownership are outlined in black. On the right, only the subset of parcelswithin impaired watersheds is depicted; parcel color reflects the subsurface conditions: green indicates A or B soils, yellowareas are labeled as D soils, but includes areas of urban soils known to have good infiltration, and red indicates areas of Csoils or limited infiltration potential.
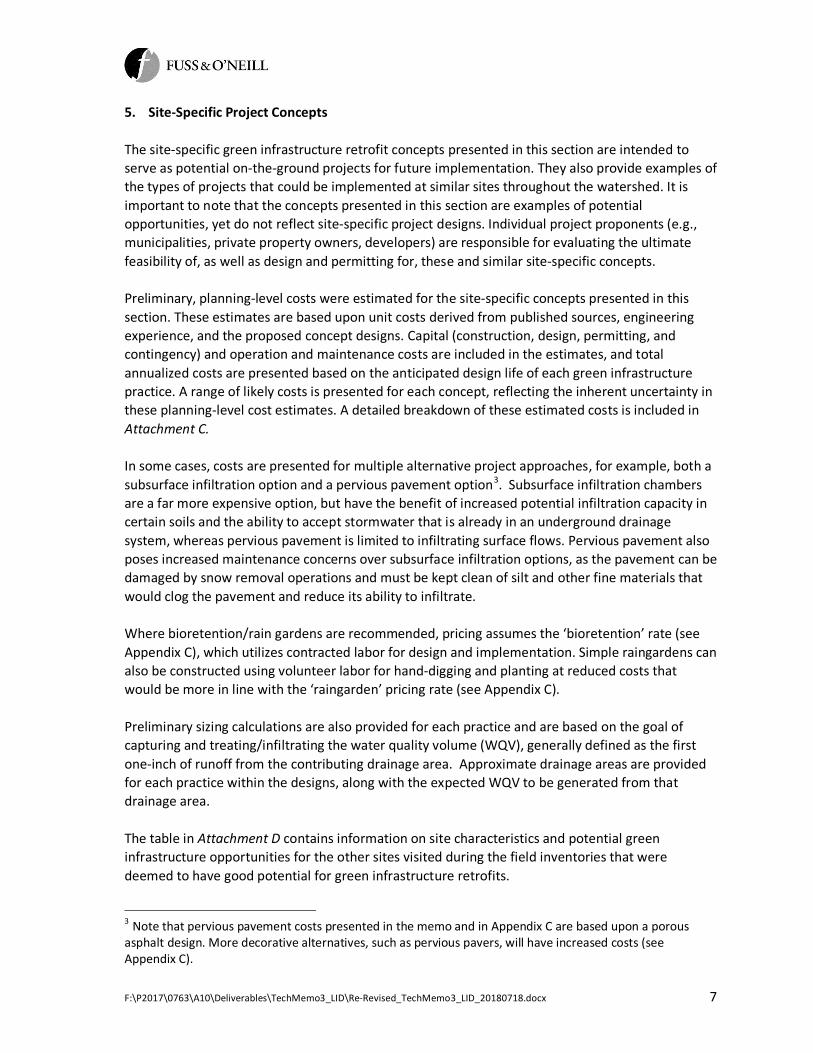
Located at 407 James Street, New Haven, Elm City Preparatory Elementary occupies anapproximately 1.5-acre site at the corner of James Street and Lombard Street, in a CSO area (CSO#009). With the exception of a 0.25-acre artificial turf field, the site is entirely impervious. Existingcatch basins capture parking lot runoff along the western edge of the lot. Downspouts from thebuilding appear to be internal and to tie in to the drainage system at the downgradient catch basinbefore connecting to the City’s stormwater infrastructure running along James Street. A brokencurb at the west edge of the parking lot is currently allowing runoff to bypass the catch basins andtravel down a short embankment to the sidewalk.
The sidewalk in front of the school along James Street is approximately 11 feet wide in most places.Planters with trees are incorporated into the sidewalk at 50 foot intervals; however, there is a treemissing directly in front of the school parking area (Figure 3).
Space is the most significant constraint at this site, as parking is tight and there is little imperviousarea. Existing street trees, a fire hydrant/water lines, and other utilities pose additional constraints.A variety of BMPs are recommended for this site in order to best achieve the following goals:maximize enhancement of curricular value in a limited space, maximize infiltration/treatmentpotential, and keep implementation costs manageable. These elements could be implemented allat once, or installed gradually as funding permits (total project costs will vary widely depending onwhich components are chosen).
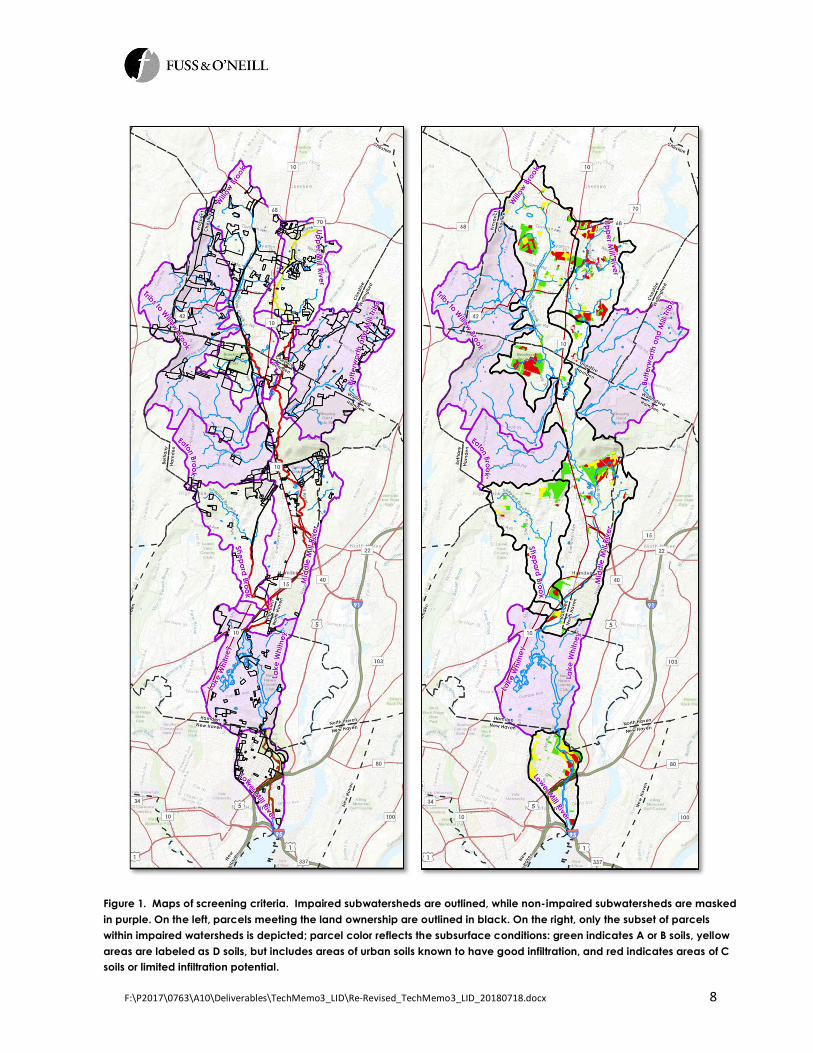
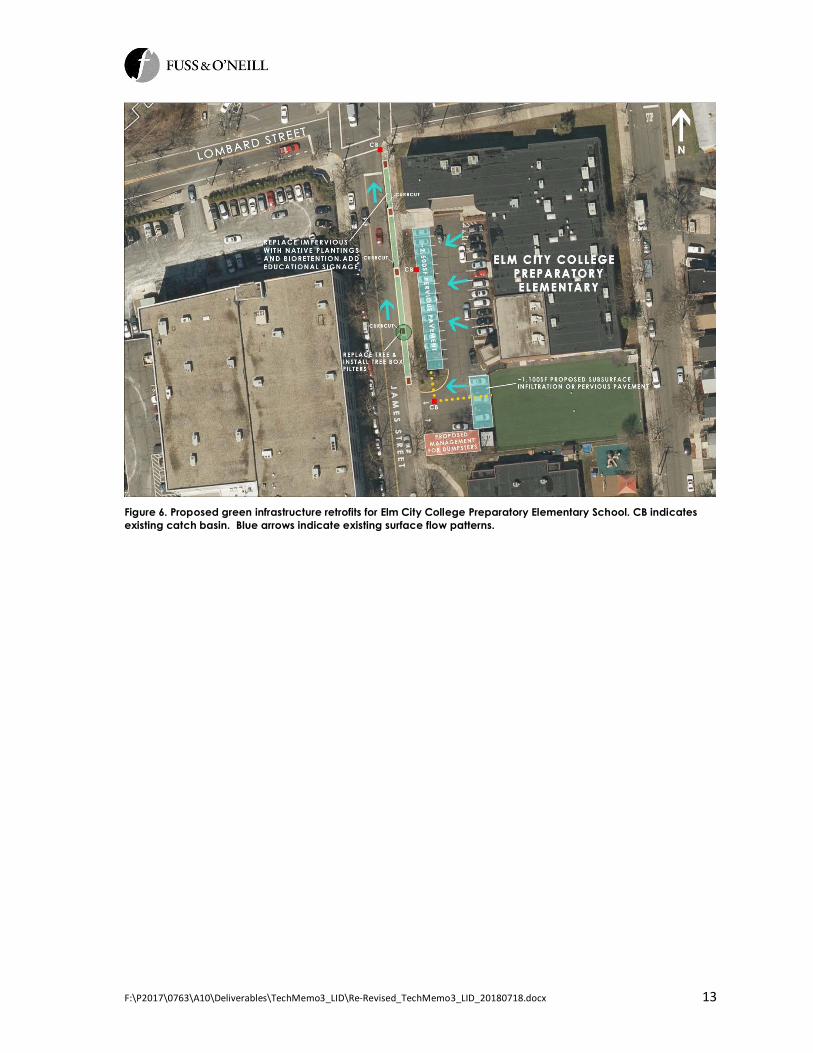
· Tree Box Filter and Bioretention/Infiltration. A tree box filter and replacement tree areproposed for the location where a tree is currently missing (Figure 3). A tree box filter designwith additional subsurface infiltration capacity is recommended (Figure 5). A curb cut fromJames Street would channel runoff from the street into the filter and infiltration system. It isalso proposed to convert five feet of sidewalk directly adjacent to the street to bioretentionareas or rain gardens with native grasses and other plantings. Additional curb cuts would directwater into these bioretention areas, which would also serve to enhance the landscape aroundthe school. These bioretention areas could be integrated into the curriculum as demonstrationsites to supplement lessons on science and the environment, and, of the BMPs proposed,would likely offer the greatest opportunity for interactive lessons (planting, maintenance, etc.).For ease of implementation and consistency with the proposed James Street design concept,the City could choose to implement their standard 5 foot by 15 foot bioswale design along thesidewalk at this location (Figure 6). Estimated Cost for Tree Box Filter: $9,000; Estimated Costper Bioswale: $20,000
· Parking Lot Retrofits. Subsurface infiltration and/or pervious pavement is proposed for theparking area (Figure 4, Figure 6) to manage stormwater falling on the parking area as well asroof runoff captured by the school’s gutters and downspouts.
o Based on available field data, using subsurface infiltration in the area adjacent to theturf play area would make it possible to intercept existing lines carrying downspoutrunoff and turf drainage without significantly reconfiguring these drainage systems(approximately 40,000sf of drainage area, and 3,200cf WQV). An 1,100sf practiceunderneath the six parking spaces adjacent to the turf field would potentially allow for
treatment of up to 4,150cf WQV. The existing downgradient catch basin located in theschool’s driveway would serve as overflow to allow any excess water to be conveyed tothe storm sewer in James Street, as is currently occurring. Note that site-specific soildrainage characteristics may allow for effective use of pervious pavement withoutadditional subsurface infrastructure, for a significantly reduced project cost (althoughthis would make it more difficult and costly to accept stormwater from roof and turfdrains and would therefore likely result in treatment of a significantly lower percentageof total site runoff). Estimated Cost: $108,000 (Subsurface infiltration); EstimatedCost: $5,000 (Pervious Pavement)
o To minimize costs, and to increase the variety of BMPs demonstrated on site, perviouspavement is proposed as the preferred option for the parking spaces parallel to JamesStreet. Converting these spaces to pervious pavement would remove 2,500sf ofpervious surface from the lot, and depending on the infiltration capacity of the soilsand precise slope of the site, may be sufficient area to effectively infiltrate the roughly800cf WQV of stormwater runoff expected from the entire 10,000sf main parking area,as the remainder of the surface slopes slightly to the west. Estimated Cost: $10,000
· Management of Dumpster Area. The school’s dumpsters are located in the southeast corner ofthe parking lot, at the top of a slope which drains to James Street. Dumpsters should always bekept closed to minimize exposure to stormwater. For additional protection, a containmentsystem consisting of spill containment grooves could be incorporated into the pavement tofurther prevent pollutants from being carried into the storm drainage system (Figure 6).Estimated Cost: $0-$1,000
Total Estimated Cost: Variable, depending on components installed.
Figure 3 Sidewalk in front of Elm City College Preparatory Elementary School, with missing tree.
Figure 6. Proposed green infrastructure retrofits for Elm City College Preparatory Elementary School. CB indicatesexisting catch basin. Blue arrows indicate existing surface flow patterns.
James Street was identified as a potential demonstration site for a “green streets” approach tostormwater retrofits in the road right-of-way. The site is proposed to begin at Elm City CollegePreparatory Elementary School (at Lombard Street), and continue south to Chapel Street. Thisportion of James Street represents a typical residential street in the Fair Haven neighborhood(Figure 7), an underserved area of New Haven. The street is also within the area served by CSO#009. In addition to providing stormwater runoff reduction and pollution control benefits, theproposed retrofits for James Street would also provide green space in the neighborhood and yieldaesthetic benefits for residents. Specific siting considerations along James Street include thefeasibility of working around existing utilities while simultaneously selecting sites with sufficientcatchment area to justify installation costs. Bioswales or bump-outs must also be sitedappropriately relative to existing catch basin infrastructure (i.e., bioswales should be located‘downstream’, ideally right before a catch basin) in order to maximize capture of stormwater andfacilitate returning overflows to the existing drainage system.
· Tree Box Filters. Additional tree box filters of the type proposed for Elm City PreparatorySchool are proposed for various locations along James Street. Obvious sites are locations wherestreet trees are missing; one such site exists on the east side of James Street, immediatelysouth of the Elm City Preparatory School. Estimated Cost: $9,000 per tree box filter
· Bump-Outs or Curbside Bioswales. Two possible types of green infrastructure are proposed toprovide bioretention along the length of James Street: bump-outs and curbside bioswales(Figure 8). Both are types of linear bioretention retrofit used alongside or within a publicstreet, designed to collect and infiltrate/treat runoff from the adjacent roadway. Thesepractices consist of a stone storage layer, a soil layer designed to filter runoff, plantings, andcurb cuts to allow runoff to enter and exit the system. Both bioswales and bump-outs are sizedto capture and treat/infiltrate the water quality volume.
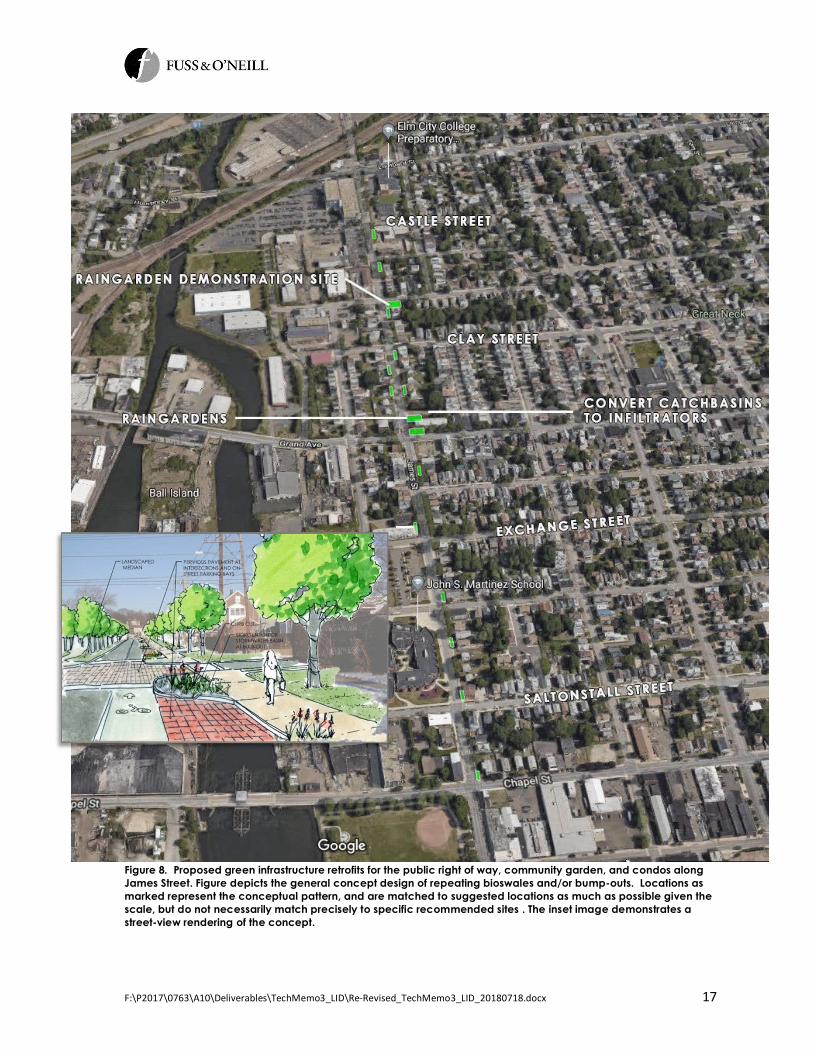
o Bioswales utilize space in the right of way, converting impervious area between thesidewalk and the street into bioretention. The City of New Haven is already installingbioswales throughout the downtown area and West River watershed, using a modifiedversion of a bioswale design developed by New York City, which has a 5-foot by 15-footfootprint. At 75sf, this design can capture and treat approximately 276cf WQV. This issufficient to capture the drainage from one side of an approximately 200ft stretch ofroad. Figure 9 shows a typical bioswale that was installed in New Haven. As withbump-outs, bioswales would be designed to accept stormwater from the street, usingcurb-cuts as an inlet, with existing downgradient catch basins serving to receive excesswater from the BMPs’ overflows.
o Bump-outs (Figure 10) would replace a portion of the existing road shoulder withbioretention areas, utilizing “No Standing” zones near intersections to interceptstormwater runoff from the road. Bump-outs serve a dual purpose as traffic calmingfeatures, which can make residential streets more friendly to pedestrians and bicycles.
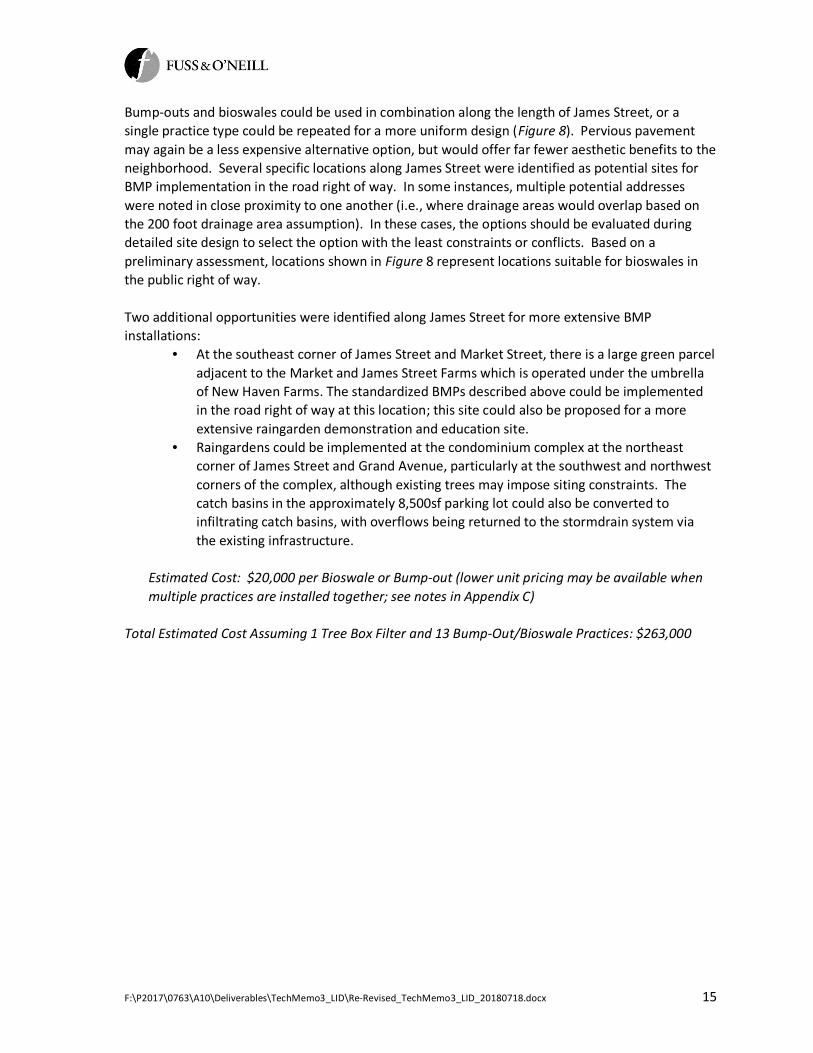
Bump-outs and bioswales could be used in combination along the length of James Street, or asingle practice type could be repeated for a more uniform design (Figure 8). Pervious pavementmay again be a less expensive alternative option, but would offer far fewer aesthetic benefits to theneighborhood. Several specific locations along James Street were identified as potential sites forBMP implementation in the road right of way. In some instances, multiple potential addresseswere noted in close proximity to one another (i.e., where drainage areas would overlap based onthe 200 foot drainage area assumption). In these cases, the options should be evaluated duringdetailed site design to select the option with the least constraints or conflicts. Based on apreliminary assessment, locations shown in Figure 8 represent locations suitable for bioswales inthe public right of way.
Two additional opportunities were identified along James Street for more extensive BMPinstallations:
· At the southeast corner of James Street and Market Street, there is a large green parceladjacent to the Market and James Street Farms which is operated under the umbrellaof New Haven Farms. The standardized BMPs described above could be implementedin the road right of way at this location; this site could also be proposed for a moreextensive raingarden demonstration and education site.
· Raingardens could be implemented at the condominium complex at the northeastcorner of James Street and Grand Avenue, particularly at the southwest and northwestcorners of the complex, although existing trees may impose siting constraints. Thecatch basins in the approximately 8,500sf parking lot could also be converted toinfiltrating catch basins, with overflows being returned to the stormdrain system viathe existing infrastructure.
Estimated Cost: $20,000 per Bioswale or Bump-out (lower unit pricing may be available whenmultiple practices are installed together; see notes in Appendix C)
Total Estimated Cost Assuming 1 Tree Box Filter and 13 Bump-Out/Bioswale Practices: $263,000
Figure 7. Existing conditions along James Street, New Haven highlighting possible locations for bioretentionpractices in the right of way along James Street.
Figure 8. Proposed green infrastructure retrofits for the public right of way, community garden, and condos alongJames Street. Figure depicts the general concept design of repeating bioswales and/or bump-outs. Locations asmarked represent the conceptual pattern, and are matched to suggested locations as much as possible given thescale, but do not necessarily match precisely to specific recommended sites . The inset image demonstrates astreet-view rendering of the concept.
Figure 9. (above)Bioswale installed in theCity of New Haven.Credit: Dawn Henning,City of New HavenEngineering
Figure 10. (left) ExampleBump-Out bioretentionplanter installed by theCity of New Haven onClinton Avenue. Credit:Dawn Henning, City ofNew Haven Engineering.
John S. Martinez School Grounds and Exchange Street
The Martinez School building is located on James Street, in the block south of Wolcott Street, whilethe parking lot and athletic fields for the school are located in the block immediately north of theschool, between Wolcott Street and Exchange Street. Like the previous two sites, the MartinezSchool and surroundings are in the area served by CSO #009. Stormwater designs for the schooland parking area median have previously been developed4, but the design proposed here focuseson the north end of the property, where the school grounds abut a proposed, future section of MillRiver Trail and a mix of residential and industrial land uses to the north.
West of Haven Street, Exchange Street has been blocked off with several large boulders to preventvehicle traffic from entering (Figure 11); this section of the roadway is proposed to become part ofthe Mill River Trail. At present, the pavement in this section is in disrepair and there is no drainageinfrastructure located along this stretch of Exchange Street. Trash and water currently collect atthe far west end of Exchange Street where the road terminates into a chain link fence with concretebarriers/wall beyond.
· Trash Clean-up. The first step to any improvement at this site should be the engagementof community volunteers in removal of trash and debris located at the west edge of thesite. This opportunity could also be used to grow interest in the site and discuss furtherimprovement options with local residents and potential project partners.
· Pavement Removal. Removal of pavement from the portion of Exchange Street west ofHaven Street and permanent closure of the road would result in a nearly 9,000 square footreduction of impervious surface, thereby reducing surface runoff and creating space fornatural infiltration. Assuming pavement is not contaminated beyond typical road surfacepollutants (e.g., petroleum products), this project could be conducted in partnership withthe City of New Haven as a stand-alone action at relatively minimal expense.
· Integrated Stormwater Treatment and Trail Improvements. Once pavement is removed,bioretention areas and trail improvements are proposed to create an aesthetically pleasingentrance point for a future segment of the Mill River trail. A series of bioretentionareas/rain gardens (Figure 12) with native plantings would be braided together with thetrail, creating an urban oasis at the edge of the Martinez school athletic fields (Figure 13).Existing storm drainage from the northern edge of the school parking lot and the catchbasin at the northeast corner of Exchange Street and Haven Street could be redirected tothe bioretention cells. Overland sheet flow from the athletic fields would also be capturedand treated. While water would be accepted along the east-west length of the system,water entering the up-gradient bioretention cells to the east would overflow into down-gradient cells further west in step-wise fashion. Preliminary information suggests that thesystem can be sized to accommodate typical precipitation events. Excess stormwaterduring extreme events could be allowed to flow overland, as is currently the case at the
4 Save the Sound, Connecticut Fund for the Environment (2012). Green Infrastructure Feasibility Scan forBridgeport and New Haven, CT.
Wilbur Cross High School is located in the East Rock neighborhood of New Haven, immediately westof the Mill River. Not including athletic facilities, the school and parking cover nearly 10 acres in theLower Mill River subwatershed. The school lies immediately northwest of CSO #012, but the schoolbuilding and parking areas addressed here are outside of the CSO area. The proposed conceptdesign focuses on the approximately 2-acre parking lot on the southeast side of the site, along withdrainage from the main portion of the high school building. It is likely that the proposed designwould also intercept surface flow from the adjacent tennis courts further to the east.
The existing parking lot features extra-long, numbered bus parking spaces along the northeast andeast perimeters of the lot. The parking layout maximizes available locations for bus parking, but indoing so, the layout creates two large dead spaces where parking is prohibited (Figure 14), both ofwhich are located in the northeast corner of the lot. Each of these locations coincides with thelocation of existing catch basins. A double catch basin in the corner of the lot is the mostdowngradient collection point and outfalls directly to the Mill River approximately 10 feet belowthe parking lot grade. Roof drainage from the east side of the building appears to be connectedinto the drainage system at the catch basin located in the middle of the eastern edge of the parkinglot.
· Parking Lot Bioretention. Proposed retrofits include the removal of pavement from the two‘dead spaces’ (approximately 830sf and 870sf) in the northeast corner of the lot and conversionto bioretention to accept surface flows across the parking lot. Of the 6,900cf WQV anticipatedfrom the approximately 87,000sf parking lot, the two bioretention areas would treat up to upto 6,200cf (90%) of WQV (Figure 15).Estimated Cost: $79,000
· Subsurface Infiltration. An additional 900sf of subsurface infiltration along the eastern edge ofthe lot would utilize the existing mid-lot catch basin as an inlet to intercept roof drainage fromthe approximately 44,000sf of building footprint, infiltrating up to 3,400cf WQV out of theapproximately 3,500cf WQV expected . The next catch basin downgradient would serve as anoutlet to channel excess water back into the drainage system, and the existing double catchbasin would serve as an overflow outlet to the Mill River for the entire retrofit system.Estimated Cost: $89,000
Figure 13. Proposed green infrastructure retrofits for Wilbur Cross High School. Red squares indicate existing catchbasins. Blue arrows indicate existing surface flow patterns.
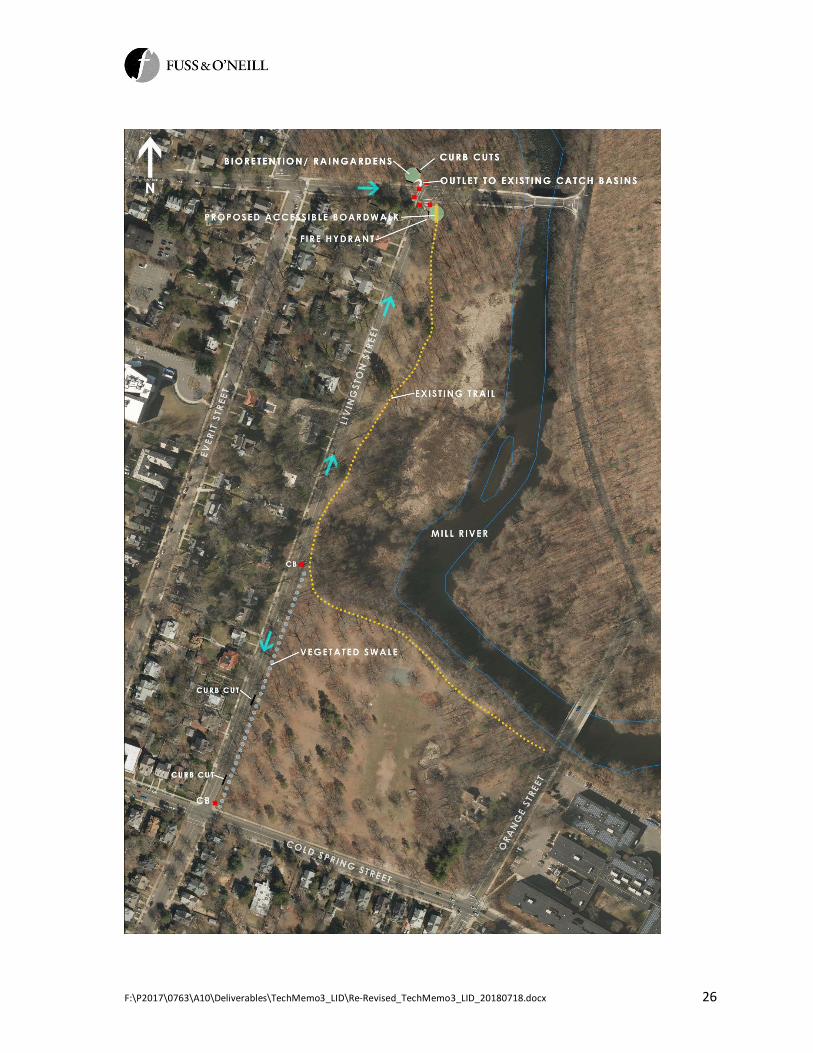
Livingston Street at East Rock Road
East Rock Park begins just south of Lake Whitney and follows the Mill River for over 1.5 miles. Onthe east side of the river, the park provides a buffer for the river that is generally wooded and atleast 0.2 miles wide. On the west side of the river, the park is much narrower and less heavilywooded; the proposed concept design focuses on this side of the park, particularly the borders ofthe park that follow Livingston Street and East Rock Road.
An existing walking trail follows the park edge along Livingston Street (Figure 16). Scattered catchbasins along Livingston Street intercept flow from the street and carry it north toward East RockRoad. At East Rock Road, storm drains from Livingston Street join with the storm drain under EastRock Road and carry runoff east to the Mill River. The outfall for this system is located north of theEast Rock Road bridge.
While the park occupies the land east of Livingston Street, the west side of the street is residential.Many downspouts appear to be connected to the drainage system, though others weredisconnected.
· Vegetated Infiltration Swale. A short wooden fence runs along the east side of LivingstonStreet beginning at the intersection with Cold Spring Street and following the road northwardfor approximately 850 feet. A vegetated swale is proposed to promote infiltration along thisstretch of Livingston, using curb cuts spaced along the swale to accept approximately 1,200cfWQV of stormwater from approximately 15,000sf of drainage area consisting of thenorthbound lane of Livingston Street. Estimated Cost: $61,000
· Bioretention Landscaping and Trail Enhancement. A storm drain in the center of theintersection of Livingston Street and East Rock Road currently accepts stormwater flows fromall four corners of the intersection, as well as flows from further west on East Rock Road. Tworaingardens/bioretention areas are proposed to accept stormwater from Livingston Street, EastRock Road, and East Rock Park Road via curbcuts located just upgradient of the existing catchbasins.
o One raingarden/bioretention area would be located on the northwest corner of theintersection (with approximate area of 250sf and capacity to capture and treatapproximately 900cf WQV). The northwest raingarden/ bioretention area would servea drainage area of approximately 10,000sf (800cf WQV), consisting of the north side ofEast Rock Road between Livingston Street and Everit Street, as well as a portion of thesouth side of East Rock Park Road. The BMP is proposed with an overflow structurethat would carry excess stormwater back to one of the existing catch basins.
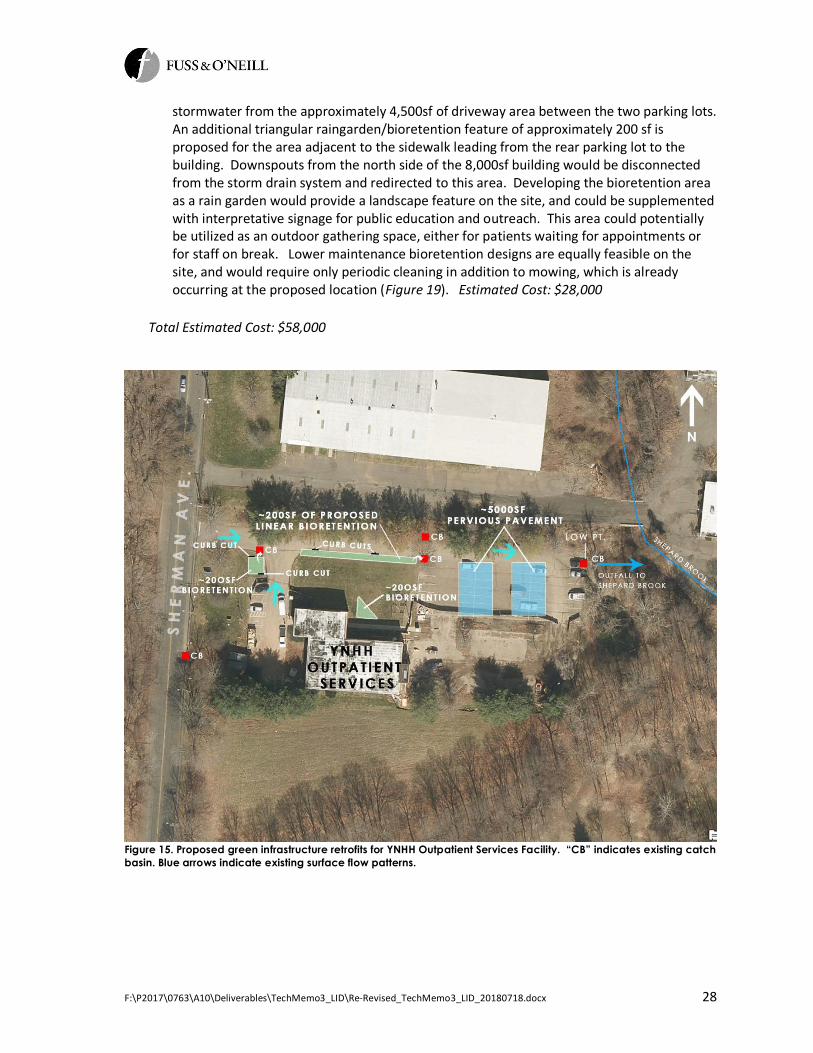
o A second raingraden/ bioretention area on the southeast corner of the intersection(with approximate area of 300sf and capacity to capture and treat approximately1,100cf WQV) would be located in existing open green space among trees to minimizeroot and tree impacts (Figure 18). Stormwater would enter the BMP from a curbcutlocated just south of the existing fire hydrant and upgradient of the existing catch basin
on the east side of Livingston Road. The BMP would capture stormwater from the eastside of Livingston Street from the mid-block catch basin to the curb cut, an area ofapproximately 14,000sf (1,100cf WQV). In order to preserve the existing trail, an ADAcompliant boardwalk feature would allow pedestrians to connect from the cornersidewalk to the existing walking trail in the park, crossing over theraingarden/bioretention area (Figure 17). Additional interpretive signage would beadded to the existing park sign already in place at the southeast corner of LivingstonStreet and East Rock Road to enable the stormwater features to serve as an educationand outreach site. The raingarden/bioretention area is proposed to contain anoverflow structure that allows excess stormwater to sheetflow across vegetated land tothe south and east.
o Estimated Cost: $31,000 (consisting of $26,000 for bioretention areas and $5,000 fortrail enhancement)
Figure 14. Existing conditions at Livingston Street (foreground) and East Rock Road, showing open space wherebioretention is proposed and the existing walking trail.
Figure 17. Proposed bioretention area and trail improvements in East Rock Park.
Figure 18. Proposed green infrastructure retrofits for Livingston Street at East Rock Road. “CB” indicates existingcatch basin. Blue arrows indicate existing surface flow patterns.
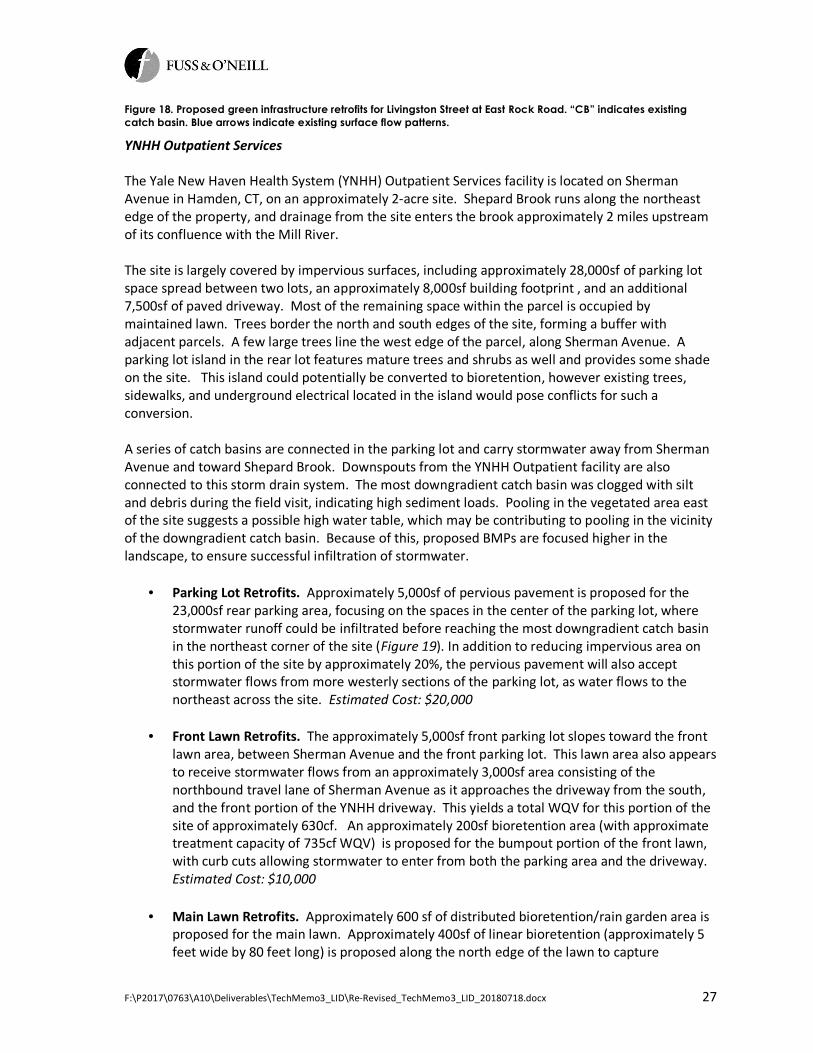
YNHH Outpatient Services
The Yale New Haven Health System (YNHH) Outpatient Services facility is located on ShermanAvenue in Hamden, CT, on an approximately 2-acre site. Shepard Brook runs along the northeastedge of the property, and drainage from the site enters the brook approximately 2 miles upstreamof its confluence with the Mill River.
The site is largely covered by impervious surfaces, including approximately 28,000sf of parking lotspace spread between two lots, an approximately 8,000sf building footprint , and an additional7,500sf of paved driveway. Most of the remaining space within the parcel is occupied bymaintained lawn. Trees border the north and south edges of the site, forming a buffer withadjacent parcels. A few large trees line the west edge of the parcel, along Sherman Avenue. Aparking lot island in the rear lot features mature trees and shrubs as well and provides some shadeon the site. This island could potentially be converted to bioretention, however existing trees,sidewalks, and underground electrical located in the island would pose conflicts for such aconversion.
A series of catch basins are connected in the parking lot and carry stormwater away from ShermanAvenue and toward Shepard Brook. Downspouts from the YNHH Outpatient facility are alsoconnected to this storm drain system. The most downgradient catch basin was clogged with siltand debris during the field visit, indicating high sediment loads. Pooling in the vegetated area eastof the site suggests a possible high water table, which may be contributing to pooling in the vicinityof the downgradient catch basin. Because of this, proposed BMPs are focused higher in thelandscape, to ensure successful infiltration of stormwater.
· Parking Lot Retrofits. Approximately 5,000sf of pervious pavement is proposed for the23,000sf rear parking area, focusing on the spaces in the center of the parking lot, wherestormwater runoff could be infiltrated before reaching the most downgradient catch basinin the northeast corner of the site (Figure 19). In addition to reducing impervious area onthis portion of the site by approximately 20%, the pervious pavement will also acceptstormwater flows from more westerly sections of the parking lot, as water flows to thenortheast across the site. Estimated Cost: $20,000
· Front Lawn Retrofits. The approximately 5,000sf front parking lot slopes toward the frontlawn area, between Sherman Avenue and the front parking lot. This lawn area also appearsto receive stormwater flows from an approximately 3,000sf area consisting of thenorthbound travel lane of Sherman Avenue as it approaches the driveway from the south,and the front portion of the YNHH driveway. This yields a total WQV for this portion of thesite of approximately 630cf. An approximately 200sf bioretention area (with approximatetreatment capacity of 735cf WQV) is proposed for the bumpout portion of the front lawn,with curb cuts allowing stormwater to enter from both the parking area and the driveway.Estimated Cost: $10,000
· Main Lawn Retrofits. Approximately 600 sf of distributed bioretention/rain garden area isproposed for the main lawn. Approximately 400sf of linear bioretention (approximately 5feet wide by 80 feet long) is proposed along the north edge of the lawn to capture
stormwater from the approximately 4,500sf of driveway area between the two parking lots.An additional triangular raingarden/bioretention feature of approximately 200 sf isproposed for the area adjacent to the sidewalk leading from the rear parking lot to thebuilding. Downspouts from the north side of the 8,000sf building would be disconnectedfrom the storm drain system and redirected to this area. Developing the bioretention areaas a rain garden would provide a landscape feature on the site, and could be supplementedwith interpretative signage for public education and outreach. This area could potentiallybe utilized as an outdoor gathering space, either for patients waiting for appointments orfor staff on break. Lower maintenance bioretention designs are equally feasible on thesite, and would require only periodic cleaning in addition to mowing, which is alreadyoccurring at the proposed location (Figure 19). Estimated Cost: $28,000
Total Estimated Cost: $58,000
Figure 15. Proposed green infrastructure retrofits for YNHH Outpatient Services Facility. “CB” indicates existing catchbasin. Blue arrows indicate existing surface flow patterns.
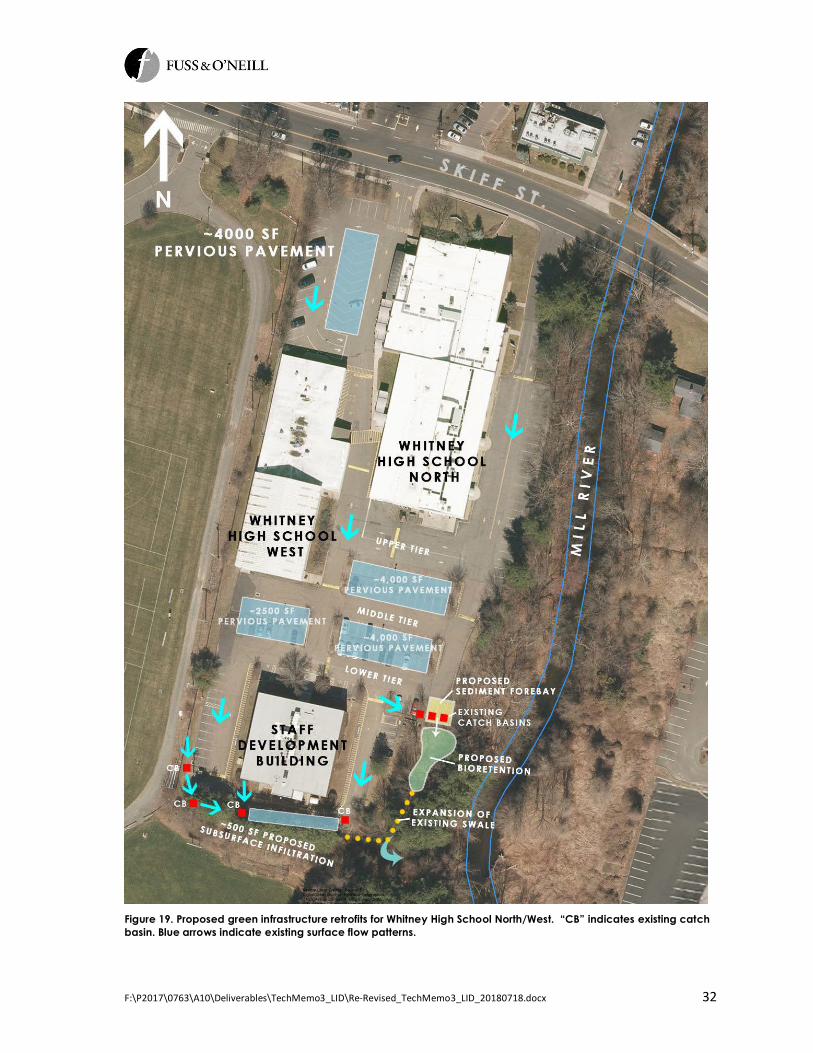
Area Cooperative Educational Services (ACES) operates two special education programs out of itsWhitney High School North and West campuses, located immediately west of the Mill River on SkiffStreet in New Haven. The Whitney North/West campus is an approximately 5-acre site, which isnearly 100% impervious. Three buildings are located on the site, which slopes from Skiff Streetdown toward the south end of the site and also east toward the Mill River. Parking is terraced,creating three separate tiers along the north/south gradient (Figure 20).
Existing east-west oriented parking islands separate the tiers; these islands are narrow and steeplysloped, making them unlikely candidates for green infrastructure practices. Existing curb cuts atthe ends of these islands carry water from one tier down to the next, with stormwater eventuallyflowing to catch basins along the southern edges of the parking areas. Downgradient catch basinsare assumed to outfall directly to the Mill River, on the far side of a chain-link fence which followsthe eastern edge of the parcel.
The southeast corner of the site, adjacent to the Staff Development Building, currently contains araised bed garden area, picnic table, and composter. A gravel swale appears to carry excessstormwater from a low point in that area to the south edge of the site and toward the Mill River.
· Parking Lot Retrofits and Bioretention. A combination of subsurface infiltration, perviouspavement, and bioretention is proposed to reduce stormwater runoff from the extensiveparking areas on the site and provide a variety of green infrastructure demonstration sitesfor curricular value.
o Approximately 14,500sf of pervious pavement is proposed in the front parking lotand upper and middle tier parking areas of the main lot to reduce impervious coveron the site and infiltrate runoff from the upper two tiers of parking. EstimatedCost: $58,000
o Approximately 500sf of subsurface infiltration is proposed to be located behind theStaff Development Building, intercepting flow from the existing catch basins at thelow end of the parking lot, infiltrating approximately 1,800cf WQV, and returningexcess stormwater to the existing drainage system at the east end of the practice(Figure 21). This practice would be designed to capture drainage from anapproximately 20,000sf area including the parking area surrounding the StaffDevelopment Building and redirected drainage from the building (approximately1,600cf of WQV). Estimated Cost: $47,000
o Approximately 800sf of bioretention is proposed in the southeast-most corner ofthe parking lot, requiring the removal of two parking spaces (Figure 22). Existingcatch basins in this location would be raised to serve as overflow structures. Asediment forebay is proposed for the first bioretention cell (to be located in theexisting parking area) in order to minimize required maintenance of thedowngradient bioretention area. From the sediment forebay, water would flow toa landscape feature that winds through the existing picnic/garden area, avoidingexisting trees, and connecting to the existing gravel swale (Figure 23). The
bioretention area would accept water flowing down the campus driveway, as wellas flow from the lower tier parking area, including any overflow from the uppertiers (approximately 1 acre of drainage area or 3,500cf of WQV). The bioretentionsystem would be designed to capture approximately 3,000cf WQV. Building onexisting uses in this area which appear to emphasize environmentally-friendlypractices (e.g., composting, raised bed gardening), the bioretention system couldprovide educational opportunities for students and staff in the form of signageand/or curricular connections. Estimated Cost: $38,000
Total Estimated Cost: $143,000
Figure 16. Tiered parking, with existing conveyances that transport stormwater from the upper tiers to lower tiers.
Figure 17. Proposed location for subsurface infiltration behind the Staff Development Building. The downgradientcatch basin (near the dumpster) would serve as an overflow for the system and outfalls to the Mill River.
Figure 19. Proposed green infrastructure retrofits for Whitney High School North/West. “CB” indicates existing catchbasin. Blue arrows indicate existing surface flow patterns.
Counter Weight Brewery, Spring Glen Nursery, and Raccio Park Road
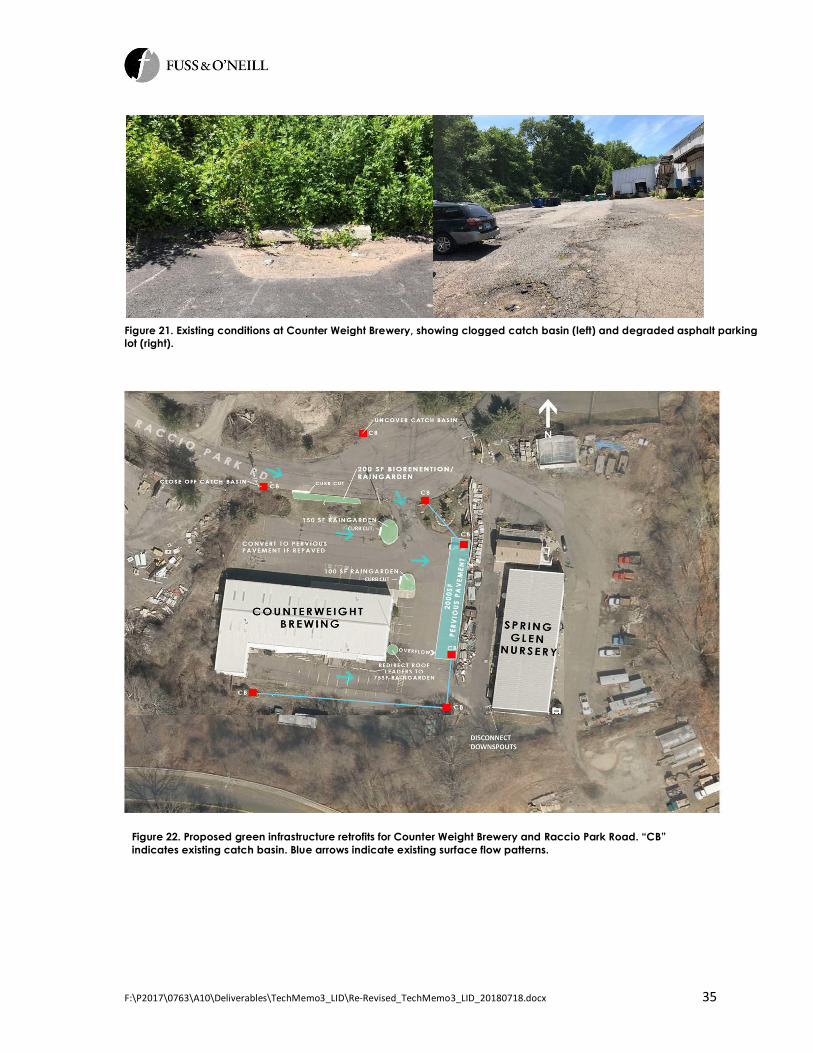
Counter Weight Brewery is located along the south side of Raccio Park Road, within approximately500 feet of Shepard Brook. The building and lot occupy approximately 1-acre (Figure 24, Figure 25),with the adjacent portion of Raccio Park Road and circular turnaround adding 0.25-acres ofadditional drainage area. The parcel between the brewery and Shepard Brook is occupied by SpringGlen Nursery.
The roof drains on the brewery building are currently connected to the storm drainage system. Aseries of five catch basins in the circle and along the eastern and southern edges of the propertytransport stormwater away from the site, presumably to an outfall on Shepard Brook. Note thatwhile most of this site is mapped as B soils (good infiltration), the southern edge of the site isindicated to be D soils, so additional soil testing will be especially necessary at this site in order tomore precisely determine the infiltration capacity of the soils.
Existing parking lots are in poor condition, and catch basins on site were clogged with silt anddebris. Existing vegetated areas and parking islands on the brewery property do not appear toreceive regular maintenance, whereas planting areas on the nursery property were obviouslyreceiving regular care.
· Bioretention Area/Rain Gardens. A series of bioretention areas/rain gardens are proposedfor the site:
o A series of three distributed bioretention areas/raingardens are proposed withinCounter Weight Brewery’s parking area. A 150sf bioretention area/rain garden isproposed in the existing island bumpout at the northeast edge of the front parkinglot; this practice would accommodate capture of approximately 550cf of WQV andwould accept stormwater flows from a portion of the 7,500sf front parking lot (withassociated 600cf of WQV). A second 100sf bioretention area is proposed in theexisting island bump-out at the southeast edge of the front parking lot; this practicewould accommodate approximately 370cf of WQV. In addition to accepting surfacerunoff from the front parking lot, this practice could potentially receive flow fromredirected roof leaders. A third 75sf bioretention area/rain garden is proposed forthe existing vegetated bumpout at the southeast corner of the building. Thispractice could accommodate approximately 275cf of WQV and would be designedto accept flow from redirected roof leaders, with a potential roof catchment areaof approximately 4,500sf (354cf of WQV). Overflow from this bioretention areawould be directed overland toward the existing catch basin and proposed perviouspavement (see below). Estimated Cost: $16,000 (assuming all three areas); costsfor individual practices range from $4,000 to $7,000
o A 200sf linear bioretention area along the southern edge of Raccio Park Roadwould accept stormwater runoff from the road via a curb cut on the western end ofthe feature (Figure 26), with the potential to capture and treat approximately 735cfof WQV. To increase the drainage area, the upgradient catch basin west of thepractice should be closed off; this would direct approximately 5,500sf of drainagearea to the practice (with corresponding 435cf of WQV). While the green spacebetween the brewery and nursery driveways and the bumpout areas mentioned
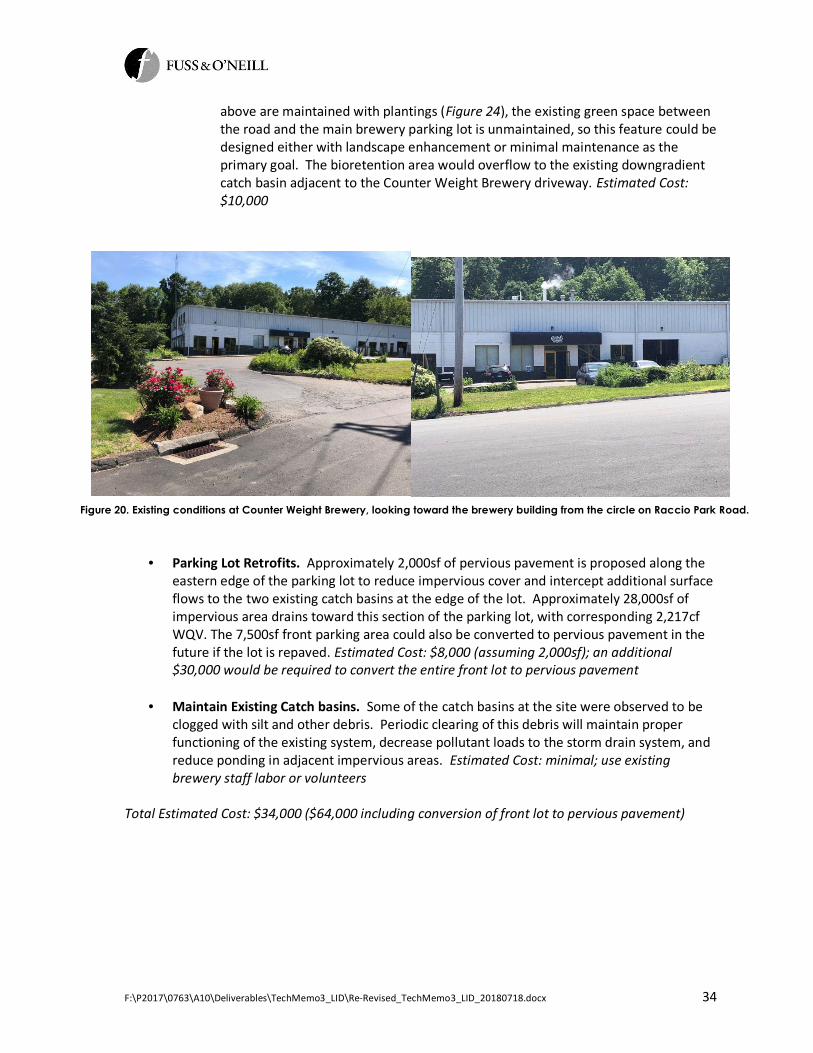
above are maintained with plantings (Figure 24), the existing green space betweenthe road and the main brewery parking lot is unmaintained, so this feature could bedesigned either with landscape enhancement or minimal maintenance as theprimary goal. The bioretention area would overflow to the existing downgradientcatch basin adjacent to the Counter Weight Brewery driveway. Estimated Cost:$10,000
· Parking Lot Retrofits. Approximately 2,000sf of pervious pavement is proposed along theeastern edge of the parking lot to reduce impervious cover and intercept additional surfaceflows to the two existing catch basins at the edge of the lot. Approximately 28,000sf ofimpervious area drains toward this section of the parking lot, with corresponding 2,217cfWQV. The 7,500sf front parking area could also be converted to pervious pavement in thefuture if the lot is repaved. Estimated Cost: $8,000 (assuming 2,000sf); an additional$30,000 would be required to convert the entire front lot to pervious pavement
· Maintain Existing Catch basins. Some of the catch basins at the site were observed to beclogged with silt and other debris. Periodic clearing of this debris will maintain properfunctioning of the existing system, decrease pollutant loads to the storm drain system, andreduce ponding in adjacent impervious areas. Estimated Cost: minimal; use existingbrewery staff labor or volunteers
Total Estimated Cost: $34,000 ($64,000 including conversion of front lot to pervious pavement)
Figure 20. Existing conditions at Counter Weight Brewery, looking toward the brewery building from the circle on Raccio Park Road.
Figure 22. Proposed green infrastructure retrofits for Counter Weight Brewery and Raccio Park Road. “CB”indicates existing catch basin. Blue arrows indicate existing surface flow patterns.
Figure 21. Existing conditions at Counter Weight Brewery, showing clogged catch basin (left) and degraded asphalt parkinglot (right).
This large municipal park is located on CT 10 (South Main Street) in Cheshire, directly across fromCheshire High School. The site is owned by the Town of Cheshire and includes lacrosse, baseball,and soccer fields, as well as a covered swimming facility and multiple parking areas. Most of thestormwater from the site drains to an approximately 36-inch outfall at the southern end of theproperty. These parking areas and structures comprise approximately 5-acres of directly connectedimpervious cover on the site. An additional 1.75-acres of maintained athletic field area likelycontributes surface flows to the storm sewer system during heavy rains.
Existing catch basins are located behind the swimming pool and appear to capture overflows fromthe pool decks as well as stormwater runoff. Additional catch basins are located in the northernparking lot, on either side of the driveway, and in the lawn between the baseball field andswimming pool parking lot (Figure 27). The catch basin located at the southwest corner of theswimming pool parking lot appears to be the most downgradient catch basin before stormwateroutfalls into the Mill River. An existing gravel swale carries additional overland runoff from thebaseball diamond, along the south edge of the ball field, into a catch basin located in the grassadjacent to the parking lot, and ultimately through the parking lot catch basin to the outfall.
· Linear Bioretention. An existing short fence runs along the north edge of the baseball field,creating a lawn area approximately 15 feet wide between the fence and the curbeddriveway of the recreation area (Figure 28). This space is currently utilized for eventparking. Approximately 300sf of linear bioretention is proposed toward the east end of thisspace to treat stormwater runoff from the driveway while preserving as much parking aspossible (Figure 29). A curb cut will allow stormwater to flow from the road (approximately14,000sf of drainage area, with 1,100cf WQV) into the proposed bioretention beforereaching the existing catch basin. As the landscape slopes slightly to the east, check damsare proposed as part of the design to slow the movement of water through thebioretention feature. The bioretention area can be designed to overflow either to theexisting catch basin or the proposed water quality swale (below). Estimated Cost: $14,000
· Vegetated Water Quality Swale. A second linear feature (2,500sf) is proposed betweenthe baseball field and the swimming pool parking lot, on top of the existing storm drainagepipes. Existing catch basins would be raised to serve as overflow structures during heavyrains, and a vegetated swale is proposed along the length of the parking lot to infiltratesurface runoff from the 44,000sf of uncurbed parking lot (with accompanying 3,500cf ofWQV) and adjacent ball field (expected to generate, at minimum, an additional 350cf ormore of WQV) (Figure 29). Effectiveness of the swale could be further enhanced by re-grading the parking lot whenever it is next repaved to encourage stormwater to flowtoward the swale. Drainage from the pool roof could potentially be directed toward theswale as well, although it was not clear from the site visit how pool roof drainage iscurrently handled. Estimated cost: $36,000
· Pervious Pavement. 15,000sf of pervious pavement is proposed for the middle two rowsof parking in the north parking lot. This conversion to pervious pavement would reduce theimpervious surface of the 50,000sf lot by nearly 30% and decrease the volume ofstormwater inputs to the existing drainage system. Estimated Cost: $60,000
Figure 23. Existing catch basins at the edge of the swimming pool parking lot at Bartlem Recreation Area.The space between the parking lot and ball field is proposed for conversion to a vegetated swale.
Figure 24. Roadside area proposed for linear bioretention.
· Bioretention/Rain Garden. A bioretention area/rain garden and native planting areaof up to 1,500sf is proposed for the lawn area between the circular drive in front ofthe swimming pool and the swimming pool parking lot. A curb cut in the circle wouldallow stormwater to flow into the rain garden, with the existing catch basin servingas an overflow to direct excess stormwater back into the drainage system. A 300sfbioretention area is proposed to capture and treat runoff from the approximately
12,000sf of impervious drainage area (approximately 950cf of WQV) that wouldconnect to the BMP via the proposed curb cut in the circle. Remaining area in thisplanting island should be converted to native plantings. Due to its location near thepool entrance, this would likely be the most visible location at which to includeeducational information about the full suite of proposed green infrastructurecomponents suggested for the site. Estimated Cost: $14,000 (assuming 300sf ofbioretention; additional funds (or plant donations) may be required for nativeplantings to fill the entire island)
Strathmore Drive is located in a residential subdivision in Cheshire that lies just east of the MillRiver, across the river from the Bartlem Recreation Area and south of Wallingford Road. Anunnamed tributary of the Mill River winds through the neighborhood.
Green spaces were required to be created during the development of the subdivision. Two suchsites are located on Strathmore Drive, between the two ends of Buttonwood Circle. A playground
occupies the green space to the west side of Strathmore Drive; on the east side of the street, theexisting green space consists of a semi-circular lawn area bordered by bermed planting areas thatinclude mature evergreen trees and shrubs (Figure 30). Beyond the berms is another area of lawnthat backs up to residential lawns from homes on Buttonwood Circle. To the southeast, this areameets up with a wooded buffer through which the unnamed tributary stream passes through theneighborhood. The area, including the lawn and bermed planting areas, is currently maintained bythe Homeowner’s Association via a landscaping contractor.
· Public Green Space Retrofit. Although located adjacent to a high point on StrathmoreDrive, the semi-circular lawn forms a natural bowl in the landscape, and could be convertedto an approximately 500sf bioretention area to collect and infiltrate runoff fromapproximately 11,000sf of catchment area on Strathmore Drive and portions ofButtonwood Circle (with corresponding 900cf of WQV) (Figure 31). Water could beredirected from catch basins on Strathmore Drive that are located at each end of the greenspace and directed into the bioretention area to either infiltrate or ultimately be releasedback into the tributary stream via an overflow swale. More detailed site survey is necessaryto confirm feasibility, but available contour/elevation data indicates between a 5% and 8%slope from the catch basin locations to the depression/proposed bioretention area. It mayalso be possible to direct roof leaders from houses that back up to the green space into thebioretention area. If desired, the bioretention area could be designed as a rain garden toenhance the existing landscape features of this space. Estimated Cost: $24,000
Total Estimated Cost: $24,000
Figure 26. Sidewalk along Strathmore Drive and public lawn area, with bermed plantings in background.
Green Infrastructure Retrofit Screening ResultsPotential Retrofit Sites
Site Name MunicipalityImpaired Segment Ownership
Hydrologic Soil Group Priority Level Sewer Type
1st Presbyterian New Haven Y Private A Lower Separate350 Chapel St, Suzio York Hill New Haven Y Private B Lower Separate
Ball & Socket Arts Cheshire Y Private B Lower SeparateBartlem Rec Area Cheshire Y Public B Higher Separate
Bates Dr Cheshire Y ROW B Higher SeparateBehind China Buffet, Route 10 Hamden Y Private B Lower Separate
Bromley Ct Hamden Y ROW B Higher SeparateCelentano/Yale Divinity New Haven Y Private D Lower Separate
Cheshire Academy Cheshire Y Private B Lower SeparateCheshire HS/Municipal Cheshire Y Public D Higher Separate
Cheshire Lutheran Cheshire Y Private A Lower SeparateCheshire Public Safety Cheshire Y Public B Higher SeparateCheshire Public Works Cheshire Y Public D Lower Separate
Cheshire Schools HQ/St Peters Cheshire Y Public/Private B Higher SeparateCheshire United Methodist Cheshire Y Private B Lower Separate
Corporate Park, Raccio Park Road Hamden Y ROW B Higher SeparateCovenant Evangelical New Haven Y Private A Lower Combined
Criscuolo Park New Haven Y Public C Lower CombinedCT Bus Depot New Haven Y Private D Lower Separate
CT10 in Cheshire/Big Y Cheshire Y ROW/Private D Lower SeparateDixwell Ave Hamden Y ROW B/D Higher Separate
Dixwell/Shepard/Skiff Hamden Y ROW D Higher SeparateEast Rock Neighborhood New Haven Y ROW A Higher Separate
Eli Whitney Museum Hamden N Public C Lower SeparateElim Park Retirement Community Cheshire Y Private B Lower Separate
Farnam Court New Haven Y Public D Higher SeparateFoote School New Haven Y Public D Lower Separate
Foster Day School North Haven Y Private B Lower SeparateHamden Hall Hamden N Private D Lower Separate
Hamden Municipal Campus (including Middle School) Hamden Y ROW/Public A Higher SeparateHamden Public Works garages Hamden Y Public B Higher Separate
Hooker Elementary New Haven Y Public A Higher SeparateIndustrial park Cheshire Y ROW B/D Higher SeparateJames Street New Haven Y ROW B/D Higher Combined
Jinny Hill, King, Mansion Cheshire Y ROW/Private B Lower SeparateJocelyn Sq New Haven Y Public D Higher Separate
John S Martinez Magnet School New Haven Y Public B Higher CombinedLegion Field Hamden Y Public B Higher Separate
Livingston St @ Cold Spring New Haven Y ROW A Higher SeparateLivingston St @ East Rock New Haven Y ROW A Higher Separate
Mill River Daycare/Elm City College Preparatory Elementary School New Haven Y Public D Higher Combined
List of Potential Sties for Green Infrastructure Retrofits: Mill River Watershed
Page 1 of 2
Site Name MunicipalityImpaired Segment Ownership
Hydrologic Soil Group Priority Level Sewer Type
List of Potential Sties for Green Infrastructure Retrofits: Mill River Watershed
New Haven CC Hamden N Private B Lower SeparateNorton School Cheshire Y Public B Higher Separate
Oak Ave, Rustic Ln Cheshire Y Land Trust B Lower SeparateOlin Powder Farm Hamden N Land Trust A Lower SeparateOrange/Humphrey New Haven Y ROW D Higher Combined
Our Lady of Mt Carmel campus Hamden Y Private B Lower SeparateQuinnipiac Parking Lot Hamden Y Private B Lower SeparateQuinnipiac University Hamden Y Private B Lower Separate
Radiall America New Haven Y Private C Lower SeparateRidge Road Elementary North Haven Y Public B/D Higher Separate
Southwick Condominimum Complex/Thompson Gardens West Cheshire Y Private A Lower SeparateSpring Glen School Hamden Y Public D Higher Separate
St Bridget's Cheshire Y Private B Lower SeparateSt Joseph Catholic New Haven Y Private A Lower Separate
St Stanislaus New Haven Y Private A Lower CombinedSt Thomas New Haven N Private A Lower Separate
St Thomas Becket Church Cheshire Y Private B Lower SeparateStrathmore Dr Cheshire Y ROW B Higher Separate
First Unitarian Universal Church New Haven Y Private A Lower SeparateUnited Church New Haven Y Private A Lower Combined
United Church/Temple Beth Sholom Hamden Y Private B Lower SeparateUnited Way New Haven Y Private D Lower Combined
USPS Hamden Y ROW B Higher SeparateWalnut St Mill River St New Haven Y Private D Lower Combined
Washington Ave Hamden Y ROW D Higher SeparateWentworth's Hamden Y Private A Lower Separate
West Woods Bible Chapel Hamden N Private B Lower SeparateWhitney / Washington ROW Hamden Y ROW B Higher Separate
Whitney HS East Hamden Y Public D Higher SeparateWhitney HS North/West Hamden Y Public D Higher Separate
Wilbur Cross HS/Athletic Complex New Haven Y Public D Higher SeparateWillow St and Mitchell Dr New Haven Y Private D Lower Combined
Wooster Square Neighborhood New Haven Y ROW D Higher SeparateWorthington Hooker School New Haven Y Public A Higher Separate
YNHH Outpatient Hamden Y Private B Higher SeparateZentek Farms Cheshire Y Private A Higher Separate
** Blue shading indicates sites where field visits were conducted