Enclosure 1 is to be Withheld from Public Disclosure under 10 CFR 2.390. When Enclosure 1 is removed, this letter is decontrolled. Tennessee Valley Authority, Post Office Box 2000, Spring City, Tennessee 37381-2000 January 24, 2011 10 CFR 50.4 U.S. Nuclear Regulatory Commission ATTN: Document Control Desk Washington, D.C. 20555-0001 Watts Bar Nuclear Plant, Unit 2 Docket No. 50-391 Subject: WATTS BAR NUCLEAR PLANT (WBN) - UNIT 2 - FINAL SAFETY ANALYSIS REPORT (FSAR), SECTION 2.4, "HYDROLOGIC ENGINEERING" The purpose of this letter is to provide anticipated changes to FSAR Section 2.4, "Hydrologic Engineering." This information is being submitted in advance of FSAR Amendment 103 in order to facilitate NRC review. Enclosure 1 provides these changes to Sections 2.4.4, 2.4.11, and 2.4.14 (indicated by revision bars), along with only the figures that have been either added or replaced. Deleted figures have also been identified. However, one figure provided in Enclosure 1 contains security-related information identified by the designation, "Security-Related Information - Withhold Under 10 CFR 2.390." TVA hereby requests Enclosure 1 be withheld from public disclosure in accordance with the provisions of 10 CFR 2.390. When Enclosure 1 is separated from this submittal, this letter is decontrolled. A Publicly Available Version of the information contained in Enclosure 1 is provided in Enclosure 2. As a result of the updates to Section 2.4, TVA determined that the revised Probable Maximum Flood (PMF) levels have the potential to impact other sections of the FSAR. Specifically, TVA is reviewing FSAR Section 3.8, "Design of Category 1 Structures," with this potential in mind. This review will be completed on or before February 28, 2011. In addition, as a result of the re-analysis for the PMF and seismic dam failure scenarios for the WBN Unit 2 FSAR submittal, dam stability calculations are being validated. This validation will be completed on or before March 31, 2011. If necessary, any revisions resulting from the above reviews will be provided in a later FSAR amendment. Enclosure 3 provides the list of commitments made in this letter. If you have any questions, please contact Bill Crouch at (423) 365-2004. - oqxz
Transcript
Enclosure 1 is to be Withheld from Public Disclosure under 10 CFR 2.390.When Enclosure 1 is removed, this letter is decontrolled.
Tennessee Valley Authority, Post Office Box 2000, Spring City, Tennessee 37381-2000
Subject: WATTS BAR NUCLEAR PLANT (WBN) - UNIT 2 - FINAL SAFETYANALYSIS REPORT (FSAR), SECTION 2.4, "HYDROLOGICENGINEERING"
The purpose of this letter is to provide anticipated changes to FSAR Section 2.4, "HydrologicEngineering." This information is being submitted in advance of FSAR Amendment 103 in orderto facilitate NRC review. Enclosure 1 provides these changes to Sections 2.4.4, 2.4.11, and2.4.14 (indicated by revision bars), along with only the figures that have been either added orreplaced. Deleted figures have also been identified. However, one figure provided inEnclosure 1 contains security-related information identified by the designation, "Security-RelatedInformation - Withhold Under 10 CFR 2.390." TVA hereby requests Enclosure 1 be withheld frompublic disclosure in accordance with the provisions of 10 CFR 2.390. When Enclosure 1 isseparated from this submittal, this letter is decontrolled. A Publicly Available Version of theinformation contained in Enclosure 1 is provided in Enclosure 2.
As a result of the updates to Section 2.4, TVA determined that the revised ProbableMaximum Flood (PMF) levels have the potential to impact other sections of the FSAR.Specifically, TVA is reviewing FSAR Section 3.8, "Design of Category 1 Structures," withthis potential in mind. This review will be completed on or before February 28, 2011. Inaddition, as a result of the re-analysis for the PMF and seismic dam failure scenarios for theWBN Unit 2 FSAR submittal, dam stability calculations are being validated. This validationwill be completed on or before March 31, 2011. If necessary, any revisions resulting fromthe above reviews will be provided in a later FSAR amendment.
Enclosure 3 provides the list of commitments made in this letter.
If you have any questions, please contact Bill Crouch at (423) 365-2004.
- oqxz
U.S. Nuclear Regulatory CommissionPage 2January 24, 2011
I declare under the penalty of perjury that the foregoing is true and correct. Executed on the24Lh day of January, 2011.
Respectfully,
Masoud at~s~taniWatts B r Unit 2 Vice President
Enclosures: 1. Proposed Changes to WBN Unit 2 FSAR Section 2.4, "HydrologicEngineering" - Security-Related Information - Withhold Under10 CFR 2.390
2. Proposed Changes to WBN Unit 2 FSAR Section 2.4, "HydrologicEngineering," Publicly Available Version
3. List of Commitments
cc (Enclosures)
U. S. Nuclear Regulatory CommissionRegion IIMarquis One Tower245 Peachtree Center Ave., NE Suite 1200Atlanta, Georgia 30303-1257
NRC Resident Inspector Unit 2Watts Bar Nuclear Plant1260 Nuclear Plant RoadSpring City, Tennessee 37381
ENCLOSURE 2
PROPOSED CHANGES TOWBN UNIT 2 FSAR SECTION 2.4, "HYDROLOGIC ENGINEERING"
PUBLIC VERSION - PUBLICLY AVAILABLE VERSION
WATTS BAR
2.4 HYDROLOGIC ENGINEERINGWatts Bar Nuclear Plant is located on the right bank of Chickamauga Lake atTennessee River Mile (TRM) 528 with plant grade at elevation 728 MSL. The plant hasbeen designed to have the capability for safe shutdown in floods up to the computedmaximum water level, in accordance with regulatory position 2 of Regulatory Guide1.59, Revision 2, August 1977.
Determination of the maximum flood level included consideration of postulated damfailures from seismic and hydrologic causes. The maximum flood Elevation 738.8would result from an occurrence of the probable maximum storm. Coincident windwave activity results in wind waves of up to 2.2 ft. (crest to trough). Run up on the 4:1slopes approaching the Diesel Generator Building reaches Elevation 741.2. Windwave run up on the critical wall of the Intake Pumping Structure reachesElevation 741.0 and wind wave run up on the walls of the Auxiliary, Control and ShieldBuildings reaches Elevation 740.6.
The nearest surface water user located downstream from Watts Bar Nuclear Plant isDayton, Tennessee, at TRM 503.8, 24.2 miles downstream. All surface water supplieswithdrawn from the 58.9 mile reach of the mainstream of the Tennessee River betweenWatts Bar Dam (TRM 529.9) and Chickamauga Dam (TRM 471.0) are listed in Table2.4-1.
The probable minimum flow past the site is estimated to be 2000 cfs, which is morethan adequate for plant water requirements.
2.4.1 Hydrological Description
2.4.1.1 Sites and Facilities
The location of key plant structures and their relationship to the original site topographyis shown on Figure 2.1-5. The structures which have safety-related equipment andsystems are indicated on this figure and are tabulated below along with the elevationof exterior accesses.
Structure Access Accesses Elev.
Intake Pumping (1) Access Hatches 3 728.0
Structure (2) Stairwell Entrances 2 741.0
(3) Access Hatches 6 741.0
Auxiliary and (1) Door to Turbine Bldg. 1 708.0
Control Bldgs. (2) Door to Service Bldg. 2 713.0
(3) Railroad Access Opening 1 729.0
(4) Door to Turbine Bldg. 2 729.0
HYDROLOGIC ENGINEERING 2.4-1
WATTS BAR
Structure Access Accesses Elev.
(5) Emergency Exit
(6) Door to Turbine Bldg.
12
730.0
755.0
Shield Building
(1) Personnel Lock
(2) Equipment Hatch
(3) Personnel Lock
11
1
714.0
753.0
755.0
742.0
742.0
742.0
760.5
Diesel Generator
Building
(1) Equipment Access Doors
(2) Emergency Exits
(3) Personnel Access Door
(4) Emergency Exit
4
41
1
Exterior accesses are also provided to each of the Class 1 E electrical systemsmanholes and handholes at elevations varying from 714.5 feet MSL to 728.5 feet MSL,depending upon the location of each structure.
The relationship of the plant site to the surrounding area can be seen in Figures 2.1-4aand 2.1-5. It can be seen from these figures that significant natural drainage featuresof the site have not been altered. Local surface runoff drains into the Tennessee River.
2.4.1.2 HydrosphereThe Watts Bar Nuclear Plant site, along with the Watts Bar Dam Reservation,comprises approximately 1770 acres on the west bank of Chickamauga Lake at TRM528. As shown by Figure 2.1-4a, the site is on high ground with the Tennessee Riverbeing the major potential source of flooding. The Watts Bar Nuclear Plant is located inthe Middle Tennessee Chickamauga watershed, U.S. Geological Survey (USGS)hydrologic unit code 06020001, one of 32 watersheds in the Region 06 - TennesseeRiver Watershed (Figure 2.4-1).
The Tennessee River above the Watts Bar plant site drains 17,319 square miles. WattsBar Dam, 1.9 miles upstream, has a drainage area of 17,310 square miles.Chickamauga Dam, the next dam downstream, has a drainage area of 20,790 square
2.4-2 HYDROLOGIC ENGINEERING
WATTS BAR
miles. Two major tributaries, Little Tennessee and French Broad Rivers, rise to theeast in the rugged Southern Appalachian Highlands. They flow northwestward throughthe Appalachian Divide which is essentially defined by the North Carolina-Tennesseeborder to join the Tennessee River which flows southwestward. The Tennessee Riverand its Clinch and Holston River tributaries flow southwest through the Valley andRidge physiographic province which, while not as rugged as the Southern Highlands,features a number of mountains including the Clinch and Powell Mountain chains. Thedrainage pattern is shown on Figure 2.1-1. About 20% of the watershed rises aboveelevation 3,000 with a maximum elevation of 6684 at Mt. Mitchell, North Carolina. Thewatershed is about 70% forested with much of the mountainous area being 100%forested.
The climate of the watershed is humid temperate. Above Watts Bar Dam annualrainfall averages 50 inches and varies from a low of 40 inches at sheltered locationswithin the mountains to high spots of 90 inches on the southern and eastern divide.Rainfall occurs fairly evenly throughout the year. The lowest monthly average is 2.8inches in October. The highest monthly average is 5.4 inches in July, with March aclose second with an average of 5.1 inches.
Major flood-producing storms are of two general types: the cool-season, winter type,and the warm-season, hurricane type. Most floods at Watts Bar Nuclear Plant,however, have been produced by winter-type storms in the main flood-season monthsof January through early April.
Watershed snowfall is relatively light, averaging about 14 inches annually above theplant. Snowfall above the 3,000-foot elevation averages 22 inches annually. Thehighest average annual snowfall in the basin is 63 inches at Mt. Mitchell, the highestpoint east of the Mississippi River. Individual snowfalls are normally light, with anaverage of 13 snowfalls per year. Snowmelt is not a factor in maximum flooddeterminations.
The Tennessee River, particularly above Chattanooga, Tennessee, is one of the mosthighly regulated rivers in the United States. The TVA reservoir system is operated forflood control, navigation, and power generation with flood control a prime purpose withparticular emphasis on protection for Chattanooga, 64 miles downstream from WattsBar Nuclear Plant.
Chickamauga Dam, 57 miles downstream, affects water surface elevations at WattsBar Nuclear Plant. Normal full pool elevation is 682.5 feet. At this elevation thereservoir is 58.9 miles long on the Tennessee River and 32 miles long on the HiwasseeRiver, covering an area of 36,050 acres, with a volume of 622,500 acre-feet. Thereservoir has an average width of nearly 1 mile, ranging from 700 feet to 1.7 miles. Atthe Watts Bar site the reservoir is about 1100 feet wide with depths ranging between18 feet and 26 feet at normal pool elevation.
There are 12 major dams (South Holston, Boone, Fort Patrick Henry, Watauga,Fontana, Norris, Cherokee, Douglas, Tellico, Fort Loudoun, Melton Hill, and Watts Bar)in the TVA system upstream from Watts Bar Nuclear Plant, ten of which (those
HYDROLOGIC ENGINEERING 2.4-3
WATTS BAR
previously identified excluding Fort Partick Henry and Melton Hill) provide about 4.4million acre-feet of reserved flood-detention (March 15) capacity during the main floodseason. Table 2.4-2 lists pertinent data for TVA's dams and reservoirs. Figure 2.4-2presents a simplified flow diagram for theTennessee River system. Table 2.4-3provides the relative distances in river miles of upstream dams to the Watts BarNuclear Plant site. Details for TVA dam outlet works are provided in Table 2.4-4. Inaddition, there are six major dams owned by the Aluminum Company of America(ALCOA). The ALCOA reservoirs often contribute to flood reduction, but they do nothave dependable reserved flood detention capacity. Table 2.4-5 lists pertinent data forthe ALCOA dams and Walters Dam (Waterville Lake). The locations of these damsare shown on Figure 2.1-1.
Flood control above the plant is provided largely by eight tributary reservoirs. TellicoDam is counted as a tributary reservoir because it is located on the Little TennesseeRiver although, because of canal connection with Fort Loudoun Dam, it also functionsas a main river dam. On March 15, near the end of the flood season, these provide aminimum of 3,937,400 acre-feet of detention capacity equivalent to 5.5 inches on the13,508-square-mile area they control. This is 89% of the total available above theplant. The two main river reservoirs, Fort Loudoun and Watts Bar, provide 490,000acre-feet equivalent to 2.4 inches on the remaining 3,802-square-mile area aboveWatts Bar Dam.
The flood detention capacity reserved in the TVA system varies seasonally, with thegreatest amounts during the January through March flood season. Figure 2.4-3 (12sheets) shows the reservoir seasonal operating guides for reservoirs above the plantsite. Table 2.4-6 shows the flood control reservations at the multiple-purpose projectsabove Watts Bar Nuclear Plant at the beginning and end of the winter flood season andin the summer. Total assured system detention capacity above Watts Bar Dam variesfrom 4.9 inches on January 1 to 4.8 inches on March 15 and decreasing to 1.5 inchesduring the summer and fall. Actual detention capacity may exceed these amounts,depending upon inflows and power demands.
Chickamauga Dam, the headwater elevation of which affects flood elevations at theplant, has a drainage area of 20,790 square miles, 3,480 square miles more than WattsBar Dam. There are seven major tributary dams (Chatuge, Nottely, Hiwassee,Apalachia, Blue Ridge, Ocoee No. 1 and Ocoee No. 3) in the 3,480-square-mileintervening watershed, of which four have substantial reserved capacity. On March 15,near the end of the flood season, these provide a minimum of 379,300 acre-feetequivalent to 5.9 inches on the 1,200-square-mile controlled area. Chickamauga Damcontains 345,300 acre-feet of detention capacity on March 15 equivalent to 2.8 incheson the remaining 2,280 square miles. Figure 2.4-3 (Sheet 1) shows the seasonaloperating guide for Chickamauga.
Elevation-storage relationships for the reservoirs above the site and Chickamauga,downstream, are shown in Figure 2.4-4 (13 sheets).
Daily flow volumes at the plant, for all practical purposes, are represented bydischarges from Watts Bar Dam with a drainage area of 17,310 square miles, only 9
2.4-4 HYDROLOGIC ENGINEERING
WATTS BAR
square miles less than at the plant. Momentary flows at the nuclear plant site may varyconsiderably from daily averages, depending upon turbine operations at Watts Bar andChickamauga Dams. There may be periods of several hours when no releases fromeither or both Watts Bar and Chickamauga Dams occur. Rapid turbine shutdown atChickamauga may sometimes cause periods of reverse flow in ChickamaugaReservoir.
Based upon Watts Bar Dam discharge records since dam closure in 1942, the averagedaily streamflow at the plant is 27,100 cfs. The maximum daily discharge was208,400 cfs on May 8, 1984. Daily average releases of zero have been recorded onseven occasions during the past 51 years. Flow data for water years 1960-2010 withregulation essentially equivalent to present conditions indicate an average rate ofabout 23,000 cfs during the summer months (May-October) and about 31,500 cfsduring the winter months (November-April). Flow durations based upon Watts BarDam discharge records for the period 1960-2010 are tabulated below:
Average Daily Percent of TimeDischarge, cfs Equalled or Exceeded
5,000 97.4
10,000 87.9
15,000 77.5
20,000 64.2
25,000 48.5
30,000 33.4
35,000 21.4
Channel velocities at the Watts Bar site average about 2.3 fps under normal winterconditions. Because of lower flows and higher reservoir elevations in the summermonths, channel velocities average about 1.0 fps.
The Watts Bar plant site is underlain by geologic formations belonging to the lowerConasauga Formation of Middle Cambrian age. The formation consists of interbeddedshales and limestones overlain by alluvial material averaging 40 feet in thickness.Ground water yields from this formation are low.
All surface water supplies withdrawn from the 58.9 mile reach of the mainstream of theTennessee River between Watts Bar Dam (TRM 529.9) and Chickamauga Dam (TRM471.0) are listed in Table 2.4-1. See Section 2.4.13.2 for description of the groundwater users in the vicinity of the Watts Bar site.
HYDROLOGIC ENGINEERING 2.4-5
WATTS BAR
2.4.2 Floods
2.4.2.1 Flood HistoryThe nearest location with extensive formal flood records is 64 miles downstream atChattanooga, Tennessee, where continuous records are available since 1874.Knowledge about significant floods extends back to 1826 based upon newspaper andhistorical reports. Flood flows and stages at Chattanooga have been altered by TVA'sreservoir system beginning with closure of Norris Dam in 1936 and reaching essentiallythe present level of control in 1952 with closure of Boone Dam, the last major dam withreserved flood detention capacity constructed above Chattanooga prior to constructionof Tellico Dam. Tellico Dam provides additional reserved flood detention capacity;however, the percentage increase in the total detention capacity above the Watts Barsite is small. Therefore, flood records for the period 1952 to date can be consideredrepresentative of prevailing conditions. Table 2.4-7 provides annual peak flow data atChattanooga. Figure 2.4-5 shows the known flood experience at Chattanooga indiagram form. The maximum known flood under natural conditions occurred in 1867.This flood was estimated to reach elevation 716.3 at Watts Bar Nuclear Plant site witha discharge of about 440,000 cfs. The maximum flood under present-day regulationreached Elevation 696.95 at the site on March 17, 1973.
The following tabulation lists the highest floods at Watts Bar Dam (TRM 529.9)tailwater located upstream of Watts Bar Nuclear Plant site under present-dayregulation:
Date Elevation, Feet Discharge, cfs
February 2, 1957 No Record 157,600
November 19, 1957 No Record 151,600March 13, 1963 694.75 167,700
December 31, 1969 693.28 167,300
March 17, 1973 696.95 184,800
May 28,1973 695.24 175,200
April 5, 1977 694.79 181,600
May 8, 1984 698.23 214,100April 20, 1998 694.67 167,500
May 7, 2003 694.17 153,100
There are no records of flooding from seiches, dam failures, or ice jams. Historicinformation about icing is provided in Section 2.4.7.
2.4.2.2 Flood Design ConsiderationsTVA has planned the Watts Bar project to conform with Regulatory Guide 1.59,including position 2.
2.4-6 HYDROLOGIC ENGINEERING
WATTS BAR
.The types of events evaluated to determine the worst potential flood included (1)Probable Maximum Precipitation (PMP) on the total watershed and criticalsub-watersheds including seasonal variations and potential consequent dam failuresand (2) dam failures in a postulated SSE or OBE with guide specified concurrent floodconditions.
Specific analysis of Tennessee River flood levels resulting from ocean front surges andtsunamis is not required because of the inland location of the plant. Snow melt and icejam considerations are also unnecessary because of the temperate zone location ofthe plant. Flood waves from landslides into upstream reservoirs required no specificanalysis, in part because of the absence of major elevation relief in nearby upstreamreservoirs and because the prevailing thinsoils offer small slide volume potentialcompared to the available detention space in reservoirs. Seiches pose no flood threatsbecause of the size and configuration of the lake and the elevation difference betweennormal lake level and plant grade.
The maximum PMF plant site flood level is Elevation 738.8. This elevation would resultfrom the PMP critically centered on the watershed as described inSection 2.4.3.
Wind waves based on an overland wind speed of 21 miles per hour were assumed tooccur coincident with the flood peak. This would create maximum waves up to 2.2 feethigh (trough to crest).
All safety-related facilities, systems, and equipment are housed in structures whichprovide protection from flooding for all flood conditions up to plant grade at Elevation728. See Section 2.4.10 for more specific information.
Other rainfall floods will also exceed plant grade Elevation 728 and require plantshutdown. Section 2.4.14 describes emergency protective measures to be taken inflood events exceeding plant grade.
Seismic and flood events could cause dam failure surges exceeding plant gradeElevation 728. Section 2.4.14 describes emergency protective measures to be takenin seismic events exceeding plant grade.
For the condition where flooding exceeds plant grade, as described in Sections 2.4.3and 2.4.4, those safety-related facilities, systems, and equipment located in thecontainment structure are protected from flooding by the Shield Building structure withthose accesses and penetrations below the maximum flood level designed andconstructed as watertight elements. The Diesel Generator Building and Essential RawCooling Water (ERCW) pumps are located above this flood level, thereby providingprotection from flooding.
Wind wave run up during the PMF at the Diesel Generator Building would reachElevation 741.2 which is 0.8 foot below the operating floor. Consequently, wind waverun up will not impair the safety functions of the Diesel Generator Building.
HYDROLOGIC ENGINEERING 2.4-7
WATTS BAR
Those Class 1 E electrical system conduit banks located below the PMF plus windwave run up flood level are designed to function submerged with either continuouscable runs or qualified, type tested splices. The ERCW pumps are structurallyprotected from wind waves. Therefore, the safety function of the ERCW pumps will notbe affected by floods or flood-related conditions.
The Turbine, Control, and Auxiliary Buildings will be allowed to flood. All equipmentrequired to maintain the plant safely during the flood, and for 100 days after the 'beginning of the flood, is either designed to operate submerged, is located above themaximum flood level, or is otherwise protected.
The electrical equipment room of the intake pumping structure will flood at Elevation728. However, the design basis flood level for the remaining structure is Elevation741.0. The Auxiliary and Control Buildings will flood with the water level at Elevation729. The design basis flood level for the Auxiliary, Control, and Shield Buildings isElevation 740.6. The Diesel Generator Building is located above the design basis floodlevel of Elevation 741.2.
2.4.2.3 Effects of Local Intense Precipitation
All streams in the vicinity of the plant shown on Figure 2.1-4a were investigated,including Yellow Creek, with probable maximum flows from a local storm and frombreaching of the Watts Bar Dam west saddle dike and were found not to createpotential flood problems at the plant. Local drainage which required detailed design isfrom the plant area itself and from a 150-acre area north of the plant.
The underground storm drainage system is designed for a maximum 1-hour rainfall of4 inches. The 1-hour rainfall with 1% exceedance frequency is 3.3 inches. Structureshousing safety-related facilities, systems, and equipment are protected from floodingduring a local PMF by the slope of the plant yard. The yard is graded so that thesurface runoff will be carried to Chickamauga Reservoir without exceeding theelevation of the accesses given in Section 2.4.1.1. The exterior accesses that arebelow the grade elevation for that specific structure exit from that structure into anotherstructure and are not exterior in the sense that they exit or are exposed to theenvironment. For any access exposed to the environment and located at gradeelevation, sufficient drainage is provided to prevent water from entering the opening.This is accomplished by sloping away from the opening.
PMP for the plant drainage systems has been defined for TVA by theHydrometeorological Branch of the National Weather Service and is described inHydrometeorological Report No. 56.
Ice accumulation would occur only at infrequent intervals because of the temperateclimate. Maximum winter precipitation concurrent with ice accumulation would imposeless severe conditions on the drainage system than would the PMF.
Figure 2.4-40a (sheet 1) shows the Watts Bar site grading and drainage system andbuilding outlines for the main plant area. Direction of flow for runoff has been indicatedby arrows. Figure 2.4-40b shows the Watts Bar general plan; Figure 2.4-40c shows the
2.4-8 HYDROLOGIC ENGINEERING
WATTS BAR
site grading and drainage system for the area north and northwest of the plant alongwith the outline of the low-level radwaste storage facility. The 150-acre drainage areanorth of the site has been outlined on Figure 2.4-40b with direction of flow for runoffindicated by arrows.
Figure 2.4-40d (three sheets) shows the plans and profiles for the perimeter roads;Figure 2.4-40e (two sheets) shows the plan and profile for the access highway. Figure2.4-40f (three sheets) shows the plan, sections, and profiles for the main plant railroadtracks. Figure 2.4-40g (three sheets) shows the yard grading, drainage, and surfacingfor the switchyard.
In testing the adequacy of the site drainage system, all underground drains wereassumed clogged. Peak discharges were evaluated using storm intensities for themaximum 1-hour rainfall obtained from the PMP mass curve shown on Figure 2.4-40h.Runoff was assumed equal to rainfall. Each watershed was analyzed using the moreappropriate of two methods: (1) when flow conditions controlled, standard-stepbackwater from the control section using peak discharges estimated from rainfallintensities corresponding to the time of concentration of the area above the control or(2) when ponding or reservoir-type conditions controlled, storage routing the inflowhydrograph equivalent to the PMP hydrograph using 2-minute time intervals.Computed maximum water surface elevations are below critical floor Elevation 729.The separate watershed areas are numbered for identification on Figure 2.4-40a.
Runoff from the employee parking lot and the areas south of the office building andwest of the Turbine Building (area 1) will flow along the perimeter road west of theswitchyard and drain into the area surrounding the chemical holdup ponds. The controlis the drainage ditch and road which acts as a channel between the west end of theswitchyard and the embankment to the west. To be conservative it was assumedwater would not flow into the switchyard. Maximum water surface elevations at theoffice and Turbine Buildings computed using method (1) were less than 729.
Flow from the area west of the Service, Auxiliary, Reactor, and Diesel GeneratorBuildings and north of the office building and gatehouse (area 2) will drain along andthen across the perimeter road, flow west through a swale and across the low point inthe access road. The swale and the roads have sufficient capacity to keep watersurface elevations below 729 at all buildings. Method (1) was used in this analysis.
The area east of the Turbine, Reactor, and Diesel Generator Buildings (area 3) formsa pool bounded by the main and transformer yard railroad tracks with top of railelevations at 728.00 and 728.25 respectively. Method (2) was used to route the inflowhydrograph through this pool from an initial elevation of 728.00 with outflow over therailroads. Maximum water surface elevations at the Turbine and Reactor Buildingswere less than Elevation 729. Use of method (1) starting just downstream of therailroad confirmed this result.
The flow from area 3 over the railroad north of the east-west baseline drains northalong a channel between the main railroad and the ERCW maintenance road and eastbetween the ERCW maintenance road and the north cooling tower. Flow from area 3
HYDROLOGIC ENGINEERING 2.4-9
WATTS BAR
over the railroad south of the east-west baseline drains south along a channel betweenthe storage yard road and the swifchyard past the storage yard to the river. Analysisusing method (1) shows that flow over the Diesel Generator Building road controls theelevations at the Turbine and Reactor Buildings. Maximum water surface elevationswere computed to be less than Elevation 729.
Flow from the switchyard and transformer yard (area 4) will drain to the east, west, andsouth. Maximum water surface elevations at the Turbine Building obtained usingmethod (2) were less than Elevation 729.
Table 2.4-8 provides the weir length description and coefficient of discharge used inthe analysis for areas 3 and 4.
Flow from the 150-acre drainage area north of the site drains two ways: (1) 50 acresdrain east through the double 96-inch culvert under the access railroad shown onFigure 2.4-40c and (2) drainage from the remaining 100 acres is diverted to the westthrough an 81- by 59-inch pipe arch and, when flows exceed the pipe capacity, southover a swale in the construction access road. The flow over the construction accessroad drains to the west across the access highway. The following information providesdetails of our analysis.
The discharge hydrograph for the 100-acre area north of the plant and upstream fromthe construction access road was determined using a dimensionless unit graph basedupon SCS procedures and PMP defined by the National Weather Service.[1] The PMPmass curve used in the determination, is shown on Figure 2.4-40h. Runoff wasassumed equal to rainfall. The construction access road will act as a dam with the 81-by 59-inch pipe arch acting as a low-level outlet. Flow is prevented from draining tothe east above the construction access road by a dike with top elevation at 736.5 (dikelocation and cross-section shown on Figure 2.4-40c). The profile of the constructionaccess road and the location of the pipe arch are shown on Figure 2.4-40c. Thedischarge hydrograph was routed using 2-minute time intervals through the pipe archand over the construction access road using standard storage routing techniques. Therating curve for flow over the construction access road was developed from critical flowrelationships with losses assumed equal to 0.5 V2/2g.
The maximum elevation reached at the construction access road was 735.28. Thepipe arch is designed for AASHTO H-20 loading which we judge is adequate for theloading expected. In the unlikely event of pipe arch failure and flow blockage, themaximum flood level at the construction access road would increase only 0.12 foot,from Elevation 735.28 to 735.4. The peak flow over the construction road was used incomputations.
Flow over the construction access road discharges into the 67-acre area west of theService, Auxiliary, Reactor, and Diesel Generator Buildings and north of the officebuilding and gatehouse (area 2 of Figure 2.4-40a) before flowing west across theaccess highway (Figure 2.4-40e). Flow from 60 additional acres to the northwest ofthe site is also added to this area just upstream of the main access road. Elevationsfor area 2 were examined to include these additional flows. Backwater was computed
2.4-10 HYDROLOGIC ENGINEERING
WATTS BAR
from downstream of the access highway, crossing the perimeter road, to the Reactor,Diesel Generator, and Waste Evaporation System Buildings. The elevation at theaccess highway control was computed conservatively assuming that the peak flowsfrom area 2 and over the construction road added directly. The maximum floodelevation reached in the main plant area was less than Elevation 729.
The discharge hydrograph for the 50-acre area north of the plant was conservativelyassumed equivalent to the PMP hydrograph using 2 minute time intervals. Thishydrograph was routed using 2-minute time intervals through the double 96-inchculvert using standard storage routing techniques.
The maximum elevation reached at the culvert was 725.67. Flow is prevented fromentering the main plant area by site grading as shown on Figure 2.4-40c.
The double 96-inch culvert is designed to carry a Cooper E-80 loading asrecommended by the American Railway Engineering Association (AREA). The culverthas already been exposed to the maximum loading (the generator stator with a totalload of 792 tons on 22 axles) with no damage to the pipes or tracks. This maximumloading is less than the design load. Loading conditions will not be a problem.
The site will be well maintained and any debris generated from it will be minimal;therefore, debris blockage of the double 96-inch culvert or the 81- by 59-inch pipe archwill not be a problem.
Table 2.4-9 provides a description of drainage area, estimated peak discharge, andcomputed maximum water surface elevation for each subwatershed investigated in thesite drainage analysis.
A local PMF on the holding pond does not pose a threat with respect to flooding ofsafety-related structures. The top of the holding pond dikes is set at Elevation 714.0,whereas water level must exceed the plant grade at Elevation 728.0 before safety-related structures can be flooded. A wide emergency spillway is cut in original groundat an elevation 2 feet below the top of the dikes. During a local PMF the water trappedby the pond rise will be considerably less than the 14-foot difference between the topof the dikes and plant grade.
2.4.3 Probable Maximum Flood (PMF) on Streams and Rivers
The guidance of Appendix A of Regulatory Guide 1.59 was followed in determining thePMF.
The PMF was determined from PMP for the watershed above the plant withconsideration given to seasonal and areal variations in rainfall. Two basic stormsituations were found to have the potential to produce maximum flood levels at WattsBar Nuclear Plant. These are (1) a sequence of storms producing PMP depths on the21,400-square-mile watershed above Chattanooga and (2) a sequence of stormsproducing PMP depths in the basin above Chattanooga and below the five majortributary dams (Norris, Cherokee, Douglas, Fontana, Hiwassee), hereafter called the7,980-square-mile storm. The maximum flood level at the plant would be caused by the
HYDROLOGIC ENGINEERING 2.4-11
WATTS BAR
March PMP 21,400-square-mile storm. The flood level for the 7,980 square mile stormwould be slightly less.
In both storms the West Saddle Dike at Watts Bar Dam would be overtopped andbreached. No other failure would occur. Maximum discharge at the plant is1,065,000 cfs for the 21,400-square-mile storm. The resulting PMF elevation at theplant would be 738.8 excluding wind wave effects.
2.4.3.1 Probable Maximum Precipitation (PMP)Probable maximum precipitation (PMP) for the watershed above Chickamauga andWatts Bar Dams has been defined for TVA by the Hydrometeorological ReportNo. 41[4]. Hydrometeorological Report No. 56[35] defines PMP for watersheds abovetributary dams. These reports define depth-area-duration characteristics, seasonalvariations, and antecedent storm potentials and incorporate orographic effects of theTennessee River Valley. Hydrometeorological Report No. 56[35], the most recentreport covering the watershed, applies to watershed basins up to 3,000 square miles.Hydrometeorological Report No. 41 [4] addresses the larger basins. Due to thetemperate climate of the watershed and relatively light snowfall, snowmelt is not afactor in generating maximum floods for the Tennessee River at the site.
Two basic storms with three possible isohyetal patterns and seasonal variationsdescribed in Hydrometeorological Report No. 41 [4] were examined to determine whichwould produce maximum flood levels at the Watts Bar plant site. One storm wouldproduce PMP depths on the 21,400-square-mile watershed above Chattanooga. Twoisohyetal patterns are presented in Hydrometeorological Report No. 41[4] for thisstorm. The isohyetal pattern with downstream center would produce maximum rainfallon the middle portion of the watershed and is shown in Figure 2.4-6.
The second storm described in Hydrometeorological Report No. 41[4] would producePMP depths on the 7,980-square-mile watershed above Chattanooga and below thefive major tributary dams. The isohyetal pattern for the 7,980-square-mile storm is notgeographically fixed and can be moved parallel to the long axis, northeast andsouthwest, along the Tennessee Valley. The isohyetal pattern centered at Bulls Gap,Tennessee, would produce maximum rainfall on the upper part of the watershed andis shown in Figure 2.4-7.
Seasonal variations were also considered. Table 2.4-10 provides the seasonalvariations of PMP. The two seasons evaluated were March and June. The March stormwas evaluated because the PMP was maximum and surface runoff was alsomaximum. The June storm was evaluated because the June PMP was maximum forthe summer season and reservoir elevations were at their highest levels. AlthoughSeptember PMP is somewhat higher than that in June, less runoff and lower reservoirlevels more than compensate for the higher rainfall.
All PMP storms are 9-day events. A 3-day antecedent storm was postulated to occur3 days prior to the 3-day PMP storm in all PMF determinations. Rainfall depthsequivalent to 40% of the main storm were used for the antecedent storms with uniformareal distribution as recommended in Hydrometeorological Report No. 41[4]
2.4-12 HYDROLOGIC ENGINEERING
WATTS BAR
A standard time distribution pattern was adopted for the storms based upon majorobserved storms transposable to the Tennessee Valley and in conformance with theusual practice of Federal agencies. The adopted distribution is within the limitsstipulated in Chapter VII of Hydrometeorological Report No. 41[4]. This places theheaviest precipitation in the middle of the storm. The adopted sequence closelyconforms to that used by the U.S. Army Corps of Engineers. A typical distribution masscurve resulting from this approach is shown in Figure 2.4-8.
The PMF discharge at the Watts Bar Nuclear Plant was determined to result from the21,400 square mile storm producing PMP on the watershed with the downstreamorographically fixed storm pattern, as defined in Hydrometeorological Report No. 41 [4].The PMP storm would occur in the month of March and would produce 16.25 inchesof rainfall in 3 days on the watershed above Chickamauga Dam. The storm producingthe PMP would be preceded by a 3-day antecedent storm producing 6.18 inches ofrainfall, which would end 3 days prior to the start of the PMP storm. Precipitationtemporal distribution is determined by applying the mass curve (Figure 2.4-8) to thebasin rainfall depths in Table 2.4-11.
2.4.3.2 Precipitation Losses
A multi-variable relationship, used in the day-to-day operation of the TVA reservoirsystem, has been applied to determine precipitation excess directly. The relationshipswere developed from observed storm and flood data. They relate precipitation excessto the rainfall, week of the year, geographic location, and antecedent precipitationindex (API). In their application, precipitation excess becomes an increasing fractionof rainfall as the storm progresses in time and becomes equal to rainfall in the later partof extreme storms. An API determined from an 11-year period of historical rainfallrecords (1997-2007) was used at the start of the antecedent storm. The precipitationexcess computed for the main storm is not sensitive to variations in adopted initialmoisture conditions because of the large antecedent storm.
Basin rainfall, precipitation excess, and API are provided in Table 2.4-11. The averageprecipitation loss for the watershed above Chickamauga Dam is 2.33 inches for the3-day antecedent storm and 1.86 inches for the 3-day main storm. The losses areapproximately 38% of antecedent rainfall and 11% of the PMP, respectively. Theprecipitation loss of 2.33 inches in the antecedent storm compares favorably with thatof historical flood events shown in Table 2.4-12.
2.4.3.3 Runoff and Stream Course Model
The runoff model used to determine Tennessee River flood hydrographs at Watts BarNuclear Plant is divided into 40 unit areas and includes the total watershed aboveChickamauga Dam. Unit hydrographs are used to compute flows from the unit areas.The watershed unit areas are shown in Figure 2.4-9. The unit area flows are combinedwith appropriate time sequencing or channel routing procedures to compute inflowsinto the most upstream tributary reservoirs, which in turn are routed through thereservoirs using standard routing techniques. Resulting outflows are combined withadditional local inflows and carried downstream using appropriate time sequencing orrouting procedures including unsteady flow routing.
HYDROLOGIC ENGINEERING 2.4-13
WATTS BAR
Unit hydrographs were developed for each unit area for which discharge records wereavailable from maximum flood hydrographs either recorded at stream gaging stationsor estimated from reservoir headwater elevation, inflow, and discharge data using theprocedures described by Newton and Vineyard, Reference [5]. For non-gaged unitareas synthetic unit graphs were developed from relationships of unit hydrographsfrom similar watersheds relating the unit hydrograph peak flow to the drainage areasize, time to peak in terms of watershed slope and length, and the shape to the unithydrograph peak discharge in cfs per square mile. Unit hydrograph plots are providedin Figure 2.4-10 (11 Sheets). Table 2.4-13 contains essential dimension data for eachunit hydrograph.
Tributary reservoir routings, except for Tellico and Melton Hill, were made usingstandard reservoir routing procedures and flat pool storage conditions. The main riverreservoirs, Tellico, and Melton Hill reservoirs were routed using unsteady flowtechniques.
Unsteady flow routings were computer-solved with the Simulated Open ChannelHydraulics (SOCH) mathematical model, based on the equations of unsteady flow,Reference [6]. The SOCH model inputs include the reservoir geometry, upstreamboundary inflow hydrograph, local inflows, and the downstream boundary headwaterdischarge relationships based upon operating guides or rating curves when thestructure geometry controls. Seasonal operating curves are provided in Figure 2.4-3(12 Sheets).
Discharge rating curves are provided in Figure 2.4-11 (13 Sheets) for the reservoirs inthe watershed at and above Chickamauga. The discharge rating curve forChickamauga Dam is for the current lock configuration with all 18 spillway baysavailable as of Amendment 98.
The unsteady flow mathematical model configuration for the Fort Loudoun-Tellicocomplex is shown by the schematic in Figure 2.4-12. The Fort Loudoun Reservoirportion of the model from TRM 602.3 to TRM 652.22 is described by 29 cross-sectionswith additional sections being interpolated between the original sections for a total of59 cross-sections in the SOCH model, with a variable cross-section spacing of about1 mile. The unsteady flow model was extended upstream on the French Broad andHolston Rivers to Douglas and Cherokee dams, respectively. The French Broad fromthe mouth to Douglas Dam at French Broad River mile (FBRM) 32.3 was described by33 cross-sections with additional sections being interpolated between the originalsections for a total of 49 cross-sections in the SOCH model, with a variablecross-section spacing of about 1 mile. The Holston River from the mouth to CherokeeDam at Holston River mile (HRM) 52.3 was described by 29 cross-sections with oneadditional cross-section being interpolated between each of the original sections for atotal of 57 cross-sections in the SOCH model, with a variable cross-section spacing ofabout 1 mile.
The Little Tennessee River was modeled from Tellico Dam, Little Tennessee Rivermile (LTRM) 0.3 to Chilhowee Dam at Little Tennessee River mile (LTRM) 33.6. The-Little Tennessee River from Tellico Dam to Chilhowee Dam at LTRM 33.6 was
2.4-14 HYDROLOGIC ENGINEERING
WATTS BAR
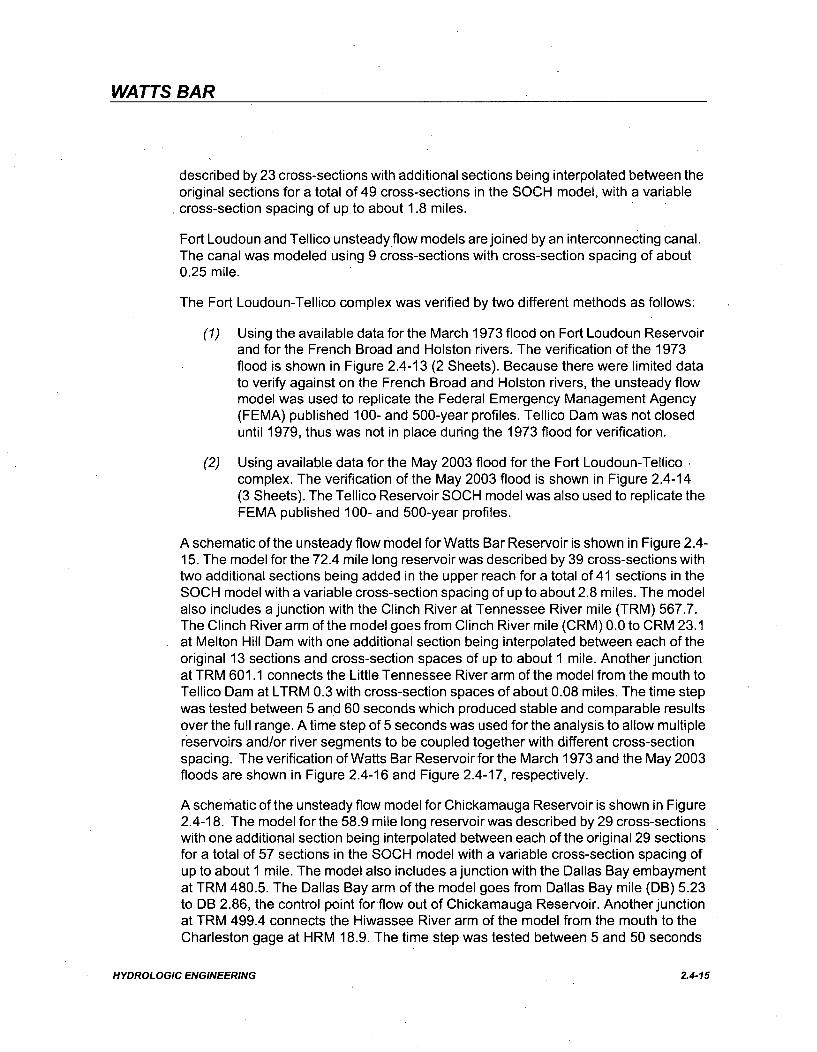
described by 23 cross-sections with additional sections being interpolated between theoriginal sections for a total of 49 cross-sections in the SOCH model, with a variablecross-section spacing of upto about 1.8 miles.
Fort Loudoun and Tellico unsteady flow models are joined by an interconnecting canal.The canal was modeled using 9 cross-sections with cross-section spacing of about0.25 mile.
The Fort Loudoun-Tellico complex was verified by two different methods as follows:
(1) Using the available data for the March 1973 flood on Fort Loudoun Reservoirand for the French Broad and Holston rivers. The verification of the 1973flood is shown in Figure 2.4-13 (2 Sheets). Because there were limited datato verify against on the French Broad and Holston rivers, the unsteady flowmodel was used to replicate the Federal Emergency Management Agency(FEMA) published 100- and 500-year profiles. Tellico Dam was not closeduntil 1979, thus was not in place during the 1973 flood for verification.
(2) Using available data for the May 2003 flood for the Fort Loudoun-Tellicocomplex. The verification of the May 2003 flood is shown in Figure 2.4-14(3 Sheets). The Tellico Reservoir SOCH model was also used to replicate theFEMA published 100- and 500-year profiles.
A schematic of the unsteady flow model for Watts Bar Reservoir is shown in Figure 2.4-15. The model for the 72.4 mile long reservoir was described by 39 cross-sections withtwo additional sections being added in the upper reach for a total of 41 sections in theSOCH model with a variable cross-section spacing of up to about 2.8 miles. The modelalso includes a junction with the Clinch River at Tennessee River mile (TRM) 567.7.The Clinch River arm of the model goes from Clinch River mile (CRM) 0.0 to CRM 23.1at Melton Hill Dam with one additional section being interpolated between each of theoriginal 13 sections and cross-section spaces of up to about 1 mile. Another junctionat TRM 601.1 connects the Little Tennessee River arm of the model from the mouth toTellico Dam at LTRM 0.3 with cross-section spaces of about 0.08 miles. The time stepwas tested between 5 and 60 seconds which produced stable and comparable resultsover the full range. A time step of 5 seconds was used for the analysis to allow multiplereservoirs and/or river segments to be coupled together with different cross-sectionspacing. The verification of Watts Bar Reservoir for the March 1973 and the May 2003floods are shown in Figure 2.4-16 and Figure 2.4-17, respectively.
A schematic of the unsteady flow model for Chickamauga Reservoir is shown in Figure2.4-18. The model for the 58.9 mile long reservoir was described by 29 cross-sectionswith one additional section being interpolated between each of the original 29 sectionsfor a total of 57 sections in the SOCH model with a variable cross-section spacing ofup to about 1 mile. The model also includes a junction with the Dallas Bay embaymentat TRM 480.5. The Dallas Bay arm of the model goes from Dallas Bay mile (DB) 5.23to DB 2.86, the control point for flow out of Chickamauga Reservoir. Another junctionat TRM 499.4 connects the Hiwassee River arm of the model from the mouth to theCharleston gage at HRM 18.9. The time step was tested between 5 and 50 seconds
HYDROLOGIC ENGINEERING Z.4-15
WATTS BAR
producing stable and comparable results over the full range. A time step of 5 secondswas used for the analysis to allow multiple reservoirs and/or river segments to becoupled together with different cross-section spacing. The verification ofChickamauga Reservoir for the March 1973 and the May 2003 floods are shown inFigure 2.4-19 and Figure 2.4-20, respectively.
Verifying the reservoir models with actual data approaching the magnitude of the PMFis not possible, because no such events have been observed. Therefore, using flowsin the magnitude of the PMF (1,200,000 - 1,300,000 cfs), steady-state profiles werecomputed using the HEC-RAS[341 steady state model and compared to computedelevations from the SOCH model. An example of the comparison between HEC-RASand SOCH profiles is shown for Chickamauga Reservoir in Figure 2.4-21. Thisapproach was applied for each of the SOCH reservoir models. Similarly, the tailwaterrating curve was compared at each project as shown for Watts Bar Dam in Figure 2.4-22. In this figure, the initial tailwater curve is compared to results from the HEC-RASmodels.
The reservoir operating guides applied during the SOCH model simulations mimic, tothe extent possible, operating policies and are within the current reservoir operatingflexibility. In addition to spillway discharge, turbine and sluice discharges were used torelease water from the tributary reservoirs. Turbine discharges were also used at themain river reservoirs up to the point where the head differentials are too small and/orthe powerhouse would flood. All discharge outlets (spillway gates, sluice gates, andvalves) for projects in the reservoir system will remain operable without failure for thepassage of water when and as needed during the flood. A high confidence that allgates/outlets will be operable is provided by periodic inspections by TVA plantpersonnel, the intermediate and 5-year dam safety engineering inspections consistentwith Federal Guidelines for Dam Safety, and the significant capability of the emergency-response teams to direct and manage resources to address issues potentiallyimpacting gate/outlet functionality.
Median initial reservoir elevations for the appropriate season were used at the start ofthe PMF storm sequence. Use of median elevations is consistent with statisticalexperience and avoids unreasonable combinations of extreme events.
The flood from the antecedent storm occupies about 70% of the reserved systemdetention capacity above Watts Bar Dam at the beginning of the main storm (day 7 ofthe event). Reservoir levels are at or above guide levels at the beginning of the mainstorm in all but Apalachia and Fort Patrick Henry reservoirs, which have no reservedflood detention capacity.
2.4.3.4 Probable Maximum Flood Flow
The PMF discharge at the Watts Bar Nuclear Plant was determined to be1,065,000 cfs. This flood would result from the 21,400-square-mile storm in March witha downstream orographically-fixed storm pattern (Figure 2.4-6).
The PMF discharge hydrograph is shown in Figure 2.4-23. The west saddle dike atWatts Bar Dam (Figure 2.4-24) upstream of Watts Bar Nuclear Plant would be
Z.4-16 HYDROLOGIC ENGINEERING
WATTS BAR
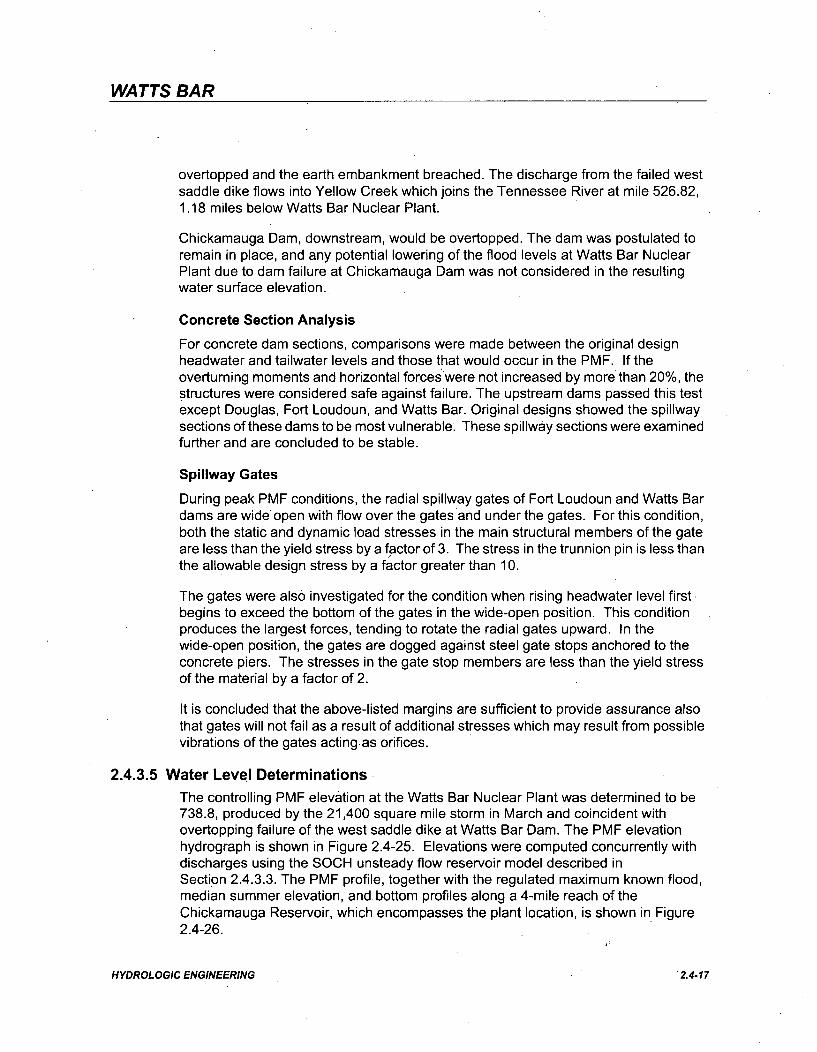
overtopped and the earth embankment breached. The discharge from the failed westsaddle dike flows into Yellow Creek which joins the Tennessee River at mile 526.82,1.18 miles below Watts Bar Nuclear Plant.
Chickamauga Dam, downstream, would be overtopped. The dam was postulated toremain in place, and any potential lowering of the flood levels at Watts Bar NuclearPlant due to dam failure at Chickamauga Dam was not considered in the resultingwater surface elevation.
Concrete Section Analysis
For concrete dam sections, comparisons were made between the original designheadwater and tailwater levels and those that would occur in the PMF. If theoverturning moments and horizontal forces were not increased by more than 20%, thestructures were considered safe against failure. The upstream dams passed this testexcept Douglas, Fort Loudoun, and Watts Bar. Original designs showed the spillwaysections of these dams to be most vulnerable. These spillway sections were examinedfurther and are concluded to be stable.
Spillway Gates
During peak PMF conditions, the radial spillway gates of Fort Loudoun and Watts Bardams are wide open with flow over the gates and under the gates. For this condition,both the static and dynamic load stresses in the main structural members of the gateare less than the yield stress by a factor of 3. The stress in the trunnion pin is less thanthe allowable design stress by a factor greater than 10.
The gates were also investigated for the condition when rising headwater level firstbegins to exceed the bottom of the gates in the wide-open position. This conditionproduces the largest forces, tending to rotate the radial gates upward. In thewide-open position, the gates are dogged against steel gate stops anchored to theconcrete piers. The stresses in the gate stop members are less than the yield stressof the material by a factor of 2.
It is concluded that the above-listed margins are sufficient to provide assurance alsothat gates will not fail as a result of additional stresses which may result from possiblevibrations of the gates acting as orifices.
2.4.3.5 Water Level Determinations
The controlling PMF elevation at the Watts Bar Nuclear Plant was determined to be738.8, produced by the 21,400 square mile storm in March and coincident withovertopping failure of the west saddle dike at Watts Bar Dam. The PMF elevationhydrograph is shown in Figure 2.4-25. Elevations were computed concurrently withdischarges using the SOCH unsteady flow reservoir model described inSection 2.4.3.3. The PMF profile, together with the regulated maximum known flood,median summer elevation, and bottom profiles along a 4-mile reach of theChickamauga Reservoir, which encompasses the plant location, is shown in Figure2.4-26.
HYDROLOGIC ENGINEERING .2.4-17
WATTS BAR
2.4.3.6 Coincident Wind Wave Activity
Some wind waves are likely when the probable maximum flood crests at Watts BarNuclear Plant. The flood would be near its crest for a day beginning about 2 days aftercessation of the probable maximum storm (Figure 2.4-25). The day of occurrencewould be in the month of March or possibly the first week in April.
Figure 2.4-27 shows the main plant general grading plan. The diesel generatorbuildings to the north and the pumping station to the southeast of the main buildingcomplex must be protected from flooding to assure plant safety. The diesel generatorbuildings operating floors are at elevation 742 which are above the maximumcomputed elevation including wind wave runup. The electrical equipment room of theintake pumping station will flood at elevation 728. The auxiliary and control buildingsare allowed to flood. All equipment required to maintain the plant safely during the floodis either designed to operate submerged, is located above the maximum flood level, oris otherwise protected. Those safety-related facilities, systems, and equipment locatedin the containment structure are protected from flooding by the shield building structurewith those accesses and penetrations below the maximum flood level designed andconstructed as watertight elements.
The maximum effective fetches for the structures are shown on Figure 2.4-28.Effective fetch accounts for the sheltering effect of several hills on the south riverbankwhich become islands at maximum flood levels. The maximum effective fetch in allcases, except for the west face of the intake pumping structure occurs from thenortheast or east northeast direction. The maximum effective fetch for the west face ofthe intake pumping structure occurs from the west direction. The diesel generatorbuilding maximum effective fetch is 1.1 miles, and the critical west face of the intakepumping structure maximum effective fetch is 1.3 miles. The maximum effective fetchfor the auxiliary, control, and shield buildings is 0.8 miles.
For the Watts Bar FSAR, the two-year extreme wind for the season in which the PMFcould occur was adopted to associate with the PMF crest as specified in RegulatoryGuide 1.59. The storm studies on which the PMF determination is based[4] show thatthe season of maximum rain depth is the month of March. Wind velocity wasdetermined from a statistical analysis of maximum March winds observed atChattanooga, Tennessee.
Records of daily maximum average hourly winds for each direction are available at theWatts Bar site for the period May 23, 1973, through April 30, 1978. This record,however, is too short to use in a statistical analysis to determine the 2-year extremewind, as specified in ANSI Standard N170-1976, an appendix to Regulatory Guide1.59. Further, the necessary 30-minute wind data are not available. To determineapplicability of Chattanooga winds at the Watts Bar plant, a Kolmogorov-Smirnov (K-S)statistical test was applied to cumulative frequency distributions of daily maximumhourly winds for each direction at Chattanooga and Watts Bar. The winds comparedwere those recorded at Chattanooga during the period 1948-74 (the period when thenecessary triple-register records were available for analysis) and the Watts Bar record.
2.4-18 HYDROLOGIC ENGINEERING
WATTS BAR
A concurrent record is not available; however, the K-S test showed that (except for thenoncritical east direction) the record of daily maximum hourly velocities at Chattanoogawere equal to or greater than that at Watts Bar. From this analysis it was concludedthat use of the Chattanooga wind records to define seasonal maximum winds at theWatts Bar site is conservative.
The available data at Chattanooga included 30-minute and hourly winds by seasonsand direction for the 27-year period 1948 through 1974.
The 30-minute wind data were analyzed for both the southwest and northeastdirections. The winds from the northeast are considerably less than those from thesouthwest; hence, the southwest direction is controlling. Figure 2.4-29 shows the plotof the Chattanooga March maximum 30-minute winds from the critical southwestdirection. The 2-year, 30-minute wind speed is 21 miles per hour determined from amathematical fit to the Gumbel distribution. This compares with 15 miles per hourdetermined for the March season from the noncontrolling northeast direction.
Computation of wind waves used the procedures of the Corps Of Engineers[ 4]. Windspeed was adjusted based on the effective fetch length for over water conditions. Forthe diesel generator building, the adjusted wind speed is 23.8 miles per hour. Theintake pumping structure maximum adjusted wind speed is 24.2 miles per hour for thecritical west face. For the auxiliary, control, and shield buildings the adjusted windspeed is 23.4 miles per hour.
For waves approaching the diesel generator building, the maximum wave height(average height of the maximum 1 percent of waves) would be 1.7 feet high, crest totrough, and the significant wave height (average height of the maximum 33-1/3 percentof waves) would be 1.0 foot high, crest to trough. The corresponding wave period is2.0 seconds. For the intake pumping structure, the maximum wave height would be2.2 feet and the significant wave height would be 1.3 feet, with a corresponding waveperiod of 2.3 seconds. For the critical west face, the maximum wave height would be1.9 feet high, and the significant wave height would be 1.1 feet high. Thecorresponding wave period is 2.1 seconds. The maximum wave height approachingthe auxiliary, control, and shield buildings would be 1.5 feet high, and the significantwave height would be 0.9 foot high. The corresponding wave period is 1.9 seconds.
Computation of wind setup used the procedures of the Corps Of Engineers[141 . Themaximum wind setup is 0.1 foot for all structures. Computation of runup used theprocedures of the Corps Of Engineers[14 ]. At the diesel generator building thecorresponding runup on the earth embankment with a 4:1 slope is 2.3 feet and reacheselevation 741.2, including wind setup. The runup on the critical west face wall of theintake pumping station is 2.1 feet and reaches elevation 741.0, including wind setup.The configuration of the north face of the intake pumping station, opposite of the intakechannel, allows higher runup of 3.4 feet. The remaining south and east faces allowrunup of 2.4 feet. However, there are no credible entry points to the structure on thenorth, south, or east faces. Therefore, the runup on these faces is discounted. Therunup on the walls of the auxiliary, control, and shield buildings is 1.7 feet and reacheselevation 740.6, including wind setup.
HYDROLOGIC ENGINEERING 2.4-19
WATTS BAR
Runup does not exceed the design basis flood level for any of the structures.Additionally, runup at the diesel generator building is maintained on the slopesapproaching the structure and is below all access points to the building. Runup has noconsequence at the shield building because all accesses and penetrations belowrunup are designed and constructed as watertight elements.
The static effect of wind waves was accounted for by taking the static water pressurefrom the maximum height of the runup. The dynamic effects of wind waves wereaccounted for as follows:
The dynamic effect of nonbreaking waves on the walls of safety-related structures was• investigated using the Sainflou method[15 ]. Concrete and reinforcing stresses were
found to be within allowable limits.
The dynamic effect of breaking waves on the walls of safety-related structures wasinvestigated using a method developed by D. D. Gaillard and D. A. Molitar[16]. Theconcrete and reinforcing stresses were found to be less than the allowable stresses.
The dynamic effect of broken waves on the walls of safety-related structures wasinvestigated using the method proposed by the U.S. Army Coastal EngineeringResearch Center.[151 Concrete and reinforcing stresses were found to be withinallowable limits.
2.4.4 Potential Dam Failures, Seismically InducedThe procedures described in Appendix A of Regulatory Guide 1.59 were followedwhen evaluating potential flood. levels from seismically induced dam failures.
The plant site and upstream reservoirs are located in the Southern AppalachianTectonic Province and, therefore, subject to moderate earthquake forces with possibleattendant failure. Upstream dams whose failure has the potential to cause floodproblems at the plant were investigated to determine if failure from seismic eventswould endanger plant safety.
It should be clearly understood that these studies have been made solely to ensure thesafety of Watts Bar Nuclear Plant against failure by floods caused by the assumedfailure of dams due to seismic forces. To assure that safe shutdown of the Watts BarNuclear Plant is not impaired by flood waters, TVA has in these studies addedconservative assumptions to be able to show that the plant can be safety controlledeven in the event that all these unlikely events occur in just the proper sequence.
By furnishing this information TVA does not infer or concede that its dams areinadequate to withstand earthquakes that may be reasonably expected to occur in theTVA region under consideration. The TVA Dam Safety Program (DSP), which isconsistent with the Federal Guidelines for Dam Safety [38], conducts technical studiesand engineering analyses to assess the hydrologic and seismic integrity of agencydams and verifies that they can be operated in accordance with Federal EmergencyManagement Agency (FEMA) guidelines. These guidelines were developed toenhance national dam safety such that the potential for loss of life and property
2.4-20 HYDROLOGIC ENGINEERING
WATTS BAR
damage is minimized. As part of the TVA DSP, inspection and maintenance activitiesare carried out on a regular schedule to confirm the dams are maintained in a safecondition. Instrumentation to monitor the dams' behavior was installed in many of thedams during original construction. Based on the implementation of the DSP, TVA hasconfidence that its dams are safe against catastrophic destruction by any naturalforces that could be expected to occur.
2.4.4.1 Dam Failure Permutations
There are 12 major dams above Watts Bar Nuclear Plant whose failure could influenceplant site flood levels. Dam locations with respect to the Watts Bar Nuclear Plant siteare shown in Figure 2.4-2. These are Watts Bar and Fort Loudoun Dams on theTennessee River; Watauga, South Holston, Boone, Fort Patrick Henry, Cherokee, andDouglas Dams above Fort Loudoun; and Norris, Melton Hill, Fontana, and TellicoDams between Fort Loudoun and Watts Bar. These were examined individually, andin combinations, to determine if failure might result from a seismic event and, if so,would failure concurrent with storm runoff create maximum flood levels at the plant.
The procedures referred to in Regulatory Guide (RG) 1.59, Appendix A, were followedfor evaluating potential flood levels from seismically induced dam failures. Inaccordance with this guidance, seismic dam failure is examined using the two specifiedalternatives:
(1) the Safe Shutdown Earthquake (SSE) coincident with the peak of the 25-yearflood and a 2-year wind speed applied in the critical direction,
(2) the Operating Basis Earthquake (OBE) coincident with the peak of the one-half PMF and a 2-year wind speed applied in the critical direction.
The OBE and SSE are defined in Sections 2.5.2.4 and 2.5.2.7 as having maximumhorizontal rock acceleration levels of 0.09 g and 0.18 g respectively. As described inSection 2.5.2.4, TVA agreed to use 0.18 g as the maximum bedrock acceleration levelfor the SSE.
From the seismic dam failure analyses made for TVA's operating nuclear plants, it wasdetermined that five separate, combined events have the potential to create floodlevels above plant grade at Watts Bar Nuclear Plant. These events are as follows:
(1) The simultaneous failure of Fontana and Tellico dams in the OBE coincidentwith one-half PMF.
(2) The simultaneous failure of Fontana, Tellico, Hiwassee, Apalachia, and BlueRidge dams in the OBE coincident with one-half PMF.
(3) The simultaneous failure of Norris and Tellico dams in the OBE coincidentwith one-half PMF.
(4) The simultaneous failure of Cherokee, Douglas, and Tellico dams in the OBEcoincident with one-half PMF.
HYDROLOGIC ENGINEERING 2.4-21
WATTS BAR
(5) The simultaneous failure of Norris; Cherokee, Douglas, and Tellico dams inthe SSE coincident with a 25-year flood.
Tellico has been added to all five combinations which was not included in the originalanalyses for TVA's operating nuclear plants. It was included because the seismicstability analysis of Tellico is not conclusive. Therefore, Tellico was postulated to fail.
Concrete Structures
The standard method of computing stability is used. The maximum base compressivestress, average base shear stress, the factor of safety against overturning, and theshear strength required for a shear-friction factor of safety of 1 are determined. To findthe shear strength required to provide a safety factor of 1, a coefficient of friction of 0.65is assigned at the elevation of the base under consideration.
The analyses for earthquake are based on the pseudo-static analysis method as givenby Hindsl 7J with increased hydrodynamic pressures determined by the methoddeveloped by Bustamante and Flores[18]. These analyses include applying masonryinertia forces and increased water pressure to the structure resulting from theacceleration of the structure horizontally in the upstream direction and simultaneouslyin a downward direction. The masonry inertia forces are determined by a dynamicanalysis of the structure which takes into account amplification of the accelerationsabove the foundation rock.
No reduction of hydrostatic or hydrodynamic forces due to the decrease of the unitweight of water from the downward acceleration of the reservoir bottom is included inthe analysis.
Waves created at the free surface of the reservoir by an earthquake are considered ofno importance. Based upon studies by Chopra[191 and Zienkiewicz[ 201 it is TVA'sjudgment that before waves of any significant height have time to develop, theearthquake will be over. The duration of earthquake used in this analysis is in therange of 20 to 30 seconds.
Although accumulated silt on the reservoir bottom would dampen vertically travelingwaves, the effect of silt on structures is not considered. The accumulationrate is slow,as measured by TVA for many years[21 ].
Embankment
Embankment analysis was made using the standard slip circle method. The effect ofthe earthquake is taken into account by applying the appropriate static inertia force tothe dam mass within the assumed slip circle (pseudo-static method).
In the analysis the embankment design constants used, including the shear strengthof the materials in the dam and the foundation, are the same as those used in theoriginal stability analysis.
Although detailed dynamic soil properties are not available, a value for seismicamplification through the soil has been assumed based on previous studies pertaining
2.4-22 HYDROLOGIC ENGINEERING
WATTS BAR
to TVA nuclear plants. These studies have indicated maximum amplification valuesslightly in excess of two for a rather wide range of shear wave velocity to soil heightratios. For these analyses, a straight-line variation is used with an acceleration at thetop of the embankment being two times the top of rock acceleration.
Flood Routing
The runoff model of Section 2.4.3.3 was used to reevaluate potentially five criticalseismic events involving dam failures above the plant. Other events addressed inearlier studies (the postulated OBE single failures of Watts Bar and Fort Loudoun, thepostulated SSE combination failure of Fontana and Douglas, the SSE combinationfailure of Fontana, Fort Loudoun, and Tellico, the SSE combination failure of Norris,Douglas, Fort Loudoun and Tellico, and the single SSE failure of Norris) producedplant site flood levels sufficiently lower than the controlling events and therefore werenot re-evaluated.
The procedures prescribed by Regulatory Guide 1.59 require seismic dam failure to beexamined using the SSE coincident with the peak of the 25-year flood, and the OBEcoincident with the peak of one-half the PMF.
Reservoir operating procedures used were those applicable to the season and floodinflows.
OBE Concurrent With One-Half the Probable Maximum Flood
Watts Bar Dam
Stability analyses of Watts Bar Dam powerhouse and spillway sections result in thejudgment that these structures will not fail. The analyses show low stresses in thespillway base, and the powerhouse base. Original results are given in Figure 2.4-68and were not updated in the current analysis. Dynamic analysis of the concretestructures resulted in the determination that the base acceleration is amplified at levelsabove the base. The original slip circle analysis of the earth embankment sectionresults in a factor of safety greater than 1, and the embankment is judged not to fail.
For the condition of peak discharge at the dam for one-half the probable maximumflood the spillway gates are in the wide-open position with the bottom of the gatesabove the water. This condition was not analyzed because the condition with bridgefailure described in the following paragraphs produces the controlling condition.
Analysis of the bridge structure for forces resulting from the OBE, includingamplification of acceleration results in the determination that the bridge could fail as aresult of shearing the anchor bolts. The downstream bridge girders are assumed tostrike the spillway gates. The impact of the girders striking the gates is assumed to failthe bolts which anchor the gate trunnions to the pier anchorages allowing the gates tofall on the spillway crest and be washed into the channel below the dam. The flow overthe spillway crest would be the same as that prior to bridge and gate failure, i.e., peak
HYDROLOGIC ENGINEERING 2.4-23
WATTS BAR
discharge for one-half the probable maximum flood with gates in the wide-openposition. Hence, bridge failure will cause no adverse effect on the flood.
Previous evaluations determined that if the dam was postulated to fail fromembankment overtopping in the most severe case (gate opening prevented by bridgefailure) that the resulting elevations at Watts Bar Nuclear Plant would be several feetbelow plant grade elevation 728.0. Therefore, this event was not reevaluated.
Fort Loudoun Dam
Stability analyses of Fort Loudoun Dam powerhouse and spillway sections result in thejudgment that these structures will not fail. The analyses show low base stresses, withnear two-thirds of the base in compression. The original results, given in Figure 2.4-71,were not updated for the current analysis.
Slip circle analysis of the earth embankment results in a factor of safety of 1.26, andthe embankment is judged not to fail. The original results, given in Figure 2.4-72, werenot updated in the current analysis.
The spillway gates and bridge are of the same design as those at Watts Bar Dam.Conditions of failure during the OBE are the same, and no problems are likely.Coincident failure at Fort Loudoun and Watts Bar does not occur.
For the potentially critical case of Fort Loudoun bridge failure at the onset of the mainportion of one half the probable maximum flood flow into Fort Loudoun Reservoir, in anearlier analysis it was found that the Watts Bar inflows are much less than the conditionresulting from simultaneous failure of Cherokee, Douglas, and Tellico as describedlater.
Tellico Dam
Although, not included in the original analyses for TVA's operating nuclear plants,Tellico is judged to fail completely because the seismic stability analysis of Tellico isnot conclusive. No hydrologic results are given for the single failure of Tellico becausethe simultaneous failure of Tellico with other dams discussed under multiple failures,is more critical.
Norris Dam
Although an evaluation made in 1975 by Agbabian Associates concluded that NorrisDam would not fail in an OBE (with one-half PMF) or SSE (with 25-year flood) theoriginal study postulated failure in both seismic events. To be consistent with priorstudies Norris was conservatively postulated to fail. Figure 2.4-76 shows thepostulated condition of the dam after OBE failure. The location of the debris is notbased on any calculated procedure of failure because it is believed that this is notpossible. It is TVA's judgment, however, that the failure mode shown is one logicalassumption; and, although there may be many other logical assumptions, the amountof channel obstruction would probably be about the same.
2.4-24 HYDROLOGIC ENGINEERING
WATTS BAR
The discharge rating for this controlling, debris section was developed from a 1:150scale hydraulic model at the TVA Engineering Laboratory and was verified closely bymathematical analysis.
No hydrologic results are given for the single failure of Norris dam because thesimultaneous failure of Norris and Tellico, discussed under multiple failures, is morecritical.
Cherokee Dam
Results of the original Cherokee Dam stability analysis for a typical spillway block areshown in Figure 2.4-77. The spillway is judged stable at the foundation base elevation900. Analyses made for other elevations above elevation 900, but not shown in Figure2.4-77, indicate the resultant of forces falls outside the base at elevation 1010. Thespillway is assumed to fail at this elevation.
The non-overflow dam is embedded in fill to elevation 981.5 and is considered stablebelow that elevation. However, original stability analysis indicates failure will occurabove the fill line.
The powerhouse intake is massive and backed up by the powerhouse. Therefore, it isjudged able to withstand the OBE without failure.
Results of the original analysis for the highest portion of the south embankment areshown on Figure 2.4-78. The analysis was made using the same shear strengths ofmaterial as were used in the original analysis and shows a factor of safety of 0.85.Therefore, the south embankment is assumed to fail during the OBE. Because thenorth embankment and saddle dams 1, 2, and 3 are generally about one-half, or less,as high as the south embankment, they are judged to be stable for the OBE.
Figure 2.4-79 shows the assumed condition of the dam after failure. All debris fromfailure of the concrete portion is assumed to be located downstream in the channel atelevations lower than the remaining portions of the dam and, therefore, will not obstructflow.
No hydrologic results are given for the single failure of Cherokee Dam because thesimultaneous failure of Cherokee, Douglas, and Tellico discussed under multiplefailures, is more critical.
Douglas Dam
Results of the original Douglas Dam stability analysis for a typical spillway block areshown in Figure 2.4-80. The upper part of the Douglas spillway is approximately 12feet higher than Cherokee, but the amplification of the rock surface acceleration is thesame. Therefore, based on the Cherokee analysis, it is judged that the Douglasspillway will fail at elevation 937, which corresponds to the assumed failure elevationof the Cherokee spillway.
The Douglas non-overflow dam is similar to that at Cherokee and is embedded in fill toelevation 927.5. It is considered stable below that elevation. However, based on the
HYDROLOGIC ENGINEERING 2.4-25
WATTS BAR
Cherokee analysis, it is assumed to fail above the fill line. The abutment non-overflowblocks 1-5 and 29-35, being short blocks, are considered able to resist the OBE withoutfailure.
The powerhouse intake is massive and backed up downstream by the powerhouse.Therefore, it is considered able to withstand the OBE without failure.
Results of the original analysis of the saddle dam shown on Figure 2.4-81 indicate afactor of safety of 1. Therefore, the saddle dam is considered to be stable for the OBE.
Figure 2.4-82 shows the portions of the dam judged to fail and the portions judged toremain. All debris from the failed portions is assumed to be located downstream in thechannel at elevations lower than the remaining portions of the dam and, therefore, willnot obstruct flow.
No hydrologic results are given for the single failure of Douglas Dam because thesimultaneous failure of Cherokee, Douglas, and Tellico as discussed later undermultiple failures, is more critical.
Fontana Dam
The original hydrological analysis used a conservative seismic failure condition forFontana Dam. A subsequent review which takes advantage of later earthquakestability analysis and dam safety modifications performed for the TVA DSP has defineda conservative but less restrictive seismic failure condition at Fontana [4o]. Thissubsequent review used a finite element model for the analysis and considered themaximum credible earthquake expected at the Fontana Dam site. Figure 2.4-83 showsthe part of Fontana Dam judged to remain in its original position after postulated failure.
No hydrologic results are given for the single failure of Fontana Dam because thesimultaneous failure of Fontana and Tellico, as discussed later under multiple failures,is more critical.
Multiple Failures
Previous attenuation studies of the OBE above Watts Bar Dam result in the judgmentthat the following simultaneous failure combinations require reevaluation:
(1) The Simultaneous Failure of Fontana and Tellico in the OBE Coincident withOne-Half PMF
Figure 2.4-83 shows the postulated condition of Fontana for the OBE event. Tellicowas conservativelypostulated to completely fail.
The seismic failure scenario for Fontana and Tellico include postulated simultaneousand complete failure of non-TVA dams on the Little Tennessee River, Cheoah,Calderwood, and Chilhowee and on its tributaries, Nantahala and Santeetlah dams.Failure of the bridge at Fort Loudoun dam would render the spillway gates inoperablein the wide open position. Watts Bar spillway gates would be operable during and afterthe OBE. I
2.4-26 HYDROLOGIC ENGINEERING
WATTS BAR
Watts Bar headwater would reach 756.13, 13.87 feet below the top of theembankment. The west saddle dike at Watts Bar with top elevation of 757 would notbe overtopped. The peak discharge at Watts Bar Nuclear Plant would be 743,668cfs. The elevation at Watts Bar Nuclear Plant would be 720.65, 7.35 feet below plant,grade elevation 728.
(2) The Simultaneous Failure of Fontana, Tellico, Hiwassee, Apalachia, andBlue Ridge Dams in the OBE Coincident with One-Half PMF
Fontana, Tellico, Hiwassee, Apalachia and Blue Ridge Dams could fail when the OBEis located within a football-shaped area located between Fontana and Hiwassee dams(Figure 2.4-112). Failure scenarios for Fontana, Tellico, Hiwassee, Apalachia, andBlue Ridge dams include postulated simultaneous failure of non-TVA dams on theLittle Tennessee River, Cheoah, Calderwood and Chilhowee and on its tributaries,Nantahala and Santeetlah dams.
Based on previous attenuation studies, the OBE event produces maximum groundaccelerations of 0.09 g at Fontana, 0.09 g at Hiwassee, 0.07 g at Apalachia, 0.08 g atChatuge, 0.05 g at Nottely, 0.03 g at Ocoee No.1, 0.04 g at Blue Ridge, 0.04 g at FortLoudoun and Tellico, and 0.03 g at Watts Bar. Figure 2.4.4-83 shows the postulatedcondition of Fontana Dam after failure. Hiwassee, Apalachia, Blue Ridge, and Tellicodams are postulated to completely fail. Chatuge is judged not to fail in this defined OBEevent.
Nottely Dam is a rock-fill dam with large central impervious rolled fill core. Themaximum attenuated ground acceleration at Nottely in this event is only 0.054 g. Afieldexploration boring program and laboratory testing program of samples obtained in afield exploration was conducted. During the field exploration program, standardpenetration test blow counts were obtained on both the embankment and itsfoundation materials. Both static and dynamic (cyclic) triaxial shear tests were made.The Newmark Method of Analysis utilizing the information obtained from the testingprogram was used to determine the structural stability of Nottely Dam. It is concludedthat Nottely Dam can resist the attenuated ground acceleration of 0.054 g with nodetrimental damage.
Ocoee No.1 Dam is a concrete gravity structure. The maximum attenuated groundacceleration is 0.03 g. Based on past experience of concrete dam structures undersignificantly higher seismic ground accelerations, the Ocoee No. 1 Dam is judged toremain stable following exposure to a 0.03 g base acceleration with amplification.
Ocoee No. 1 and Ocoee No. 3 dams, downstream of Blue Ridge Dam, would beovertopped and were postulated to completely fail at their respective maximumheadwater elevations. Ocoee No. 2 has no reservoir storage and was not considered.
Fort Loudoun and Watts Bar~spillways would remain operable. The Fontana failurewave would transfer water through the Canal from Tellico into Fort Loudoun, but itwould not be sufficient to overtop Fort Loudoun dam. The maximum headwater at FortLoudoun would reach elevation 817.13 ft., 19.87 ft. below the top of the dam. WattsBar headwater would reach elevation 756.13 ft., 13.87 ft. below the top of dam. The
HYDROLOGIC ENGINEERING 2.4-27
WATTS BAR
west saddle dike at Watts Bar with a top elevation of 757.00 ft. would not beovertopped.
The peak discharge at the Watts Bar Nuclear Plant site produced by the OBE failureof Fontana, Tellico, Hiwassee, Apalachia, and Blue Ridge coincident with the one-halfPMF is 742,572 cfs. The peak elevation is 722.01 ft, 5.99 feet below 728 plant grade.
(3) The Simultaneous Failure of Norris and Tellico Dams in the OBE Coincidentwith One-Half PMF
Figure 2.4-76 shows the postulated condition of Norris Dam for the OBE event. Tellicowas conservatively postulated to completely fail in this event.
In the hydrologic routing for this failure, Melton Hill Dam would be overtopped and waspostulated to fail when the flood wave reached headwater elevation 817, based on thestructural analysis and subsequent structural modifications performed at the dam as aresult of the Dam Safety Program.
The headwater at Watts Bar Dam would reach elevation 763.42 ft., 6.58 ft. below topof dam. The west saddle dike at Watts Bar with top at elevation 757 would beovertopped and breached. A complete washout of the dike was assumed.Chickamauga headwater would reach 701.48 ft., 4.52 ft. below top of dam. The.embankments at Nickajack Dam would be overtopped but was postulated not tobreach which is conservative.
The peak discharge at the Watts Bar Nuclear Plant site produced by the OBE failureof Norris and Tellico dams coincident with the one-half PMF is 910,994 cfs. The peakelevation is 728.84 ft., 0.84 feet above 728 plant grade.
(4) The Simultaneous Failure of Cherokee, Douglas, and Tellico in the OBECoincident with One-Half PMF
Figures 2.4-79 and 2.4-82 show the postulated condition after failure of Cherokee andDouglas dams, respectively. Tellico was conservatively postulated to completely fail.
This combination was not run specifically for the Watts Bar Nuclear Plant analysis.Rather, the results for this combination were taken from the Bellefonte Nuclear Plantanalyses. The primary difference between the Bellefonte Nuclear Plant calculationand that for Watts Bar Nuclear Plant is the headwater rating curve used atChickamauga dam. For the Bellefonte Nuclear Plant analyses the future lockconfiguration (5 spillway bays removed leaving 13 spillway bays) was used rather thanthe current lock configuration (with 18 spillway bays) used in the Watts Bar NuclearPlant analysis, which will allow less water to flow out of Chickamauga. This wouldresult in a higher headwater at Chickamauga and produce a slightly higher elevationat Watts Bar Nuclear Plant which is conservative. There would, be no overtopping ofChickamauga dam with either case.
The peak discharge at the Watts Bar Nuclear Plant site produced by the OBE failureof Cherokee, Douglas, and Tellico with the one-half PMF using the Bellefonte Nuclear
2.4-28 HYDROLOGIC ENGINEERING
WATTS BAR
Plant analysis is 1,104,323 cfs. The peak elevation is 729.22, 1.22 feet above 728plant grade.
SSE Concurrent With 25-Year Flood
The SSE will produce the same postulated failure of the Fort Loudoun and Watts Barbridges as described for the OBE described earlier. The resulting flood level at theWatts Bar plant was not determined because the larger flood during the OBE makesthat situation controlling.
Watts Bar Dam
A reevaluation was not made for Watts Bar Dam for SSE conditions. However, evenif the dam is arbitrarily removed instantaneously, the level at the Watts Bar Nuclear Iplant based on previous analyses would be below 728 plant grade.
Fort Loudoun Dam
Results of the original stability analysis for Fort Loudoun Dam are shown on Figure 2.4-86. Because the resultant of forces falls outside the base, a portion of the spillway isjudged to fail. Based on previous modes of failure for Cherokee and Douglas, thespillway is judged to fail above elevation 750 as well as the bridge supported by thespillway piers.
The results of the original slip circle analysis for the highest portion of the embankmentare shown on Figure 2.4-87. Because the factor of safety is less than one, theembankment is assumed to fail.
No analysis was made for the powerhouse under SSE. However, an analysis wasmade for the OBE with no water in the units, a condition believed to be an extremelyremote occurrence during the OBE. Because the stresses were low and a largepercentage of the base was in compression, it is considered that the addition of waterin the units would be a stabilizing factor, and the powerhouse is judged not to fail.
Figure 2.4-88 shows the condition of the dam after postulated failure. All debris fromthe failure of the concrete portions is assumed to be located in the channel below thefailure elevations.
No hydrologic routing for the single failure of Fort Loudoun, including the bridgestructure, is made because its simultaneous failure with other dams is considered asdiscussed later in this subparagraph.
Tellico Dam
No hydrologic routing for the single failure of Tellico is made because its simultaneousfailure with other dams is more critical as discussed later in this sub-paragraph.
Norris Dam
Although an evaluation made in 1975 by Agbabian Associates concluded that NorrisDam would not fail in the SSE (with 25 year flood), Norris Dam was postulated to fail. I
HYDROLOGIC ENGINEERING 2.4-29
WATTS BAR
The resulting debris downstream would occupy a greater span of the valley crosssection than would the debris from the OBE but with the same top level, elevation 970.Figure 2.4-90 shows the part of the dam judged to fail and the location and height ofthe resulting debris.
The discharge rating for this controlling, debris section was developed from a 1:150scale hydraulic model at the TVA Engineering Laboratory and was verified closely bymathematical analysis. The somewhat more extensive debris in SSE failure restrictsdischarge slightly compared to OBE failure conditions.
No hydrologic routing for the single failure of Norris was made because thesimultaneous failure with Cherokee, Douglas and Tellico, discussed under multiplefailures, is more critical.
Cherokee
The SSE is judged to produce the same postulated failure of Cherokee as wasdescribed for the OBE. The single failure does not need to be carried downstreambecause elevations would be lower than the same OBE failure in one-half the probablemaximum flood.
Douglas
The SSE is judged to produce the same postulated failure of Douglas as was describedfor the OBE. The single failure does not need to be carried downstream becauseelevations would be lower than the same OBE failure in one-half the probablemaximum flood.
Multiple Failures
TVA considered the following multiple SSE dam failures.
(5) The Simultaneous Failure of Norris, Cherokee, Douglas and Tellico Dams inthe SSE Coincident with 25-year Flood
The SSE must be located in a very precise region to have the potential for multiple damfailures. In order to fail Norris, Cherokee, Douglas and Tellico dams, the epicenter ofSSE must be confined to a relatively small area the shape of a football, about 10 mileswide and 20 miles long.
Figure 2.4-91 shows the location of an SSE, and its attenuation, which produces 0.15g at Norris, 0.09 g at Cherokee and Douglas, 0.08 g at Fort Loudoun and Tellico, 0.05g at Fontana, and 0.03 g at Watts Bar. Fort Loudoun and Watts Bar have previouslybeen judged not to fail for the OBE (0.09 g). The bridge at Fort Loudoun Dam,however, might fail under 0.08 g forces, falling on any open gates and on gate hoistingmachinery. Trunnion anchor bolts of open gates would fail and the gates~would bewashed downstream, leaving an open spillway. Closed gates could not be opened.By the time of the seismic event at upstream tributary dams the crest of the 25 yearflood would likely have passed Fort Loudoun and flows would have been reduced toturbine capacity. Hence, spillway gates would be closed. At least this most
2.4-30 HYDROLOGIC ENGINEERING
WATTS BAR
conservative assumption was used. As stated before, it is believed that multiple damfailure is extremely remote, and it seems reasonable to exclude Fontana on the basisof being the most distant in the cluster of dams under consideration. For the postulatedfailures of Norris, Cherokee, and Douglas the portions judged to remain and debrisarrangements are as given in Figures 2.4-90, 2.4-79, and 2.4-82, repectively. Tellicois conservatively postulated to completely fail.
The flood for the postulated failure combination would overtop and breach the southembankment and marina saddle dam at Fort Loudoun. At Watts Bar Dam theheadwater would reach Elevation 765.49, 4.51 feet below the top of the earthembankment of the main dam. However, the West Saddle Dike with top at elevation757 would be overtopped and breached. The headwater at Chickamauga Dam wouldreach elevation 701.10 ft. , 4.91 ft. below top of dam. The embankments at NickajackDam would be overtopped but was conservatively postulated not to breach.
The maximum discharge at Watts Bar Nuclear Plant would be 977,618 cfs. Theelevation at the plant site would be 731.11, 3.11 feet above 728 plant grade. This is thehighest flood elevation resulting from any combination of seismic events.
The flood elevation hydrograph at the plant site is shown on Figure 2.4-113.
In addition to the SSE failure combination of Norris, Cherokee, Douglas, and Tellicoidentified as the critical case, three other combinations were evaluated in earlierstudies. These three originally analyzed combinations produced significantly lowerelevations and were therefore not reevaluated.
In order to fail Norris, Douglas, Fort Loudoun, and Tellico dams, the epicenter of anSSE must be confined to a triangular area with sides of approximately one mile inlength. However, as an extreme upper limit the above combination of dams ispostulated to fail as well as the combination of (1) Fontana, Fort Loudoun, and Tellico;and (2) Fontana and Douglas.
An SSE centered between Fontana and the Fort Loudoun Tellico complex waspostulated to fail these three dams. The four ALCOA dams downstream from Fontanaand Nantahala, a Duke Energy dam (formerly ALCOA) upstream, were also postulatedto fail completely in this event. Watts Bar Dam would remain intact. This flood levelwas not reevaluated because previous analysis showed it was not controlling.
Norris, Douglas, Fort Loudoun, and Tellico Dams were postulated to failsimultaneously. Figure 2.4-93 shows the location of an SSE, and its attenuation, whichproduces 0.12 g at Norris, 0.08 g at Douglas, 0.12 g at Fort Loudoun and Tellico, 0.07g at Cherokee, 0.06 g at Fontana, and 0.04 g at Watts Bar. Cherokee is judged not tofail at 0.07 g; Watts Bar has previously been judged not to fail at 0.09 g; and, for thesame reasons as given above, it seems reasonable to exclude Fontana in this failurecombination. For the postulated failures of Norris, Douglas, Fort Loudoun, and Tellico,the portions judged to remain and the debris arrangements are as given in Figures 2.4-76, 2.4-82, 2.4-88 and 2.4-89 for single dam failure. Fort Loudoun and Tellico werepostulated to fail completely as the portions judged to remain are relatively small. Thisis conservative. This combination was not reevaluated.
HYDROLOGIC ENGINEERING 2Z4-31
WATTS BAR
Douglas and Fontana were postulated to fail simultaneously. Figure 2.4-94 shows thelocation of an SSE and its attenuation, which produces 0.14 g at Douglas, 0.09 g atFontana, 0.07 g at Cherokee, 0.05 g at Norris, 0.06 g at Fort Loudoun and Tellico, and0.03 g at Watts Bar. For the postulated failures of Douglas and Fontana, the portionsjudged to remain and the debris arrangements for Douglas are as given in Figures 2.4-82 and 2.4-83 for single dam failure. Fort Loudoun, Tellico, and Watts Bar havepreviously been judged not to fail for the OBE (0.09 g). Postulation of Tellico failure inthis combination has not been evaluated but is bounded by the SSE failure of Norris,Cherokee, Douglas and Tellico.
2.4.4.2 Unsteady Flow Analysis of Potential Dam Failures
Unsteady flow routing techniques (Reference 23) were used to evaluate plant site floodlevels from postulated seismically induced dam failures wherever their inherentaccuracy was needed. In addition to the flow models described in Section 2.4.3.3, themodels described below were used to develop the outflow hydrographs from thepostulated dam failures. The HEC-HMS storage routing was used to compute theoutflow hydrograph from the postulated failure of each dam except where the dam waspostulated to completely fail. In the case of dams which were postulated to failcompletely (Hiwassee, Apalachia and Blue Ridge) HEC-RAS was used to develop theoutflow hydrograph. For Tellico dam the complete failure was analyzed with the SOCHmodel.
Thefailure time and initial reservoir elevations for each dam were determined from apre-failure TRBROUTE analysis. HEC-HMS was used to develop the post failureoutflow hydrographs based on the previously determined dam failure rating curves.The outflow hydrographs were validated by comparing the HEC-HMS results withthose generated by simulations using TRBROUTE.
2.4.4.3 Water Level at Plantsite
The unsteady flow analyses of the five postulated combinations of seismic dam failurescoincident with floods analyzed yields a maximum elevation of 731.11 at Watts BarNuclear Plant, excluding wind wave effects. The maximum elevation would result fromthe SSE failure of Norris, Cherokee, Douglas, and Tellico Dams coincident with the 25-year flood postulated to occur in June when reservoir levels are high. Table 2.4-14provides a summary of flood elevations determined for the five failure combinationsanalyzed.
Coincident wind wave activity for the PMF is described in Section 2.4.3.6. Wind waveswere not computed for the seismic events, but superimposed wind wave activity fromguide specified 2-year wind speed would result in water surface elevations several feetbelow the PMF elevation 738.8 described in section 2.4.3.
2.4.5 Probable Maximum Surge and Seiche Flooding
Chickamauga Lake level during non-flood conditions would not exceed elevation682.5, normal maximum pool level, for any significant time. No conceivablemeteorological conditions could produce a seiche nor reservoir operations a surge
2.4-32 HYDROLOGIC ENGINEERING
WATTS BAR
which would reach plant grade elevation 728, some 45 feet above normal maximumpool levels.
2.4.6 Probable Maximum Tsunami Flooding
Because of its inland location the Watts Bar plant is not endangered by tsunamiflooding.
2.4.7 Ice Effects
Because of its location in a temperate climate significant amounts of ice do not form onlakes and rivers in the plant vicinity and ice jams are not a source of major flooding.
The present potential for generator of significant surface ice at the site is less todaythan prior to closure of Chickamauga and Watts Bar Lakes in 1940 and 1942,respectively. This condition exists because of (1) daily water level fluctuations fromoperating Chickamauga Reservoir downstream and Watts Bar Reservoir upstreamwould break up surface icing before significant thickness could be formed, (2) flows arewarmed by releases from near the bottom of Watts Bar Reservoir, and (3) increasedwater depths due to Chickamauga Reservoir result in a greater mass needing to becooled by radiation compared to pre-reservoir conditions.
After closure of Watts Bar in January 1942, there have been no extended periods ofcold weather and no serious icing conditions in the Watts Bar Nuclear Plant site region.On several occasions, ice has formed near the shore and across protected inlets buthas not constituted a problem on the main reservoirs.
The lowest water temperature observed in Watts Bar Lake at the dam during theperiods 1942-1953, and June 1967 to November 1973 for which records were kept,was 39 degrees on January 30, 1970, the coldest January since 1940 in the easternpart of the Basin. This lake temperature is indicative of the lowest water temperaturereleased from Watts Bar Lake during winter months.
The most severe period of cold weather recorded in the Valley was January and earlyFebruary 1940 prior to present lake conditions at the plantsite. A maximum ice depthof five inches was recorded on the Tennessee River at Chattanooga. There were noice jams except one small one on the lower French Broad River.
Records of icing are limited and none are available at the site prior to 1942. Fromnewspaper records, the earliest known freeze in the vicinity was at Knoxville in 1796.More recently, newspaper accounts and U.S. Weather Bureau records for Knoxvilleprovide a fairly complete ice history from 1840 to 1940. At Knoxville the TennesseeRiver was frozen over 16 times, and floating ice was observed six other times.
The most severe event in this period prior to 1940 was in December-January 1917-18when ice jammed the Tennessee River at Knoxville for 1 to 2 weeks, reaching 10 feethigh at some places. In late January rain and temperature rise produced flooding onthe Clinch River referred to by local people as the "ice tide." There is no record of icejamming, however.
HYDROLOGIC ENGINEERING 2.4-33
WATTS BAR
There are no safety-related facilities at the Watts Bar site which could be affected byan ice jam flood, wind-drive ice ridges, or ice-produced forces other than a flooding ofthe plant itself. An ice jam sufficient to cause plant flooding is inconceivable. Thereare no valley restrictions in the 1.9-mile reach below Watts Bar Dam to initiate a jam,and an ice dam would need to reach at least 68 feet above streambed to endanger theplant.
Intake pump suctions which will be used for the intake of river water will be located aminimum of 7.6 feet below minimum reservoir water level; hence, no thin surface icewhich may form will effect the pipe intake. In the assumed event of complete failure ofChickamauga Dam downstream, the minimum release from Watts Bar Dam will ensurea 5.9 foot depth of water in the intake channel.
2.4.8 Cooling Water Canals and Reservoirs
The intake channel, as shown in Figure 2.1-5, extends approximately 800 feet from theedge of the reservoir through the flood plain to the intake pumping station. Thechannel, as shown in Figure 2.4-99, has an average depth of 36 feet and is 50 feet wideatthe bottom. The side slopes are 4 on 1 and are designed for sudden drawdown, dueto assumed loss of downstream dam, coincident with a safe shutdown earthquake.
In response to multipurpose operations, the level of Chickamauga Reservoir fluctuatesbetween a normal minimum of 675.0 feet and a normal maximum of 682.5 feet. Theminimum average elevation of the reservoir bottom at the intake channel is 656 feetand the elevation of the intake channel bottom is 660 feet. The 15 foot normalminimum depth of water provided in the intake channel is more than ample toguarantee flow requirements. The intake provides cooling water makeup to theclosed-cycle cooling system and the essential raw cooling water systems. Themaximum flow requirement for the plant for all purposes is 178 cfs based on fourERCW pumps and six RCW pumps inservice.
The protection of the intake channel slopes from wind-wave activity is afforded by theplacement of riprap, shown in Figures 2.4-99 in accordance with TVA designstandards, from elevation 660 to elevation 690. The riprap is designed for wavesresulting from a wind velocity of 50 mph.
2.4.9 Channel Diversions
Channel diversion is not a potential problem for the plant. Currently, no channeldiversions upstream of the Watts Bar plant would cause diverting or rerouting of thesource of plant cooling water, and none are anticipated in the future. The floodplain issuch that large floods do not produce major channel meanders or cutoffs. Thetopography is such that only an unimaginable catastrophic event could result in flowdiversion above the plant.
2.4.10 Flooding Protection Requirements
Assurance that safety-related facilities are capable of surviving all possible floodconditions is provided by the discussions given in Sections 2.4.14, 3.4, 3.8.1, 3.8.2 and3.8.4
2.4-34 HYDROLOGIC ENGINEERING
WATTS BAR
The plant is designed to shut down and remain in a safe shutdown condition for anyrainfall flood exceeding plant grade, up to the "design basis flood" discussed in Section2.4.3 and for lower, seismic-caused floods discussed in Section 2.4.4. Any rainfallflood exceeding plant grade will be predicted at least 28 hours in advance by TVA'sWater Resources organization.
Notification of seismic failure of key upstream dams will be available at the plantapproximately 27 hours before a resulting flood surge would reach plant grade. Hence,there is adequate time to prepare the plant for any flood.
See Section 2.4.14 for a detailed presentation of the flood protection plan.
2.4.11 Low Water Considerations
Because of its location on Chickamauga Reservoir, maintaining minimum water levelsat the Watts Bar plant is not a problem. The high rainfall and runoff of the watershedand the regulation afforded by upstream dams assure minimum flows for plant cooling.
2.4.11.1 Low Flow in Rivers and Streams
The probable minimum water level at the Watts Bar plant is Elevation 675 and wouldoccur in the winter flood season as a result of Chickamauga Reservoir operation. Themost severe drought in the history of the Tennessee Valley region occurred in 1925.Frequency studies for the 1874-1935 period prior to regulation show that there is lessthan one percent change that the 1925 observed minimum 1-day flow of 3300 cfsdownstream at Chattanooga might occur in a given year. At the plant site thecorresponding minimum 1-day flow is estimated to be 2700 cfs.
In the assumed event of complete failure of Chickamauga Dam and with the headwaterbefore failure assumed to be the normal summer level, Elevation 682.5, the watersurface at Watts Bar Nuclear Plant will begin to drop 3 hours afterfailure of the damand will fall at a fairly uniform rate to Elevation 666 in approximately 27 hours fromfailure. This time period is more than ample for initiating the release of water fromWatts Bar Dam. I
The estimated minimum flow requirementfor the ERCW System is 50 cfs; however, inorder to guarantee both ample depth and supply of water, a minimum flow of 3,200 cfswill be released from Watts Bar Dam. With flow of 3,200 cfs water surface elevationwould be 665.9 producing 5.9-foot depth in the intake channel.
2.4.11.2 Low Water Resulting From Surges, Seiches, or Tsunami
Because of Watts Bar's inland location on a relatively small, narrow lake, low water-levels resulting from surges, seiches, or tsunamis are not a potential problem.
2.4.11.3 Historical Low Water
From the beginning of stream gage records at Chattanooga in 1874 until the closureof Chickamauga Dam in January 1940, the estimated minimum daily flow at Watts BarNuclear Plant site was 2700 cfs on September 7 and 13, 1925. The next lowestestimated flow of 3900 cfs occurred in 1881 and also in 1883.
HYDROLOGIC ENGINEERING 2.4-35
WATTS BAR
Since January 1942 low flows at the site have been regulated by TVA reservoirs,particularly by Watts Bar and Chickamauga Dams. Under normal operatingconditions, there may be periods of several hours daily when there are no releasesfrom either or both dams, but average daily flows at the site have been less than 5,000cfs about 2.2% of the time and have been less than 10,000 cfs about 10.4% of the time.
On March 30 and 31, 1968, during special operations for the control of water milfoilthere were no releases from either Watts Bar or Chickamauga Dams during the 2-dayperiod. Over the last 25 years (1986 - 2010) the number of zero flow days at Watts Barand Chickamauga dams have been 0 and 2, respectively.
Since January 1940, water levels at the plant have been controlled by ChickamaugaDam. For the period (1940 - 2010) the minimum level at the dam was 673.3 on January21,1942.
2.4.11.4 Future Control
Future added controls which could alter low flow conditions at the plant are notanticipated because no sites that would have a significant influence remain to bedeveloped. However, any control that might be considered would be evaluated beforeimplementation.
2.4.11.5 Plant RequirementsThe Engineering Safety Feature System water supply requiring river water is theEssential Raw Cooling Water (ERCW). Also, the high pressure fire pumps perform anessential safety function during flood conditions by providing a feedwater supply tosteam generators, makeup to the spent fuel pool, and auxiliary boration makeup tank.For interface of the fire protection system with the Auxiliary Feedwater System, seeSection 10.4.9. The ERCW pumps are located on the intake pumping station deck atElevation 741.0 and the ERCW pump intake is at Elevation 653.33 feet. The ERCWintake will require 5 feet of submergence. Based on a minimum river surface elevationof 665.9 feet, a minimum of 12.57 feet of pump suction submergence will be provided.
In the assumed event of complete failure of Chickamauga Dam and with the headwaterbefore failure assumed to be the normal summer level, Elevation 682.5, the watersurface at the site will begin to drop 3 hours after failure of the dam and will fall at afairly uniform rate to Elevation 666 in approximately 27 hours from failure. This timeperiod is more than ample for initiating the release of water from Watts Bar Dam.
The estimated minimum flow requirement for the ERCW System is 50 cfs. However,in order to guarantee both ample depth and supply of water, a minimum flow of 3,200cfs can be released from Watts Bar Dam. This flow will give a river surface elevationof 665.9, which ensures a 5.9-foot depth of water in the intake channel andapproximately 10 feet in the river.
A flow of at least 3,200 cfs can be released at the upstream dam, Watts Bar, throughthe spillway gates, the turbines or the lock. The spillway gates offer the largest flow ofwater. There are twenty 40-foot-wide radial gates operated by two traveling gate hoistson the deck and one of the hoists is always located over a gate. At minimum
2.4-36 HYDROLOGIC ENGINEERING
WATTS BAR
headwater Elevation 735.0, there are several gate arrangements that could be used tosupply the minimum 3,200 cfs flow.
There are five turbines, each with a maximum flow of 9,400 cfs and an estimatedspeed/non-load flow of 900 to 1100 cfs. The lock culvert emptying and filling valvesare electrically operated segmental type with a bypass switch located in each of thefour valve control stations. These can be used at any time to open or close both fillingand emptying valves.
In the improbable event of loss of station service power at the dam, a 300-kVAgasoline-engine-driven generator located in the powerhouse will supply emergencypower. The generator feeds into the main board when used and the emergency poweris adequate to operate each of the three sources of water supply discussed.
For concurrent loss of upstream and downstream dams, assurance that sufficient flowwill be available is provided by review of the estimated low flows for the period 1903 -2010 on the basin above Wats Bar Dam which show that the 15 day, 30 day, 50 day,
and 100 day sustained low flow would be 2907 cfs, 3158 cfs, 3473 cfs, and 4012 cfs,respectively. If additional flow is needed to supply the minimum 3200 cfs it could besupplemented by use of upstream reservoir storage.
2.4.12 Dispersion, Dilution, and Travel Times of Accidental Releases of LiquidEffluents
2.4.12.1 Radioactive Liquid Wastes
A discussion of the routine handling and release of liquid radioactive wastes is foundin Section 11.2, "Liquid Waste Systems." The routine and nonroutine nonradiologialliquid discharges are addressed in the Watts Bar Nuclear Plant's NPDES permit(Permit No. TN0020168) and the Spill, Prevention, Control, and Countermeasure Plan(SPCC plan), respectively. The nonradiological liquid discharges are under theregulatory jurisdiction of the State of Tennessee.
2.4.12.2 Accidental Slug Releases to Surface Water
An accidental release of radioactive or nonradioactive liquid from the plant site wouldbe subject to naturally induced mixing in the Tennessee River. The worst case for agiven volume, Vo (cubic feet), of liquid is a release which takes place over a shortperiod of time. Calculations have been made to determine the reduction inconcentration of such a release as it progresses downstream; particular emphasis hasbeen placed on the concentrations at the surface water intakes downstream of theplant. The model used here is based on the convective diffusion equation as appliedto the dispersion in natural streams[ 24 ,2 51 . The major assumptions used in this analysisare:
HYDROLOGIC ENGINEERING 2,4-37
WATTS BAR
(1) The release is assumed to occur at the right bank with no diffuser inducedmixing whether the release occurs at the bank or through the diffuser.
(2) The effluent becomes well mixed vertically (but not horizontally) relativelyrapidly (well before reaching first downstream water intake). This assumptionis usually justified in riverine situations[26'27 ].
(3) The river flow is uniform and one-dimensional over a rectangularcross-section.
Other less restrictive assumptions are described in Reference [27].
Under assumption 2, the two-dimensional form of the convective diffusion equation issufficient and may be written as
ac ac a2c a c-+u- = E -+Eat ax X ux2 .Y ay2 (1)
in which C is the concentration of radioactive effluent in the river; u is cross-sectionallyaveraged river velocity; x and y are coordinates in the downstream and lateraldirections, respectively; and Ex and Ey are the dispersion coefficients in the x and ydirections. Following Reference [25], it is assumed that the formal dependence of Exand Ey on river parameters is
EX = axU*H (2a)
and
Ey = ay U*H (2b)
2.4-38 HYDROLOGIC ENGINEERING
WATTS BAR
in which ax and ay are empirical coefficients, U* is the river shear velocity, and H is theriver depth. Relationships between U and bulk river parameters may be found in anyopen channel hydraulics text.[2 81
Equation (1) was solved for the slug release by applying the method of images[2 7 ,2 91
to the instantaneous infinite flow field solution of equation (1) which is given inReference [29]
- ~ y [X 2yyo 2]c_ V0 L 4Ext 4Eyt ] (3)Co 4tHt Ex~ exp
in which Co is the initial concentration of radioactive material in the liquid effluent, t isthe time elapsed since the release of the slug and y is the distance of the release fromthe right bank. Equation (3) was used in the method of images solutions.
2.4.12.2.1 Calculations
The above model was applied to predict the maximum concentrations which would beobserved on the right bank of the Tennessee River at two downstream locations; theright bank concentrations will always be higher than those on the left bank. Therelease is assumed to occur on the right bank at Tennessee River Mile (TRM) 528; theriver width is assumed constant at 1,100 feet and the river depth is assumed constantat 30 feet. The Watts Bar Dam discharge equaled or exceeded 50% of the time is28,200 cfs.
The coefficients ax and ay in Equation (2) were chosen to be 100 and 0.6, respectively;these values are based on the results in Reference [25]. The shear velocity, U wascomputed assuming a Manning's n of 0.030 to describe the bed roughness of the river.Because the actual release volume, V0 , is not known a priori, results are presented interms of a relative concentration, defined as C/(C0 ,V0 ). Thus, to obtain theconcentration reduction factor C/C0, this relative concentration must be multiplied bythe release volume V0 (in cubic feet).
Calculations show that the concentrations along the right bank at the downstreamwater intakes will be as follows:
RelativeTennessee Concentration
Water Intake River Mile (I/cu. ft.)
Dayton 503.8 2.8 x 10⁻⁹
East Side Utility 473.0 1.3 x 10⁻⁹(formerly Volunteer Army Ammunition Plant)
HYDROLOGIC ENGINEERING 2.4-39
WATTS BAR
2.4.12.3 Effects on Ground WaterThe plant site is underlain by terrace deposits of gravel, sand, and clay, having anaverage thickness of 40 feet. The deposit is variable in grain-size composition fromplace to place. Locally, very permeable gravel is present. Essentially all of the groundwater under the site is in this deposit.
Bedrock of the Conasauga Shale underlies the terrace deposit. Foundationexploration drilling and foundation excavation revealed that very little water occurs inthe bedrock.
The average saturated thickness of the terrace deposit is about 25 feet. Dischargefrom this material is mostly small springs and seeps to drainways along the margin ofthe site. Directions of ground water flow are discussed in Section 2.4.13.
The nearest point of probable ground water discharge is along a small tributary toYellow Creek, which at its nearest point is 2,600 feet from the center of the plant. Inthis direction, the hydraulic gradient (dh/dl) is 26 feet (maximum) in 2,600 feet, or 0.01. -
The hydraulic conductivity (K) of the terrace materials is estimated to be 48 feet/day.(The basis for this estimate is described in Section 2.4.13.3.) Porosity (0) is estimatedto be 0.15.
Average ground water velocity = (K dh/dl)/O = 3.2 ft/day or 812 days average traveltime through the terrace deposit to the nearest point of ground water discharge.
Estimating the density of the water-bearing material to be 2.0 and the distributioncoefficient for strontium to be 20, the computed average travel time for strontiumindicates a period of over 200 times longer than that for water, or 1.8 x 10⁵ days (almost500 years) travel time from the plant site to the nearest point of ground waterdischarge. This time of travel would be further increased by accounting for the delayresulting from movement through and absorption by unsaturated materials above thewater table. I
Water available for dilution, based on-the estimated porosity of 0.15 and a saturatedthickness of 25 feet, is estimated to be 3.75 cubic feet per square foot of surface area.In a 1000-foot wide strip extending from the plant site to the nearest point of groundwater discharge, the volume of stored water would be 9.8 x 10⁶ cubic feet.
There are no data on which to base a computation of dispersion in the ground watersystem. For a conservative analysis, it would be necessary to assume that nodispersion occurs.
2.4.13 Groundwater
2.4.13.1 Description and On-Site Use
Only the Knox Dolomite is regionally significant as an aquifer. This formation is theprincipal source of base flow to streams of the region. Large springs, such as WardSpring 2.7 miles west of the site, are fairly common, especially at or near the contactbetween the Knox Dolomite and the overlying Chickamauga Limestone. Water occurs
2.4-40 HYDROLOGIC ENGINEERING
WATTS BAR
in the Knox Dolomite in solution openings formed along bedding planes and joints andin the moderately thick to thick cherty clay overburden. The formation underlies a 1-to 2-mile wide belt 2.5 miles west of the site at its nearest point; a narrow slice, the tipof which is about one mile north of the site; and a 1- to 2-mile wide belt, one mile eastof the site and across Chickamauga Lake.
Within a two-mile radius of the site, there is no use of the Knox Dolomite as a sourceof water to wells for other than small supplies.
Other formations within the site region, described in detail in Section 2.5.1.1, includethe Rome Formation, a poor water-bearing formation; the Conasauga Shale, a poorwater-bearing formation; and the Chickamauga Limestone, a poor to moderatewater-bearing formation that normally yields no more than 25 gallons per minute (gpm)to wells.
The plant site is underlain by the Conasauga Shale, which is made up of about 84%shale and 16% limestone and occurs as thin discontinuous beds (Section 2.5.1.2).Surficial materials are older terrace deposits and recent alluvial deposits, fine-grained,poorly sorted, and poorly waterbearing.
The pattern of groundwater movement shown on Figure 2.4-105 indicates thatrecharge of the shallow water-bearing formations occurs from infiltration of localprecipitation and from lateral underflow from the area north of the plant site. Allground-water discharge from the site is to Chickamauga Lake, either directly or viaYellow Creek.
Potable water for plant use is obtained from the Watts Bar Utility District. Their wateris obtained from 3 wells located 2.5 miles northwest of the plant.
2.4.13.2 Sources
Ground water sources within a two-mile radius of the site are listed in Table 2.4-15 andtheir locations are shown on Figure 2.4-102. Of the 89 wells listed, only 58 areequipped with pumps. Two of the thirteen spring sources listed are equipped withpumps. Seventy-nine residences are supplied by ground water, with one wellsupplying five houses. Assuming three persons per residence and a per capita userate of 75 gpd, total ground-water use is less than 10,000 gpd.
Drawdown data are available only for the Watts Bar Reservation wells, as listed in theprevious section.
Water-level fluctuations have been observed monthly in six observation wells sinceJanuary 1973. Data collection for wells 7, 8, & 9 began in December 1981. Thelocations of these wells are shown on Figure 2.4-104. Data for the period January1973 through December 1975 is shown on Figure 2.4-103.
As elsewhere in the region, water levels normally reach maximum elevations inFebruary or March and are at minimum elevations in late summer and early fall. Depthto the water table is generally less than 20 feet throughout the plant site.
HYDROLOGIC ENGINEERING 2Z4-41
WATTS BAR
Figure 2.4-105 is a water-table contour map of the area within a two-mile radius of theplant site, based on 48 water-level measurements made in January 1972. The watertable conforms fairly Closely to surface topography, so that directions of ground-watermovement are generally the same as those of surface-water movement. Thewater-table gradient between plant site and Chickamauga Lake at maximumwater-table elevation and minimum river stage is about 44 feet in 3200 feet, or 0.014.
Water occurs in the Consauga Shale in very small openings along fractures andbedding planes. Examination of records of 5500 feet of foundation exploration drillingshowed only one cavity, 0.6-foot thick, penetrated.
Water occurs in the terrace deposit material in pore spaces between particles. Thedeposit is composed mostly of poorly-sorted clay- to gravel-sized particles and ispoorly water bearing, although an approximately six-foot-thick permeable gravel zoneis locally present at the base of the terrace deposit. The foundation excavationrequired only intermittent dewatering after initial drainage. The excavation was takenbelow the base of the terrace deposit into fresh shale. No weathered shale was foundto be present; the contact between the terrace deposit and fresh shale is sharp.
The average depth to the water table in the plant area, based on data collected duringAugust through December 1970, is 17 feet; the average overburden thickness is 40feet; the saturated overburden thickness is therefore, 24 feet. No weathered zones orcavities were penetrated in the Conasauga Shale below a depth of 85 feet, so that theaverage saturated thickness of bedrock is assumed to be less than 50 feet.
The plant site is hydraulically isolated by Yellow Creek and Chickamauga lake to thewest, south, and east; it is hydraulically isolated to the north by the relativelyimpermeable Rome Formation underlying the site. Therefore, it is believed that anyoff-site groundwater withdrawals could not result in altered groundwater movement atthe site.
No attempt was made to measure hydraulic properties of overburden or of bedrock atthis site because of the very limited occurrence of ground water and the heterogeneityand anisotropy of the materials underlying the site.
2.4.13.3 Accident Effects
Assuming a maximum annual range in saturated thickness of overburden of between23 feet and 33 feet, and a porosity of 0.15, total water stored in this material, and themaximum volume available for dilution, ranges seasonally between 4.6 and 6.6 cubicfeet per square foot of surface area. Water available for dilution in bedrock is verysmall and may be less than 0.01 cubic foot per square foot of surface area.
Since dispersion and exchange characteristics are not known, it must be assumed thatthese are not factors in a release of liquid radioactive material which would then travelto discharge points at the same rate as water movement. There are no direct pathwaysto ground-water users since all groundwater discharge from the site is to .adjacentsurface-water bodies.
2.4-42 HYDROLOGIC ENGINEERING
WATTS BAR
Groundwater travel time has been estimated for water in the terrace deposit, in whichessentially all ground water at the site occurs.
The nearest point of possible groundwater discharge is 2600 feet west of the plant site,along a tributary to Yellow Creek. In this direction the maximum hydraulic gradient is26 feet in 2600 feet, or 0.01. The maximum hydraulic conductivity of the terracematerials is estimated to be 48 ft/day, based on particle-size analyses ofterrace-deposit materials as related to permeability[3 °].
v K dh/dl0
where v = mean velocity, ft/day;K = hydraulic conductivity = 48 ft/day;
dh/dl hydraulicgradient = .01
0 = porosity = 0.15 (extimated average effective)
V = 48('01) = 3.2 ft/day(.15)
or 812 days travel time from plant to nearest point of groundwater discharge.
Packer tests on the Conasauga Shale in foundation holes, using water at 50 psi,showed no acceptance, although one 0.6 foot cavity was penetrated in one hole in atotal of more than 5,000 feet of drilling. Therefore, no estimate of time of water travelwas made for water in bedrock.
2.4.13.4 Monitoring and Safeguard Requirements
The potential for the plant to affect groundwater users is very low because of itsphysical location, however, any provisions for radiological groundwater monitoring willbe as described in the Watts Bar Monitoring Plan. A network of observation wells willbe maintained as needed and ground water will be analyzed for radioactivity asrequired by the Technical Specifications.
In the event of accidental release of radioactivity to the groundwater system, nearbygroundwater users will be advised not to use their wells for drinking water until aninvestigation can be made of the extent, rate, and direction of movement of thecontaminant.
Monitoring and notification for both the routine and any accidental nonradioactive liquiddischarges to either surface or groundwaters would be implemented as required by thefacilities NPDES permit (Permit No. TNO020168) and the Spill, Prevention, Control,and Countermeasure Plan (SPCC plan), respectively. These requirements for the.nonradiological liquid discharges are under the regulatory jurisdiction of the State ofTennessee.
2.4.13.5 Design Basis for Subsurface Hydrostatic LoadingThe ground water levels used for structural design are discussed in Section 2.5.4.6.
HYDROLOGIC ENGINEERING 2.4-43
WATTS BAR
Dewatering of the construction excavation is discussed in Section 2.5.4.6.
2.4.14 Flooding Protection Requirements
The plant grade elevation at WBN can be exceeded by large rainfall and seismically-induced dam failure floods. Assurance that WBN can be safely shut down andmaintained in these extreme flood conditions (Section 2.4.2.2 and this Section 2.4.14)is provided by the discussions given in Section 3.4, Sections 3.8.1 and 3.8.4.
2.4.14.1 IntroductionThis subsection describes the methods by which WBN is capable of tolerating floodsabove plant grade without jeopardizing public safety. Since flooding of this magnitude,as illustrated in Sections 2.4.2 and 2.4.4 is most unlikely, extreme steps are consideredacceptable, including actions that create or allow extensive economic consequence tothe plant. The actions described herein will be implemented for floods ranging fromslightly below plant grade, to allow for wave runup to the design basis flood. The plantFlood Protection Plan (Technical Requirement 3.7.2) specifies the flood warningconditions and subsequent actions.
2.4.14.1.1 Design Basis Flood
The design basis flood (DBF) is the calculated upper-limit flood that includes the PMFplus the wave runup caused by a 21 mph overland wind; this is discussed in Section2.4.3.6. The table below gives representative levels of the DBF at different plantlocations.
Design Basis Flood (DBF) Levels
Probable Maximum Flood (still reservoir) 738.8
DBF Runup on 4:1 sloped surfaces 741.2
DBF Runup on the critical vertical wall of the 741.0intake pumping structure
DBF Surge level within flooded structures 739.3
In addition to flood level considerations, plant flood preparations cope with the "fastestrising" flood which is the calculated flood, including seismically induced floods, that canexceed plant grade with the shortest warning time. Reservoir levels for-large rainfallfloods in the Tennessee Valley can be predicted well in advance. By dividing the pre-flood preparation steps into two stages, a minimum of a 27 hour, pre-flood transitioninterval is available between the time a flood warning is received and the time the floodwaters exceed plant grade. The first stage, a minimum of 10 hours long, commencesupon receipt of a flood warning. The second stage, a minimum of 17 hours long, isbased on a confirmed estimate that conditions will produce a flood above plant grade.
2.4-44 HYDROLOGIC ENGINEERING
WATTS BAR
This two-stage scheme is designed to prevent excessive economic loss in case apotential flood does not fully develop. Refer to Section 2.4.14.4.
2.4.14.1.2 Combinations of Events
Because floods above plant grade, earthquakes, tornadoes, or design basis accidents,including a LOCA, are individually very unlikely, a combination of a flood plus any ofthese events, or the occurrence of one of these during the flood recovery time, or ofthe flood during the recovery time after one of these events, is considered incredible.However, as an exception, certain reduced levels of floods are considered togetherwith seismic events. Refer to Section 2.4.14.10 and 2.4.4.
2.4.14.1.3 Post Flood Period
Because of the improbability of a flood above plant grade, no detailed procedures areestablished for return of the plant to normal operation unless and until a flood actuallyoccurs. If flood mode operation (Section 2.4.14.2) should ever become necessary, itis possible to maintain this mode of operation for a sufficient period of time (100 days)so that appropriate recovery steps can be formulated and taken. The actual floodwaters are expected to recede below plant grade within 1 to 4 days.
2.4.14.1.4 Localized Floods
Localized plant site flooding due to the probable maximum storm (Section 2.4.2.3) willnot enter vital structures or endanger the plant. Any offsite power loss resulting fromwater ponding on the switchyard or water entry into the Turbine Building will be similarto a loss of offsite power situation as described in Chapter 15. The other stepsdescribed in this subsection are not applicable to this case. Refer to Section 2.4.2.3.
2.4.14.2 Plant Operation During Floods Above Grade
"Flood mode" operation is defined as the set of conditions described below by meansof which the plant is safely maintained during the time when flood waters exceed plantgrade (Elevation 728.0) and during the subsequent period until recovery (Section2.4.14.7) is accomplished.
2.4.14.2.1 Flooding of Structures
The Reactor Building will be maintained dry during the flood mode. Walls andpenetrations are designed to withstand all static and dynamic forces imposed by theDBF; minor seepage through the concrete walls and through the leading penetrationsinto the annulus will be allowed to flow to the Reactor Building floor and equipmentdrain sump by removing the blind flange on penetration X-1 18. The Reactor Buildingfloor and equipment drain sumps are more than capable of pumping this flow.
The Diesel Generator Buildings also will remain dry during the flood mode since itslowest floor is at elevation 742.0. Other structures, including the Service, Turbine,Auxiliary, and Control Buildings, would be allowed to flood as the water exceeds theirgrade level entrances. Equipment that is located in these structures and required for
HYDROLOGIC ENGINEERING Z445
WATTS BAR
operation in the flood mode is either above the DBF or suitable for submergedoperation.
2.4.14.2.2 Fuel Cooling
Spent Fuel Pool
Fuel in the spent fuel pool is cooled by the Spent Fuel Pool Cooling and CleanupSystem (SFPCCS), the active components of which are located above flood waters.During the flood mode of operation, heat is removed from the heat exchangers byessential raw cooling water instead of component cooling water. The SFPCCS coolingcircuit is assured of two operable SFPCCS pumps (a third pump is available as abackup) as well as two SFPCCS heat exchangers. High spent fuel pool temperaturecauses an annunciation in the Main Control Room indicating equipment malfunction.Additionally, that portion of the cooling system above flood water is inspectedapproximately every 8 hours to confirm continued proper operation. As a backup tospent fuel cooling, water from the High Pressure Fire Protection (HPFP) System canbe added to the spent fuel pool.
Reactors
Residual core heat is be removed from the fuel in the reactors by natural circulation inthe reactor coolant system. Heat removal from the steam generators is accomplishedby adding river water from the HPFP System and relieving steam to the atmospherethrough the power operated relief valves. This transition from auxiliary feedwater toriver water is accomplished during Stage II of the flood preparation procedures. Referto Section 2.4.14.4.1. Reactor coolant system pressure is maintained at less than 350psig by operation of the pressurizer relief valves and heaters. Secondary sidepressure is maintained below 125 psig by operation of the power operated reliefvalves. At times beyond approximately 10 hours following shutdown of the plant tworelief valves have sufficient capacity to remove the steam generated by decay heat.Since 10 hours is less than the minimum flood warning time available, the plant can besafely shut down and decay heat removed by operation of two power operated reliefvalves per unit.
The earliest that the HPFP pumps would be utilized to supply auxiliary feedwater wouldbe about 20 hours after reactor shutdown. At this time, in order to remove the decayheat from both reactor units, the water requirement to the steam generators would beapproximately 300 gpm. Later times following reactor shutdown would have graduallydecreasing HPFP system makeup water flow rate requirements. With the steamgenerator secondary side pressure less than 125 psig, a single HPFP pump can supplymakeup water well in excess of the requirement of 300 gpm. Additional surplus flow isavailable since there are four HPFP pumps, two powered from each emergency powertrain.
The main steam power operated relief valves are adjusted by controls in the auxiliarycontrol room as required to maintain the steam pressure within the desired pressurerange. The controls in the main control room also can be utilized to operate the valves
2.4-46 HYDROLOGIC ENGINEERING
WATTS BAR
in an open-closed manner. Also, a manual loading station and the relief valvehandwheel provide additional backup control for each relief valve.
The power operated relief valves would be used to depressurize the steam generatorsas discussed above to maintain steam generator pressure sufficiently below thedeveloped head of the fire pumps. Note that even in the event of a total loss of makeupwater flow at the time of maximum decay heat load, approximately 6 hours areavailable to restore makeup water flow before the steam generators would boil dry.
If one or both reactors are open to the containment atmosphere during the refuelingoperations, then the decay heat of the fuel in the open unit(s) and spent fuel pool heatis removed in the following manner. The refueling cavity is filled with borated water(nominal ppm boron concentration) from the refueling water storage tank. TheSFPCCS pump takes suction from the spent fuel pool and discharges to the SFPCCSheat exchangers. The SFPCCS heat exchanger output flow is directed by a temporarypiping connection to the Residual Heat Removal (RHR) System upstream to the RHRheat exchangers. This piping (spool piece) connection is prefabricated and is installedonly during preparation for flood mode operation. (The tie-in locations in the SFPCCSand RHRS are shown in Figures 2.4-106 and 2.4-107 respectively.) After passingthrough the RHR heat exchangers, the water enters the reactor vessel through thenormal cold leg RHR injection paths, flows downward through the annulus, upwardthrough the core (thus cooling the fuel), then exits the vessel directly into the refuelingcavity. This results in a water level differential between the spent fuel pool and therefueling cavity with sufficient water head to assure the required return flowthrough thetwenty-inch diameter fuel transfer tube thereby completing the path to the spent fuelpool.
Any leakage from the reactor coolant system will be collected to the extent possible inthe reactor coolant drain tank; nonrecoverable leakage is made up from supplies ofclean water stored in the four cold leg accumulators, the pressurizer relief tank, and thedemineralized water tank. Even if these sources are unavailable, the fire protectionsystem can be connected to the auxiliary charging system (Section 9.3.6) as a backup.Whatever the source, makeup water is filtered, demineralized, tested, and borated, asnecessary, to the normal refueling concentration, and pumped by the auxiliarycharging system into the reactor (see Figures 2.4-108 and 2.4-109).
2.4.14.2.3 Cooling of Plant Loads
Plant coolingrequirements with the exception of the fire protection system which mustsupply makeup water to the steam generators, are met by the ERCW System. Theintake pumping station is designed to retain full functional capability of the ERCWsystem and HPFP system water intakes for all floods up to and including the DBF. TheERCW System and HPFP System water intakes also remain fully functional in theremote possibility of a flood induced failure of Chickamauga Dam. (Refer to Sections9.2.1 and 9.5.1.)
2.4.14.3 Warning Scheme
See Section 2.4.14.8 (Warning Plan).
HYDROLOGIC ENGINEERING 2.4-47
WATTS BAR
2.4.14.4 Preparation for Flood ModeAn abnormal operating instruction is available to support operation of the plant.
At the time the initial flood warning is issued, the plant could be operating in any normalmode. This means that either or both units may be at power or in any stage ofrefueling.
2.4.14.4.1 Reactor Initially Operating at Power
If the reactor is operating at power, Stage I and then, if necessary, Stage II proceduresare initiated. Stage I procedures consist of a controlled reactor shutdown and othereasily revocable steps, such as moving flood mode supplies above the probablemaximum flood elevation and making load adjustments on the onsite power supply. IAfter scram, the reactor coolant system is cooled by the auxiliary feedwater (Section10.4.9) and the pressure is reduced to less than 350 psig. Stage II procedures are theless easily revocable and more damaging steps are necessary to have the plant in theflood mode when the flood exceeds plant grade. HPFP System water (Section 9.5.1)will replace auxiliary feedwater for steam generator makeup water. Other essentialplant cooling loads are transferred from the Component Cooling Water System to theERCW System and the ERCW replaces raw cooling water to the ice condensers(Section 9.2.1). The radioactive waste (Chapter 11) system will be secured by fillingtanks below DBF level with enough water to prevent flotation. One exception is thewaste gas decay tanks, which are sealed and anchored against flotation. Power andcommunication cables below the DBF level that are not required for submergedoperation are disconnected, and batteries beneath the DBF level are disconnected.
2.4.14.4.2 Reactor Initially Refueling
If time permits, fuel is removed from the unit undergoing refueling and placed in thespent fuel pool; otherwise fuel cooling is accomplished as described in Section2.4.14.2.2. If the refueling canal is not already flooded, the mode of cooling describedin Section 2.4.14.2.2 requires that the canal be flooded with borated water from therefueling water storage tank. If the flood warning occurs after the reactor vessel headhas been removed or at a time when it could be removed before the flood exceedsplant grade, the flood mode reactor cooling water flows directly from the vessel into therefueling cavity.
Flood mode operation requires that the prefabricated piping be installed to connect theRHR and SFPC Systems, that the proper flow to the spent fuel pit diffuser and theRHRS be established and that essential raw cooling water be directed to thesecondary side of the RHRS and SFPCCS heat exchangers. The connection of theRHR and SFPC Systems is made using prefabricated in-position piping which isnormally disconnected. During flood mode preparations, the piping is connected usingprefabricated spool pieces.
2.4-48 HYDROLOGIC ENGINEERING
WATTS BAR
2.4.14.4.3 Plant Preparation Time
The steps needed to prepare the plant for flood mode operation can be accomplishedwithin 24 hours of notification that a flood above plant grade is expected. An additional3 hours are available for contingency margin.
2.4.14.5 Equipment
Both normal plant components and specialized flood-oriented supplements are utilizedin coping with floods. Equipment required in the flood mode is either located above theDBF, within a nonflooded structure, or is suitable for submerged operation. Systemsand components needed only in the preflood period are protected only during thatperiod.
2.4.14.5.1 Equipment Qualification
To ensure capable performance in this highly unlikely, limiting design case, only highquality components are utilized. Active components are redundant or their functionsdiversely supplied. Since no rapidly changing events are associated with the flood,repairability is an available option for both active and passive components during thelong period of flood mode operation. Equipment potentially requiring maintenance isaccessible throughout its use, including components in the Diesel Generator Building.
2.4.14.5.2 Temporary Modification and Setup
Normal plant systems used in flood mode operation and in preparation for flood modeoperation may require modification from their normal plant operating configuration.Such modification, since it is for a limiting design condition and since extensiveeconomic consequences are acceptable, is permitted to allow operation of systemsoutside of their normal plant configuration. However, most alterations will be onlytemporary and inconsequential in nature. For example, the switchover of plant coolingloads from the component cooling water to ERCW is done through valves andprefabricated spool pieces, causing little system disturbance or damage.
2.4.14.5.3 Electric Power
Because there is a possibility that high winds could destroy power lines and disconnectthe plant from offsite power at any time during the preflood transition period, thepreparation procedure and flood mode operation are accomplished assuming onlyonsite power circuits available. While most equipment requiring ac electric power is apart of the permanent emergency onsite power distribution system other components, -
if required, could be temporarily connected, when the time comes, by prefabricatedjumper cables.
The loads that are normally supplied by onsite power but are not required for the floodare disconnected early in the preflood period. Those loads used only during thepreflood period are disconnected from the onsite power system during flood modeoperations. DC electric power is similarly disconnected from unused loads andpotentially flooded cables.
HYDROLOGIC ENGINEERING 2.4-49
WATTS BAR
Charging is maintained for each battery by the onsite ac power system as long as it isrequired. Batteries that are beneath the DBF level are disconnected during thepreflood period when they are no longer needed.
2.4.14.5.4 Instrument, Control, Communication and Ventilation Systems
The instrument, control, and communication wiring or cables required for operation inthe flood mode are either above the DBF or within a nonflooded structure, or aresuitable for submerged operation. Unneeded wiring or cables that run below the DBFlevel will be disconnected to prevent short circuits.
Instrumentation is provided to monitor vital plant parameters such as the reactorcoolant temperature and pressure and steam generator pressure and level. Importantplant functions are either monitored and controlled from the main control area, or, insome cases where time margins permit, from other points in the plant that are in closecommunication with the main control area.
Communications are provided between the central control area (the Main and AuxiliaryControl Rooms) and other vital areas that might require operator attention, such as theDiesel Generator Building.
Ventilation, when necessary, and limited heating or air conditioning is maintained forlocations throughout the plant where operators might be required to go or whererequired by equipment heat loads.
2.4.14.6 Supplies
The equipment and most supplies required for the flood are on hand in the plant at alltimes. Some supplies may require replenishment before the end of the period in whichthe plant is in the flood mode. In such cases supplies on hand are sufficient to lastthrough the short time (Section 2.4.14.1.3) that flood waters will be above plant gradeand until replenishment can be supplied.
2.4.14.7 Plant Recovery
The plant is designed to continue safely in the flood mode for 100 days even thoughthe water is not expected to remain above plant grade for more than 1 to 4 days. Afterrecession of the flood, damage will be assessed and detailed recovery plansdeveloped. Arrangements will then be made for reestablishment of off-site power andremoval of spent fuel. A decision based on economics would be made on whether ornot to regain the plant for power production. In either case, detailed plans would beformulated after the flood, when damage can be accurately assessed. The 100-dayperiod provides a more than adequate time for the development of procedures for anymaintenance, inspection, or installation of replacements for the recovery of the plant orfor a continuation of flood mode operations in excess of 100 days.
2.4.14.8 Warning Plan
Plant grade elevation 728.0 can be exceeded by rainfall floods and seismic-causeddam failure floods. A warning plan is needed to assure plant safety from these floods.
2.4-50 HYDROLOGIC ENGINEERING
WATTS BAR
The warning plan is divided into two stages: Stage I, a minimum of 10 hours long andStage II, a minimum of 17 hours so that unnecessary economic consequences can beavoided, while adequate time is allowed for preparing for Operation in the flood mode.Stage I allows preparation steps causing minimal economic consequences to besustained but will postpone major economic damage until the Stage II warningforecasts a likely forthcoming flood above elevation 727.
2.4.14.8.1 Rainfall Floods
Protection of the Watts Bar Plant from rainfall floods that might exceed plant gradeutilizes a flood warning issued by TVA's River Operations (RO). TVA's climaticmonitoring and flood forecasting systems and flood control facilities permit early Iidentification of potentially critical flood producing conditions and reliable prediction offloods which may exceed plant grade well in advance of the event.
The WBN flood warning plan provides a minimum of 27 hours to prepare for operationin the flood mode, 3 hours more than the 24 hours needed. Four additional precedinghours would be available to gather and analyze rainfall data and produce the warning.The first stage, Stage I, of shutdown begins when there is sufficient rainfall on theground in the upstream watershed to yield a forecasted plant site water level ofelevation 715.5 in the winter months and elevation 720.6 in the summer. This assuresthat additional rain will not produce water levels to elevation 727.0 in less than 27 hoursfrom the time shutdown is initiated. The water level of elevation 727.0 (one foot belowplant grade) allows margin so that waves due to winds cannot disrupt the flood modepreparation.
The plant preparation status is held at Stage I until either Stage 11 begins or TVA's ROdetermines that floodwaters will not exceed Elevation 727.0 at the plant. The Stage II
warning is issued only when enough additional rain has fallen to forecast that elevation727.0 (winter or summer) is likely to be reached.
2.4.14.8.2 Seismically-Induced Dam Failure FloodsThree postulated combinations of seismically induced dam failures and coincidentstorm conditions were shown to result in floods which could exceed Elevation 727.0 at
the plant. WBN's notification of these floods utilizes TVA's RO forecast to identify whena critical combination exists. Stage I shutdown is initiated upon notification that acritical dam failure combination has occurred or loss of communication preventsdetermining a critical case has not occurred. Stage I shutdown continues until it hasbeen determined positively that critical combinations do not exist. If communicationsdo not document this certainty, shutdown procedures continue into Stage II activity.Stage II shutdown continues to completion or until lack of critical combinations isverified.
2.4.14.9 Basis For Flood Protection Plan In Rainfall Floods
2.4.14.9.1 Overview
Large Tennessee River floods can exceed plant grade elevation 728.0 at WBN. Plantsafety in such an event requires shutdown procedures which may take 24 hours to
HYDROLOGIC ENGINEERING 2.4-51
WATTS BAR
implement. TVA flood forecast procedures are used to provide at least 27 hours ofwarning before river levels reach elevation 727.0. Use of elevation 727.0, 1 foot belowplant grade, provides enough margin to prevent wind generated waves fromendangering plant safety during the final hours of shutdown activity. Forecast will bebased upon rainfall already reported to be on the ground.
To be certain of 27 hours for preflood preparation, flood warnings with the prospect ofreaching elevation 727.0 must be issued early when lower target elevations areforecast. Consequently, some of the warnings may later prove to have beenunnecessary. Forthis reason preflood preparations are divided into two stages. StageI steps requiring 10 hours are easily revocable and cause minimum economicconsequences. The estimated probability is small that a Stage I warning will be issued Iduring the life of the plant.
Added rain and stream-flow information obtained during Stage I activity will determineif the more serious steps of Stage II need to be taken with the assurance that at least17 hours will be available before elevation 727.0 is reached. The probability of a StageII warning during the life of the plant is very small.
Flood forecasting and warnings, to assure adequate warning time for safe plantshutdown during floods, will be conducted by TVA's RO.
2.4.14.9.2 TVA Forecast System
TVA has in constant use an extensive, effective system to forecast flow and elevationas needed in the Tennessee River basin. This permits efficient operation of thereservoir system and provides warning of when water levels will exceed criticalelevations at selected, sensitive locations which includes WBN.
TVA's RO normal operation produces daily forecasts by 12 noon made from datacollected at 6 a.m. Central time. During major flood events RO may issue forecasts asfrequent as 4 to 6 hours at specific site locations.
Elements of the present (2010) forecast system above WBN include the following:
(1) More than 90 rain gages measure rainfall, with an average density of about190 square miles per rain gage. All are Geostationary OperationalEnvironmental Satellites (GOES) Data Collection Platform (DCP) satellitetelemetered gages, and 27 are Data Logger telemetered gages.
Some of the satellite gages transmit hourly rainfall data every 3 hours whileothers transmit hourly during normal operations.
(2) Streamflow data are received from 23 gages in the system. All are GOESData Collection Platform satellite telemetered gages. The satellite gagestransmit 15-minute stage data every 3 hours during normal operations.
2.4-52 HYDROLOGIC ENGINEERING
WATTS BAR
(3) Real-time headwater elevation, tailwater elevation, and discharge data arereceived from 21 (Watts Bar, Melton Hill, Fort Loudoun, Tellico, Norris,Douglas, Cherokee, Fort Patrick Henry, Boone, Watauga, Wilbur, SouthHolston, Chickamauga, Ocoee No. 1, Ocoee No. 2, Ocoee No. 3, Blue Ridge,Apalachia, Hiwassee, Chatuge and Nottely) TVA hydro projects and hourlydata are received from non-TVA hydro plants (Chilhowee, Cheoah,Calderwood and Santeelah).
(4) Weather forecasts including quantitative precipitation forecasts received atleast twice daily and at other times when changes are expected.
(5) Computer programs which translate rainfall into streamflow based on currentrunoff conditions and which permit a forecast of flows and elevations basedupon both observed and predicted rainfall. A network of UNIX servers andpersonal computers are utilized and are designed to provide backup for eachother. One computer is used primarily for data collection, with the othersused for executing forecasting programs for reservoir operations. The timeinterval between receiving input data and producing a forecast is less than 4hours. Forecasts normally cover at least a 3-day period.
As effective as the forecast system already is, it is constantly being improved as newtechnology provides better methods to interrogate the watershed during floods and asthe watershed mathematical model and computer system are improved. Also, in thefuture, improved quantitative precipitation forecasts may provide a more reliable earlyalert of impending major storm conditions and thus provide greater flood warning time.
2.4.14.9.3 Basic Analysis
The forecast procedure to assure safe shutdown of WBN for flooding is based upon ananalysis of 9 hypothetical storms up to PMP magnitude. The storms envelopedpotentially critical areal and seasonal variations and time distributions of rainfall. To becertain that fastest rising flood conditions were included, the effects of varied timedistribution of rainfall were tested by alternatively placing the maximum daily PMP inthe middle, and the last day of the 3-day main storm. Earlier analysis of 17 hypotheticalstorms demonstrated that the shortest warning times resulted from storms in which theheavy rainfall occurred on the last day and that warning times were significantly longerwhen heavy rainfall occurred on the first day. Therefore, heavy rainfall on the first daywas not reevaluated. The warning system is based on those storm situations whichresulted in the shortest time interval between watershed rainfall and elevation 727 atWBN, thus assuring that this elevation could be predicted at least 27 hours in advance.
The procedures used to compute flood flows and elevations for those flood conditionswhich establish controlling elements of the forecast system are described in Section2.4.3.
HYDROLOGIC ENGINEERING 2.4-53
WATTS BAR
2.4.14.9.4 Hydrologic Basis for Warning System
A minimum of 27 hours has been allowed for preparation of the plant for operation inthe flood mode, 3 hours more than the 24 hours needed. An additional 4 hours forcommunication and forecasting computations is provided to allow TVA's RO totranslate rain on the ground to river elevations at the plant. Hence, the warning planprovides 31 hours from arrival of rain on the ground until elevation 727 could bereached. The 27 hours allowed for shutdown at the plant consists of a minimum of 10hours of Stage I preparation and an additional 17 hours for Stage II preparation that isnot concurrent with the Stage I activity.
Although river elevation 727, 1 foot below plant grade to allow for wind waves, is thecontrolling elevation for determining the need for plant shutdown, lower forecast targetlevels are used in some situations to assure that the 27 hours pre-flood transitioninterval will always be available. The target river levels differ with season.
During the "winter" season, Stage I shutdown procedures Will be started as soon astarget river elevation 715.5 has been forecast. Stage II shutdown will be initiated andcarried to completion if and when target river elevation 727 at WBN has been forecast.Corresponding target river elevations for the "summer" season at WBN are elevation720.6 and elevation 727.
Inasmuch as the hydrologic procedures and target river elevations have beendesigned to provide adequate shutdown time in the fastest rising flood, longer timeswill be available in other floods. In such cases there may be a waiting period after theStage 1, 10-hour shutdown activity during which activities shall be in abeyance untilweather conditions determine if plant operation can be resumed, or if Stage IIshutdown should be implemented.
Resumption of plant operation following just Stage I shutdown activities will beallowable only after flood levels and weather conditions, as determined by TVA's RO,have returned to a condition in which 27 hours of warning will again be available.
2.4.14.9.5 Hydrologic Basis for Warning Times and Elevations
Figure 2.4-110 (Sheet 1) and Figure 2.4-110 (Sheet 2) for winter and summerrespectively, show target forecast flood warning time and elevation at WBN whichassure adequate warning times. The fastest rising probable maximum flood for thewinter at the site is shown in Figure 2.4-110 (Sheet 1A). Figure 2.4-110 (Sheet 1 B) and(Sheet 1 C) show the adopted rainfall distribution for the 21,400 square mile storm andthe 7,980 square mile storm, respectively. An intermediate flood with average basinrainfall of 10 inches (rainfall heavy at the end) is shown in Figure 2.4-110 (Sheet 1D).Figure 2.4-110 (Sheet 2A) shows the 7,980 square mile fastest rising probablemaximum flood for the summer with heavy rainfall at the end. The 7,980 square mileadopted rainfall distribution is shown in Figure 2.4-110 (Sheet 2B). An intermediateflood with average basin rainfall of 10 inches heavy at the end is shown in Figure 2.4-110 (Sheet 2C). All of these storms have been preceded 3 days earlier by a 3-daystorm having 40% of PMP storm rainfall.
2.4-54 HYDROLOGIC ENGINEERING
WATTS BAR
The fastest rising flood occurs during a PMP when the 6-hour increments increasethroughout the storm with the maximum 6 hours occurring in the last period. Figure 2.4-110 (Sheet 1 A) shows the essential elements of this storm which provides the basis forthe warning plan. In this flood 8.6 inches of rain would have fallen 31 hours (27 + 4)prior to the flood crossing elevation 727 and would produce elevation 715.5 at theplant. Hence, any time rain on the ground results in a forecast plant elevation of 715.5a Stage I shutdown warning will be issued. Examination of Figure 2.4-110 (Sheet 1 B,and 1 C) show that following this procedure in these floods would result in longer timesto reach elevation 727 after Stage I warning was issued. These times would be 41 and46.5 hours (includes 4 hours for forecasting and communication) for Figure 2.4-110(Sheet 1 B) and (Sheet 1C), respectively. This compares to the 31 hours for the fastestrising flood Figure 2.4-110 (Sheet 1 A). Stage I warning would be issued for the stormshown in Figure 2.4-110 (Sheet 1 D) but would not reach a Stage II warning as themaximum elevation reached is 721.92 which is well below elevation 727.0.
An additional 2.6 inches of rain must fall promptly for a total of 11.2 inches of rain tocause the flood to exceed elevation 727. In the fastest rising flood, figure 2.4-110(Sheet IA), this rain would have fallen in the next 6.0 hours. A Stage II warning wouldbe issued within the next 4 hours. Thus, the Stage II warning would be issued 6.0 hoursafter issuance of a Stage I warning and 21.0 hours before the flood would exceedelevation 727.0. In the slower rising floods, Figure 2.4-110 (Sheet 1 B and 1C), the timebetween issuance of a Stage I warning and when the 11.2 inches of rain required toput the flood to elevation 727.0 would have occurred, is 7.0 and 5.0 hours respectively.This would result in issuance of a Stage II warning not more than 4 hours later or 30.0and 37.5 hours, respectively, before the flood would reach elevation 727.0.
The summer flood, shown by Figure 2.4-110 (Sheet 2A), with the maximum 1-day rainon the last day provides controlling conditions when reservoirs are at summer levels.At a time 31 hours (27 + 4) before the flood reaches elevation 727.0, 9.3 inches of rainwould have fallen. This 9.3 inches of rain under these runoff conditions would produceelevation 720.6, so this level becomes the Stage I target. An additional 2.0 inches ofrain must fall promptly for a total of 11.3 inches of rain to cause the flood to exceedelevation 727.0. In this fastest rising summer flood, Figure 2.4-110 (Sheet 2A), this rainwould have fallen in the next 4.5 hours. A Stage II warning would be issued within thenext 4 hours. Thus, the Stage II warning would be issued 4.5 hours after issuance of aStage I warning and 22.5 hours before the flood would exceed elevation 727.0.
The above criteria all relate to forecasts which use rain on the ground. In actualpractice quantitative rain forecasts, which are already a part of daily operations, would -
be used to provide advance alerts that the need for shutdown may be imminent. Onlyrain on the ground, however, is included in the procedure for firm warning use.
Because the above analyses used fastest possible rising floods at the plant, all otherfloods will allow longer warning times than required for physical plant shutdownactivities.
In summary, the forecast elevations which will assure adequate shutdown times are:
HYDROLOGIC ENGINEERING 2.4-55
WATTS BAR
Forecast Elevations at Watts Bar
Season Stage I shutdown Stage II shutdown
Winter 715.5 727
Summer 720.6 727
2.4.14.9.6 Communications Reliability
Communication between projects in the TVA power system is via (a) TVA-ownedmicrowave network, (b) Fiber-Optics System, and (c) by commercial telephone. Inemergencies, additional communication links are provided by Transmission PowerSupply radio networks. The four networks provide a high level of dependability againstemergencies. Additionally, RO have available satellite telephone communications withthe TVA hydro projects upstream of Chattanooga (listed in Section 2.4.14.9.2).
RO is linked to the TVA power system by all five communication networks. The datafrom the satellite gages are received via a data collection platform-satellite computersystem located in the RO office.
2.4.14.10 Basis for Flood Protection Plan in Seismic-Caused Dam FailuresPlant grade would be exceeded by three of the five candidate seismic failurecombinations evaluated, thus requiring emergency measures. The seismic dam failurecombination, the SSE failure of Norris, Cherokee, Douglas and Tellico concurrent withthe 25-year flood would result in a maximum flood elevation of 731.11 at WBN. TheOBE failure of Norris and Tellico and the OBE failure of Cherokee, Douglas, and Tellicoconcurrent with the one-half PMF would result in flood elevations above WBN plantgrade. Table 2.4-14, shows the maximum elevations at WBN for the candidatecombinations.
The times from seismic failure to the time elevation 727 is reached at WBN in the threecritical events is about 36, 28, and 43 hours as shown in Figures 2.4-114, 2.4-115, and2.4-116 for the Norris, Cherokee, Douglas and Tellico SSE failure combination, theNorris and Tellico OBE failure combination and the Cherokee, Douglas, and TellicoOBE failure combinations, respectively. These times are adequate to permit safe plantshutdown in readiness for flooding.
Dam failure during non-flood periods was not evaluated, but would be bounded by thethree critical failure combinations.
The warning scheme for safe plant shutdown is based on the fact that a combinationof critically centered large earthquake conditions must coincide before the flood wavefrom seismically caused dam failures will approach plant grade. In flood situations, anextreme earthquake must be precisely located to fail Norris, Cherokee, Douglas, andTellico Dams before a flood threat to the site would exist. This would also be the casewith the failure of Norris and Tellico. Cherokee and Douglas Dams failures could occurwhen the OBE is located midway between the dams which are just 15 miles apart.
2.4-56 HYDROLOGIC ENGINEERING
WATTS BAR
The warning system utilizes TVA's RO flood forecast system to identify when floodconditions will be such that seismic failure of critical dams could cause a flood wave toapproach elevation 728 at the plant site. In addition to the critical combinations, failureof a single major upstream dam will lead to an early warning. A Stage I warning isdeclared once failure of (1) Norris, Cherokee, Douglas, and Tellico dams or (2) Norrisand Tellico dams or (3) Cherokee, Douglas and Tellico Dams has been confirmed.
If loss of or damage to an upstream dam is suspected based on monitoring by TVA'sRO, efforts will be made by TVA to determine whether dam failure has occurred. If thecritical case has occurred or it cannot be determined that it has not occurred, Stage Ishutdown will be initiated. Once initiated, the flood preparation procedures will becarried to completion unless it is determined that the critical case has not occurred.
Communications between WBN, dams, power system control center, and TVA RO areaccomplished by TVA-owned microwave networks, fiber options networks, radionetworks, and commercial and satellite telephone service. These systems aredescribed in FSAR Section 9.5.2.3.
2.4.14.11 Special Condition Allowance
The flood protection plan is based upon the minimum time available for the worst case.This worst case provides adequate preparation time including contingency margin fornormal and anticipated plant conditions including anticipated maintenance operations.It is conceivable, however, that a plant condition might develop for which maintenanceoperations would make a longer warning time desirable. In such a situation the PlantManager determines the desirable warning time. He contacts TVA's RO to determineif the desired warning time is available. If weather and reservoir conditions are suchthat the desired time can be provided, special warning procedures will be developed,if necessary, to ensure the time is available. This special case continues until the PlantManager notifies TVA's RO that maintenance has been completed. If threateningstorm conditions are forecast which might shorten the available time for specialmaintenance, the Plant Manager is notified by RO and steps taken to assure that theplant is placed in a safe shutdown mode.
REFERENCES
(1) National Weather Service, "Probable Maximum and TVA Precipitation forTennessee River Basins up to 3,000 Square Miles in Area and Durations to72 Hours," Hydrometeorological Report No. 45, 1969, with Addendum ofJune 1973.
(2) U.S. Army Corps of Engineers, "Standard Project Flood Determination,:Civil Works Engineer Bulletin 52-8, March 1952.
(3) SCS National Engineering Handbook, Section 4, Hydrology, July 1969.
(4) U.S. Weather Bureau, "Probable Maximum and TVA Precipitation OverThe Tennessee River Basin Above Chattanooga," HydrometeorologicalReport No. 41, 1965.
HYDROLOGIC ENGINEERING 2.4-57
WATTS BAR
(5) Newton, Donald W., and Vineyard, J. W., "Computer-Determined UnitHydrographs From Floods," Journal of the Hydraulics Division, ASCE,Volume 93, No. HY5, September 1967.
(6) Garrison, J. M., Granju, J. P., and Price, J. T., "Unsteady Flow Simulationin Rivers and Reservoirs," Journal of the Hydraulics Division, ASCE,Volume 95, No. HY5, Proceedings Paper 6771, September 1969, pages1559-1576.
(7) Eagleson, Peter S., "A Distributed Linear Model for Peak CatchmentDischarge," Proceedings, The International Hydrology Symposium,September 1967, Fort Collins, Colorado, Volume 1.
(8) Kulandaiswamy, V. C., "A Nonlinear Approach to Runoff Studies,"Proceedings, The International Hydrology Symposium, September 1967,Fort Collins, Colorado, Volume 1.
(9) Ardis, C. V., Jr., "A Nonlinear Channel Routing Model, "Proceedings,Theme 1, May 1971 Flow Symposium, Instrument Society of America,Pittsburgh, 1974.
(10) Reference deleted by Amendment 63.
(11) Cristofano, E. A., "Method of Computing Erosion Rate for Failure of EarthfillDams," Engineering and Research Center, Bureau of Reclamation,Denver, 1966.
(12) "The Breaching of the Oros Earth Dam in the State of Ceara, North-EastBrazil," Water and Water Engineering, August 1960.
(13) National Climatic Center, Asheville, North Carolina, "Extreme Wind Studyfor Selected Stations in the Tennessee Valley," prepared under ContractNo. TV-36522A, August 1975.
(14) U.S. Army Corps of Engineers, "Computation of Freeboard Allowances forWaves in Reservoirs," Engineering Technical Letter No. 1110-2-8, August1966.
(15) U.S. Army coastal Engineering Research Center, "Shore ProtectionPlanning and Design," Third Edition, 1966.
(16) Anderson, Paul, "Substructure Analysis and Design," 1948.
(17) Hinds, Julian, Cregar, William P., and Justin, Joel D., "Engineering ForDams," Volume 11, Concrete Dam's, John Wiley and Sons, Incorporated,1945.
2.4-58 HYDROLOGIC ENGINEERING
WATTS BAR
(18) Bustamante, Jurge'l., Flores, Arando, "Water Pressure in Dams Subject toEarthquakes," Journal of the Engineering Mechanics Division, ASCEProceedings, October 1966.
(19) Chopra, Anil K., "Hydrodynamic Pressures on Dams During Earthquakes,"Journal of the Engineering Mechanics Division ASCE Proceedings,December 1967, pages 205-223.
(20) Zienkiewicz, 0. C., "Hydrodynamic Pressures Due to Earthquakes," WaterPressures Due to Earthquakes," Water Power, Volume 16, September1964, pages 382-388.
(21) Tennessee Valley Authority, "Sedimentation in TVA Reservoirs," TVAReport No. 0-6693, Division of Water Control Planning, February 1968.
(22) Reference deleted by Amendment 63.
(23) Price, J. T. and Garrison, J. M., Flood Waves From Hydrologic and SeismicDam Failures," paper presented at the 1973 ASCE National WaterResources Engineering Meeting, Washington, D. C.
(24) Fisher, H. B., "Longitudinal Dispersion in Laboratory and Natural Systems"Keck Laboratory Report KH-R-12, California Institute of Technology,Pasadena, California, June 1966.
(25) Fisher, H. B., "The Mechanics of Dispersion in Natural Streams," Journal ofthe Hydraulics Division, ASCE Vol. 93, No HY6, November 1967.
(26) Yotsukura, N., "A Two-Dimensional Temperature Model for the ThermallyLoaded River with Steady Discharge" Proceedings of the Eleventh AnnualEnvironmental and Water Resources Engineering Conference, VanderbiltUniversity, Nashville, Tennessee, 1972.
(27) Almquist, C. W., "A Simple Model for the Calculation of Transverse Mixingin Rivers with Application to the Watts Bar Nuclear Plant," TVA, Division ofWater Management, Water Systems Development Branch, TechnicalReport No. 9-2012, March 1977.
(28) Henderson, E. M., Open Channel Flow, MacMillen, 1966.
(29) Carlslaw, B. S. and J. C. Jaeger, Conduction of Heat in Solids, OxfordUniversity Press, London England, 1959.
(30) Johnson, A. E., 1963, Application of Laboratory Permeability.
(31) Stoker, J. J., "Water Waves," Interscience Publishers, Inc., New York,1966, Up. 333-341.
HYDROLOGIC ENGINEERING 2.4-59
WATTS BAR
(32) Bretschneider, C. L., "Wave Refraction, Diffraction and Reflection ChapterF of Estuary and Coastline Hydrodynamics. MIT Hydrodynamic Lab,Cambridge, Massachusetts.
(33) Keulegan, G. H., "Wave Damping Effects of Fibrous Screens," ResearchReport H-72-2. Corps of Engineers, Vicksburg, Mississippi, 1972.
(34) U.S. Army Corps of Engineers, Hydrologic Engineering Center, RiverAnalysis System, HEC-RAS computer software, version 3.1.3.
(35) National Weather Service, "Probable Maximum and TVA PrecipitationEstimates with Areal Distribution for Tennessee River Drainages LessThan 3,000 Square Miles in Area," Hydrometeorological Report No. 56,October 1986.
(36) U.S. Geological Survey, National Water.Information System: WebInterface, USGS Surface-Water Data for the Nation, Website,http://waterdata.usgs.gov/usa/nwis/ws, accessed April 2006.
(37) American Nation Standards Institute, "American National Standard forDetermining Design Basis Flooding at Power Reactor Sites, "ANS 2.8/ANSIN170-1976, American Nuclear Society, Hinsdale, Illinois, November 1,1976.
(38) Federal Emergency Management Agency (FEMA), "Federal Guidelines forDam Safety: Earthquake Analysis and Design of Dams," FEMA 65, May2005.
2.4-60 HYDROLOGIC ENGINEERING
Table 2.4-14 Floods From Postulated Seismic Failure of Upstream Dams
(Plant Grade is Elevation 728)
Watts Bar
Nuclear PlantElevation
OBE Failures With One-half Probable Maximum Flood
1. Norris and Tellico 728.84
2. Cherokee, Douglas, and Tellico -729.22
3. Fontana' and Tellico 720.65
4. Fontana a, Tellico, Hiwassee, Apalachia, and Blue Ridge 722.01
SSE Failures with 25-Year Flood
5. Norris, Cherokee, Douglas and Tellico b 731.11
a. Includes failure of four ALCOA and one Duke Energy dams--Nantahala (Duke Energy formerly ALCOA), upstream; Santeetlah, on adownstream tributary, and Cheoah, Calderwood, and Chilhowee, downstream. Fort Loudoun gates are inoperable in open position.
b. Gate opening at Fort Loudoun prevented by bridge failure.
0r•0
ni
73
0e
Fiue240 eetdb mnmn
f•
0
000m0
0
FIgure 2.4-73 Deleted by Amendment ___
.Mf,
-4
I,
0
Figure 2.4-74 Deleted by Amendment_
C)
Fiue2470eetdb mnmn
,Mf,
C))
0€
0o
C)o
0oC).
C"1
Fiue248 otn a sue Cniino a fe alr BEAd12Poal aiu lo
0
0000
0
nilii
0
-1
-I
b
Figure 2.4-92 Deleted by Amendment_
WATTS BAR
Figure 2.4-95 Deleted by Amendment__
HYDROLOGIC ENGINEERING 2.4-225
-C
a"
0
Fiue2490eee yAedet_
000arTl
0
ciliiciC,
FIgure 2.4-97 Deleted by Amendment ___
rp
000
0
-_q
b)
I
I
HIi :z~;:;~;
4''1*1
'1 I---- en- 4---
---- C-.-
CA
NOTE: Times shown allow 4 hours for communications and forecast computations.
I,-
I-,A
Ia !
II
*1
I,"~ I
I --.-- III- [
I- I 71.1~4 4 flD~~#t~
- I 4. ~
D
ii , 1Z~ ____
I---.-
B
Figure 2.4-110 (Sheet 1) Watts Bar Nuclear Plant Rainfall Flood Warning Time Basis For Safe Shutdown For Plant Flooding -Winter Events
0-
, oi -0o . . . . . .I ' : - : i i"...
o•r s - . . . ... :. .... . ... . . ..
. . .. . . _ i : . ? , :
*1•• • w•,iW• immdl I .-.- -Im
I ImM, .. ..Iam•awL
NOEIie honalw4hor o o-ui in n foeatcmuaios
i• '-.- I
B
Figure 2.4-110 (Sheet 2) Watts Bar Nuclear Plant Rainfall Flood Warning Time Basis For Safe Shutdown For Plant Flooding - Summer Events
b-I-InDbU
Figure 2.4-111 Deleted by Amendment __
WATTS BAR
Figure 2.4-112 OBE with Epicenter Within Area Shown
HYDROLOGIC ENGINEERING 2.4-243
an
074
L, + , . I PEAK ELEýV. 731.11
730
'PLANT G RADE ELEV. 728-. '
08
720
00
7140
! ,,
700
790
604
Dat
Fiur 2., 1 SS Falr of Nors Chrke'ogaadTlic aswt 5Y lo
F W t s Br N
Fiue2413 S alr f ors; hroeDuls an Telc Daswt 5Ya lo
Failre Wve a Watts..Bar Nula Plant
r.
740
SI *1~• 31730-~PEAK ELE V. 731.11}730 -3-i.
PLANT GRADE ELEV. 728• ./ ELEV. 727
720
Z0 710
•-E 361hrs-- ---- .
690 ____________ _
6/5 6/6 6/7 6/8 6/9Date
0
Figure 2.4-114 SSE Failure of Norris, Cherokee, Douglas, and Tellico Dams with 25-Year FloodFailure Wave at Watts Bar Nuclear Plant
0)
0
TQ)
0
0
0735
730
0 725
720
I I PEAK ELEV. 728.84ft
08 PL'ANTGRAOEI ELEV. 7281
0 ELEV. 727
I2
i0
3 hrs -
,K'..
/
715 -
3/2
m
4 3/25 3/26Date
3/27 3/28
Figure 2.4-115 OBE Failure of Norris and Tellico Dams with 112 PMF EventFailure Wave at Watts Bar Nuclear Plant
0
0z
00
S735 - I i II-
730 ' ' !PEAK1ELE V. 7Z'9.2Z ft
32PLANT GRAE ELEV.728 3/26327
ELE7257-
•,• U
F4jLshrs
3/24 3/53/26 3/27 3/28
Figure 2.4-116 OBE Failure of Cherokee, Douglas and Tellico Dams with 112 PMF EventFailure Wave at Watts Bar Nuclear Plant
ENCLOSURE 3
LIST OF COMMITMENTS
1. As a result of the updates to Section 2.4, TVA determined that the revised ProbableMaximum Flood (PMF) levels have the potential to impact other sections of the FSAR.Specifically, TVA is reviewing FSAR Section 3.8, "Design of Category 1 Structures," with thispotential in mind. This review will be completed on or before February 28, 2011.
2. In addition, as-a result of the re-analysis for the PMF and seismic dam failure scenarios forthe WBN Unit 2 FSAR submittal, dam stability calculations are being validated. Thisvalidation will be completed on or before March 31, 2011.
3. If necessary, any revisions resulting from the above reviews will be provided in a later FSARamendment.