328
Youth in Africa’s Labor Market Marito Garcia and Jean Fares, Editors DIRECTIONS IN DEVELOPMENT Human Development

"Today’s youth generation is the largest in history. Nearly half the global population isunder 25 and more than one billion are between 15 and 24. By 2015, there will be 3 billionyoung people, and 2.5 billion of them will be living in developing countries. Will thisgeneration present a potential threat to global stability or a potential resource for devel-opment? A lot depends on the action we take today to prepare them for the future. Theseyoung people need a nurturing environment that inculcates in them the right values andattitudes, equips them with appropriate and adequate knowledge and skills, and providesthem with the opportunity to play their part in society.”
—Ruth KagiaEducation Director, The World Bank
“As more young people in Africa are able to get an education, an important challenge forcountries is to ensure that youth have a smooth, productive, and safe transition fromschools to the working world. This book makes a very important contribution by articulatingthe issues around that transition and proposing solutions based on firm evidence. It is a‘must-read’ as a regional companion volume to theWorld Development Report 2007:Development and the Next Generation.”
—Emmanuel Y. JimenezDirector, World Development Report 2007, and Sector Director for Human Development,East Asia and the Pacific, The World Bank
"The opportunities are great, as many countries will have a larger, more skilled labor forceand fewer dependents. But these young people must be well prepared in order to createand find good jobs."
—François BourguignonFormer Chief Economist and Senior Vice President forDevelopment Economics, The World Bank
Youth in Africa’s Labor MarketMarito Garcia and Jean Fares, Editors
YouthinAfrica’s
LaborMarket
Garcia
andFares
SKU 16884
ISBN 978-0-8213-6884-8
D I R EC T IONS IN DEVE LOPMENT
Human Development

Youth in Africa’s Labor MarketEditorsMarito GarciaJean Fares
WB62_YALM_FM 3/12/08 3:15 PM Page iii

© 2008 The International Bank for Reconstruction and Development / The World Bank1818 H Street NWWashington, DC 20433Telephone: 202-473-1000Internet: www.worldbank.orgE-mail: [email protected]
All rights reserved
1 2 3 4 11 10 09 08
This volume is a product of the staff of the International Bank for Reconstruction andDevelopment / The World Bank. The findings, interpretations, and conclusions expressed in thisvolume do not necessarily reflect the views of the Executive Directors of The World Bank or thegovernments they represent.
The World Bank does not guarantee the accuracy of the data included in this work. The bound-aries, colors, denominations, and other information shown on any map in this work do not implyany judgement on the part of The World Bank concerning the legal status of any territory or theendorsement or acceptance of such boundaries.
Rights and Permissions
The material in this publication is copyrighted. Copying and/or transmitting portions or all ofthis work without permission may be a violation of applicable law. The International Bank forReconstruction and Development / The World Bank encourages dissemination of its work andwill normally grant permission to reproduce portions of the work promptly.
For permission to photocopy or reprint any part of this work, please send a request with completeinformation to the Copyright Clearance Center Inc., 222 Rosewood Drive, Danvers, MA 01923,USA; telephone: 978-750-8400; fax: 978-750-4470; Internet: www.copyright.com.
All other queries on rights and licenses, including subsidiary rights, should be addressed to theOffice of the Publisher, The World Bank, 1818 H Street NW, Washington, DC 20433, USA;fax: 202-522-2422; e-mail: [email protected].
ISBN: 978-0-8213-6884-8eISBN: 978-0-8213-6885-5DOI: 10.1596/978-0-8213-6884-8
Library of Congress Cataloging-in-Publication Data
Garcia, Marito, 1951-Youth in Africa’s labor market / Marito Garcia and Jean Fares.
p. cm.Includes bibliographical references and index.1. Youth—Employment—Africa. 2. Youth—Africa—Social conditions. 3. Labor market—
Africa. I. Farès, Jean. II. Title.
HD6276.A32G37 2008331.3′47096—dc22 2007044706
Cover painting: Paul OlajaCover design: Naylor Design
WB62_YALM_FM 3/12/08 3:15 PM Page iv

Foreword xviiContributors xixAcknowledgments xxiAbbreviations xxiiiExecutive Summary xxv
PART 1 Youth in Africa’s Labor Market: A Synthesis 1Marito Garcia and Jean Fares
Chapter 1 Why Is It Important for Africa to Invest in Its Youth? 3Marito Garcia and Jean Fares
Why Focus on the Transition to Work? 4Africa’s Demographic Transition Creates a Window
of Opportunity 4The Level of Educational Attainment Has Risen—
and Returns to Education Are Rising in Some Countries 7
Despite Progress, Significant Challenges Remain 8The Policy Response 11Notes 14
Contents
v
WB62_YALM_FM 3/12/08 3:15 PM Page v

Chapter 2 Transitions to Working Life for Africa’s Youth 15Marito Garcia and Jean Fares
Poverty and Large Income Shocks Push Children into the Work Force 18
The School-to-Work Transition of Africa’s Youth Is Long and Difficult 21
Chapter 3 How Do Africa’s Young People Spend Their Time? 27Marito Garcia and Jean Fares
Not Many Youth Are in the Labor Market and Employed 27
A Large Proportion of Youth Are “Inactive” 29Many Young People Are in School 29Time Use Varies by Income Group 32Notes 37
Chapter 4 The Effect of Education on Income and Employment 39Marito Garcia and Jean Fares
How Does Education Affect Income? 39How Does Education Affect Employment? 42What Effect Does Education Have on
Development? 44What Keeps Educational Attainment Low? 44Notes 47
Chapter 5 Working in Bad Jobs or Not Working at All 49Marito Garcia and Jean Fares
What Makes the Transition to Work Difficult for Youth? 49
Youth Are Vulnerable in the Labor Market 53
Youth Unemployment Is High 60Notes 65
vi Contents
WB62_YALM_FM 3/12/08 3:15 PM Page vi

Chapter 6 The Three Pillars of Policy: Lessons from International Experience 67Marito Garcia and Jean Fares
Responses from African Countries 73Future Research to Fill Knowledge Gaps 75
Annex 6A. Methodology: Building an Indicator of the School-to-Work Transition 75
Annex 6B. Inventory of Selected Policies and Programs on Youth Employment and Skills Development in Burkina Faso 78
Government Involvement in Youth Empolyment Issuses 78
Description of Policies and Programs 79How Well Have Interventions Performed? 82
Annex 6C. Inventory of Selected Policies and Programs on Youth Employment and Skills Development in Ethiopia 84
Government Involvement in Youth Employment Issues 84
Description of Policies and Programs 85How Well Have Interventions Performed? 89
Annex 6D. Inventory of Selected Policies and Programs on Youth Employment and Skills Development in Tanzania 91
Government Involvement in Youth Employment Issues 91
Description of Policies and Programs 92How Well Have Interventions Performed? 95
Annex 6E. Inventory of Selected Policies and Programs on Youth Employment and Skills Development in Uganda 97
Bibliography for Part 1 101
Contents vii
WB62_YALM_FM 3/12/08 3:15 PM Page vii

PART 2 Youth in Africa’s Labor Market: Country Case Studies 107Lisa Dragoset, Jean Fares, Lorenzo Guarcello, Florence Kondylis, Scott Lyon, Marco Manacorda,Daniel Parent, Furio Rosati, Cristina Valdivia, and Lars Vilhuber
Chapter 7 School-to-Work Transitions: Regional Overview 109Lorenzo Guarcello, Marco Manacorda, Furio Rosati,Jean Fares, Scott Lyon, and Cristina Valdivia
Aggregate Trends 110Young People’s Time Use 115Status of Young People in the Labor Market 120The Transition from School to Work 131Assessment of the Transition to Working Life 132Annex 7A.1 141Notes 144References 146
Chapter 8 What Determines Labor Market Participation by Youth in Burkina Faso? 149Daniel Parent
Labor Market Indicators 150Household Income, School Attendance,
and Returns to Education 159Notes 177References 178
Chapter 9 Child Labor and Youth Employment in Ethiopia 181Lorenzo Guarcello, Scott Lyon, and Furio Rosati
National Context 182Child Labor 185Labor Market Status of Young People in Ethiopia 188Transition to Working Life 196
viii Contents
WB62_YALM_FM 3/12/08 3:15 PM Page viii

Child Labor, Human Capital, and Youth Labor Market Outcomes 200
Policies and Programs for Youth Employment in Ethiopia 211
Conclusions and Policy Recommendations 217Notes 220References 222
Chapter 10 Youth in the Labor Market and the Transition from School to Work in Tanzania 225Florence Kondylis and Marco Manacorda
Why Is Unemployment Higher among Youth? 226Descriptive Evidence 228Determinants of Labor Force Status among Youth 246Conclusions and Policy Implications 254Notes 257References 258
Chapter 11 How Did Universal Primary Education Affect Returns to Education and Labor Market Participation in Uganda? 263Lisa Dragoset and Lars Vilhuber
Education and Earnings in Uganda 265The Literature on Educational Participation in
Developing Countries 266The Model 267Results 268Concluding Remarks 276Notes 276References 277
Index 281
Box1.1 HIV/AIDS Is Projected to Reduce the Size of the Youth
Cohort in Southern Africa 6
Contents ix
WB62_YALM_FM 3/12/08 3:15 PM Page ix

Figures1.1 Africa’s Youth Population Is Projected to Grow
Faster Than That of Any Other Region in the World 51.2 Economic Returns to Secondary Education Are High and
Rising Faster Than Educational Attainment in Uganda 81.3 Too Many Children Are Working in Many Sub-Saharan
African Countries 91.4 The Level of Education among Out-of-School Youth in
Africa Is Low 91.5 The Level of Literacy Varies Widely in Sub-Saharan Africa,
with Higher-Income Countries Tending to have Higher Literary Rates 10
1.6 Most African Youth Work in the Informal Sector or Are Self-Employed 10
1.7 Less-Skilled Youth Are Most Vulnerable to Changes in the Supply of and Demand for Labor in Ethiopia 12
2.1 Child Participation in the Labor Force Is High,Particularly among Rural Males in Ethiopia 17
2.2 The Late Age of School Leaving Is Not an Indication of High Educational Attainment in Burkina Faso 23
3.1 Time Use by Income Quintile Varies across Countries 343.2 Time Use by Patterns of Young People Vary across Age
Groups and Countries 364.1 Household Earnings Increase with Educational
Attainment in Burkina Faso 414.2 More Education Does Not Always Reduce the Rate of
Unemployment among Youth 435.1 Most Youth Perform Unpaid Family Work,
Predominantly in Agriculture in Ethiopia 595.2 Unemployment Is Higher among Youth Than Adults in
Almost All Sub-Saharan African Countries 615.3 Many Urban Youth Remain Unemployed for More
Than a Year in Ethiopia 625.4 Unemployment Spells Last Much Longer in Urban
Than in Rural Areas in Tanzania 635.5 Young Females Are More Likely Than Young Males to Be
Neither Working NOR Attending School 637.1 Regional Unemployment Rates, 2003 1127.2 Average Years of Schooling, by Region and Year 1137.3 Educational Attainment of Nonstudent Youth,
Sub-Saharan Africa Region 114
x Contents
WB62_YALM_FM 3/12/08 3:15 PM Page x

7.4 Unemployment Rate for Youth by Educational Attainment in Sub-Saharan African Countries 115
7.5 Changes in the Time Use Patterns of Young People by Age and Country 121
7.6 Unemployment Ratios for Young People Ages 15–24,by Sex, Residence, School Attendance, and Country 125
7.7 Youth versus Adult Unemployment 1297.8 Ratio of Youth to Adult Unemployment Rates,
Sub-Saharan African Countries and OECD Countries 1307.9 Length and Timing of Transition from School to Work
for Children Ever Attending School by Sex, Residence,and Country 135
7.10 School Enrollment by Age and School Attendance in Burkina Faso 136
7.11 Correlation Between Transition Duration and Selected Macroeconomic and Demographic Factors 138
7.12 The Proportion of Children Ages 8–12 Who Are Economically Active 140
7.13 Age at First Job for Children Never Attending School,by Country 140
9.1 Ethiopia’s Labor Force Tripled between 1960 and 2002 1849.2 Gross Primary School Enrollment in Ethiopia More
Than Doubled between 1995 and 2003 1859.3 Rural Residents and Boys in Ethiopia Are More Likely
to Work as Children Than Urban Residents and Girls 1869.4 The Unemployment Ratio and Rate of Joblessness
among 15- to 24-Years-Olds in Ethiopia Are About Average for Sub-Saharan Africa 190
9.5 Youth Unemployment Ratios in Ethiopia Are Much Higher in Urban Than in Rural Areas 191
9.6 Urban Workers in Ethiopia Work Many More Hours per Week Than Rural Workers 191
9.7 The Duration of Urban Unemployment in Ethiopia Is a Cause for Concern 192
9.8 Youth Have Weaker Labor Indicators Than Adults in Ethiopia, but Unemployment among Both Groups Is Low 195
9.9 The Unemployment Ratio among Ethiopian Adults of All Ages Is Higher in Urban Than in Rural Areas 196
9.10 Ethiopian Youth Begin the Transition from School to Work Later Than Youth in Other Countries in Sub-Saharan Africa 197
Contents xi
WB62_YALM_FM 3/12/08 3:15 PM Page xi

9.11 Ethiopian Children Who Start School Tend to Remain in School through Their Teens 199
9.12 Gender and Location Affect the Duration and Timing of the Transition from School to Work in Ethiopia 199
9.13 Ethiopian Children Begin Work Much Earlier Than Children in Other Countries in Sub-Saharan Africa 200
9.14 Employment Rates among Ethiopians Ages 20–24 Decrease with Education, and Unemployment Rates Increase 201
9.15 The Higher Their Level of Education, the More Likely Ethiopians Ages 20–24 Are to Work in Wage Employment 204
11.1 Income Rises with Level of Education in Uganda 265
Tables2.1 Age of First Job and Percentage of Children Working
in Selected Countries 162.2 Type and Sector of Employment of Child Workers
by Age Group, Gender, and Urban-Rural Location in Ethiopia 19
2.3 Effect of Poverty and Household Income Shocks on Labor Force Participation of Urban Dwellers Ages 12–14 in Burkina Faso 20
2.4 Duration of the School-to-Work Transition in Selected Countries 22
2.5 Length and Timing of Transition from School to Work by Gender, Residence, and Country 24
3.1 Time Use among Male and Female Youth in Selected Countries 31
3.2 Time Use among Rural and Urban Youth in Selected Countries 33
3.3 Time Use among Teenagers and Young Adults in Selected Countries 35
4.1 Effect of Primary and Secondary Education on Wages,by Age Group, 1992 and 1999, in Uganda 42
4.2 Determinants of Schooling for Urban and Rural Youth by Gender in Tanzania 46
5.1 Determinants of Urban and Rural Youth Unemployment in Tanzania 50
xii Contents
WB62_YALM_FM 3/12/08 3:15 PM Page xii

5.2 Determinants of Urban and Rural Youth Inactivity in Tanzania 51
5.3 Employment Response to Demographic and Economic Shocks for Females by Location and Education in Ethiopia 51
5.4 Response of Youth Employment to Demographic and Economic Shocks for Females by Level of Education and Urban-Rural Location in Ethiopia 54
5.5 Modality of Employment by Youth and Adults in Selected Countries 55
5.6 Modality of Employment of Rural and Urban Youth, in Selected Countries 57
5.7 Employment Modality by Gender, Age Group, and Urban-Rural Location in Tanzania 58
5.8 Multiple Job Holding and Underemployment by Gender,Age, and Urban-Rural Location in Burkina Faso 60
5.9 Reported Reasons for Inactivity among Male Youth in Tanzania 64
6.1 Promising Interventions in Burkina Faso, Ethiopia,Tanzania, and Uganda 74
6B.1 Selected Employment-Related Programs by Category,Location, and Age Group Served in Burkina Faso 80
6B.2 Quality of Employment-Related Interventions in Burkina Faso 83
6B.3 Quality of Evaluations of Employment-Related Interventions in Burkina Faso 84
6C.1 Selected Employment-Related Programs by Category,Location, and Age of Group Served in Ethiopia 86
6C.2 Quality of Employment-Related Interventions in Ethiopia 896C.3 Quality of Evaluations of Employment-Related Programs
in Ethiopia 906D.1 Selected Employment-Related Programs by Category,
Location, and Age Group Served in Tanzania 936D.2 Quality of Employment-Related Interventions in Tanzania 956D.3 Quality of Evaluations of Employment-Related Programs
in Tanzania 977.1 Time Use Patterns for Youth Ages 15–24, by Country 1167.2 Time Use Patterns for Youth Ages 15–24, by Sex
and Country 1177.3 Time Use Patterns for Youth Ages 15–24, by Residence
and Country 118
Contents xiii
WB62_YALM_FM 3/12/08 3:15 PM Page xiii

7.4 Time Use Patterns for Youth, by Age Group and Country 1197.5 Youth Unemployment, Inactivity, and Jobless
Indicators, by Age Group and Country 1247.6 Employment Characteristics for the 15–24 Year-Old
Age Group, by Country 1287.7 Youth versus Adult Employment Characteristics by
Country 1317.8 School-to-Work Transition Points by Residence
and Country 1338.1 School and Work Status of Females and Males in
Burkina Faso, by Age, 1993–2003 1518.2 Employment and Unemployment Rates among
Burkinabes Not Enrolled in School, by Age and Gender,1993–2003 152
8.3 Employment and Unemployment Rates in Burkina Faso,by Age, Gender, and Education, 1993–2003 154
8.4 Employment and Unemployment Rates in Urban and Rural Areas of Burkina Faso, 1993–2003 156
8.5 Percentage of Burkinabes Underemployed or Holding More Than One Job, 2003 158
8.6 Percentage of Burkinabes Holding More Than One Job, by Household Income Quintile, 2003 159
8.7 Household Income Shocks and Labor Force Participation in Burkina Faso, 2003 160
8.8 Changes in Household’s Economic Conditions and Labor Force Participation 163
8.9 School Enrollment Probits for Burkina Faso, 1993–2003 1688.10 Rate of Return to Schooling in Burkina Faso, 2003 1738.11 Instrumental Variables Estimates of Rate of
Return to Schooling 1758.12 Panel Data IV Estimates 1769.1 Macroeconomic Indicators for Ethiopia, 1982–2001 1839.2 Work and School Activity of Ethiopian Children,
by Age, Gender, and Urban-Rural Location 1879.3 Youth Unemployment, Inactivity, and Joblessness
Indicators in Ethiopia, by Age Group, Gender, and Urban-Rural Location 189
9.4 Work Modality, Sector of Employment, and Average Weekly Hours of Employed Ethiopian Youth 193
xiv Contents
WB62_YALM_FM 3/12/08 3:15 PM Page xiv

Contents xv
9.5 Ratio of Youth to Adult Unemployment Rates in Selected Sub-Saharan African Countries 195
9.6 School-to-Work Transition Points in Ethiopia,by Gender and Urban-Rural Location 198
9.7 Employment Status and Employment Modality of Ethiopians Not in School, by Educational Attainment and Age Group 203
9.8 Probability of Employment among Ethiopians Ages 10–24: Probit Estimates Using Regionwide Definition of Local Labor Market 206
9.9 Probability of Employment among Rural and Urban Ethiopians Ages 10–24, by Level of Education:Probit Estimates Obtained Using Indicators of Local Labor Market Separated for Rural and Urban Areas 208
10.1 Labor Force and Schooling Status in Tanzania, 2000/01 22910.2 Nature of Employment in Tanzania, 2000/01 23310.3 Activity and Unemployment Status in Tanzania, 2000/01 23810.4 Reasons Why Tanzanians Are Not Looking for or Are
Not Available for Work 24210.5 Job Search Methods in Tanzania 24510.6 Determinants of Labor Force Status and Schooling
Choices of Youth in Tanzania 24811.1 A Large Proportion of Uganda’s Labor Force Works
Outside the Formal Sector 26611.2 The Percentage of Ugandans with Some Secondary
Education Rose between 1992 and 2002 27011.3 The Free Primary Education Policy Has Freed Household
Resources, Allowing Families to Keep Children in School Longer 271
11.4 The Average Educational Level of Household Heads in Uganda Rose between 1992 and 2002 272
11.5 Educational Levels Increased in Both Rural and Urban Areas 273
11.6 Employment Rose between 1992 and 1999, Particularly among Young Women 275
WB62_YALM_FM 3/12/08 3:15 PM Page xv

WB62_YALM_FM 3/12/08 3:15 PM Page xvi

Foreword
xvii
About 200 million people between the ages of 12 and 24 live in Africatoday, and their share of the population is rising. By 2010 youth willaccount for 28 percent of the population, making Sub-Saharan Africa the“youngest” region in the world. This largest-ever youth cohort means thatthe time has never been more urgent to invest in young people in Africa.With good policies and institutions in place, the potential to reap a divi-dend from a larger, younger work force with fewer dependents is great.
This book examines the challenges African youth face in their transi-tion to work and presents a strategy for meeting these challenges. Itargues that African youth start working too early and are unprepared tomeet the demands of the labor market. Leaving school early—or notentering at all—limits their human capital accumulation and restrictstheir upward mobility, with grave implications for both individuals andnational economies.
Labor is the most abundant asset of poor households in Africa.Developing this asset is therefore essential to helping households moveout of poverty. Strengthening the work force can also improve theinvestment climate, increase economic growth, and prevent instabilityand violence, particularly in postconflict situations, where large numbersof unemployed youth threaten security.
This book describes how Africa’s young people spend their time andpresents a case for investing in youth in Africa, analyzing the two pathsto working life for Africa’s youth: directly (without the benefit of edu-cation) and through school. It also presents new evidence on the effectsof education on employment and income in selected countries, and
xvii
WB62_YALM_FM 3/12/08 3:15 PM Page xvii

examines youth unemployment and its determinants. The case studiesconducted in selected African countries analyze policies and programsimplemented on youth employment and suggest a policy framework tohelp African youth successfully transition to working life.
Robert Holzmann Yaw AnsuDirector, Social Protection Director, Human Development Human Development Network DepartmentThe World Bank Africa Region
The World Bank
xviii Foreword
WB62_YALM_FM 3/12/08 3:15 PM Page xviii

Lisa Dragoset is an economist at Cornell Institute for Social and EconomicResearch, Cornell University in Ithaca, New York, United States.
Jean Fares is a senior economist at the World Bank’s HumanDevelopment Network.
Marito Garcia is a lead economist at the World Bank’s Human DevelopmentDepartment, Africa Region.
Lorenzo Guarcello is a researcher with the Understanding Children’sWork project—a joint World Bank, ILO, and UNICEF project.
Florence Kondylis is an economist in the Department of Economics,QMUL and CEP–London School of Economics, United Kingdom.
Scott Lyon is a researcher with the Understanding Children’s Workproject—a joint World Bank, ILO, and UNICEF project.
Marco Manacorda is a professor at the Department of Economics,RHUL and CEP–London School of Economics, United Kingdom.
Daniel Parent is a professor of Economics at McGill University,Montreal, Canada.
Furio Rosati is the Director of Understanding Children’s Work project—a joint World Bank, ILO, and UNICEF project.
Cristina Valdivia is a researcher with Understanding Children’s Workproject—a joint World Bank, ILO, and UNICEF project.
Lars Vilhuber is a research fellow at the Cornell Institute for Socialand Economic Research, Cornell University in Ithaca, New York,United States.
Contributors
xix
WB62_YALM_FM 3/12/08 3:15 PM Page xix

WB62_YALM_FM 3/12/08 3:15 PM Page xx

This report is a collaborative effort of the Africa Human DevelopmentTechnical Department, the Social Protection Team of the HumanDevelopment Network, and the Burkina Faso, Ethiopia, Tanzania, andUganda Country Teams of the World Bank.
The report was prepared by a team led by Marito Garcia (TeamLeader) and Jean Fares (Co-Task Team Leader). Contributions were madeby the study team consultants: Lisa Dragoset, Martha Getachew, MartinGodfrey, Lorenzo Guarcello, Emily Kallaur, Florence Kondylis, MarcoManacorda, Anthony Okech, Barthelemy Ouedraogo, Daniel Parent,Furio Rosati, Joseph Shitundu, Ruth Uwaifo, Lars Vilhuber, and GillianVirata. Moukim Temorov (Burkina Faso Country Team), Emily Kallaurand Caterina Ruggeri Laderchi (Ethiopia Country Team), Rest Laswayand Robert Utz (Tanzania Country Team), and Suleiman Namara andMirey Ovadiya (Uganda Country Team) also contributed to the report.
The report was prepared under the general guidance of Laura Frigenti(Sector Manager); Yaw Ansu (Sector Director); and Robert Holzmann(Sector Director). Peer reviewers were Emmanuel Jimenez, LindaMcGinnis, and Wendy Cunningham.
The participants of the one-day workshop on youth in Africa’s labormarket held in Washington, D.C., provided valuable guidance to thestudy team and commented on initial drafts of the country case studies.The team is particularly grateful to Emmanuel Jimenez, RobertHolzmann, M. Louise Fox, Setareh Razmara, Stefano Scarpetta, PiaPeeters, Harold Alderman, Viviana Mangiaterra, Linda McGinnis,Maurizia Tovo, Wendy Cunningham, Daniel Kwabena Boakye, members
Acknowledgments
xxi
WB62_YALM_FM 3/12/08 3:15 PM Page xxi

of the Africa Labor Market Analysis Thematic Group, the Children andYouth Thematic Group, and Laura Brewer (International LabourOrganization Geneva).
The country case studies were funded partly by the Trust Fund of theESSD-Social Protection Window.This support is gratefully acknowledged.
xxii Acknowledgments
WB62_YALM_FM 3/12/08 3:15 PM Page xxii

AGETIP Agence d’Exécution des Travaux d’Intérêt PublicBEUPA Basic Education in Urban Poverty AreasBOLSA Bureau for Labour and Social Affairs (Ethiopia)COBET Complementary Basic Education in TanzaniaESDPIII Education Sector Development Plan IIIGDP gross domestic productGTZ German Agency for Technical CooperationHIV/AIDS human immunodeficiency virus/acquired immune
deficiency syndromeILFS Integrated Labor Force Survey ILO International Labour OrganizationLICUS low-income countries under stressMDGs Millennium Development GoalsMOLSA Ministry of Labour and Social Affairs (Ethiopia)NGOs nongovernmental organizationsPEAP Poverty Eradication Action PlanPEVDT Promotion of Employment-Oriented Vocational and
Technical TrainingReMSEDA Regional Micro and Small Enterprises Development
AgenciesSFSI Standard Files Standard Indicators DatabaseSHLS Survey of Household Living Conditions
Abbreviations
xxiii
WB62_YALM_FM 3/12/08 3:15 PM Page xxiii

TVET technical and vocational education and trainingUCW Understanding Children’s WorkUNICEF United Nations Children’s FundVETA Vocational Education and Training Authority, Tanzania
xxiv Abbreviations
WB62_YALM_FM 3/12/08 3:15 PM Page xxiv

Youth and Africa have received increased attention in recent policydiscussions and World Bank work, as articulated in the Africa ActionPlan and the World Development Report 2007: Development and the NextGeneration. The Africa Action Plan offers a framework to support criticalpolicy and public action led by African countries to achieve well-definedgoals, such as the Millennium Development Goals (MDGs). The WorldDevelopment Report’s main message is that the time has never been betterto invest in young people living in developing countries. It offers a three-pillar policy framework for investing in and preserving the human capitalof the next generation. Both frameworks respond to the desire to findsolutions to Africa’s development challenges and to prepare for andbenefit from the next generation of workers, parents, and leaders.
This report examines the challenges Africa’s youth face in their tran-sition to working life and proposes policies for meeting these challenges.It presents evidence from case studies of 4 countries—Burkina Faso,Ethiopia, Tanzania, and Uganda—and from household data on 13 coun-tries. The four case studies include a stocktaking of existing policies andprograms to address youth employment and labor markets.
The overarching message of the report is the call to further invest inthe human capital of youth in Sub-Saharan Africa to take advantage ofthe large youth cohorts there. Youth in Africa leave school too early andenter the labor market unprepared, limiting their contribution toeconomic growth and increasing their vulnerability to poverty andeconomic hardship.
Executive Summary
xxv
WB62_YALM_FM 3/12/08 3:15 PM Page xxv

Why Focus on the Transition to Work for Youth in Africa?
Youth undergo several transitions between the ages of 12 and 24. Duringthis period, some young people move from primary to secondary educa-tion. Others leave school and start to work. Decisions made during thisperiod affect young people’s acquisition of human capital. Thesedecisions have enormous consequences for their future prospects, as wellas those of their communities.
The difficulties youth encounter in entering the work force and devel-oping the skills needed to ensure gainful and productive employmentcan have profound effects on countries’ investment climates andprospects for growth. An educated and healthy work force providesincentives for investment; unskilled and disillusioned youth makereturns to investment low and uncertain. For this reason, national gov-ernments and regional bodies have placed this issue squarely on theirpolicy agenda for this decade.
Africa’s Window of Opportunity
The demographic transition in Sub-Saharan Africa makes youth themost abundant asset the region has or will have in the near future. About200 million young people between the ages of 12 and 24 live in Africatoday; unlike in the rest of the developing world, the share of youth inthe population will continue to rise in Africa. Since the 1950s the youthpopulation in Sub-Saharan Africa has more than quadrupled (UN 2005).This rapid rate of growth has pushed the absolute size of the youth pop-ulation in Sub-Saharan Africa beyond that of many other regions. By2010 youth will represent about 28 percent of Sub-Saharan Africa’spopulation, making it the “youngest” region in the world. By 2030 Africais projected to have as many youth as East Asia and by 2050 could alsoexceed the youth population in South Asia.
This largest-ever youth cohort is more educated and healthier thanprevious cohorts. Other regions that have seen such an important demo-graphic transition (such as East Asia and Latin America) have had mixedrecords dealing with it. East Asia, which put the right policies andinstitutions in place, was able to reap the demographic dividend from alarge work force with fewer dependents. In fact, some observers havesuggested that up to a third of the Asian miracle growth is attributableto this demographic dividend. In Latin America similar demographicdynamics did not yield better development outcomes.
xxvi Executive Summary
WB62_YALM_FM 3/12/08 3:15 PM Page xxvi

This opportunity no doubt involves risks. Africa’s youth cohort todayfaces new challenges, such as HIV/AIDS and global competition. Changesin economic conditions and global forces have increased competition anddemand for higher skills, increasing the returns to education, particularlyhigher levels of education, in countries that are growing.
Youth Face Several Challenges in Their Transition to Work
Africa’s youth follow two paths in their transitions to working life.Some go to work directly, with little benefit of formal schooling. Othersjoin the work force after a time in the formal school system. Manyyoung people enter the labor market unprepared, making them morevulnerable to demographic and demand changes affecting the labormarket. Few youth earn wages and many work in the informal sector. Inrural areas most young people are in unpaid family work, are underem-ployed, or both. In urban areas many young people are unemployed,some of them for long time periods. Those who work are more likelythan adults to be stuck in low-productivity jobs. The low-skilled aremost vulnerable to weakening demand. Young women have difficultyparticipating in the labor force. They become discouraged workers andengage in nonmarket activities.
African Youth Enter the Labor Market too Early and too UnpreparedEarly entry into the labor market limits Africans from accumulatingthe human capital they need to get good jobs. The difficulties they facefinding work or participating in the labor force mean that the benefitsof earlier investments are not fully realized. Safeguarding and buildingon these investments will greatly increase the likelihood that Africabenefits from its youth bulge. It will reduce the threat to its securityand future development. And because labor is the most abundant assetof the poor, making labor more productive will help move Africans outof poverty.
A substantial proportion of young people in most Sub-SaharanAfrican countries never enter school, moving directly into the laborforce. In fact, the incidence of child labor in Sub-Saharan Africa is thehighest in the world. In 29 African countries for which data are avail-able, an average of 35 percent of children under the age of 15 work.Exposure to the job market in childhood or early adolescence can havea strong negative impact on future labor market experience and earning
Executive Summary xxvii
WB62_YALM_FM 3/12/08 3:15 PM Page xxvii

potential. Today’s child laborers will represent the weakest part oftomorrow’s adult labor force.
African youth enter the labor market lacking skills. Illiteracy among15- to 24-year-olds is alarmingly high; in Burkina Faso, Ethiopia, andMozambique more than 75 percent of out-of-school youth have noeducation at all. Despite enormous improvements in education over thepast decade, the primary completion rate in the region—59 percent—remains the lowest in the world.This education gap remains a major hin-drance for Africa’s youth as they transition into working life.
Africans who do transition from school to work experience very longperiods of inactivity, implying significant labor market entry problems. In8 of the 13 countries reviewed (Cameroon, Ethiopia, The Gambia,Kenya, Malawi, Mozambique, São Tomé and Principe, and Zambia),young people face about five years of inactivity before finding work;youth in Uganda are inactive for more than three years on average. Thetransition duration is just one year in Côte d’Ivoire and almost sevenyears in Mozambique, suggesting that vulnerability to unsuccessful tran-sition varies greatly across countries. Male youth stay in school longerand attain higher education levels than females. They start the transitionto work later than females in both urban areas (except in Kenya) andrural areas (except in Kenya and Uganda). Urban youth start workinglater and have higher education attainment than rural youth.
Youth Are Most Vulnerable to Demographic and Macroeconomic Conditions By the age of 24, most Africans have left school and started to work. Theproportion of youth at work versus those still in school ranges widelyacross countries: in Kenya and Malawi, more than 40 percent of youthremain in school, and more youth are in school than at work, while inBurkina Faso and Burundi, more than 70 percent of youth work.Transition to work is often difficult because of the lack of strong employ-ment creation in several countries in Sub-Saharan Africa and because ofseveral youth-specific factors. These factors include the growingnumbers of new entrants into the labor force, market and policy failuresthat disproportionately affect youth, and the lack of skills required tomatch the changing nature of labor demand as a result of globalizationand technological changes.
Increases in the relative size of the youth cohort and the number of newentrants into the work force hurt the employment prospects of youth.Cross-country analysis shows that a 1 percent increase in the share of youth
xxviii Executive Summary
WB62_YALM_FM 3/12/08 3:15 PM Page xxviii

in the population increases youth unemployment by 0.5 percentage points.Evidence from Burkina Faso, Ethiopia, and Tanzania confirms this link.
A close investigation of the labor market for youth also reveals impor-tant market segmentation by urban and rural residence or gender, a resultof market and policy failures reducing youth flows between differentsegments of the labor market. Evidence from Ethiopia documents howemployment among low-skilled youth is more vulnerable to economicshocks and demographic changes. In Burkina Faso those who start towork with little or no education are unlikely to move to better occupa-tions years after entry.
The Policy Response: Broaden Employment Opportunities, Enhance Youth Capabilities, and Offer Youth Second Chances
Applying the World Development Report 2007 framework to Africarequires increasing employment opportunities for youth in order to safe-guard and further develop their skills, providing youth with the capabilityto choose among opportunities by equipping them with the right skills andimproving their access to information and credit, and giving them secondchances, so that no one is left behind.
Broadening Opportunities for EmploymentEconomic growth is key to broadening opportunities. It increases employ-ment for everyone—and has a disproportionately large effect on youth.The recent economic expansion in several countries in Sub-SaharanAfrica will have positive effects on youth. In Ethiopia the evidence showsthat youth employment responds positively to increased demand forlabor, partly offsetting the pressure of a large cohort of new entrants. Agood investment climate—which lets the private sector expand and helpstrade flourish—will support economic expansion. These general policiesare necessary to promote youth employment opportunities, but they arenot sufficient. Youth would also benefit from policies that mitigate themarket and policy failures responsible for labor market rigidity and seg-mentation, particularly along the skills and urban-rural dimensions.
Increasing Youth’s CapabilitiesYouth need to be prepared to take advantage of potential opportunitiesand to create opportunities on their own though self-employment andentrepreneurial activities. Preparation for employment starts with basicgood-quality education, which provides the foundation for future human
Executive Summary xxix
WB62_YALM_FM 3/12/08 3:15 PM Page xxix

capital accumulation and the later acquisition of vocational skills in schools,training institutes, and the workplace (World Bank 2006).
In general, higher levels of education are associated with an easiertransition to work. But for youth in Africa, education does not alwaysreduce unemployment; in some countries the unemployment rate amongeducated youth is very high. Over time, however, as youth gain workexperience, higher levels of education increase the employment inci-dence and enhance occupational mobility. In Tanzania, after controllingfor experience, the incidence of employment among urban men with thehighest level of education is about 26 percentage points higher than thatof men with no education. In Burkina Faso the initial occupations ofyouth vary little with education levels, but young people with higher lev-els of education are more likely to move to better occupations over time.
In Burkina Faso and Tanzania, school enrollment is negatively affectedby adverse income shocks to households, the low education of thehousehold head, and difficulty in access to education, measured bydistance to school. Because poor households are more likely to beincome-constrained, when faced with negative income shocks, they aremore likely to take their children out of school and send them to work.Other households may not realize the incentives for investing in educa-tion, partly because parents with low educational attainment tend tounderstate the benefits of children’s schooling.
Providing a Second ChancePoverty, adverse economic conditions, ill health, employment shocks,and inadequate schools force many young people to leave school, bring-ing early investment to a halt and frustrating their efforts to prepare forwork and develop their livelihoods. In Africa, an estimated 95 millionyoung men and women with no education are either unemployed, inlow-paying jobs, or totally withdrawn from the labor force. These youthneed a second chance.
Policy makers are concerned about the difficulties African youth arefacing in their transition to work and their need for a second chance. Theyrecognize the consequences for the future development of youth as well asfor the development of the economies in which they live. Despite thisrecognition, the response to the problem has been fragmented, confined tolimited interventions.The review of interventions in Burkina Faso, Ethiopia,Tanzania, and Uganda shows that most second-chance interventions aresmall in scale, unevaluated, and face severe challenges for sustainabilityand scalability.
xxx Executive Summary
WB62_YALM_FM 3/12/08 3:15 PM Page xxx

The Way Forward
Youth are one of Africa’s most abundant assets. Only by safeguardingearly investments and further developing this resource will the region beable to reap the benefit of its unprecedented demographic transition.This window of opportunity is wide open for policies that ensure thatcountries can move forward to achieve more rapid growth and povertyreduction. Failing to do so will be costly for this generation and for futuregenerations.
This report offers some guidance to policy makers searching for solu-tions to address youth employment issues. The approach is based on apolicy framework that encompasses the complexity of youth issues andincorporates lessons from international experience. The analyses and thesurveys of interventions in Burkina Faso, Ethiopia, Tanzania, and Ugandaground the proposed framework in these countries’ realities and providethe background for further empirical examination. The report lays thefoundation for mainstreaming youth employment within the WorldBank’s operations and supporting the policy dialogue with countries.
Executive Summary xxxi
WB62_YALM_FM 3/12/08 3:15 PM Page xxxi

WB62_YALM_FM 3/12/08 3:15 PM Page xxxii

P A R T 1
Youth in Africa’s Labor Market:A Synthesis
Marito Garcia and Jean Fares
WB62_YALM_CH01 3/12/08 12:05 PM Page 1

WB62_YALM_CH01 3/12/08 12:05 PM Page 2

Youth are the most abundant asset Sub-Saharan Africa has—or will havein the near future—because of the demographic transition in the region.About 200 million young people between the ages of 12 and 24 live inAfrica today, and their number is growing. Investing in youth will greatlyincrease the likelihood that Africa will benefit from its youth bulge, andit will reduce the threat to its security and future development. Becauselabor is the most abundant asset of the poor, improving labor’s produc-tivity is the best way to reduce poverty.
Investment in children’s education and health has increased primaryenrollment and reduced health risks in several countries in the region. ButAfrican youth still enter the labor market early and unprepared, limitingtheir human capital accumulation and upward mobility. The difficultiesof finding work can limit the benefits of investments in their education.
Economic growth and overall employment creation are necessary toimprove employment outcomes for youth as well, but these conditionsare not sufficient. Policy makers need to ensure that youth can take fulladvantage of the opportunities that growth presents and to minimizepolicy and market failures that affect youth disproportionately. Policiesare needed to help young people develop skills and to increase theiraccess to information and credit so that they are able to make better
C H A P T E R 1
Why Is It Important for Africa toInvest in Its Youth?
Marito Garcia and Jean Fares
3
WB62_YALM_CH01 3/12/08 12:05 PM Page 3
choices among available opportunities. The most vulnerable young peopleshould be granted second-chance opportunities to ensure that no one isleft behind.
Why Focus on the Transition to Work?
Youth undergo several transitions between the ages of 12 and 24. Duringthis period some young people move from primary to secondary educa-tion. Others leave school and start to work. Decisions made during thisperiod affect young people’s human capital and future prospects, as wellas the development of the communities and regions where they live.
One of the most important decisions youth make is when to leaveschool. Those who leave too early enter the labor market unprepared.They are more vulnerable to shocks, less likely to find work, and morelikely to get stuck in low-quality jobs, with few opportunities to developtheir human capital and move to better employment. Because labor isthe most abundant asset of poor households in Africa, ensuring its properdevelopment when youth are most able to learn and develop is essentialto helping families move out of poverty.
The difficulties youth encounter entering the work force and developingthe skills needed to ensure gainful and productive employment can haveprofound effects on countries’ investment climates and growth prospects.For this reason, national governments and regional bodies have placed thisissue prominently on their policy agenda for this decade.
Africa’s Demographic Transition Creates a Window of Opportunity
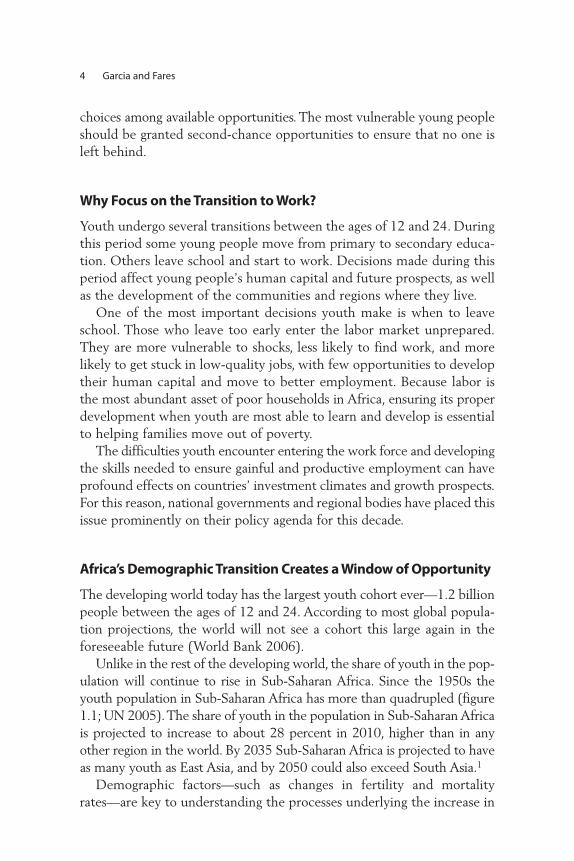
The developing world today has the largest youth cohort ever—1.2 billionpeople between the ages of 12 and 24. According to most global popula-tion projections, the world will not see a cohort this large again in theforeseeable future (World Bank 2006).
Unlike in the rest of the developing world, the share of youth in the pop-ulation will continue to rise in Sub-Saharan Africa. Since the 1950s theyouth population in Sub-Saharan Africa has more than quadrupled (figure1.1; UN 2005).The share of youth in the population in Sub-Saharan Africais projected to increase to about 28 percent in 2010, higher than in anyother region in the world. By 2035 Sub-Saharan Africa is projected to haveas many youth as East Asia, and by 2050 could also exceed South Asia.1
Demographic factors—such as changes in fertility and mortalityrates—are key to understanding the processes underlying the increase in
4 Garcia and Fares
WB62_YALM_CH01 3/12/08 12:05 PM Page 4

Why Is It Important for Africa to Invest in Its Youth? 5
the size of the youth cohort. In some countries, such as the DemocraticRepublic of Congo and Kenya, where fertility rates are high and late todecline, the youth population is projected to continue to increase rapidlyover the next several decades. Other countries, such as Senegal, areprojected to experience slower growth, with the youth population lev-eling off shortly after 2030 (Lam 2006). These projections are subject toconstant revisions and are affected by several shocks, including theprevalence of HIV/AIDS (box 1.1).
Everything else equal, a large cohort reduces labor market opportunitiesfor youth. In Europe and the United States, which experienced largedemographic shifts after World War II, wages and employment for youthfell as the relative size of the youth cohort grew (Freeman 1979;Korenman and Neumark 2000). Evidence from a large set of developingcountries suggests that the estimated elasticity of youth unemploymentto the relative youth cohort size is about 0.5 (O’Higgins 2003).This meansthat a 1 percent increase in the cohort size increases youth unemploymentby 0.5 percentage points. Microanalysis from household surveys inEthiopia and Tanzania indicates that the increase in the youth share inthe local labor market leads to a significant decline in the youth employ-ment rate (see chapter 5).
A large youth cohort also presents an opportunity for the region,however. The rapid rise in the ratio of the working to the nonworkingpopulations in East Asia between 1965 and 1990 may have played animportant role in driving the East Asian “economic miracle” (Bloom andWilliamson 1998). Since Sub-Saharan Africa will be faced with similar
Figure 1.1. Africa’s Youth Population Is Projected to Grow Faster Than That of Any Other Region in the World
Source: UN (2005).
0
50,000
100,000
150,000
200,000
250,000
300,000
350,000
400,000
450,000
500,000
1950 1960 1970 1980 1990 2000 2010 2020 2030 2040 2050
po
pu
lati
on
12–
24 (
in t
ho
usa
nd
s)
Sub-Saharan Africa
Middle Eastand North Africa
South Asia
Europe and Central Asia
East Asia and Pacific
Latin America and Caribbean
WB62_YALM_CH01 3/12/08 12:05 PM Page 5

6 Garcia and Fares
Box 1.1
HIV/AIDS Is Projected to Reduce the Size of the Youth Cohort in Southern Africa
The population projections of the UN Population Division include projections
about AIDS mortality and the potential impact of antiretroviral treatment. They
incorporate the Joint United Nations Programme on HIV/AIDS (UNAIDS) model
used to project the course of the epidemic in the 60 countries with the highest
HIV prevalence (UNAIDS 2002). A second set of hypothetical projections is made
based on the assumption that there is no AIDS mortality.
Comparison of the two sets of projections indicates that AIDS mortality has
a substantial impact on the size of the youth population in Botswana, South
Africa, and Zambia. There is little difference in the two projections in 2000, but
by 2010 the projections begin to diverge. In Botswana, for example, the youth
population is projected to peak around 2005 under the medium-variant
projection; under the “no AIDS” projection, it would have continued increasing
for several more decades. In Zambia AIDS is projected to reduce the size of the
youth population by about 15 percent by 2015.
AIDS Is Expected to Reduce the Size of the Youth Cohort in Botswana, South Africa, and Zambia
Source: Lam 2006.
0
50
100
150
200
250
300
350
400
450
500
1980 1985 1990 1995 2000 2005 2010 2015 2020 2025 2030 2035 2040 2045 2050
Zambia - No AIDSZambia - AIDSBotswana - No AIDSBotswana - AIDSSouth Africa - No AIDSSouth Africa - AIDS
po
pu
lati
on
(19
80=1
00)
WB62_YALM_CH01 3/12/08 12:05 PM Page 6

demographic dynamics, setting macroeconomic and labor market policiesthat will help it reap this demographic dividend is essential.
The Level of Educational Attainment Has Risen—and Returns toEducation Are Rising in Some Countries
The average years of educational attainment in Sub-Saharan Africa doubledbetween 1960 and 2000 (Barro and Lee 2000). Although Sub-SaharanAfrica has the lowest primary completion rate of any region, at only 59 per-cent in 2003, enormous progress is being made. According to the 2005Global Monitoring Report, since 1990, 8 of the developing world’s 10 topperformers in annual increases in primary completion rates have been inAfrica (Benin, Eritrea, Ethiopia, Guinea, Mali, São Tomé and Principe,Togo,and Malawi). Primary completion rates in these countries have grown bymore than 5 percent a year, well above the low-income country average of0.8 percent a year. All of these countries, which started from a very lowbase, have enjoyed dramatic growth in enrollment: Ethiopia’s primary grossenrollment rate, for example, doubled in just 10 years, from 37 percent in1995 to about 74 percent in 2005. These improvement rates far exceedanything achieved by today’s developed countries at a similar stage ofdevelopment (World Bank 2005).
The larger cohorts of primary school finishers are increasing the pressureon secondary school enrollment. Between 1990 and 2003, the increasein the cohort size and the primary completion rate was reflected by anincrease of more than 160 percent in the number of primary schoolgraduates in Sub-Saharan Africa, adding significant pressure at higherlevels of education (World Bank 2006).
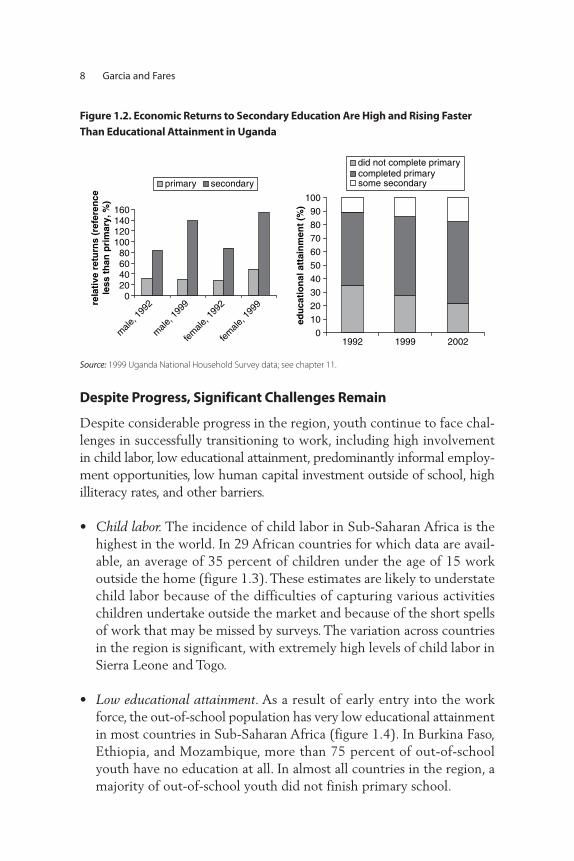
In Uganda the share of youth that completed primary school increasedwhile the share of those without primary education shrank between1992 and 2002; the share of youth with some secondary educationalmost doubled. With this increase, the economic returns to secondaryeducation rose, reflecting the significant demand for higher skills in theworkplace (figure 1.2). In 1999 males in Uganda with primary educa-tion earned 30 percent more and males with secondary educationearned 140 percent more than those who did not complete primaryschool. For females the returns were even greater: females with primaryeducation earned 49 percent more and females with secondary educa-tion earned 150 percent more than those who did not complete primaryschool (Vilhuber 2006). These figures indicate large increases over thealready high returns to education estimated with data from 1992.
Why Is It Important for Africa to Invest in Its Youth? 7
WB62_YALM_CH01 3/12/08 12:05 PM Page 7
Despite Progress, Significant Challenges Remain
Despite considerable progress in the region, youth continue to face chal-lenges in successfully transitioning to work, including high involvementin child labor, low educational attainment, predominantly informal employ-ment opportunities, low human capital investment outside of school, highilliteracy rates, and other barriers.
• Child labor. The incidence of child labor in Sub-Saharan Africa is thehighest in the world. In 29 African countries for which data are avail-able, an average of 35 percent of children under the age of 15 workoutside the home (figure 1.3). These estimates are likely to understatechild labor because of the difficulties of capturing various activitieschildren undertake outside the market and because of the short spellsof work that may be missed by surveys. The variation across countriesin the region is significant, with extremely high levels of child labor inSierra Leone and Togo.
• Low educational attainment. As a result of early entry into the workforce, the out-of-school population has very low educational attainmentin most countries in Sub-Saharan Africa (figure 1.4). In Burkina Faso,Ethiopia, and Mozambique, more than 75 percent of out-of-schoolyouth have no education at all. In almost all countries in the region, amajority of out-of-school youth did not finish primary school.
8 Garcia and Fares
Figure 1.2. Economic Returns to Secondary Education Are High and Rising Faster Than Educational Attainment in Uganda
Source: 1999 Uganda National Household Survey data; see chapter 11.
020406080
100120140160
male
, 199
2
male
, 199
9
female
, 199
2
female
, 199
9rela
tive
ret
urn
s (r
efer
ence
less
th
an p
rim
ary,
%)
primary secondary
did not complete primarycompleted primarysome secondary
0
10
20
30
40
50
60
70
80
90
100
1992
edu
cati
on
al a
ttai
nm
ent
(%)
1999 2002
WB62_YALM_CH01 3/12/08 12:05 PM Page 8

Educational attainment figures tell only part of the story, becausethey fail to capture the low quality of education. In several countriesless than half of women 15–24 with some primary schooling can reada simple sentence. In Namibia more than 80 percent of children finishprimary school, but less than 20 percent master the material covered.(See figure 1.5.)
• Predominantly informal employment creation. The incidence of self-employment among youth is high (figure 1.6). In some countries,including Burundi, The Gambia, and Zambia, almost all rural youth
Why Is It Important for Africa to Invest in Its Youth? 9
Figure 1.3. Too Many Children Are Working in Many Sub-Saharan African Countries
Source: Fares and Raju 2006.
Figure 1.4. The Level of Education among Out-of-School Youth in Africa Is Low
81.9
46.6
26.2
56.6
80.4
65.1
7.7 0.918.5
76.3
5.621.4
13.1
11.5
43.1
44
21.1
9.6
9.1
36.8
61.1
16.7
12
48.6
30.8
010203040506070
per
cen
t
8090
100
São To
mé
and
Princip
eUga
nda
Zambia
50.9
Burkin
a Fa
so
Burun
di
Camer
oon
Côte
d'Ivo
ire
Ethiop
ia
The G
ambia
Kenya
Mad
agas
car
Mala
wi
Moz
ambiq
ue
no education did not complete primarycompleted primarycompleted secondary or higher
Source: Understanding Children’s Work calculations based on World Bank Standard Files and Standard Indicatorsdatasets; see chapter 7 in UN (2005).
01020304050607080
Sierra
Leo
neTo
goCha
d
Guinea
-Biss
au
Burkin
a Fa
so
Ethiop
ia
Guinea
Comor
os
Côte
d’Ivo
ire
Tanz
ania
Congo
, Dem
. Rep
. of
Burun
di
Seneg
al
Rwanda
Leso
tho
Ghana
South
Afri
ca
Mad
agas
car
The G
ambiaM
ali
Sudan
Camer
oon
Namibi
a
Zambia
Ugand
a
Swazila
nd
Mala
wi
Kenya
inci
den
ce o
fec
on
om
ical
lyac
tive
ch
ildre
n (
%)
Centra
l Afri
can
Repub
lic
WB62_YALM_CH01 3/12/08 12:05 PM Page 9

employment is in the informal and self-employment sectors. In urbanareas some young people work in paid employment, but even therealmost 80 percent of youth in Cameroon and Kenya work in the infor-mal sector or are self-employed.
• Low investment in human capital. Investment in human capital outsideof school has lagged. In the formal sector, skill development schemescontinue to be supply-driven and disconnected from the demands ofthe labor market (Adams 2006). In the informal sector, traditionalapprenticeship is still the main mechanism for skill development fornew entrants. The strength of the traditional apprenticeship is its
10 Garcia and Fares
Figure 1.5. The Level of Literacy Varies Widely in Sub-Saharan Africa, with Higher-Income Countries Tending to Have Higher Literary Rates
0102030405060708090
100
6log GDP per capita
liter
acy
rate
am
on
g y
ou
th (
%)
6.5 7 7.5 8 8.5 9 9.5
Source: Fares and Raju 2006..
Figure 1.6. Most African Youth Work in the Informal Sector or Are Self-Employed
020406080
100
São T
omé
and
Princip
e
Mala
wi
Zambia
Moz
ambiq
ue
Burun
di
Burkin
a Fas
o
Kenya
Mad
agas
car
Ethiop
ia
Camer
oon
ruralurban
info
rmal
ly a
nd
self
-em
plo
yed
yo
uth
(%
)
The G
ambia
Source: Understanding Children’s Work calculations based on World Bank Standard Files and Standard Indicatorsdatasets; see chapter 7.
WB62_YALM_CH01 3/12/08 12:05 PM Page 10

practical orientation, self-regulation, and self-financing. It reachesthose who lack the educational requirement needed for formal train-ing and is generally cost-effective. Apprenticeship tends to be biasedagainst young women, however, and perpetuates the use of traditionaland outdated technologies (World Bank 2006).
• High illiteracy among 15–24-year-olds. Literacy rates vary widely inSub-Saharan Africa. Several countries, including Cape Verde, Côted’Ivoire, Kenya, South Africa, and Tanzania, have raised literacyrates above 90 percent; in others the literacy rate among youth isestimated to be as low as 30 percent. Literacy among youth increaseswith income (figure 1.5). Large variations even among countrieswith similar income levels point to the significant challenges coun-tries face in developing young people’s skills and integrating youthinto the work force.
• Barriers to youth entry into the labor market. In 2003 more than 18 millionyouth in Sub-Saharan Africa—21 percent of the work force—wereunemployed. This figure rose 32.5 percent between 1993 and 2003. Inrapidly growing urban areas, the level of youth unemployment is three tofour times that of adults. In other areas, a large proportion of the pop-ulation, particularly females, remains outside the labor market. Amongfemales who are not in school, more than 50 percent in Mozambique and60 percent in Ethiopia are outside the labor force (see chapter 5). Thesehigh estimates may be attributable to measurement problems, particu-larly for young girls and women working within their own households. InTanzania the majority of young females report that the main reason theyare not looking for work is their household responsibilities.
The Policy Response
A successful policy response to the challenge of youth employment restson three pillars: broadening opportunities for young people to accumulateand preserve human capital, increasing the capability of youth to takeadvantage of work opportunities, and providing a second chance, so thatno one is left behind.
Broadening opportunities to acquire human capital is essential tocontinue the progress already made on primary education. More needsto be done to increase access to postprimary education and enhancethe quality of education. The challenge in the labor market is to create
Why Is It Important for Africa to Invest in Its Youth? 11
WB62_YALM_CH01 3/12/08 12:05 PM Page 11

jobs that allow youth to protect and continue to develop their humancapital. Beyond schools, youth need access to skill developmentthrough apprenticeship schemes, both formal and informal, and voca-tional education driven by the needs in the labor market. The large stockof low-skilled youth (child laborers, school drop-outs, and former soldiers)facing difficulties accessing the labor market calls for a system of secondchances to reintegrate youth into the work force. The costs of failureare tremendous.
Broadening Opportunities in the Labor Market Broadening opportunities in the labor market for youth not only allowsyoung people to put the skills acquired in school to use, it also helpsensure that they continue to acquire and develop the skills needed to earna good livelihood. Because youth tend to learn most in their early years ofwork experience, the difficulties they face entering employment can leadto deterioration in their human capital and the loss of early investment inskill development—with long-lasting effects on their future work.
Economic growth and general job creation will expand the opportu-nities for youth to find work. In Ethiopia the estimated youth employmentelasticity of demand is positive, exceeding one in several instances (figure1.7). But general policies will not be sufficient to smooth the transition towork, because market and policy failures limit young people’s ability totake advantage of opportunities (see chapter 6).The demographic pressure
12 Garcia and Fares
Figure 1.7. Less-Skilled Youth Are Most Vulnerable to Changes in the Supply of andDemand for Labor in Ethiopia
–6
–5
–4
–3
–2
–1
0
1
2
3
neverattendedschool
primary orless
lowersecondary
(notcompleted)
lowersecondary
highereducation
youth educational attainment
adult employment ratio (demand) share of population (supply)
esti
mat
ed e
mp
loym
ent
elas
tici
ty o
f d
eman
d/s
up
ply
Source: World Bank calculations, based on chapter 9 in this report.
WB62_YALM_CH01 3/12/08 12:05 PM Page 12

from the large youth cohort entering the labor market will adversely affectyouth employment in Africa. Policies need to ensure that demand will off-set these pressures and allow the market to absorb these new cohorts intoproductive employment.
Increasing the Capability of Youth to Take Advantage of Work OpportunitiesIncreasing youth capability starts with providing young men and womenwith the relevant skills and information they need to enter work. Becausemany youth start work too early, they do not have the chance to accumulatethe minimum level of human capital needed to be well prepared in theirtransition to the labor market. In Ethiopia less-skilled youth are much morevulnerable than other youth to fluctuations in economic conditions and tosupply pressures from changes in the size of the youth cohort (figure 1.7).Improving their skills, in school and beyond, is necessary to protect themfrom supply and demand shocks.
Youth need to be empowered so they can work for themselves andcreate jobs for others. Empowering them to do so requires improving thebusiness climate and increasing youth access to credit and information.
Giving Youth a Second ChanceMany youth in Sub-Saharan Africa need a second chance. Weather,economic, and political fluctuations are common, and youth are mostvulnerable to these shocks. Many young people are infected with HIV;others are AIDS orphans. Because youth experiment early on in theircareers, they are more mobile and more likely to change jobs or residencethan other workers. But doing so involves risks. Giving youth a secondchance will permit them to better manage these risks, allowing them torecover from shocks and move to more productive opportunities.
Second-chance opportunities are particularly important for the estimated95 million unskilled youth in Africa who are out of school and eitherunemployed or underemployed.2 Governments everywhere in Africa areconsidering providing them with a second chance, through well-targetedtraining programs or direct employment creation. Some countries areimplementing short-term interventions needed as a bridge response.Long-term policies that increase the opportunities and the capability ofyouth are also taking shape in some countries. With almost half ofAfrica’s youth in need of second-chance opportunities, these policiesneed to be a priority.
Why Is It Important for Africa to Invest in Its Youth? 13
WB62_YALM_CH01 3/12/08 12:05 PM Page 13

Notes
1. The UN World Population Prospects projects that Sub-Saharan Africa will havemore youth than any other region by 2050. Projections over long horizons arevery uncertain and unreliable, however.
2. This estimate is based on the assumption that the average share of unskilledyouth in Sub-Saharan Africa is equal to the estimated average share of unskilledyouth in the 13 countries with available data on educational attainment.
14 Garcia and Fares
WB62_YALM_CH01 3/12/08 12:05 PM Page 14

Africa’s youth follow two paths in their transitions to working life. Somego to work directly, without benefit of formal schooling. Others join thework force after spending time in the formal school system.
A substantial proportion of young people in most Sub-SaharanAfrican countries never enter school, moving directly into the laborforce. The incidence of child labor in Sub-Saharan Africa is the highestin the world. In 29 African countries for which data are available, anaverage of 35 percent of children under the age of 15 work (Fares andRaju 2006). Early exposure to the job market in childhood or earlyadolescence can have a strong negative impact on future labor marketexperience and earning potential. Today’s child laborers will representthe weakest part of tomorrow’s adult labor force.
Africans who transition from school to work experience very long peri-ods of inactivity, implying significant labor market entry problems. In 8 ofthe 13 countries reviewed (Cameroon, Ethiopia, The Gambia, Kenya,Malawi, Mozambique, São Tomé and Principe, and Zambia), young peopleface about five years of inactivity before finding work; youth in Ugandaare inactive for more than three years on average. The transition durationis just one year in Côte d’Ivoire and almost seven years in Mozambique.These large differences indicate that the vulnerability of young people tounsuccessful transition varies greatly across countries.
C H A P T E R 2
Transitions to Working Life for Africa’s Youth
Marito Garcia and Jean Fares
15
WB62_YALM_CH02 3/12/08 12:06 PM Page 15

School nonentrants are a great policy concern because of their vul-nerability to undesirable transition outcomes. School nonentrants areamong the groups most vulnerable to child labor, therefore, finding sat-isfactory employment as adults cannot be separated from the issue ofchild labor.
The size of the group of school nonentrants varies widely across coun-tries. In one broad group of countries, at least 90 percent of childrenattend school for at least some period of time. In a second group of coun-tries, the percentage of children and youth not transiting through theschool system is much higher, ranging from 17 percent in Cameroon to70 percent in Burkina Faso. In 5 of the 13 countries examined in thisreport, more than 40 percent of 13-year-olds are working (table 2.1). InBurkina Faso and Uganda, more than 63 percent of 10-year-olds are outof school and working.
The average age at first job for children never attending school variesgreatly across countries. In Kenya children begin work at about 15; inEthiopia, Mozambique, and São Tomé and Principe children begin workat 16–17. In contrast, children begin work at about 8 years old in BurkinaFaso and at 10 in Burundi. In Zambia about 23 percent of children arealready working by age 10, and like Burundi, 42 percent are working bythe time they reach 13.
Of the world’s 250 million child workers, one-third live in Africa.Africa has the highest incidence of child labor in the world, and it hasmore child workers than any other region of the world. Twenty-fivepercent of child workers ages 5–14 live in Africa—more than in Asia
16 Garcia and Fares
Table 2.1. Age of First Job and Percentage of Children Working in Selected Countries
Age at Percentage of Percentage of Percentage of Country first job 10-year-olds working 12-year-olds working 13-year-olds working
Burkina Faso 8.4 63.6 66.0 68.3Burundi 10.2 22.5 35.5 42.2Cameroon 11.2 32.7 30.6 32.1Côte d’Ivoire 11.5 13.7 10.1 8.9Ethiopia 16.5 15.4 13.7 17.0Kenya 14.8 8.2 16.4 17.5Mozambique 17.1 3.9 6.7 13.2São Tomé and
Principe 16.3 9.1 10.8 13.5Uganda 13.8 63.6 66.0 68.3Zambia 14.5 22.5 35.5 42.2
Source: Understanding Children’s Work calculations based on World Bank Standard Files and Standard Indicatorsdatasets; see chapter 7.
WB62_YALM_CH02 3/12/08 12:06 PM Page 16
(18.7 percent) or Latin America (17.0 percent). Child labor has beendeclining everywhere in the world but Africa (ILO 2006). This trend islinked to a combination of factors, including economic decline, war,famine, and HIV/AIDS.
In West Africa the need for children to find work has led to childmigration to Benin. Eight percent of children 6–16 in West Africa arereported to have left their households to work in Benin. Children whoare orphans or in foster care are more likely than other children to work(Kielland and Tovo 2006). Wars, famine, and the spread of HIV/AIDS inSub-Saharan Africa have increased the number of orphans, potentiallyincreasing the number of child workers.
The incidence of child labor poses an enormous challenge in Sub-Saharan Africa. Working can have deleterious effects on children’s health,education, and moral well-being, with effects that persist over the lifecycle(Bhalotra 2003).
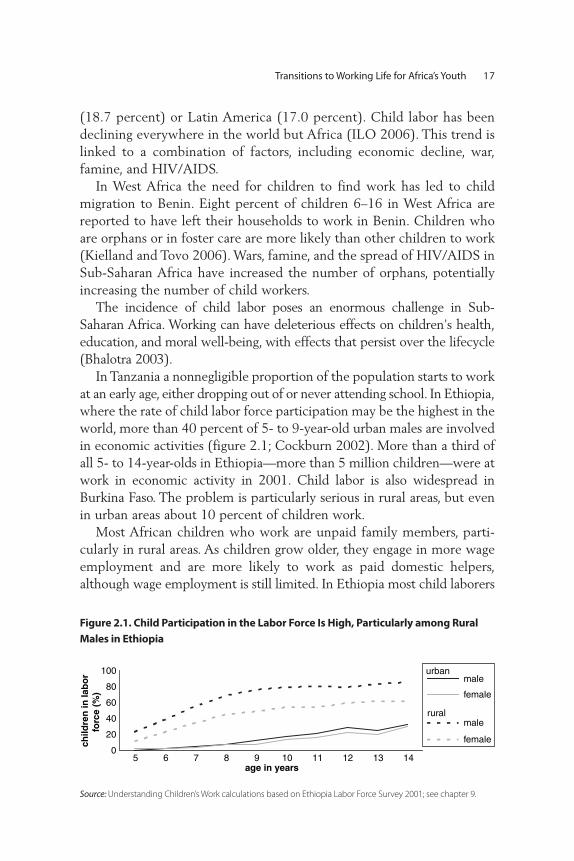
In Tanzania a nonnegligible proportion of the population starts to workat an early age, either dropping out of or never attending school. In Ethiopia,where the rate of child labor force participation may be the highest in theworld, more than 40 percent of 5- to 9-year-old urban males are involvedin economic activities (figure 2.1; Cockburn 2002). More than a third ofall 5- to 14-year-olds in Ethiopia—more than 5 million children—were atwork in economic activity in 2001. Child labor is also widespread inBurkina Faso. The problem is particularly serious in rural areas, but evenin urban areas about 10 percent of children work.
Most African children who work are unpaid family members, parti-cularly in rural areas. As children grow older, they engage in more wageemployment and are more likely to work as paid domestic helpers,although wage employment is still limited. In Ethiopia most child laborers
Transitions to Working Life for Africa’s Youth 17
0
20
40
60
80
100
5age in years
male
female
male
female
urban
rural
child
ren
in la
bo
rfo
rce
(%)
6 7 8 9 10 11 12 13 14
Figure 2.1. Child Participation in the Labor Force Is High, Particularly among RuralMales in Ethiopia
Source: Understanding Children’s Work calculations based on Ethiopia Labor Force Survey 2001; see chapter 9.
WB62_YALM_CH02 3/12/08 12:06 PM Page 17

work in the agriculture sector (table 2.2). Urban children also work,many of them in the service sector. As they age, children move awayfrom agriculture into other sectors, such as services and manufacturing,although movement is more limited in rural than in urban areas.
Average hours worked differ by gender and location. Females and urbandwellers work fewer hours than males and rural workers.Younger childrenwork longer hours than older children, probably because they are morelikely to work as unpaid family workers. As children grow older and moveinto paid sectors, employers reduce the number of hours worked to levelsprofitable for them, taking into account the fact that children’s productiv-ity diminishes after a certain threshold.The hours of paid employment areusually less than the desired numbers of hours, especially among serviceworkers and paid agricultural workers (see chapter 9).
Poverty and Large Income Shocks Push Children into the Work Force
A wide body of literature examines child labor. Some studies find anonlinear relationship between child labor and household poverty inAfrica (Andvig 2000). This relation is explained by the fact that a house-hold needs to reach a certain level of assets to create employment oppor-tunities for children; the poorest households may lack sufficient assetsto create job opportunities. The incidence of child labor may thereforefirst increase with rising income and then decrease (Bhalotra andTzannatos 2002).
Other factors that may cause children to work are related to marketand institutional problems. Parents may make children work to replacelost income in bad times (Jacoby and Skoufias 1997). Children fromland-rich households are more likely to work than are children of smalllandowners or landless agricultural workers, because the marginal prod-uct of family labor increases with the level of assets or capital (Bhalotraand Heady 2000).
What causes children to go to work? How do changing economic con-ditions affect children’s labor participation? Examination of behavior inBurkina Faso holds some answers. Among children 12–14 in urban areas,labor force participation declines with per capita household income (table2.3). Gender also affects participation, with males 4.5 percentage pointsless likely than females to participate in the labor force (chapter 9). Laborforce participation is less sensitive to changes in income in households inwhich the head is more educated and more sensitive in households in
18 Garcia and Fares
WB62_YALM_CH02 3/12/08 12:06 PM Page 18

Tab
le 2
.2. T
ype
and
Sec
tor o
f Em
plo
ymen
t of C
hild
Wor
kers
by
Ag
e G
roup
, Gen
der
, an
d U
rban
-Rur
al L
ocat
ion
in E
thio
pia
Aver
age
Unp
aid
wee
kly
Age
Dom
estic
W
age
Self-
fam
ilyO
ther
wor
king
grou
pem
ploy
eeem
ploy
eeem
ploy
edw
orke
rem
ploy
men
tAg
ricul
ture
Man
ufac
turin
gSe
rvic
esc
Oth
erd
hour
s
5–9
Mal
e0.
11.
60.
797
.40.
299
.00.
20.
70.
238
.4Fe
mal
e 0.
20.
30.
898
.20.
496
.00.
72.
31.
032
.1U
rban
5.0
1.7
7.8
76.9
8.6
56.1
5.5
26.2
12.2
26.0
Rura
l0.
11.
10.
698
.00.
298
.40.
31.
00.
336
.2
10–1
4M
ale
0.5
4.6
2.0
92.5
0.5
94.9
0.6
3.7
0.8
34.1
Fem
ale
1.6
1.3
3.6
92.9
0.7
84.6
4.0
8.4
3.0
27.1
Urb
an10
.56.
015
.861
.46.
225
.311
.445
.417
.926
.3Ru
ral
0.4
3.1
1.9
94.3
0.3
94.4
1.5
3.4
0.8
31.6
Sour
ce:U
nder
stan
ding
Chi
ldre
n’s W
ork
calc
ulat
ions
bas
ed o
n Et
hiop
ia L
abor
For
ce S
urve
y 20
01.
a. P
erce
ntag
e di
strib
utio
n of
em
ploy
ed p
opul
atio
n in
eac
h ag
e gr
oup.
b.
Per
cent
age
dist
ribut
ion
of e
mpl
oyed
pop
ulat
ion
in e
ach
age
grou
p. S
ecto
r bre
akdo
wn
base
d on
ISIC
Rev
ision
3 if
info
rmat
ion
is a
vaila
ble.
c. S
ervi
ces
incl
ude
who
lesa
le a
nd re
tail
trad
e, h
otel
s an
d re
stau
rant
s, tr
ansp
ort,
finan
cial
inte
rmed
iatio
n, re
al e
stat
e, p
ublic
adm
inist
ratio
n, e
duca
tion,
hea
lth a
nd s
ocia
l wor
k, o
ther
com
mun
ityse
rvic
es, a
nd p
rivat
e ho
useh
old
serv
ices
.d.
Oth
er s
ecto
rs in
clud
e m
inin
g an
d qu
arry
ing;
ele
ctric
ity, g
as, a
nd w
ater
; con
stru
ctio
n; a
nd e
xtra
terr
itoria
l org
aniz
atio
ns.
19
Sect
or (%
)b
Wor
k m
odal
ity (%
)a
WB62_YALM_CH02 3/12/08 12:06 PM Page 19

Tab
le 2
.3. E
ffec
t of P
over
ty a
nd
Hou
seh
old
Inco
me
Shoc
ks o
n L
abor
For
ce P
arti
cip
atio
n o
f Urb
an D
wel
lers
Ag
es 1
2–14
in B
urki
na
Faso
Dep
ende
nt v
aria
ble:
Whe
ther
the
indi
vidu
al w
orks
or i
s un
empl
oyed
and
look
ing
for w
ork,
indi
vidu
als
age
12 to
14
livin
g in
urb
an a
reas
Mal
esFe
mal
es[1
][2
][3
][4
][5
][6
][7
][8
]
Hou
seho
ld in
com
e de
crea
sed
betw
een
0.04
50.
049
0.03
70.
121
0.05
30.
062
0.02
60.
060
surv
ey y
ear a
nd y
ear b
efor
e(0
.028
)(0
.029
)(0
.029
)(0
.046
)(0
.027
)(0
.032
)(0
.028
)(0
.044
)D
ecre
ase
in in
com
e ×
head
’s ed
ucat
ion
—–0
.005
——
—–0
.016
——
(0.0
03)
(0.0
22)
Dec
reas
e in
inco
me
×in
com
e in
—
—0.
077
——
—0.
275
—bo
ttom
qui
ntile
(0.0
86)
(0.1
16)
Dec
reas
e in
inco
me
×ho
useh
old
size
——
—–0
.007
——
—–0
.001
(0.0
03)
(0.0
03)
30–5
9 m
inut
es a
way
0.
031
0.03
10.
031
0.03
3–0
.024
–0.0
24–0
.020
–0.0
24fro
m e
lem
enta
ry s
choo
l(0
.042
)(0
.042
)(0
.042
)(0
.042
)(0
.040
)(0
.040
)(0
.040
)(0
.040
)60
+ m
inut
es a
way
0.00
80.
007
0.00
60.
000
0.44
60.
446
0.45
80.
446
from
ele
men
tary
sch
ool
(0.1
43)
(0.1
44)
(0.1
39)
(0.1
41)
(0.1
72)
(0.1
72)
(0.1
68)
(0.1
72)
30–5
9 m
inut
es a
way
0.03
10.
031
0.03
20.
030
0.01
50.
015
0.01
50.
015
from
sec
onda
ry s
choo
l(0
.031
)(0
.031
)(0
.031
)(0
.031
) (0
.030
)(0
.030
)(0
.030
)(0
.030
)60
+ m
inut
es a
way
0.06
10.
061
0.05
40.
065
0.04
90.
049
0.03
70.
050
from
sec
onda
ry s
choo
l(0
.061
)(0
.061
)(0
.061
)(0
.061
)(0
.063
)(0
.063
)(0
.061
)(0
.063
)N
1575
1575
1575
1575
1692
1692
1692
1692
Sour
ce: C
alcu
latio
ns b
ased
on
Surv
ey o
f Hou
seho
ld L
ivin
g St
anda
rds,
2003
; see
cha
pter
8.
Not
e: C
olum
ns 1
(mal
e) a
nd 5
(fem
ales
) rep
rese
nt th
e ba
se m
odel
. Var
iant
s of
the
mod
el a
re g
iven
in c
olum
ns 2
, 3, a
nd 4
for m
ales
and
6, 7
, and
8 fo
r fem
ales
sim
ulat
ing
incr
ease
or d
ecre
ase
in in
com
es.
— N
ot a
vaila
ble.
20
WB62_YALM_CH02 3/12/08 12:06 PM Page 20

Transitions to Working Life for Africa’s Youth 21
the bottom quintile of the income distribution. The effect is large forfemales, whose labor force participation increases 27.5 percentagepoints when household income drops (table 2.3). Similar results emergeif self-reported changes in income are used as the measure of householdwelfare.
The School-to-Work Transition of Africa’s Youth Is Long and Difficult
The transition from school to work is by no means a linear process, withindividuals leaving school once and for all before beginning their work-ing lives. For individuals who never re-enter school, the starting point ofthe transition is well defined. The end point of the transition is more dif-ficult to define. Individuals may experience periods of employment andperiods of unemployment; they may change jobs or possibly stay out ofwork permanently. Young people may take temporary jobs, work on thehousehold farm or in the family enterprise, or perform household choresfor lack of better work opportunities or for the potential return theseinitial work experiences provide in terms of future employment andincome prospects.
These problems are particularly relevant in developing countries, wherewomen’s labor force participation (at least in the market) is low and under-employment, self-employment, home production, and casual employmentare widespread. In addition, school-leaving time is endogenous and proba-bly influenced by expectations about the transition to work and the kindof job that will be obtained at the end of the transition.
Integrating the analysis of optimal school-leaving age with that ofemployment search and labor force participation provides a better under-standing of this transition period. To measure the school-to-work transi-tion, this report develops a new indicator, based on the difference betweenthe average school-leaving age and the average age of first entry intowork (annex 6A describes the features and limitations of this indicator).In the absence of the longitudinal data generally available in developedcountries, this study uses cross-sectional data to measure the length ofthe transition. Under appropriate assumptions, the available data allowthe parameters of interest to be identified.
The length of the school-to-work transition varies across countries(table 2.4). The average school-leaving age ranges from 15.9 years in SãoTomé and Principe to 19.0 years in Cameroon; the average age at firstjob ranges from 18.4 years in Côte d’Ivoire to 24.4 years in Malawi.
WB62_YALM_CH02 3/12/08 12:06 PM Page 21

22 Garcia and Fares
Table 2.4. Duration of the School-to-Work Transition in Selected Countries
Beginning point of End point oftransition transition
(average age of (average age of Length ofCountry dropping out of school) entry into work) transition (years)
Burkina Faso 17.1 18.6 1.5Burundi 18.8 20.7 1.9Cameroon 19.0 23.8 4.8Côte d’Ivoire 17.4 18.4 1.0Ethiopia 18.0 23.4 5.4Gambia, The 17.4 23.2 5.8Kenya 17.7 22.6 5.3Madagascar 17.2 19.0 1.8Malawi 18.8 24.4 5.6Mozambique 16.7 23.4 6.7São Tomé and
Principe 15.9 21.3 5.4Uganda 18.0 21.3 3.3Zambia 17.5 22.4 5.0
Source: Understanding Children’s Work calculations based on World Bank Standard Files and Standard Indicatorsdatasets for various years between 1994 and 2001; see chapter 7. Note: Estimated probabilities calculated on the basis of the age at which work participation rate is at its maxi-mum. Reference age group is 5–24 for all countries except Madagascar, for which the reference group is 10- to24-year-olds.
The total transition duration is just one year in Côte d’Ivoire and almostseven years in Mozambique. These data suggest that the vulnerability ofyoung people to unsuccessful transition varies greatly by country. Thenew indicator can help identify the age range that policy should focus onin each country.
For all 13 countries, the starting point of the transition is relativelylate. This is due largely to the high average age of school entry and graderepetition in these countries, where the average grade 1 pupil is morethan 8 years old. The relatively high school-leaving age is particularlynoteworthy given low school enrollment rates in Sub-Saharan Africa. InBurkina Faso, for example, at age 17.1 years, the average age of dropout,just 15 percent of the cohort is in school (figure 2.2). The late averageschool-leaving age suggests the importance of the selection process asso-ciated with initial enrollment. Because the leaving age probably reflectsdelayed entry, intermittent attendance, and grade repetition, it is notindicative of a high level of human capital accumulation.
The average age of labor market entry varies more across countriesthan does the average age of leaving school, suggesting that the transition
WB62_YALM_CH02 3/12/08 12:06 PM Page 22

Transitions to Working Life for Africa’s Youth 23
from school to work is affected more by the process of finding a job thanby the age at which one leaves school. The transition to work appears todepend on both residence and gender as well as the interaction betweenthe two (table 2.5). Female youth tend to leave school earlier and transitto work more slowly than males. Rural youth tend to start the transitionearlier and find employment more quickly than urban youth.
Four patterns emerge from the data:
• Male youth stay in school longer (and perhaps reach higher educationalattainment) than female youth. They thus start the transition to worklater than females in both urban areas (except in Kenya) and rural areas(except in Kenya and Uganda).
• Urban youth have higher educational attainment than rural youth.The transition starts later in urban areas for both males (all countries)and females (all countries except São Tomé and Principe).
• Location appears to affect the length of the transition for female butnot male youth. Labor market entry takes longer for female youth inurban areas than in rural areas (except in Côte d’Ivoire and São Toméand Principe); there is no consistent pattern in length of transitionby location for male youth. The transition for female rural youth isparticularly short in Burkina Faso and Madagascar, at only one year.
• Gender appears to be related to the duration of the transition in urbanbut not rural areas. Urban males make the transition to work morequickly than urban females (except in Côte d’Ivoire). There is no con-sistent pattern by gender in rural areas.
4.9
30.7
91.2
18.0
10age in years
school enrollmentas a percentage of all childrenschool enrollmentas a percentage of children ever in school
average schoolleaving age
coh
ort
s in
sch
oo
l (%
)
24
6.3
24.5
23
7.1
27.9
22
10.2
35.9
21
8.3
36.8
20
11.1
39.1
19
12.9
46.9
18
14.9
55.0
17
17.0
56.4
16
19.4
64.5
15
27.5
75.6
14
27.5
81.1
13
30.2
85.1
12
34.1
88.2
11
Figure 2.2. The Late Age of School Leaving Is Not an Indication of High Educational Attainment in Burkina Faso
Source: Understanding Children’s Work calculations based on World Bank Standard Files and Standard Indicatorsdatasets.
WB62_YALM_CH02 3/12/08 12:06 PM Page 23

Tab
le 2
.5. L
eng
th a
nd
Tim
ing
of T
ran
siti
on fr
om S
choo
l to
Wor
k b
y G
end
er, R
esid
ence
, an
d C
ount
ry
Rura
l mal
esRu
ral f
emal
esU
rban
mal
esU
rban
fem
ales
Aver
age
Mea
nLe
ngth
Aver
age
Mea
nLe
ngth
Aver
age
Mea
nLe
ngth
Aver
age
Mea
nLe
ngth
age
leav
ing
age
atof
age
leav
ing
age
atof
age
leav
ing
age
atof
age
leav
ing
age
atof
Coun
try
scho
olfir
st jo
btr
ansi
tion
scho
olfir
st jo
btr
ansi
tion
scho
olfir
st jo
btr
ansi
tion
scho
olfir
st jo
btr
ansi
tion
Burk
ina
Faso
17.2
20.7
2.2
15.2
15.0
1.1
17.3
20.7
2.0
15.9
17.0
3.3
Buru
ndi
19.0
24.4
1.0
17.0
17.0
3.0
20.0
24.5
3.2
17.4
19.3
4.8
Cam
eroo
n19
.826
.53.
619
.220
.43.
720
.025
.04.
319
.421
.86.
9Cô
te d
’Ivoi
re16
.918
.32.
316
.018
.23.
719
.020
.71.
617
.219
.01.
3Et
hiop
ia19
.021
.84.
417
.519
.52.
820
.023
.83.
418
.823
.84.
5G
ambi
a, T
he17
.923
.43.
415
.817
.42.
619
.224
.86.
218
.921
.66.
6Ke
nya
18.2
21.6
4.8
18.9
21.5
4.2
19.0
21.6
4.0
19.7
23.2
5.6
Mad
agas
car
17.7
20.0
1.5
16.0
16.0
1.0
18.5
20.5
2.2
16.7
17.2
2.3
Mal
awi
19.4
24.9
4.1
17.9
22.9
5.9
20.0
24.9
4.2
19.9
24.3
6.0
Moz
ambi
que
16.9
23.9
6.1
15.1
20.5
5.5
17.4
24.0
5.6
16.2
23.1
6.9
São
Tom
é an
d Pr
inci
pe17
.323
.24.
615
.822
.07.
217
.521
.04.
415
.819
.96.
7U
gand
a17
.6—
2.9
17.4
—3.
118
.1—
2.5
18.7
—4.
6Za
mbi
a18
.124
.33.
015
.919
.84.
018
.724
.45.
717
.021
.17.
4
Sour
ce:A
utho
r cal
cula
tions
bas
ed o
n W
orld
Ban
k St
anda
rd F
iles
and
Stan
dard
Indi
cato
rs d
atas
ets;
see
chap
ter 7
.N
ote:
Dat
a ar
e fro
m v
ario
us y
ears
bet
wee
n 19
94 a
nd 2
001.
—
Not
ava
ilabl
e.
24
WB62_YALM_CH02 3/12/08 12:06 PM Page 24

Transitions to Working Life for Africa’s Youth 25
The duration of the transition from school to work varies widely acrosscountries, and accounting for the differences is not easy. An initial exam-ination of some factors—gross domestic product (GDP) growth (a proxyfor the ability of the economy to absorb school leavers), income distri-bution, openness to trade (as proxied by the ratio of exports plus importsto GDP), and the share of industrial value added in total value added (aproxy for differences in the structure of national economies)—showedno significant results. Only GDP growth showed some correlations; allother factors were uncorrelated with the length of the transition, suggest-ing that factors specific to the youth labor market may be more impor-tant in determining transitions than macro differences. A more in-depthanalysis combining individual, household, and institutional characteristicswill be necessary to explain cross-country differences.
WB62_YALM_CH02 3/12/08 12:06 PM Page 25

WB62_YALM_CH02 3/12/08 12:06 PM Page 26

To craft policies that address youth-related issues, policy makers need tounderstand how Africans between the ages of 15 and 24 spend theirtime. Some youth are still in school, but by age 24 the majority have leftschool and begun to work. In Malawi 64 percent of 15- to 19-year-oldsare in school; by age 20 this proportion drops to 18 percent. By age 24most rural (but not urban) youth are already working and beginningto raise families. In Madagascar, for example, 72 percent of rural and37 percent of urban 24-year-olds are working (see chapter 7).
Not Many Youth Are in the Labor Market and Employed
Youth unemployment, the most common measure of youth labor marketstatus, varies significantly across countries, ranging from about 1 percentin Uganda to 15 percent in Mozambique.1 In Sub-Saharan Africawhether a young person has a job often determines whether his or herhousehold falls above the poverty threshold. This measure is included asan indicator for monitoring the United Nations (UN) MillenniumDevelopment Goal to “develop and implement strategies for decent andproductive work for youth.”
Unemployment can be captured by an unemployment ratio or anunemployment rate. Each measure has a slightly different implication.
C H A P T E R 3
How Do Africa’s Young PeopleSpend Their Time?
Marito Garcia and Jean Fares
27
WB62_YALM_CH03 3/12/08 12:07 PM Page 27

The youth unemployment rate (unemployment as proportion of theyouth in the labor force) does not provide a full description of the difficul-ties youth face in the labor market. In fact, in countries with widespreadpoverty, looking at the unemployment rate may be misleading, becausemost youth cannot afford to remain unemployed. Their difficulties in thelabor market may be better reflected by measures of the quality ofemployment or measures of underemployment.
The unemployment ratio (unemployment as a proportion of the totalyouth population) varies across countries. Youth unemployment isalmost nonexistent in Burundi, The Gambia, and Malawi, where lessthan 1.5 percent of all 15- to 24-year-olds are unemployed. In contrast,the unemployment ratio exceeds 9 percent in Cameroon, Côte d’Ivoire,Kenya, Mozambique, São Tomé and Principe, and Zambia. These levelsof unemployment are still relatively low, perhaps suggesting that unem-ployment is a poor measure of welfare in developing countries.
Unemployment as a proportion of the population is generally higherfor young adults (ages 20–24) than for teenagers (15–19)—not surpris-ingly, given that teenagers are more likely to be in school. Once in theworkforce, teenagers have a harder time than young adults findingemployment. Therefore, while the employment ratio is higher for youngadults than for teenagers (except in São Tomé and Principe), the unem-ployment rate of young adults is lower than that of teenagers (except inBurkina Faso, Burundi, and Malawi).
Unemployment measures understate the total extent of the youthunemployment problem, for several reasons. First, they fail to capturediscouraged workers. Second, and of particular relevance in Sub-SaharanAfrica, these measures fail to capture people who are too poor to beunemployed and who therefore must take up work regardless of its qual-ity or level of remuneration. Third, unemployment indicators do notcapture underemployment. According to the very broad definition ofemployment used in generating estimates of employment, anyone whois undertaking economic activity for an hour or more during the refer-ence week is considered employed, even if he or she is actively lookingfor additional work. Many young people in Sub-Saharan Africa who arecategorized as employed are working fewer hours than they would like.
The level of joblessness (defined as the sum of unemployed and inac-tive workers) is arguably a better measure of the youth employmentdisadvantage, as long as inactivity does not include home production.2
In contrast to unemployment, which is relatively low in some countries,
28 Garcia and Fares
WB62_YALM_CH03 3/12/08 12:07 PM Page 28

joblessness is high, reflecting the significant proportion of inactive youngpeople. Joblessness exceeds 20 percent in Cameroon, Ethiopia, TheGambia, Kenya, Malawi, Mozambique, and São Tomé and Principe; it isless than 10 percent in only one country in this study (Burundi). Thedriving indicator for joblessness is youth inactivity.
A Large Proportion of Youth Are “Inactive”
In a few countries, the proportion of young people working is high.Youth employment is 78 percent in Burkina Faso, 70 percent in Burundi,and 62 percent in Madagascar. But in most countries a large proportion ofyouth is inactive—they are neither in the labor force (employed or unem-ployed) nor in school.3 Youth inactivity is particularly high in Ethiopia, at59 percent, and Mozambique, at 45 percent. In 8 of the 13 countriesreviewed, at least 20 percent of youth are inactive.4
Inactivity appears to have an important gender dimension: in all 13countries, female youth are more likely to be inactive than their malecounterparts. Income does not appear to be correlated with inactivity:both Ethiopia and Madagascar are very poor countries, but the rate ofinactivity among youth in Ethiopia exceeds 50 percent while the rate inMadagascar is just 3 percent.
The data do not allow discouraged workers (people who have givenup looking for work or who never entered the labor market because ofmeager job prospects) to be distinguished from people involved innonwork activities or noneconomic work (fetching water and wood,cooking, taking care of children, keeping house). Most inactive youngpeople indicate spending time on noneconomic work, but so do youngpeople in the labor force; inactivity does not therefore necessarilyreflect a choice of domestic work over labor market involvement.
Many Young People Are in School
The percentage of youth (15–24) in school only (not also working) rangesfrom 11 percent in Burkina Faso to 42 percent in Kenya. Most of theseyouth belong to higher income groups and are pursuing secondary, post-secondary, or tertiary education.5
The proportion of young people in school varies widely across coun-tries, although it does not exceed 50 percent in any of the 13 countriesreviewed. Kenya and Malawi have the highest percentage of youth in
How Do Africa’s Young People Spend Their Time? 29
WB62_YALM_CH03 3/12/08 12:07 PM Page 29

school, while Burkina Faso and Ethiopia have the lowest (13.7 percentand 22.3 percent respectively). The low proportion of students in schooldoes not necessarily imply low school enrollment because many youthhave completed their education. There is, however, a correlation betweenthe proportion of in-school youth and school attainment in the coun-tries studied.
Education and employment do not appear to be complementarybecause a relatively small number of young people combine school andwork. This figure ranges from 2 percent in Cameroon to 10 percentin Uganda. This fact is surprising and may reflect the nature of thedata available.
Young Women Have Lower Rates of School Attainment, School Enrollment, and Employment Than Young MenGender differences in time use are stark (table 3.1). The percentage ofmales in school is more than twice that of females in Mozambique, andit is markedly higher in Côte d’Ivoire, Ethiopia, and The Gambia. In onlytwo countries, Madagascar and São Tomé and Principe, does female edu-cation participation approach that of males.
Females are overrepresented among inactive young people in mostcountries in Sub-Saharan Africa. This may reflect the fact that engage-ment in household activities, which are usually assigned to females, areclassified as inactivity.6
Male employment exceeds female employment in 9 of the 13 coun-tries reviewed (all but Burundi, The Gambia, Uganda, and Zambia),although the differences are not always large. There is no clear patternby gender in terms of unemployment. For example, only 14 percent ofwomen are employed in Ethiopia, while nearly 76 percent are employedin Burkina Faso. Three percent of Burundi women are inactive versus67 percent of Ethiopian women, despite similar levels of development(see table 3.1). Employment, unemployment, and inactivity rates formales also differ across countries. These large differences in levels ofinactivity suggest the need to look more closely at the definition of inac-tivity and to focus on country-specific solutions.
Gender differences in unemployment are noteworthy in five coun-tries (Côte d’Ivoire, Madagascar, Mozambique, São Tomé and Principe,and Zambia), but there is no systematic pattern in terms of labor marketadvantage. Females are more likely than males to be unemployed in Côted’Ivoire, Madagascar, and Mozambique, while males are more likely thanfemales to be unemployed in São Tomé and Principe and Zambia.
30 Garcia and Fares
WB62_YALM_CH03 3/12/08 12:07 PM Page 30

31
Tab
le 3
.1. T
ime
Use
am
ong
Mal
e an
d F
emal
e Yo
uth
in S
elec
ted
Cou
ntri
es(p
erce
nt)
Jobl
ess
Onl
y in
sch
ool
Onl
y w
orki
ngU
nem
ploy
edIn
activ
e(u
nem
ploy
ed +
inac
tive)
Coun
try
Mal
eFe
mal
eM
ale
Fem
ale
Mal
eFe
mal
eM
ale
Fem
ale
Mal
eFe
mal
e
Burk
ina
Faso
13.7
8.7
80.0
75.9
3.8
4.6
1.1
10.3
4.9
14.9
Buru
ndi
28.4
23.1
67.4
72.8
0.9
0.7
3.3
3.5
4.2
4.2
Cam
eroo
n36
.328
.445
.041
.013
.312
.02.
516
.915
.828
.9Cô
te d
’Ivoi
re33
.817
.849
.745
.28.
610
.57.
926
.516
.537
.0Et
hiop
ia22
.313
.725
.514
.33.
54.
448
.767
.652
.172
.1G
ambi
a, T
he
37.8
19.6
31.7
42.6
1.8
1.2
27.5
35.8
29.3
37.0
Keny
a48
.436
.023
.518
.310
.110
.818
.034
.928
.145
.7M
adag
asca
r25
.121
.564
.260
.75.
911
.81.
74.
47.
616
.2M
alaw
i54
.831
.523
.319
.82.
10.
819
.147
.821
.348
.6M
ozam
biqu
e26
.111
.227
.716
.012
.516
.832
.655
.845
.172
.6Sã
o To
mé
and
Prin
cipe
24.3
22.4
45.6
16.9
13.1
9.5
15.3
50.0
28.4
59.4
Uga
nda
38.6
29.7
41.8
54.3
1.0
0.5
3.8
10.7
4.8
11.2
Zam
bia
37.2
22.7
37.8
39.3
13.4
9.6
10.7
28.0
24.1
37.6
Sour
ce:U
nder
stan
ding
Chi
ldre
n’s W
ork
calc
ulat
ions
bas
ed o
n W
orld
Ban
k St
anda
rd F
iles
and
Stan
dard
Indi
cato
rs d
atas
ets;
see
chap
ter 7
.
WB62_YALM_CH03 3/12/08 12:07 PM Page 31

The proportion of females in school is similar across the 13 countries:the difference between the country with the highest enrollment and thecountry with the lowest enrollment is 27 percentage points. In contrast,the proportion of males in school varies widely, with a 41 percentage-pointdifference between the countries with the highest and lowest enrollments.
Rural Youth Are Less Likely Than Urban Youth to Be in SchoolYoung people in rural areas use their time very differently from theircounterparts in urban areas in all 13 countries (table 3.2). Urban youthenjoy greater educational opportunities, staying in school longer andjoining the labor force later than rural youth. Educational involvement ismuch higher for urban youth (except in Kenya) and employment muchlower (except in Ethiopia and Kenya).
Unemployment is more common among urban youth (except in SãoTomé and Principe), presumably because of the wage differentials betweenthe urban and rural sector. The difference in youth unemployment is verylarge in most countries: the unemployment ratio for urban young peopleis more than three times the ratio for rural young people in Burkina Faso,Burundi, Ethiopia, Mozambique, Uganda, and Zambia and twice the ratiofor rural young people in Cameroon, Kenya, and Madagascar. Rural youthunemployment is 2 percent or less in Burkina Faso, Burundi, Ethiopia,The Gambia, Malawi, and Uganda. These figures underscore the fact thatyouth unemployment is overwhelmingly an urban phenomenon in Sub-Saharan Africa.
There is no clear pattern by urban-rural location in terms of inactivity:rates of inactivity are higher among urban young people in eight coun-tries and lower in five.7 Differences across urban areas in terms of theproportion of youth in school are much smaller than in rural areas, anddifferences in employment are greater across rural areas than urbanareas. However, unemployment and inactivity vary across countries, withno location-specific bias.
Time Use Varies by Income Group
How does household income affect the ways that youth in Sub-SaharanAfrica spend their time? In most countries in the region, youth in house-holds with higher incomes are more likely to remain in school (figure3.1). An exception is Kenya, where school enrollment is lower amongyouth from the highest income quintile than it is among youth fromlower quintiles.
32 Garcia and Fares
WB62_YALM_CH03 3/12/08 12:07 PM Page 32

Tab
le 3
.2.
Tim
e U
se a
mon
g R
ural
an
d U
rban
You
th in
Sel
ecte
d C
ount
ries
(per
cent
)
Jobl
ess
Onl
y in
sch
ool
Onl
y w
orki
ngU
nem
ploy
edIn
activ
e(u
nem
ploy
ed +
inac
tive)
Coun
try
Rura
lU
rban
Rura
lU
rban
Rura
lU
rban
Rura
lU
rban
Rura
lU
rban
Burk
ina
Faso
4.3
34.8
89.6
36.6
1.3
14.5
3.9
13.2
5.2
27.8
Buru
ndi
23.3
58.6
73.9
14.8
0.1
11.6
2.7
15.0
2.7
26.6
Cam
eroo
n23
.748
.355
.220
.19.
518
.59.
211
.218
.729
.7Cô
te d
’Ivoi
re14
.934
.869
.128
.34.
114
.411
.922
.616
.037
.0Et
hiop
ia12
.146
.118
.426
.42.
013
.567
.514
.169
.627
.6G
ambi
a, T
he
20.5
37.0
56.0
16.9
0.8
2.3
21.1
43.3
21.9
45.5
Keny
a45
.427
.317
.236
.28.
319
.629
.116
.937
.436
.5M
adag
asca
r16
.939
.672
.337
.16.
216
.12.
25.
48.
321
.4M
alaw
i40
.555
.122
.314
.81.
22.
835
.726
.436
.929
.1M
ozam
biqu
e14
.929
.822
.020
.28.
436
.154
.312
.862
.748
.9Sã
o To
mé
and
Prin
cipe
14.7
29.3
35.4
28.4
15.3
8.6
33.7
31.8
49.1
40.3
Uga
nda
32.7
40.6
51.7
31.7
0.4
2.3
4.3
21.9
4.7
24.2
Zam
bia
25.4
35.8
53.1
16.6
5.8
19.8
14.8
27.4
20.7
47.3
Sour
ce: U
nder
stan
ding
Chi
ldre
n’s W
ork
calc
ulat
ions
bas
ed o
n W
orld
Ban
k St
anda
rd F
iles
and
Stan
dard
Indi
cato
rs d
atas
ets;
see
chap
ter 7
.
33
WB62_YALM_CH03 3/12/08 12:07 PM Page 33

Bu
rkin
a Fa
soB
uru
nd
i
0102030405060708090100
educ
atio
n
low
est q
uint
ilese
cond
qui
ntile
third
qui
ntile
four
th q
uint
ilehi
ghes
t qui
ntile
low
est q
uint
ilese
cond
qui
ntile
third
qui
ntile
four
th q
uint
ilehi
ghes
t qui
ntile
low
est q
uint
ilese
cond
qui
ntile
third
qui
ntile
four
th q
uint
ilehi
ghes
t qui
ntile
low
est q
uint
ilese
cond
qui
ntile
third
qui
ntile
four
th q
uint
ilehi
ghes
t qui
ntile
0102030405060708090100
Ug
and
aZ
amb
ia
0102030405060708090100
0102030405060708090100
time use (%)
time use (%) time use (%)
time use (%)
inac
tive
unem
ploy
men
tem
ploy
men
ted
ucat
ion
inac
tive
unem
ploy
men
tem
ploy
men
t
educ
atio
nin
activ
eun
empl
oym
ent
empl
oym
ent
educ
atio
nin
activ
eun
empl
oym
ent
empl
oym
ent
Fig
ure
3.1.
Tim
e U
se b
y In
com
e Q
uint
ile V
arie
s ac
ross
Cou
ntri
es
Sour
ce:U
nder
stan
ding
Chi
ldre
n’s W
ork
calc
ulat
ions
bas
ed o
n W
orld
Ban
k St
anda
rd F
iles
and
Stan
dard
Indi
cato
rs d
atas
ets;
see
chap
ter 7
.
34
WB62_YALM_CH03 3/12/08 12:07 PM Page 34

Tab
le 3
.3. T
ime
Use
am
ong
Tee
nag
ers
and
You
ng
Ad
ults
in S
elec
ted
Cou
ntri
es
(per
cent
)
Jobl
ess
Onl
y in
sch
ool
Onl
y w
orki
ngU
nem
ploy
edIn
activ
e(u
nem
ploy
ed +
inac
tive)
Coun
try
15–1
920
–24
15–1
920
–24
15–1
920
–24
15–1
920
–24
15–1
920
–24
Burk
ina
Faso
14.2
6.9
76.1
80.2
3.8
4.7
4.7
7.6
8.6
12.3
Buru
ndi
31.5
16.1
64.3
79.7
0.6
1.1
3.6
3.1
4.2
4.2
Cam
eroo
n43
.419
.333
.753
.811
.913
.57.
812
.219
.725
.7Cô
te d
’Ivoi
re34
.114
.439
.956
.89.
210
.016
.718
.726
.028
.7Et
hiop
ia25
.56.
313
.129
.73.
05.
558
.558
.561
.464
.0G
ambi
a, T
he
40.3
13.4
29.7
46.8
1.4
1.6
27.6
36.9
29.1
38.5
Keny
a64
.911
.210
.035
.38.
513
.216
.740
.325
.153
.5M
adag
asca
r36
.08.
549
.977
.07.
710
.42.
73.
510
.413
.9M
alaw
i64
.417
.68.
635
.70.
52.
526
.243
.826
.746
.3M
ozam
biqu
e28
.55.
611
.434
.214
.615
.044
.944
.759
.559
.6Sã
o To
mé
and
Prin
cipe
37.9
5.7
18.2
47.0
13.2
9.0
29.5
36.3
42.7
45.3
Uga
nda
47.3
14.5
33.0
70.6
0.4
1.2
6.5
8.6
6.9
9.8
Zam
bia
46.0
10.0
26.9
52.5
9.0
14.2
17.2
23.0
26.2
37.2
Sour
ce:U
nder
stan
ding
Chi
ldre
n’s W
ork
calc
ulat
ions
bas
ed o
n W
orld
Ban
k St
anda
rd F
iles
and
Stan
dard
Indi
cato
rs d
atas
ets;
see
chap
ter 7
.
35
WB62_YALM_CH03 3/12/08 12:07 PM Page 35

Cam
ero
on
0102030 time use (%) time use (%)405060708090100
0102030 time use (%) 405060708090100 0102030 time use (%) 405060708090100
15ag
e in
yea
rs
in e
duca
tion
only
empl
oyed
onl
yin
activ
eun
empl
oyed
in e
duca
tion
only
empl
oyed
onl
yin
activ
eun
empl
oyed
in e
duca
tion
only
empl
oyed
onl
yin
activ
eun
empl
oyed
in e
duca
tion
only
empl
oyed
onl
yin
activ
eun
empl
oyed
Eth
iop
ia
0102030405060708090100
1617
1819
2021
2223
2415
age
in y
ears
1617
1819
2021
2223
24
15ag
e in
yea
rs16
1718
1920
2122
2324
15ag
e in
yea
rs16
1718
1920
2122
2324
Cô
te d
’Ivo
ire
Mad
agas
car
Fig
ure
3.2.
Tim
e U
se b
y Pa
tter
ns
of Y
oun
g P
eop
le V
ary
acro
ss A
ge
Gro
ups
and
Cou
ntri
es
Sour
ce:U
nder
stan
ding
Chi
ldre
n’s W
ork
calc
ulat
ions
bas
ed o
n W
orld
Ban
k St
anda
rd F
iles
and
Stan
dard
Indi
cato
rs d
atas
ets;
see
chap
ter 7
.
36
WB62_YALM_CH03 3/12/08 12:07 PM Page 36

The proportion of the population that is working is lower amongyouth from households in higher income quintiles. Kenya is the excep-tion, with higher employment for youth from higher income quintiles.
Income and unemployment seem to be positively correlated. Thisresult is consistent with the notion that the poor cannot afford not towork and that as income rises, people can afford to spend time search-ing for a job. Alternatively, this correlation may simply reflect the levelof education.
Inactivity does not appear to be systematically correlated with income.In Kenya and Mozambique, inactivity falls in higher income quintiles,while in Burkina Faso, Burundi, and Uganda it rises.
Teenagers and Young Adults Use Their Time DifferentlyNot surprisingly, teenagers (15–19) and young adults (20–24) spend theirtime differently, with larger percentages of young adults in the labor force(employed or unemployed) (table 3.3).8 Age group differences are largestin Kenya and Malawi, where initial education enrollment is relatively high;they are smallest in Burkina Faso, Burundi, and Ethiopia, where initialschool enrollment is very low and the transition to work begins at an earlyage. In most countries the proportion of 15- to 19-year-olds in school islow, with more than half of all children either never having entered schoolor else dropping out before the age of 15.
Across countries, as age increases the percentage of people employedrises and the percentage of people in school falls (figure 3.2).Unemployment appears to remain relatively constant across age groups.In 11 of the 13 countries (except Cameroon and Madagascar), inactivitylevels exceed unemployment levels for all age groups. The patterns ofinactivity differ across countries, however. In Ethiopia, for example, inac-tivity rises until the age of 21 before falling, while in Côte d’Ivoire thelevel of inactivity remains virtually constant across age groups.
Notes
1. See chapter 7 for details.
2. Unlike unemployment, joblessness reflects both unemployed and discouragedworkers.
3. An employed person is one who is engaged in paid employment. This cate-gory includes employees and the self-employed. This category should includeunpaid family members who hold jobs in a market-oriented establishment,irrespective of the number of hours worked during a reference period.
How Do Africa’s Young People Spend Their Time? 37
WB62_YALM_CH03 3/12/08 12:07 PM Page 37

However, some countries set a minimum time criterion for including unpaidfamily labor among the employed. Usually, if a person works for more thanseven hours a day, he or she is considered employed. An unemployed personis a person who does not have work, is currently available for work, and isseeking work. An inactive person is a person who is neither in the labor force(employed or unemployed) nor in school.
4. Data in this section are drawn from chapter 7.
5. Data in this section are drawn from chapter 7.
6. Some forms of economic work, such as fetching water, are also included inthis category.
7. The issue of inactivity among youth requires an in-depth analysis that isbeyond the scope of this report. In rural areas, where service coverage is typi-cally less extensive, a large proportion of “inactive” young people may actuallybe performing chores such as fetching water and wood. In urban areas, wherethe burden of household chores is typically lower, discouraged workers mayconstitute a larger proportion of the inactive population.
8. The unemployment rate is actually higher for teenagers, because they aremore likely to be in school and therefore outside the labor force.
38 Garcia and Fares
WB62_YALM_CH03 3/12/08 12:07 PM Page 38

Policy makers almost everywhere recognize the benefit of education, andimproving education is at the forefront of their concerns, particularly indeveloping countries. Despite the positive returns to education, however,educational attainment remains low in most countries in the region.
While in general, higher education is associated with an easier transitionto work, for youth in Africa (and other regions), it does not always reduceunemployment. In some countries the unemployment rate among educatedyouth is very high. Over time, however, as youth gain experience, educationincreases the employment incidence and enhances occupational mobility.
How Does Education Affect Income?
The literature is large on returns to education in developed and developingcountries. Most estimates indicate a positive and significant effect ofyears of education on individual and household earnings. The estimatedeffects in Africa are in line with those observed in other regions. Newevidence suggests that returns increase with the level of education andthat returns to higher education have been rising.
According to conventional wisdom, given the low number of educatedpeople in Africa, demand should exceed supply, creating high returns to
C H A P T E R 4
The Effect of Education on Incomeand Employment
Marito Garcia and Jean Fares
39
WB62_YALM_CH04 3/12/08 12:07 PM Page 39

education. Simple ordinary least squares estimates of the returns to an extrayear of schooling range from 7 to 20 percent in Kenya, Nigeria, and SouthAfrica (see Knight, Sabot, and Hovey 1992 for Kenya; Aromolaran 2002for Nigeria; Mwabu and Schultz 1996 for South Africa).The average returnto an additional year of schooling in Sub-Saharan Africa is estimated atabout 12 percent (Psacharopoulos and Patrinos 2004).
How accurate are these estimates? Most studies of the returns to edu-cation in Africa use estimation methods that do not adequately deal withthe endogenous nature of the schooling decision. Of concern is the biasin the estimates due to unmeasured determinants that are correlatedwith both schooling and earnings.1 Some analyses for Burkina Faso andRwanda improve on simple ordinary least squares estimates by usingsemi-parametric forms, accounting for the endogenous choice of sectorof employment and correcting for selectivity (see Kalzianga 2002 forBurkina Faso; Lassibille and Tan 2005 for Rwanda). Even with such correc-tions, however, the estimated returns in these countries are still high.
Only a few studies have tried to deal with the endogenous nature ofschooling using the instrumental variables approach. Once these correc-tions are made, the evidence continues to show high returns to schoolingin Kenya, South Africa, and Tanzania (see Kahyarara and others 2004 onKenya and Tanzania; Dabalen 1998 on Kenya and South Africa). Somemethodological problems remain, however, because the validity of someof the instruments used (such as distance to school and parents’ education)has been questioned (Staiger and Stock 1997). Estimates made based onthe case studies of Burkina Faso and Uganda show positive returns toeducation, particularly for tertiary education, as well an increase in thesereturns over time (see chapters 8 and 11 in part II for full regressionresults for each country).
Returns to Education Are High and Increase with Years of EducationSimple ordinary least squares estimates of the relationship between edu-cation and earnings in Burkina Faso show that literacy has a very largeeffect on household income and that the correlation between averagehousehold income and average household educational attainment isstrong.2 The estimated annual return to education is 11.5 percent, withthe effect of one additional year of education rising as the household’seducation level increases (figure 4.1).
Two patterns are evident. First, urban households at all levels of educa-tion report higher earnings than rural households, with the urban-rural gapnarrowing at higher levels of education. Second, although the relationshipbetween education and income is very well approximated by a linear term
40 Garcia and Fares
WB62_YALM_CH04 3/12/08 12:07 PM Page 40

The Effect of Education on Income and Employment 41
in urban areas, in rural areas the return to schooling increases markedly forindividuals with some partial secondary education. (It may be, of course,that individuals with more education are systematically different fromthose with less education.)
Simple cross-sectional estimates overstate the true effect of house-hold education on household income. The use of instrumental variablescould mitigate the sources of bias in the estimates. But even after usinginstrumental variables, including the distance from primary and secondaryschool and a regional fixed effect, to mitigate the sources of bias, the rela-tionship between average household educational attainment and incomeremains strong.
Returns Have Risen over Time, Particularly for Secondary EducationTable 4.1 presents a simple estimation for the differences in income formales and females with primary education and those with more than pri-mary education in Uganda. The estimation is done separately for differentage groups in 1992 and 1999.The results reveal three important patterns:
• The returns to primary education are positive and significant for allage groups except people 40 and older.
• The returns to secondary education are large and exceed those toprimary education.
• The returns to primary education seem to have declined between 1992and 1999 while the returns to secondary education rose dramatically.Even after controlling for sources of endogeneity, returns to secondaryeducation remain large and significant.
11.5
11
10.5
eco
no
mic
ret
urn
to e
du
cati
on
(%
)
10
9.5
rural households
none partialprimary
completedprimary
partialsecondary
schooling
completedsecondary
post-secondary
urban households
Figure 4.1. Household Earnings Increase with Educational Attainment in Burkina Faso
Source: Authors’calculations; see chapter 8.
WB62_YALM_CH04 3/12/08 12:07 PM Page 41

Not all of the countries in Sub-Saharan Africa have enjoyed Uganda’shigh and increasing returns to education. In Ghana and Nigeria, the returnsto an additional year of education have been estimated to be as low as5 percent (Uwaifo 2005; Glewwe 1996). This may reflect the fact thatUganda experienced significant economic growth in this period whileNigeria suffered from economic stagnation.
How Does Education Affect Employment?
Much international evidence supports the notion that higher educationalattainment leads to better employment outcomes, such as higher wagesand lower unemployment. For youth, however, this relationship is notalways evident. In some countries in Sub-Saharan Africa, secondary andtertiary education are not associated with lower unemployment ratesamong youth (figure 4.2). Youth with secondary or tertiary education inBurundi, Cameroon, Côte d’Ivoire, Kenya, Madagascar, and Nigeria havehigher rates of unemployment than youth with lower educational attain-ments. Indeed, in 13 of the 14 countries studied, the rate of unemploymentis higher among youth with at least some schooling than among thosewith no schooling, even though a smaller proportion of school entrantsare in the labor force.
In Ethiopia the marginal effect of education on the probability of work-ing was estimated using a probit model of employment on a set of control
42 Garcia and Fares
Table 4.1. Effect of Primary and Secondary Education on Wages, by Age Group, 1992 and 1999, in Uganda
Primary SecondaryAge group Year education education
20–30 1992 0.554*** 0.789***(0.120) (0.119)
1999 0.071 0.876***(0.146) (0.147)
30–40 1992 0.394*** 0.997***(0.146) (0.145)
1999 0.396** 1.528***(0.158) (0.152)
40–50 1992 0.174 0.920***(0.159) (0.158)
1999 0.073 1.196***(0.182) (0.183)
Source: 1999 Uganda National Household Survey data; see chapter 11. Note: Standard errors are in parenthesis.**significant at 0.01 level; ***significant at 0.05 level.
WB62_YALM_CH04 3/12/08 12:07 PM Page 42

variables for urban and rural areas (the full regression results are presentedin chapter 9).The results reveal a negative relationship between educationand the employability of youth. One possible explanation for this unex-pected outcome is that the more educated youth are, the higher theirreservation wage and returns to job search. Better-educated youth maybe searching for work and not yet employed.
But there is also evidence of skill mismatches. In Ethiopia 21 percent ofwage job vacancies posted with employment services remained unfilledbetween 1997/98 and 2001/02. According to the Ministry of Labor andSocial Affairs, this can be attributed to a lack of qualified workers, toemployers’ desire for workers with substantial experience, and to the nega-tive attitude of job seekers toward certain jobs (in particular, unwillingnessto relocate from urban to rural areas).
With Time, More Education Improves Employment OutcomesControlling for experience, urban men in Tanzania with the highest level ofeducation are 26 percentage points more likely to be employed than urbanmen with no education. Similar results emerge for other outcome variables.Unemployment shows some positive association with education when con-trols for experience are included, but the differences are not statistically
The Effect of Education on Income and Employment 43
–10%
10%
20%
30%
40%
50%
60%
70%
80%
Burkin
a Fa
so
Burun
di
Camer
oon
Ethiop
ia
Ghana
Kenya
Mad
agas
car
Mala
wi
Moz
ambiq
ue
Nigeria
Côte
d’Ivo
ire
São To
mé
and
Princip
e
Ugand
a
Zambia
no education primary secondary tertiary
un
emp
loym
ent
rate
Figure 4.2. More Education Does Not Always Reduce the Rate of Unemploymentamong Youth
Source: World Bank calculations using basic data from various household surveys from each country; see chapter 7.
WB62_YALM_CH04 3/12/08 12:07 PM Page 43

significant. Individuals with tertiary education are about 41 percentagepoints more likely to be active than those with no education, after control-ling for their potential experience in the labor market.
Except for the very few youth who complete secondary education, mostworkers in Sub-Saharan Africa enter the labor force in similar occupations;education appears to have little effect. Youth who lack skills get perma-nently stuck in dead-end jobs. In contrast, those with more educationmake a more rapid transition to better occupations (evidence on upwardoccupational mobility in Burkina Faso is presented in chapter 8). Educationthus has a positive effect, even though the port of entry is similar for thevast majority of workers.
Technical and Vocational Training Could Ease the Transition to WorkIncreasing attention has been given to technical and vocational training inEthiopia as a way to increase the employment and employability of youth.In 2003 about 8,000 youth—about 2 percent of all youth—indicated thatthey had undertaken training. What impact did this training have?
The effects of job training were estimated using a model that conditionson observable variables, including educational level, control variables, anda dummy for training. The results show that training increased the proba-bility of being employed by about 25 percent in urban areas and 20 percentin rural areas.3
What Effect Does Education Have on Development?
Education also has an impact on development, including health outcomes.HIV prevalence in Zambia, for example, is much lower among 15- to19-year-olds with secondary and tertiary education than it is among youthwith less education (Coombe and Kelly 2001). Several studies based ontheoretical developments in endogenous growth provide evidence of therole education plays in improving household welfare and society at large.Education and the accumulation of human capital create externalities—that is, they benefit not only the direct beneficiaries but other people aswell (Ray 1998). Investing in education is associated with higher growthrates (Mankiw, Romer, and Weil 1992).
What Keeps Educational Attainment Low?
Despite the important returns to education, educational attainmentremains low in most countries in Sub-Saharan Africa (see chapter 3). For
44 Garcia and Fares
WB62_YALM_CH04 3/12/08 12:07 PM Page 44

the region as a whole, 18 percent of young men and 27 percent of youngwomen are illiterate, making Sub-Saharan Africa the second-most illiterateregion in the world, after Asia.4 In some countries in the region, a largeproportion of children never went to school (see chapter 2). Evidencefrom the case studies shows that low parental education, low householdincome, and lack of access to school are severe constraints to schoolenrollment in Burkina Faso and Tanzania.
Among 10- to 14-year-olds in Burkina Faso, 70 percent of girls and60 percent of boys have no formal education. In Ethiopia, which has thelowest educational attainment in the world, 6.6 million people neverattended school. Three-quarters of youth 15–24 possess only a primaryeducation or less; just 28 percent of 6- to 9-year-olds and a little more thanhalf of 10- to 14-year-olds are enrolled in school. Only about 40 percent ofEthiopian children complete primary education and just 13 percent areenrolled in secondary education. The average adult man in Ethiopiacompleted only 1.8 grades and the average woman just 0.88 grades, andjust 5 percent of the population has secondary or higher education.Similar results are found in the other country studies. In Tanzania, forexample, more than 15 percent of rural youth lack any education.
Microanalyses of Burkina Faso and Tanzania identify three main deter-minants of school enrollment: household income, the education of thehousehold head, and access to education, as measured by distance toschool. In Tanzania the education of the household head increases the prob-ability of school enrollment for both males and females in both urban andrural areas (table 4.2). One year of additional education of the householdhead increases the likelihood of a son enrolling in school by 5 percentagepoints in urban areas.
In Burkina Faso enrollment in primary education is correlated withhaving a household head with at least primary education, but there is nostrong relationship between enrollment at 15–18 (usually secondaryeducation) and the level of education of the household head. This pat-tern strongly suggests that educational attainment is highly correlatedacross generations within households. Low intergenerational mobilitycreates a poverty trap because education is a strong predictor of incomeand vice versa.
Other studies on Africa point to similar results. Parental educationappears to have a positive effect on children’s school attendance and anegative effect on the probability and extent of child labor (Bhalotra andTzannatos 2002). Children of less-educated parents are more likely to goto work than to school, and these children grow up to be less-educated
The Effect of Education on Income and Employment 45
WB62_YALM_CH04 3/12/08 12:07 PM Page 45

parents who send their own children to work (Ilahi, Orazem, andSedlacek 2000; Emerson and de Souza 2000). There is also evidence thatschool attendance rates are higher when the expected benefits of attendingschool increase (Bedi and Marshall 2001).
The employment status of the household head and household incomeare also important determinants of schooling for children. Householdincome quintile is negatively correlated with schooling, though the effectsare sometimes modest and occur only at higher levels of education inBurkina Faso. Econometric analysis shows that household income quintilesaffect enrollment of youth who are in secondary or tertiary school.5
Income shocks are also important determinants of schooling. Childrenin Burkina Faso from households that experience a negative incomeshock are less likely than other children to enroll in school. The effect isstrongest for households in the lowest income quintile. In Tanzania theadult employment rate is negatively correlated with schooling, suggestingthat as adults face more problems in the labor market, school enrollmentof their children also declines.
An important factor behind school enrollment and attainment inBurkina Faso is the time it takes to get to school (primary or secondary).6
School enrollment for both males and females 15–18 decreases as thetime it takes to get to school increases. The estimated effects were negativeand significant in 1993, 1999, and 2003 (chapter 8).The effect of distance
46 Garcia and Fares
Table 4.2. Determinants of Schooling for Urban and Rural Youth by Gender in Tanzania
Urban RuralVariable Male Female Male Female
Adult employment rate –0.337 –0.045 –0.217 0.019(0.258) (0.104) (0.181) (0.165)
Percentage of youth in the population 0.003 0.076 0.128 –0.123(0.136) (0.085) (0.134) (0.112)
Time to school 0.111 0.142** –0.010 –0.041***(0.068) (0.063) (0.008) (0.006)
Training –0.171*** –0.083*** –0.058 –0.063*(0.035) (0.029) (0.037) (0.038)
Migrant –0.060*** –0.076*** 0.032 –0.001(0.022) (0.017) (0.021) (0.017)
Education of household head 0.058*** 0.025*** 0.023*** 0.017***(0.005) (0.004) (0.003) (0.003)
Number of observations 1,743 2,360 3,939 3,947
Source: Integrated Labor Force Survey 2000/01; see chapter 10.Note: Standard errors are in parenthesis.*significant at 0.10 level; **significant at 0.05 level; ***significant at 0.01 level.
WB62_YALM_CH04 3/12/08 12:07 PM Page 46

to school on enrollment in Tanzania is mixed. It is not significant for youngboys. For girls it increases the likelihood of enrollment in urban areas andreduces it in rural areas.
HIV/AIDS is also forcing children to leave school. Many youth areinfected with HIV, especially in eastern and southern Africa, where neglectof millions of children whose family members have HIV/AIDS is fuelingschool dropout.These children, especially those who are orphaned, enterthe labor force very early and are more likely to be exploited or abused.Dropping out of school exposes these children to a lifelong cycle ofpoverty and abuse.
Recent surveys from Tanzania show that orphans are more likely thanother children to withdraw from school (Subbarao and Koury 2004) andthat children suffer de facto discrimination in access to education from themoment HIV/AIDS affects their family. These children often leave schoolto perform household chores or grieve and are unable to return for lackof money to pay for uniforms, books, or other school-related items.
Notes
1. Griliches (1977) was one of the first to examine the bias in ordinary leastsquares estimates.
2. Most analyses of returns to education use wages and salaries of individuals.The microanalysis of Burkina Faso used household income because of the smallproportion of Burkinabes reporting earnings from formal paid employment.Using individual measures of earnings would have decreased the sample sizedramatically, limiting the representativeness of the sample.
3. Because this method does not control for the selection process into training,the estimates should be interpreted as the average treatment effect on thosewho went through the training rather than the average effect on the populationas a whole.
4. Several countries, including Kenya, Tanzania, and Uganda, plan to reduce theilliteracy rate in the labor force to less than 10 percent by 2015. Côte d’Ivoireand Ethiopia expect to reduce the illiteracy rate among working women to30 percent by 2015.
5. This finding of effects at only higher levels of education for the lowest incomequintiles in Burkina Faso may not apply to other Sub-Saharan African countries.The effects of household income on schooling are typically significant andpositive at all levels.
6. For evidence on the effect of distance to school in developed countries, seeCard (1995a). For evidence from developing countries, see Muraközy andHalpern (2005).
The Effect of Education on Income and Employment 47
WB62_YALM_CH04 3/12/08 12:07 PM Page 47

WB62_YALM_CH04 3/12/08 12:07 PM Page 48

By the age of 24, most youth in Africa have left school and started towork. The proportion of youth at work versus those still in school rangeswidely across countries (see chapter 3). In Kenya and Malawi, more than40 percent of youth (15–24) remain in school, and more youth are inschool than at work. In Burkina Faso and Burundi, more than 70 percentof youth work.
What Makes the Transition to Work Difficult for Youth?
The lack of strong employment creation in several countries in Sub-Saharan Africa has limited opportunities for youth in their transition towork, particularly in the wage sector. Strong labor demand is necessaryto broaden youth opportunities, but it is not sufficient, because of severalspecial challenges youth face:
• The decline in demand for labor in Africa is disproportionatelyaffecting young people.
• A large youth cohort is adding pressure to the labor market of new entrants.
• Internal migration is leading to higher urban unemployment among youth.
C H A P T E R 5
Working in Bad Jobs or NotWorking at All
Marito Garcia and Jean Fares
49
WB62_YALM_CH05 3/12/08 12:08 PM Page 49

• Market failures have a disproportionate impact on youth, particu-larly females.
• Lack of education is making the low skilled most vulnerable.
Demand for Labor Has Not Kept Up with SupplyStructural adjustment, the global recession, and changes in technology havereduced the demand for labor. Most of the African countries adoptingstructural adjustment measures have retrenched large numbers of publicsector workers, increasing unemployment. Changes in the economic envi-ronment and in the demand for labor have also had a negative impact onyouth employment opportunities. Technology has increased the demandfor higher-order skills and reduced the need for unskilled labor. All of thesechanges have had a disproportionately large effect on young people.
Rapid Population Growth Has Increased the Number of Youth Entering the Job MarketInternational evidence suggests that increases in the relative cohort sizehave an adverse effect on youth employment outcomes (see chapter 1). InTanzania the increase in the size of the youth cohort has increased the inci-dence of unemployment among urban youth, particularly among urbanfemales (tables 5.1 and 5.2). In Ethiopia, the size of the youth cohort hassignificantly reduced the probability of their employment (table 5.3).
The number of people looking for work in Sub-Saharan Africa is expe-cted to increase by 28 percent in the next 15 years, adding about 30 millionpeople to the pool of job seekers. The increase in job seekers may make it
50 Garcia and Fares
Table 5.1. Determinants of Urban and Rural Youth Unemployment in Tanzania
Urban Rural
Variable Male Female Male Female
Adult employment rate –0.019 0.039 –0.334 –0.199(0.233) (0.115) (0.088) (0.087)
Percentage of youth in total 0.039 0.240 0.020 –0.030population (0.123) (0.094) (0.065) (0.059)
Migrant 0.011 –0.010 0.026 –0.011(0.020) (0.019) (0.010) (0.009)
Education of household head –0.021 –0.016 –0.001 –0.002(0.004) (0.004) (0.002) (0.001)
Number of observations 1,964 2,360 3,939 3,947
Source: Integrated Labor Force Survey 2000/01; see chapter 10.Note: Figures are probit estimates based on 10- to 24-year-olds, using the regionwide definition of local labormarket. Standard errors are in parentheses.
WB62_YALM_CH05 3/12/08 12:08 PM Page 50
Working in Bad Jobs or Not Working at All 51
Table 5.2. Determinants of Urban and Rural Youth Inactivity in Tanzania
Urban Rural
Variable Male Female Male Female
Adult employment rate –0.052 –0.325 –0.085 –0.137(0.172) (0.100) (0.095) (0.099)
Percentage of youth in total 0.118 0.062 –0.185 0.027population (0.091) (0.082) (0.070) (0.067)
Migrant 0.047 –0.002 –0.000 0.016(0.015) (0.016) (0.011) (0.010)
Education of household head –0.020 –0.009 –0.000 0.001(0.003) (0.004) (0.002) (0.002)
Number of observations 1,964 2,360 3,939 3,947
Source: Integrated Labor Force Survey 2000/01; see chapter 10.Note: Figures are probit estimates based on 10- to 24-year-olds, using the regionwide definition of local labormarket. Standard errors are in parentheses.
Table 5.3. Employment Response to Demographic and Economic Shocks for Femalesby Location and Education in Ethiopia
Has Has some CompletedNever primary lower lower Has some
attended education secondary secondary higherItem school or less education school education
UrbanFemale –0.149 –0.203 –0.222 –0.181 –0.141
(–3.62) (–4.08) (–5.8) (–4.21) (–10.73)Adult employment ratio 2.341 1.349 1.369 1.734 1.023
(2.71) (5.40) (7.26) (4.69) (2.83)Percentage of youth in total –5.208 –3.069 –1.652 –1.992 0.463
population (–2.53) (–5.24) (–2.28) (–2.43) (0.48)
RuralFemale –0.251 –0.204 –0.178 –0.128 –0.164
(–15.3) (–7.54) (–5.30) (–2.63) (–2.56)Adult employment ratio 0.640 0.337 0.453 1.443 0.224
(2.14) (2.33) (2.53) (4.88) (0.52)Percentage of youth in total 0.846 0.459 –0.261 –1.734 0.818
population (1.25) (1.12) (–0.79) (–2.16) (0.61)
Source: Ethiopia Central Statistical Agency 2001; see chapter 9.Note: Figures are probit estimates based on 10- to 24-year-olds, using the regionwide definition of local labormarket. Other regression variables are not displayed. Standard errors are in parentheses.
WB62_YALM_CH05 3/12/08 12:08 PM Page 51

even more difficult for youth to find work in urban areas. Pressure isexpected to be milder in rural areas, where most new entrants can beabsorbed by the agriculture sector.
Many Africans are moving from rural areas to urban centers in searchof greater opportunities. Many of these migrants find little or no opportu-nity and end up unemployed. In Tanzania the rising proportion of youthin the labor market together with increasing urbanization have reducedthe labor market prospects of recent cohorts of urban workers.Young malemigrants in Tanzania are more likely to be unemployed than nonmigrants(see table 5.2). Similar results are found in the other country studies.
Young Women Are at a Particular Disadvantage, in Terms of BothSchooling and Employment Female youth in Sub-Saharan Africa have lower levels of school attain-ment, school enrollment, and employment than males. In most of theSub-Saharan African countries examined, male enrollment is twice thatof females. Only in Madagascar and São Tomé and Principe does femaleenrollment approach that of males (see chapter 3). Females are signifi-cantly overrepresented among the inactive population in most countries,and male employment exceeds female employment in all countriesexcept Burundi, The Gambia, and Zambia (though the differences arenot always large). Female youth tend to leave school at an earlier age andtransit to work more slowly than male youth.
This gender bias has discouraged many women from looking for work.In Tanzania the proportion of discouraged workers is higher amongwomen than men. Since 2001 unemployment rates have fallen for youngmen but risen for young women in many countries in Sub-SaharanAfrica, including Burkina Faso and Ethiopia.
In Ethiopia international migration is higher for women than men. In2001, 98 percent of the 5,015 Ethiopian workers given permits to workin two destination countries were women; more than half were youngwomen engaged in domestic work (see chapter 9). Most women wererelatively well skilled, with 74 percent having completed grade 12. Thefact that secondary school graduates seek jobs as domestic workersabroad suggests that women are at a disadvantage in the local labor mar-ket. Female youth of all ages in Ethiopia are more likely to be unemployedand much more likely to be jobless than male youth.
In Tanzania labor force participation is highest among women with atleast some primary education (59 percent) and lowest for those withsecondary education (32 percent). In contrast to men, uneducated
52 Garcia and Fares
WB62_YALM_CH05 3/12/08 12:08 PM Page 52

women are less likely to participate in the labor force than those withsome primary, with only 55 percent of uneducated women participating.Female inactivity shows a U-shaped relation, first falling with educationand then rising. The pattern may be explained by the fact that unedu-cated women have few opportunities and better-educated women havehigh reservation wages or face discrimination. Many women are notallowed to work at a level that matches their level of education, becomediscouraged, and drop out of the labor force.1
In Tanzania labor supply has no effect on unemployment amongurban males but does affect unemployment among urban females. Labordemand has no effect on activity by urban males but has a strong negativeeffect on activity by urban females. These results imply that if labordemand drops or labor supply increases, women are more likely thanmen to become inactive.
In Ethiopia there is a negative and significant gender bias in employ-ment probability among youth, in both urban and rural areas (see table5.3). The gender bias in employment is smallest for the least- and most-educated urban youth. In rural areas the gap between males and femalesdecreases with education.
Youth Are Vulnerable in the Labor Market
As a result of the challenges they face as they transition to work, youthare often left vulnerable. Few earn wages and most are in the informalsector. In rural areas most young people are in unpaid family work andunderemployed. In urban areas unemployment—including long-term unemployment—looms large. Low-skilled youth are vulnerable to weak-ening demand and young females have difficulties participating in thelabor force.
Lack of Education Increases Youth Exposure to ShocksEmployment is less sensitive to changes in overall demand conditions(measured by the adult employment ratio) and to changes in the sizeof the youth cohort among youth who are more educated in Ethiopia(see table 5.4). Put differently, youth with lower skill levels are morevulnerable to economic and demographic change. If these results are typical of other countries in the region, low-skilled youth—a largeproportion of the youth population in Sub-Saharan Africa—stand tosuffer disproportionately from the increased size of the youth cohortand to shocks to demand.
Working in Bad Jobs or Not Working at All 53
WB62_YALM_CH05 3/12/08 12:08 PM Page 53

Poor Health Limits Employment Opportunities Several studies have documented the importance of heath for productiv-ity, school performance, and several other basic biometric and economicindicators. All over the world youth are at the greatest risk for many dis-eases, especially sexually transmitted infections. People between 15 and 24have the highest reported rates of HIV, chlamydia, gonorrhea, and othersexually transmitted infections. People 15–24 now make up more thanone-quarter of all the people living with HIV/AIDS (UNAIDS/WHO2005). Worse still, more than half of the world’s 5 million people whobecame infected with HIV in 2003 were 15–24.
In Africa an estimated 1.7 million people 10–24 become infected withHIV every year. A large percentage of young people in Tanzania (11–46 percent;Tanzania National Bureau of Statistics 2003) cite health issues asone of the main reasons for their inactivity.These figures are consistent withthe very high prevalence of HIV among youth in Tanzania (2–5 percent formen, 6–9 percent for women). Prevalence is similar in Uganda (6.7–9.0 percent for women, 2.6–5.1 percent for men). HIV is less prevalentamong youth in Burkina Faso and Ethiopia but is still widespread.
54 Garcia and Fares
Table 5.4. Response of Youth Employment to Demographic and Economic Shocks forFemales by Level of Education and Urban-Rural Location in Ethiopia
Has some CompletedNever Has lower lower Has some
attended primary secondary secondary higherschool or less education school education
UrbanFemale –0.149 –0.203 –0.222 –0.181 –0.141
(–3.62) (–4.08) (–5.8) (–4.21) (–10.73)Adult employment ratio 2.341 1.349 1.369 1.734 1.023
(2.71) (5.40) (7.26) (4.69) (2.83)Percentage of youth in total –5.208 –3.069 –1.652 –1.992 0.463
population (–2.53) (–5.24) (–2.28) (–2.43) (0.48)
RuralFemale –0.251 –0.204 –0.178 –0.128 –0.164
(–15.3) (–7.54) (–5.30) (–2.63) (–2.56)Adult employment ratio 0.640 0.337 0.453 1.443 0.224
(2.14) (2.33) (2.53) (4.88) (0.52)Percentage of youth in total 0.846 0.459 –0.261 –1.734 0.818
population (1.25) (1.12) (–0.79) (–2.16) (0.61)
Source: Calculations based on Ethiopia Labor Force Survey 2000; see chapter 9. Note: Figures are probit estimates based on 10- to 24-year-olds, using the regionwide definition of local labor market. Standard errors are in parentheses.
WB62_YALM_CH05 3/12/08 12:08 PM Page 54

Few African Youth Earn Wages Measures of employment provide little information about the conditionsyoung people face in the labor market. New data from selected countriesallow some indicators of work conditions to be created.
Young workers fall into four main groups: wage employees, informalsector employees, the self-employed, and other employment.2 The dis-tribution of youth workers across these groups varies across countries(table 5.5). Informal work accounts for the majority of young workers inBurkina Faso, Burundi, Madagascar, and Uganda, self-employment is theleading work modality for youth in Cameroon, Malawi, and Mozambique,and wage employment is most important in Ethiopia and São Tomé andPrincipe. Both self-employment and informal employment are signifi-cant in The Gambia and Kenya.
The work modalities of young people differ dramatically from those ofadults. Young people are much less likely to be involved in wage employ-ment (except in Ethiopia and São Tomé and Principe) and much morelikely to work in the informal sector (except in Malawi and São Tomé andPrincipe). Adult workers thus enjoy more job security and social protec-tion and are less exposed to the instability and risks associated with theinformal sector. The fact that few younger workers are self-employed
Working in Bad Jobs or Not Working at All 55
Table 5.5. Modality of Employment by Youth and Adults in Selected Countries(percentage of all workers)
Wage Informal Otheremployment employment Self-employment employment
Country Youth Adults Youth Adults Youth Adults Youth Adults
Burkina Faso 3.2 7.6 90.9 59.3 5.8 32.5 0.1 0.7Burundi 1.7 5.8 85.3 39.5 12.8 54.2 0.2 0.5Cameroon 8.2 16.4 26.1 14.5 65.7 69.1 — —Ethiopia 46.7 75.7 27.8 17.0 17.8 3.8 7.7 3.6Gambia, The 10.1 19.2 46.1 13.8 42.7 65.8 1.1 1.1Kenya 17.9 30.8 44.4 19.7 37.6 48.6 0.1 0.8Madagascar 7.8 15.9 68.1 31.1 22.8 50.6 1.4 2.3Malawi 18.8 26.7 7.1 5.1 70.3 64.9 3.8 3.3Mozambique 15.1 16.6 — — 53.5 69.6 1.2 0.5São Tomé and
Principe 63.2 57.8 28.8 41.5 — — 8.0 0.7Uganda 3.2 7.6 90.9 59.3 5.8 32.5 0.1 0.7Zambia 9.5 23.9 51.8 16.9 37.8 58.3 0.9 1.0
Source: Understanding Children’s Work calculations based on World Bank Standard Files and StandardIndicators datasets.Note: Youth are 15–24. Adults are 25–50. Data for Côte d’Ivoire are unavailable.— Not available.
WB62_YALM_CH05 3/12/08 12:08 PM Page 55

(except for Cameroon, Malawi, and Mozambique) suggests that they findit difficult to start a business, perhaps because of lack of capital.
In all 13 countries people from the highest income quintile are mostlikely to earn wages (see chapter 7). Nevertheless, even for this quintilewage employment is not the dominant sector in all the countries. In Kenyaand Madagascar, for example, even among people from the highest incomequintile, the most important sector is the informal sector.The high level ofself-employment (in Cameroon, Malawi, and Mozambique, for example)may be a sign that workers have difficulty entering the labor market.
In nearly all Sub-Saharan countries, few workers are engaged in wageemployment, even in urban areas (table 5.6).3 The high level of informalemployment in most countries (except Malawi) represents a cause forconcern. Informal work in rural settings is associated mainly with agricul-ture and is typically low paid and seasonal. In urban settings informal workoften involves insecure, nonfamily work, in settings in which labor andsafety regulations do not apply, leaving workers susceptible to exploitation.
In Tanzania most young adults (20–24) end up in nonwage employ-ment, usually in the informal sector, where working conditions are poor(table 5.7). Most rural youth work in agriculture. Many are unpaid laborerson their own farms or family farms. Youth in most urban areas also workin the agricultural sector, although many, particularly in Dar es Salaam,earn wages.
Some urban young adults are self-employed, and there is evidence thatmany more would like to work for themselves but cannot because of lackof capital (chapter 10). This barrier is particularly true in rural areas andcities other than Dar es Salaam, but even in the capital, having social net-works or coming from a higher-income family does not increase thechance of accessing capital, because most families lack collateral for loans(see chapter 10).
As they get older, young males are more likely to be found in wageemployment, particularly in Dar es Salaam but also in most other urbanareas, where the proportion of male employees rises from 15 percent forteenagers to about 22 percent for young adults. This incidence is stilllower than that of adult males. Among employed female young adults,36 percent in Dar es Salaam and 19 percent in other urban areas workas employees (see table 5.7).
In Ethiopia more than 80 percent of rural teenagers and 60 percent ofyoung adults are unpaid workers (figure 5.1). Policies that provide incometransfers to these families would be likely to reduce early entry into workand allow children to attend school. In urban areas in Ethiopia, the largest
56 Garcia and Fares
WB62_YALM_CH05 3/12/08 12:08 PM Page 56

Tab
le 5
.6. M
odal
ity
of E
mp
loym
ent o
f Rur
al a
nd
Urb
an Y
outh
, in
Sel
ecte
d C
ount
ries
(per
cent
age
of a
ll w
orke
rs)
Rura
lU
rban
Wag
e In
form
alSe
lf-O
ther
W
age
Info
rmal
Self-
Oth
erCo
untr
yem
ploy
men
tem
ploy
men
tem
ploy
men
tem
ploy
men
tem
ploy
men
tem
ploy
men
tem
ploy
men
tem
ploy
men
t
Burk
ina
Faso
0.4
94.8
4.8
0.0
27.9
57.0
14.4
0.7
Buru
ndi
1.8
83.3
14.8
0.1
31.3
19.6
43.3
5.8
Cam
eroo
n6.
318
.168
.86.
815
.356
.922
.05.
9Et
hiop
ia55
.624
.816
.23.
416
.238
.223
.322
.3G
ambi
a, T
he1.
253
.145
.00.
842
.320
.734
.72.
4Ke
nya
16.4
40.0
43.6
0.0
21.1
53.3
25.4
0.2
Mad
agas
car
5.9
69.7
23.5
1.0
19.3
58.7
18.2
3.8
Mal
awi
15.0
7.1
74.5
3.3
63.8
6.8
19.8
9.5
Moz
ambi
que
11.8
—86
.71.
540
.2—
53.5
6.3
São
Tom
é an
d Pr
inci
pe59
.534
.3—
6.2
66.3
24.3
—9.
5Za
mbi
a3.
160
.436
.10.
440
.99.
646
.13.
5
Sour
ce:U
nder
stan
ding
Chi
ldre
n’s W
ork
calc
ulat
ions
bas
ed o
n W
orld
Ban
k St
anda
rd F
iles
and
Stan
dard
Indi
cato
rs d
atas
ets.
Not
e:D
ata
for C
ôte
d’Iv
oire
are
una
vaila
ble.
— N
ot a
vaila
ble.
57
WB62_YALM_CH05 3/12/08 12:08 PM Page 57

Tab
le 5
.7. E
mp
loym
ent M
odal
ity
by
Gen
der
, Ag
e G
roup
, an
d U
rban
-Rur
al L
ocat
ion
in T
anza
nia
(per
cent
age
of a
ll w
orke
rs in
age
gro
up)
Fem
ales
Mal
es
Self-
Self-
Self-
Self-
empl
oyed
em
ploy
ed,
Unp
aid
empl
oyed
empl
oyed
,U
npai
dLo
catio
n an
dw
ithno
fam
ilyO
wn
with
nofa
mily
Ow
n ag
e gr
oup
Empl
oyee
empl
oyee
sem
ploy
ees
wor
ker
farm
Empl
oyee
empl
oyee
sem
ploy
ees
wor
ker
farm
Dar
es
Sala
amTe
enag
ers
52.1
0.4
26.1
15.2
6.2
40.8
0.0
27.2
22.8
9.3
Youn
g ad
ults
36.4
2.8
53.8
4.4
2.7
47.4
1.7
38.4
6.7
5.9
Prim
e-ag
e ad
ults
27.2
3.3
55.8
0.4
13.3
54.5
10.3
30.0
0.0
5.2
Urb
anTe
enag
ers
16.8
1.3
11.7
20.9
49.4
15.1
0.2
16.7
5.2
62.8
Youn
g ad
ults
19.1
1.1
35.2
6.5
38.1
21.8
3.1
22.5
3.8
48.9
Prim
e-ag
e ad
ults
14.1
5.9
28.4
2.9
48.8
36.9
5.5
28.5
0.4
28.7
Rura
lTe
enag
ers
1.9
0.0
1.9
5.2
91.1
3.6
0.0
2.3
3.5
90.5
Youn
g ad
ults
1.3
0.3
1.9
1.4
95.1
5.6
0.3
4.6
0.8
88.6
Prim
e-ag
e ad
ults
2.3
0.2
3.0
0.8
93.7
9.0
1.0
4.4
0.3
85.4
Sour
ce:I
nteg
rate
d La
bor F
orce
Sur
vey
2000
/01;
see
cha
pter
10.
Not
e:Te
enag
ers
are
15–1
9. Y
oung
adu
lts a
re 2
0–24
. Prim
e-ag
e ad
ults
are
25–
55.
58
WB62_YALM_CH05 3/12/08 12:08 PM Page 58

proportion of teenagers work as unpaid family workers, but larger propor-tions of young adults are self-employed and work in the wage sector. Theproportion of teenage girls and boys working in the wage sector is low.
In rural areas most Ethiopians work in the agricultural sector. In urbanareas the dominant sector is services, which includes retail trade. Manyof the youth employed in the service sector are involved in petty retailtrade, selling products such as newspapers and beverages. These jobsyield low incomes, and some are hazardous.
Underemployment Is Prevalent in Rural AreasAlthough a large portion of out-of-school youth are employed inTanzania, 6 percent of young men and more than 10 percent of youngwomen report being underemployed. In Ethiopia widespread under-employment is a major problem not only for youth but for the popula-tion as a whole, particularly in the rural sector. Underemployment inEthiopia is high in rural areas, with the average worker working less than30 hours a week.
Working in Bad Jobs or Not Working at All 59
0102030405060
you
th (
%) 70
8090
100
male female urban rural male female urban rural15–19 years
wage employee self-employed unpaid family work
20–24 years
you
th (
%)
0102030405060708090
100
male
agriculture manufacturing services
15–19 years 20–24 yearsfemale urban rural male female urban rural
Figure 5.1. Most Youth Perform Unpaid Family Work, Predominantly in Agriculture inEthiopia
Source: Understanding Children’s Work calculations based on Ethiopia Labor Force Survey 2001; see chapter 9.
WB62_YALM_CH05 3/12/08 12:08 PM Page 59

In Burkina Faso multiple job holding is more common in rural than inurban areas (table 5.8). Among all workers with at least two jobs, morethan 92 percent live in rural areas. Not surprisingly, almost 95 percentwork in the agriculture, breeding, fishing, and hunting sectors; 57 percentwork as family helpers; and 41 percent are independent workers. Multiplejob holding is more likely to occur as workers become older. There is littleevidence of a systematic relationship between household income and theincidence of multiple job holding.
About 16 percent of all workers in Burkina Faso believe they are under-employed. The overwhelming majority of these workers hold multiplejobs. About 9 percent of people with one job and 47 percent of peoplewith multiple jobs wish they could work more.
Youth Unemployment Is High
More than 18 million young people in Sub-Saharan Africa—21 percentof all youth (15–24)—were unemployed in 2003. This rate of youth
60 Garcia and Fares
Table 5.8. Multiple Job Holding and Underemployment by Gender, Age, and Urban-Rural Location in Burkina Faso(percent)
Male Female
Age group and job status Urban Rural Urban Rural
10–14Wants more work 11 8 6 8Holds more than one job 8 7 3 9
15–19Wants more work 10 13 12 14Holds more than one job 8 14 7 13
20–24Wants more work 12 16 13 20Holds more than one job 11 18 10 21
25–34Wants more work 15 17 15 23Holds more than one job 9 21 11 28
35–44Wants more work 15 18 15 26Holds more than one job 9 25 13 35
45 and olderWants more work 18 16 16 22Holds more than one job 17 24 16 33
Source: Survey of Household Living Standards, 2003; see chapter 8.
WB62_YALM_CH05 3/12/08 12:08 PM Page 60

unemployment exceeds that of all other regions except the Middle Eastand North Africa.
Comparing youth and adult unemployment rates provides some indi-cation of the extent to which young workers are disadvantaged relative toadults. The unemployment rate for youth exceeds that of adults in allcountries except Burundi and The Gambia (figure 5.2).Young workers areparticularly disadvantaged in Cameroon and São Tomé and Principe,where the youth unemployment rate is more than five times that of adults.
Long-Term Unemployment Is a Serious Problem in Ethiopia and TanzaniaHigh unemployment may not represent a problem if it reflects temporarymovement from one job to another or new entry into the labor market.It is a serious problem for individuals and the economy as a whole whenit lasts for long periods.
In Sub-Saharan African almost all young people leave school betweenthe ages of 15 and 24, but a large proportion do not immediately settle into
Working in Bad Jobs or Not Working at All 61
Ethiopia
Angola
Sierra Leone
2
2
2
2
22
2
2
2
2
3
3
3
3
3
4
4
4
4
0
10
20
30
40
0 10 20 30 40
adult unemployment rate (%)
you
th u
nem
plo
ymen
t ra
te (
%)
Sub-Saharan Africa
rest of the World
1 : 12 : 13 : 1
3
Figure 5.2. Unemployment Is Higher among Youth Than Adults in Almost All Sub-Saharan African Countries
Source: World Bank 2006.
WB62_YALM_CH05 3/12/08 12:08 PM Page 61

employment.The average estimated school-leaving age ranges from 15.9 to19.0 years, and the average age at first job ranges from 18.4 to 24.4. Thetotal estimated transition duration thus ranges from one to seven years.
Evidence from the 2003 Urban Biannual Employment UnemploymentSurvey of Ethiopia suggests that much urban youth unemployment isstructural rather than transitory in nature.About one-third of unemployedteenagers and almost half of unemployed young adults had been withouta job for at least one year at the time of the survey (figure 5.3). Even moreworrisome is the fact that the share of youth with very long spells ofunemployment (more than two years) increases with age.
In Tanzania more than 40 percent of unemployed young adults havebeen unemployed for more than two years, and more than 70 percenthave been unemployed for more than a year (figure 5.4). Long-termunemployment accounts for at least half of total unemployment inTanzania. The duration of unemployment is much longer in urban thanin rural areas, and among men in urban areas, the duration of unemploy-ment is longer among teenagers and young adults than among prime-ageadults. If unemployment is mainly a long-term phenomenon, this impliesthat it is largely concentrated among certain population groups, raisingserious distributional considerations.
Long-term unemployment increases the difficulty of entry into thework force, especially in the formal sector. Because early work experienceis very important and yields high returns, lack of access to work for long
62 Garcia and Fares
42
29
33
25
19 1718
22
1614
2832
0
5
10
15
20
25
30
35
40
45
unemployed teenagers
1–6 months 7–12 months 1–2 years more than 2 years
unemployed young adults all unemployed
un
emp
loye
d u
rban
yo
uth
(%
)
Figure 5.3. Many Urban Youth Remain Unemployed for More Than a Year in Ethiopia
Source: 2003 Urban Biannual Employment Unemployment Survey, as cited in Denu, Tekeste, and van der Deijl 2005.
WB62_YALM_CH05 3/12/08 12:08 PM Page 62

periods reduces human capital accumulation for young entrants, reducingtheir earning potential and future development.
Many Young Africans Fail to Enter the Labor Market, Particularly WomenPeople who are neither at work (or looking for work) nor at school areclassified as inactive. The highest average rates of inactivity in Sub-Saharan Africa are in Ethiopia (59 percent) and Mozambique (45 percent)(figure 5.5). In other countries very few young people are classified asneither working nor being in school. In all countries young women are
Working in Bad Jobs or Not Working at All 63
0123456789
10
teens
urban
male female
urb
an d
ura
tio
n (
year
s)
youngadults
prime-age
teens youngadults
prime-age
rural
Figure 5.4. Unemployment Spells Last Much Longer in Urban Than in Rural Areas in Tanzania
Source: Integrated Labor Force Survey; see chapter 10. Note: Teenagers are 15–19. Young adults are 20–24. Prime-age adults are 25–55.
01020304050607080
Ethiop
ia
Moz
ambiq
ue
São T
omé
and
Princip
e
Mala
wi
Gambia
, The
Kenya
Zambia
Côte
d’Ivo
ire
Camer
oon
Ugand
a
Burkin
a Fas
o
Mad
agas
car
Burun
di
inci
den
ce o
f in
acti
vity
am
on
g15
- to
24-
year
-old
s (%
)
male female
Figure 5.5. Young Females Are More Likely Than Young Males to Be Neither WorkingNOR Attending School
Source: Understanding Children’s Work calculations based on World Bank Standard Files and Standard Indicatorsdatasets; see chapter 7.
WB62_YALM_CH05 3/12/08 12:08 PM Page 63

Tab
le 5
.9. R
epor
ted
Rea
son
s fo
r In
acti
vity
am
ong
Mal
e Yo
uth
in T
anza
nia
(per
cent
)
Reas
on fo
r not
look
ing
Reas
on n
ot a
vaila
ble
Thou
ght
Wai
ting
Loca
tion
and
wou
ldfo
r job
/ O
ff-H
ouse
hold
Tem
pora
rily
Hou
seho
ldag
e gr
oup
not f
ind
repl
yse
ason
dutie
sill
Oth
erdu
ties
IllO
ther
Dar
es
Sala
amTe
enag
ers
64.5
13.6
0.0
3.2
3.6
15.2
28.0
11.3
60.7
Youn
g ad
ults
25.6
32.5
0.0
2.7
0.0
39.3
18.7
24.7
56.6
Prim
e-ag
e ad
ults
0.0
100.
00.
00.
00.
00.
00.
010
0.0
0.0
Urb
anTe
enag
ers
28.3
48.8
0.0
7.5
1.5
13.9
25.8
31.7
42.5
Youn
g ad
ults
51.8
21.8
0.0
18.0
0.0
8.3
16.9
15.7
67.4
Prim
e-ag
e ad
ults
16.2
7.0
38.3
0.0
0.0
38.5
12.6
83.4
4.0
Rura
lTe
enag
ers
17.4
22.1
8.3
30.7
1.3
20.2
22.7
45.9
31.4
Youn
g ad
ults
19.9
27.9
8.7
37.6
0.0
5.9
10.5
58.6
30.9
Prim
e-ag
e ad
ults
33.8
39.4
17.7
9.1
0.0
0.0
3.2
92.1
4.7
Sour
ce:I
nteg
rate
d La
bor F
orce
Sur
vey
2000
/01;
see
cha
pter
10.
Not
e:Te
enag
ers
are
15–1
9. Y
oung
adu
lts a
re 2
0–24
. Prim
e-ag
e ad
ults
are
25–
55.
64
WB62_YALM_CH05 3/12/08 12:08 PM Page 64

more likely than young men to be inactive. Many “inactive” young adults(20–24), especially females, may be involved in home production. Othersmay be discouraged because of difficulties entering the work force.
In Dar es Salaam about 25 percent of teenagers and 40 percent ofyoung adults are neither in school nor at work; in other urban areas,about 18 percent of teenagers and of young adults are unemployed.More than 64 percent of teenage boys and 25 percent of young men inDar es Salaam are discouraged workers (table 5.9). Among inactivefemales, 59 percent of teenagers and 67 percent of young women arediscouraged workers. Results for other urban areas in Tanzania are lowerbut also high. For the country as a whole, the education of the head ofhousehold appears to be negatively correlated with inactivity, which ishighest among youth with no education (27 percent).
Many inactive females report that household duties prevent them fromlooking for a job. Among males who claim they were not available forwork, many report “other reasons.” More research needs to be conductedto determine the nature of these reasons, which could include involvementin illegal activities or the need to take care of ill family members.
Notes
1. The gender bias cannot be fully captured by considering unemployment,which remains a “privilege” of more-educated girls. Inactivity also needs to beexamined because less-educated females are unlikely to classify themselves asavailable for work, possibly due to discouragement.
2. Wage employees are people in paid employment who are remunerated bywages or salaries, commissions, piece rates, bonuses, or in-kind payments. Theyinclude regular employees and casual workers without contracts. Informalworkers are people employed in semiorganized units. The InternationalLabour Organization defines informal sector workers as own-account workers,unpaid family workers who work at least seven hours a day, and employers andemployees in establishments in which less than 10 people work. Paid domes-tic workers are excluded. Self-employed workers are people who performsome work for profit or family gain, in cash or in kind. Remuneration dependson the profits derived from the goods and services produced (own consump-tion from enterprise is considered part of profits). Self-employed people makeoperational decisions themselves or delegate them to others while retainingresponsibility for the welfare of the enterprise. Self-employment may includecontributing family workers. Other employment applies to those who are notin the first three classifications.
3. In some countries—such as Ethiopia,The Gambia, and Malawi—however, thehigher percentage of wage workers include casual workers without contracts.
Working in Bad Jobs or Not Working at All 65
WB62_YALM_CH05 3/12/08 12:08 PM Page 65

WB62_YALM_CH05 3/12/08 12:08 PM Page 66

Policy makers in Africa are concerned about the difficulties youth arefacing in their transition to work, and they recognize the deleteriousconsequences of youth unemployment for both youth and the region asa whole. Despite this recognition, the response has been fragmented.Most interventions have been small-scale and face severe challenges forsustainability and scalability.
This chapter offers some guidance to policy makers searching forways to address youth employment issues. The analyses conducted in theprevious chapters and the survey of interventions in four countries in theregion (presented in annexes 6B–E) ground the proposed policy frame-work in these countries’ realities and provide the background for furtherempirical examination, operational work, and policy dialogue with thecountries in the region. The methodology is presented in annex 6A.
The transition to work is difficult for African youth because of thelarge number of young people entering the labor market, their lack ofskills, unfavorable economic conditions in most African countries, marketfailures that adversely affect youth outcomes, and a host of other factors.As suggested by the World Development Report 2007, a successful policyresponse to the challenge of youth employment rests on three pillars:broadening opportunities for young people to accumulate and preserve
C H A P T E R 6
The Three Pillars of Policy: Lessonsfrom International Experience
Marito Garcia and Jean Fares
67
WB62_YALM_CH06 3/12/08 1:20 PM Page 67

human capital, increasing the capability of youth to take advantage ofwork opportunities, and providing youth who are not initially equippedto take advantage of opportunities with a second chance, so that no oneis left behind.
Pillar One: Broadening Opportunities for Employment Spurring economic growth—Economic growth is key to broadeningemployment opportunities. Growth increases employment opportunitiesfor everyone—and has a disproportionately large effect on youth. InIndonesia and Vietnam, youth benefited from new employment opportu-nities in the trade and manufacturing sectors (World Bank 2006). Largecohorts of young and mobile workers can, in turn, support the expansionof these sectors.
How well has Africa done in expanding economic opportunities foryouth? Growth in Africa declined between the 1970s and the late 1980s(World Bank 2000), but since the mid-1990s growth in 16 countries inthe region has exceeded 4.5 percent a year (World Bank 2006). Some ofthese countries, such as Mozambique, Tanzania, and Uganda, have diver-sified their economies and exports, sectors that are likely to hire moreyouth. Oil-producing countries have seen significant growth in GDP asa result of the sharp increase in oil prices.
Africa’s performance in manufacturing has been poor (Kingdon andKnight forthcoming). Analysis of 12 countries in the region reveals thatthe share of industry value added in GDP was about 5 percentage pointslower than the world average between 1970 and 2000. Among thesecountries, four saw employment in the manufacturing sector expand bymore than 20 percent in the early 2000s. Others, including Kenya andTanzania, experienced almost no growth.
Sub-Saharan Africa continues to face significant barriers to creatingnew jobs in the formal sector (World Bank 2004). Most youth employ-ment is nonwage employment (see chapter 5). A key challenge is toincrease nonfarm rural employment and prepare youth to move intoactivities off the farm. Evidence from low-income countries in otherregions suggests that people with skills are more mobile than average andare likely to take advantage of opportunities off the farm.
Improving the investment climate and addressing policy failures—Agood investment climate lets the private sector expand, helps trade flour-ish, and allows countries to attract foreign direct investment. To improve
68 Garcia and Fares
WB62_YALM_CH06 3/12/08 1:20 PM Page 68

the investment climate, governments need to maintain political stability,improve the regulatory and tax climate for investment, provide neededinfrastructure, and improve information on vacancies for job seekers(World Bank 2004).
These general policies are necessary to promote youth employmentopportunities, but they are not sufficient. Youth would benefit frompolicies that mitigate the market and policy failures responsible for labormarket rigidity and segmentation. In Ethiopia downward rigidity in realwages in the urban sector in times of economic reform has led to highrates of open unemployment, particularly among urban youth (Krishnan,Selassie, and Dercon 1998).
Preventing rising joblessness in order to ensure political stability––Ever-rising joblessness among youth and the desperation that accompanies itundermine the possibility of progress in countries emerging from conflict.They also risk destroying the political and social structures of countries thatare currently stable, especially given demographic trends in some parts ofSub-Saharan Africa. The growing number of youth who lack the prospectof ever being able to earn a reasonable living threatens the future of theregion. Until this situation changes, the likelihood of achieving genuinepeace, security, and development throughout the region will remain small.At the same time, pressures to migrate, illegally and dangerously, to parts ofthe world where opportunities appear more promising will continue tomount, with consequences for the receiving countries (UNOWA 2005).
Pillar Two: Building Skills and CapabilitiesDespite the increase in educational attainment in most Sub-SaharanAfrican countries, youth continue to leave school unprepared to integrateinto the labor market. To reduce school dropout and early transition towork, policies and programs should ease the income constraints poorfamilies face. In Ethiopia school attendance rose after a flexible schoolcalendar was introduced in rural areas that took into account the agricul-ture cycle. In Burkina Faso poor households facing adverse income shocksare likely to withdraw their children from school and send them to work(see chapter 5). Conditional cash transfers, which transfer funds to poorfamilies as long as their children attend school or after-school programs,have been shown to increase school enrollment and reduce child labor inBrazil and Mexico (Raju 2006).
The Three Pillars of Policy: Lessons from International Experience 69
WB62_YALM_CH06 3/12/08 1:20 PM Page 69

Promoting public-private partnerships and making curricula morerelevant––Public-private partnerships are needed to improve the qualityof primary education and increase access to lower-secondary education.Public policy could complement private initiatives by ensuring qualitystandards and introducing financing mechanisms to support the poor.Promotion of private schools in Kenya during the 1960s and 1970sresulted in marked expansion in secondary school enrollment. For sec-ondary and postsecondary education, school curricula need to be mademore relevant to labor market needs. Providing practical skills—by teachingsubjects such as technology, economics, and foreign languages—couldbetter equip youth for the labor market; better integrating vocational andgeneral curricula could facilitate youth insertion into the work force.
In addition to raising enrollment, countries need to improve the qualityof their education systems and the relevance of school curricula byteaching students the practical thinking and behavioral skills demandedby the labor market, using teaching methods that lead to high learningachievement and blend academic and vocational curricula (World Bank2006). Building bridges between school and work can facilitate the tran-sition of youth from school to the workplace.
Combining part-time schooling with work, as Germany does, hasproved difficult to replicate in Sub-Saharan Africa, where the lack ofinstitutional capacity and the small industrial sector limit the chance ofsuccess of the dual system (Johanson and Adams 2004). Youth are morelikely to participate in traditional apprenticeship schemes (Adams2006). Across most of West Africa, apprentices outnumber wageemployees in informal firms (Haan and Serriere 2002). These programscould be enhanced by providing access to new technologies, improvingthe technical skills of master craftspeople, and certifying skills. In Kenyaa voucher program in the informal sector helped improve the qualityand relevance of the training offered to apprentices by giving mastercraftspeople access to new technologies and upgrading their skills (Rileyand Steel 1999). A similar program could potentially be adopted else-where in the region.
Given the budget constraints facing African governments, technicaland vocational education and training also need to change to allow forpublic-private partnerships, diversify financing for training, promotesustainability, and improve access and relevance. In Mauritius theIndustrial Vocational Training Board has split the financing and provisionof training and adopted a competitive model for procuring trainingservices. Other examples from countries outside the region (such as
70 Garcia and Fares
WB62_YALM_CH06 3/12/08 1:20 PM Page 70

Argentina and Chile) illustrate how competition promotes efficientdelivery and closer links to market demand, shifting the financing modelfor training from one that is supply driven to one that is demand driven(World Bank 2006).
Youth need to be prepared to take advantage of potential opportunitiesor create opportunities on their own through self-employment andentrepreneurial activities.Young entrepreneurs face several constraints tocreating a venture and making it grow. Some lack entrepreneurial skills,others lack access to information and networks, almost all have difficultyaccessing credit and face investment climates that make it difficult tostart and run a business. Improving the climate for doing business wouldallow more young entrepreneurs to start their own enterprises. Programsthat provide access to networks and information have been initiated insome countries in Latin America and seem promising (for example,Endeavor in Argentina, Brazil, Mexico, and Uruguay). South Africa’syouth fund illustrates how public and private financial intermediariescould collaborate to provide youth with better access to credit.
Pillar Three: Offering a Second Chance So That No One Is Left BehindPoverty, adverse economic conditions, poor health, employment shocks,and inadequate schools force many young people to leave school with-out acquiring the basic skills demanded in the workplace. Harsh weatherand civil conflicts uproot many communities, halting early efforts youthhave made to find work and develop their livelihoods. The result is ahuge stock of unskilled youth who never went to school, are ill-preparedfor the workplace, and are vulnerable to shocks (see chapters 2 and 3).
Estimates based on data in this study indicate that 36 percent of the15- to 24-year-olds in the region never went to school, only 28 percentcompleted primary school, and only 8 percent completed secondary school.This means that about two-thirds of all youth in the labor market—some95 million young people—lack the skills to be competitive in the laborforce. These youth need a second chance.
Many countries operate second-chance programs. Some try to get out-of-school youth back in school or provide alternative mechanisms forskill development. Others attempt to directly reintegrate out-of-workyouth into the work force. To limit—and justify—the fiscal burden ofsecond-chance initiatives, all programs must be well targeted, designedto increase youth skills, and geared to the needs of the labor market.
For young people who are out of school, equivalence, literacy, and jobtraining programs should be designed to provide the skills needed for
The Three Pillars of Policy: Lessons from International Experience 71
WB62_YALM_CH06 3/12/08 1:20 PM Page 71

work (World Bank 2006). Practical curricula that include both technicaland life skills, flexible schedules, and less formal instruction methods aremost likely to attract youth and provide them with the skills most neededin the labor market. Literacy programs have suffered from low take-uprates; they need to be more contextual and demand driven. Programs inGhana and Senegal include postprogram follow-up to solidify literacyskills (World Bank 2006).
Job training programs are more likely to be successful if they are part ofa package that includes basic education, employment services, and socialservices. A recent review of 19 training programs targeting youth showsthat in the absence of such a package, training programs rarely improve theemployment and earnings of young participants (Betcherman, Olivas, andDar 2004). Well-targeted and comprehensive training programs, such asthe Jovens program in Argentina, Chile, and Peru, have been successful inreaching the most vulnerable youth and improving their earnings andemployment (World Bank 2006).
Public works programs provide good opportunities for young work-ers, particularly rural residents and people with low skills, to acquireinitial work experience. In Senegal the Agence d’Exécution des Travauxd’Intérêt Public (AGETIP) trains and employs unemployed youth,who work on public infrastructure projects (roads, buildings, sanitationsystems). The youth are hired only on a temporary basis, but the trainingand work experience helps them obtain more permanent employment.Public works projects also allow good targeting for other youth inter-ventions (such as training and placement services) that may increasethe likelihood that youth find better employment opportunitiesbeyond the program.
A few evaluations have tested whether these programs improve thechances of participating in the labor market or enhance private sectoremployment. Evaluation of Argentina’s Trabajar program suggests that suchprograms can have a significant impact on participants’ current incomes(Ravallion and others 2005). There is also some evidence of lagged gainsfrom past participation. Evaluation of the first seven years of the AGETIPprogram in Senegal finds that the number of engineering firms more thantripled, the number of construction firms increased fivefold, and 35,000person-years of employment were generated. Poor governance can be anissue, however. Public works projects require transparency and oversight toensure that projects target the poor, that only worthy projects are funded,that funds are used wisely, and that inexperienced youth are trained (WorldBank 2006).
72 Garcia and Fares
WB62_YALM_CH06 3/12/08 1:20 PM Page 72

Responses from African Countries
A review of 68 programs in Burkina Faso, Ethiopia, Tanzania, and Uganda(presented in annexes 6B–E) reveals important differences across coun-tries. The inventory, based on a country stocktaking exercise conducted inlate 2005, is not comprehensive but is indicative of the number and rangeof interventions in progress at the time of the survey. The list is restrictedmainly to postschooling interventions.
The inventory of programs is organized into three categories: interven-tions that broaden opportunities for youth, interventions that build skillsand capability, and interventions that offer second chances (table 6.1).
• Broadening opportunities includes programs that boost overall demandfor labor, such as regional and micro- and small-enterprise develop-ment programs, and interventions to remedy labor market failure,such as counseling and job search programs.
• Building skills and capability includes programs to improve the skills ofdisadvantaged youth, postschool programs that provide unemployedyouth with vocational skills, entrepreneurship programs (which arebundled with credit schemes), and livelihood training.
• Second-chance programs include adult literacy and equivalency programs,support for marginalized young people, and public works programs.
Improving opportunities for entrepreneurs is by far the most populartype of program, in terms of both programs that target youth (except inEthiopia) and those that target all workers. Public works programs are inplace in Burkina Faso, Ethiopia and Tanzania, although they do notspecifically target youth. Training programs are heavily representedamong youth-specific programs in Burkina Faso, Tanzania, and Uganda,albeit with different emphases. Burkina Faso is the only country in whicha rural adult literacy program appears to be in place, although Ugandahas a National Adult Literacy Strategic Investment Plan and Tanzaniaand Uganda have second-chance/equivalency programs. Improving train-ing systems for young people seems to be neglected, although Tanzaniaseems well placed to move in this direction through its skill developmentlevy system. There may also be scope for reforming labor market regula-tions to encourage employers to hire more young workers.
Program Evaluation Has Been WeakSeveral evaluation studies of these interventions have been conducted, butthey report only outcomes, not impact. Information has been collected on
The Three Pillars of Policy: Lessons from International Experience 73
WB62_YALM_CH06 3/12/08 1:20 PM Page 73

74 Garcia and Fares
Table 6.1. Promising Interventions in Burkina Faso, Ethiopia, Tanzania, and Uganda
Category Policy or program
Broadening opportunitiesJob creation programs Regional Micro and Small Enterprise
Development Agencies (Ethiopia)Counseling and job search programs Labor Exchange Center (Tanzania)Financial incentives FINCA Lending Programme (Tanzania)
ZANU Finance Lending, Training, and Literacy(Burkina Faso)
Building skills and capabilityApprenticeship systems VETA National Apprenticeship (Tanzania)Vocational skills training (active labor Entoto Technical and Vocational
market training programs for youth) Education and Training (Ethiopia)Hope Enterprises (Ethiopia)Community Skill Training Centers (IIZ/DW and
Government) (Ethiopia)PEVOT-GTZ Program (Uganda)
Young entrepreneur programs Gatsby Trust Entrepreneurship (Tanzania)PCY (GTZ) Small Business (Uganda)Tanzania PRIDE Entrepreneurship (Tanzania) FAARF Women’s Credit (Burkina Faso)FAPE Employment Promotion Fund
(Burkina Faso)Programs to counteract isolation Livelihood Skills Development Programme
(Tanzania)BKF/98/006 Program to Retain Young People
in Own Regions (Burkina Faso)
Second-chance programsLiteracy and numeracy programs YES Program (Uganda)Second-chance equivalency programs Complementary Basic Education (COBET)
(Tanzania)BEUPA Equivalency Program (Uganda)
Public works Dar es Salaam Solid Waste Municipal Service Delivery (Tanzania)
Productive Safety Nets Program (Ethiopia)PSTP/HIMO Public Works (Burkina Faso)TIPE Public Works Program (Burkina Faso)
Support to disadvantaged youth REPAGE Project for Marginalized Young People(Burkina Faso)
Source: Godfrey 2006.
WB62_YALM_CH06 3/12/08 1:20 PM Page 74

the cost of various interventions, but no cost-benefit studies appear to havebeen conducted, and the impact of the programs was not compared withthat of a control group.
Evaluation is particularly important in countries with limited resources,where resources are vitally needed for education, safe motherhood pro-grams, contraception, and construction and repair of infrastructure. Youthemployment interventions should pass two tests: their social benefitsshould outweigh their costs and the private return to program participantsshould be high.
Future Research to Fill Knowledge Gaps
This report identifies gaps in knowledge about youth in the labor market.Future analysis is needed to fill these gaps. Priority areas for futureresearch include the following:
• Rigorous evaluations need to be conducted in order to build an evi-dence base from which interventions can be formed to help poor youthmake successful transitions to working life. Evaluating program impactshould be one of the highest priorities for donors and governments inresponding to the challenge of youth unemployment.
• Surveys need to add nonstandard labor market indicators so that theyfully describe what is happening in the rural labor market. Currentsurveys fail to capture many unpaid family workers.
• Better understanding is needed of the response of youth program in-terventions in rural areas and informal sectors.
• More research should be done on second-chance programs, which areparticularly important in Africa given the large number of youth whonever completed primary school.
Annex 6A. Methodology: Building an Indicator of the School-to-Work Transition
This annex computes a measure of the school-to-work transition in devel-oping countries. It tries to overcome some of the problems associated withusing methods applied to measure the transition in Western countries.
OECD (1998, 1999, 2000) uses the age at which 50 percent of indi-viduals are employed to determine the end point of the transition.Measures of transition based on this definition implicitly assume that
The Three Pillars of Policy: Lessons from International Experience 75
WB62_YALM_CH06 3/12/08 1:20 PM Page 75

76 Garcia and Fares
the overall portion of individuals moving into employment is at least 50 percent (otherwise no transition would ever be completed) and thatthe proportion of individuals who enter employment is roughly compa-rable across countries (otherwise this indicator is biased by differencesin participation across countries). Neither of these assumptions is likelyto be true, especially in developing countries.
Similar problems occur in estimating the starting point of the transi-tion. OECD indicators implicitly assume that all children transit throughthe school system and that the vast majority of them stay in school atleast as long as they are required to by law. This assumption is clearly notvalid in most developing countries.
These assumptions represent a serious source of bias in comparing datafrom developing countries with very different levels of overall labor mar-ket participation in adulthood, especially among women, and of schoolattendance. The procedure developed for this study tries to circumventthe problems with other methods by standardizing the measures ofschool-to-work transition to the population at risk—that is, those whoeventually transit through school and participate in the labor force.
Ideally, to model the transition process from school to work, longitu-dinal data should be used that provide detailed job histories that followindividuals from childhood into adulthood. Alternatively, cross-sectionaldata with retrospective information could be used that allow workhistories to be reconstructed. In the absence of these data, which aregenerally lacking even in developing countries, cross-sectional data canbe used to measure the length of the transition. Under appropriateassumptions, cross-sectional data allow the parameters of interest to beconsistently identified.
To measure the school-to-work transition, a new indicator was devel-oped for this report based on the difference between the averageschool-leaving age and the average age of first entry into work. Thismeasure was constructed as follows. Suppose there exists an age amin,such that for a > amin, individuals never enter school and for a � aminindividuals never leave school. In this case, at age amin those who everenter school are in school. Let S denote the event of being in school andSLa the probability of leaving school at age a. Then
SLa = –[P(Sa+1) – P(Sa)] a > amin (6A.1)
represents the change in enrollment across two consecutive ages. Equation(6A.1) states that if, say, 90 percent of children are in school at age 10 and
WB62_YALM_CH06 3/12/08 1:20 PM Page 76

80 percent are in school at age 11, then 10 percent of children must havedropped out between age 10 and 11.
Assume that for any age, a < amax individuals never leave work anda � amax individuals never begin work. This implies that at age amax,everyone who ever will work is working. This assumption, which is lessrealistic than the previous one, means that exit from employmentoccurs before amax and exit from inactivity occurs before amax. Denotework by W, and denote the probability of entry into work at age a by EWa.This equation is the increase in participation from one year to the other:
EWa = P(Wa+1) − P(Wa) a < amax. (6A.2)
Equation (6A.2) states that if, say, 10 percent of children are in work atage 14, and 15 percent are in work at age 15, then 5 percent of childrenmust have started to work between the ages of 14 and 15.
One problem with these indicators is that many individuals do notenter school and many, particularly females, do not transition into work,if work is defined as participation in a market-oriented economic activity.These indexes are thus conditional on individuals ever transiting into therelevant state. Under the assumptions above, the average school-leavingage conditional on ever having been in school is
E(SL) = Sa > amina [SLa/P(Samin
)] (6A.3)
and the distribution of age of entry into work is
E(EW) = Sa < amaxa [EWa/P(Wamax
)]. (6A.4)
Notice that P(Wamax) = Sa < amax
EWa, hence Sa < amax[EWa/P(Wamax
)] = 1.
Similar reasoning applies to the weights in equation (6A.3).An index of the average gap between the age of entry into work
(conditional on ever entering into work) and the age of exit from school(conditional on ever being in school) is given by
I = E(SL) − E(EW). (6A.5)
A probit model was fitted (separately for males and females in eachcountry) on the probability of being in school. The model was regressedon a polynomial in age. Fitting a probit model is useful for smoothing theage participation profiles in the presence of measurement error and small
The Three Pillars of Policy: Lessons from International Experience 77
WB62_YALM_CH06 3/12/08 1:20 PM Page 77

sample sizes, and it allows sample predictions to be made if necessary.Thevalue amin is identified as the turning point in the estimated age participa-tion profile. The same procedure is carried out for the probability ofworking. The estimated probabilities are used to compute the indicatorsin equations (6A.3), (6A.4), and (6A.5).
This procedure has several drawbacks. First, although it is generallypossible to ascertain whether individuals in work ever attended school,it is generally not possible to know whether those who attend schoolwill ever get jobs. The index in equation (6A.5) is, then, the averageage gap for individuals who enter work after leaving school (the trueschool-to-work transition age gap) only under the assumption that ageof exit from school is uncorrelated with the probability of entering intowork later in the life cycle, an assumption that some may not find com-pelling. If early school leavers are less likely to eventually find a job, thegap will be overestimated; if they are more likely to find a job, the gapwill be underestimated.
A second drawback of this procedure when applied to a single cross-section is that the index is derived from a comparison of individuals ofdifferent ages at a given time and hence from different birth cohorts. Thedirection and magnitude of the bias are difficult to determine. If there isa secular increase in school-leaving age without relevant changes in theage of first employment across cohorts, the length of the transitionperiod from school to work in each country may be underestimated. Ifthe age of first employment also shows a secular increase, the bias couldgo in either direction. If these biases are assumed to be similar across coun-tries, a sensible inference can be made about cross-country differences.
Annex 6B. Inventory of Selected Policies and Programs on YouthEmployment and Skills Development in Burkina Faso
Government Involvement in Youth Employment Issues
In November 2004 the government established a National Agency forEmployment. The new agency’s functions include the following:
• Studying the problems of employment, apprenticeship, and profes-sional training and maintaining relevant documentation.
• Organizing a system of labor market intermediation and information.• Promoting self-employment and the emergence of viable micro-,
small, and medium-size enterprises.
78 Garcia and Fares
WB62_YALM_CH06 3/12/08 1:20 PM Page 78

• Initiating and implementing programs that help young people makethe transition to employment.
• Identifying the needs and possibilities for apprenticeship and trainingand implementing a policy of orientation and information for poten-tial participants.
• Renovating existing systems and creating new systems for training andapprenticeship.
• Organizing and implementing recruitment of people for overseasemployment.
Description of Policies and Programs
This inventory of policies and programs on youth in Burkina Fasodescribes 28 interventions (table 6B.1). It is a selective rather than a com-prehensive inventory.
Making the Labor Market Work Better for Young PeopleThe first category of interventions includes only public works programsin Burkina Faso. These six programs are:
• The special program of labor-intensive public works (PSTP/HIMO)• The pilot urban infrastructure project at Kaya (BKF/90/02M/BEL)• The public works program for employment executed by the Faso
Baara agency (TIPE)• The projects of the labor-intensive fund (HIMO)• The street cleaning teams project in Ouagadougou• The community participation component of the third urban project
(BKF/94/06)
None of these programs specifically targets young people, and onlyone of them is confined to rural areas.
Improving Opportunities for Young Entrepreneurs This is by far the largest category of interventions in Burkina Faso. The16 projects examined in this category are:
• The promotion of female artisans• The fund in support of the informal sector (FASI)• The employment promotion fund (FAPE)• The national program for the redeployment of laid-off workers
(PNAR-TD)
The Three Pillars of Policy: Lessons from International Experience 79
WB62_YALM_CH06 3/12/08 1:20 PM Page 79
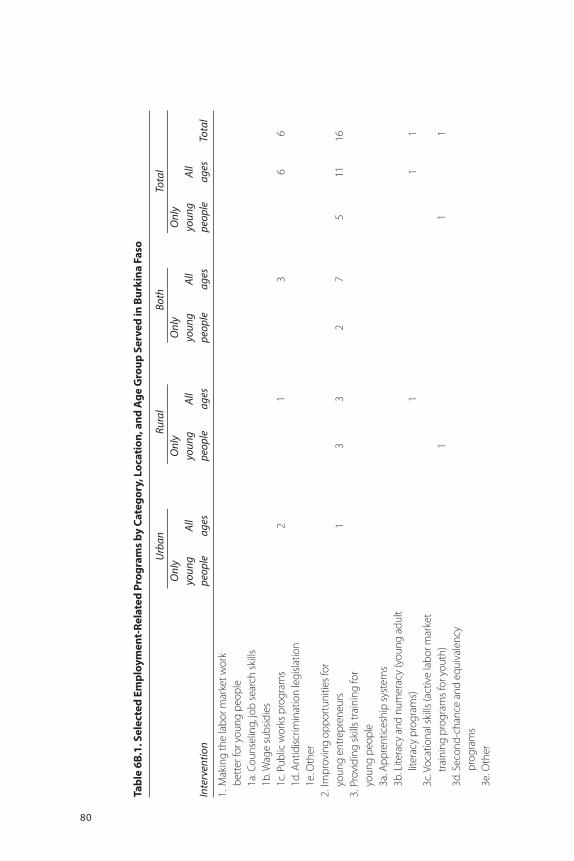
Tab
le 6
B.1
. Sel
ecte
d E
mp
loym
ent-
Rel
ated
Pro
gra
ms
by
Cat
egor
y, L
ocat
ion
, an
d A
ge
Gro
up S
erve
d in
Bur
kin
a Fa
so
Urb
anRu
ral
Both
Tota
lO
nly
Onl
y O
nly
Onl
y yo
ung
All
youn
gA
llyo
ung
All
youn
gA
llIn
terv
entio
npe
ople
ages
peop
leag
espe
ople
ages
peop
leag
esTo
tal
1.M
akin
g th
e la
bor m
arke
t wor
k be
tter
for y
oung
peo
ple
1a. C
ouns
elin
g, jo
b se
arch
ski
lls1b
. Wag
e su
bsid
ies
1c. P
ublic
wor
ks p
rogr
ams
21
36
61d
. Ant
idisc
rimin
atio
n le
gisla
tion
1e. O
ther
2.Im
prov
ing
oppo
rtun
ities
for
youn
g en
trep
rene
urs
13
32
75
1116
3.Pr
ovid
ing
skill
s tr
aini
ng fo
r yo
ung
peop
le3a
. App
rent
ices
hip
syst
ems
3b. L
itera
cy a
nd n
umer
acy
(you
ng a
dult
liter
acy
prog
ram
s)1
11
3c. V
ocat
iona
l ski
lls (a
ctiv
e la
bor m
arke
t tr
aini
ng p
rogr
ams
for y
outh
)1
11
3d. S
econ
d-ch
ance
and
equ
ival
ency
pr
ogra
ms
3e. O
ther
80
WB62_YALM_CH06 3/12/08 1:20 PM Page 80

81
4. M
akin
g tr
aini
ng s
yste
ms
wor
kbe
tter
for y
oung
peo
ple
4a. I
nfor
mat
ion
4b. C
redi
t (to
indi
vidu
als
or e
nter
prise
s)4c
. Fin
anci
al in
cent
ives
(sub
sidie
s, vo
uche
rs)
4d. O
ther
5. P
rogr
ams
to c
ount
erac
t the
isol
atio
nof
disa
dvan
tage
d yo
ung
peop
le5a
. Tra
nspo
rtat
ion
5b. O
ther
6.Im
prov
ing
labo
r mar
ket r
egul
atio
ns to
the
bene
fit o
f you
ng p
eopl
e7.
Prog
ram
s fo
r ove
rsea
s em
ploy
men
tof
you
ng p
eopl
e8.
Com
preh
ensiv
e m
ultip
le-s
ervi
ce
appr
oach
22
29.
Oth
er, i
nclu
ding
vol
unta
ry n
atio
nal
serv
ice
prog
ram
s1
12
2U
ncla
ssifi
edTo
tal
03
57
310
820
28
Sour
ce:G
odfre
y 20
06.
WB62_YALM_CH06 3/12/08 1:20 PM Page 81

• The fund in support of income-earning activities for women (FAARF)• The project in support of creating small- and medium-size enterprises
(PAPME)• Two programs to retain young people in their home regions (PDI-SYP
6ème FED and BKF/98/006)• Centers for agropastoral development• The fund for the insertion of young people (FIJ)• The project in support of poverty reduction among disadvantaged and
marginalized young people (REPAGE)• The project in support of micro and small handcraft enterprises (PER-
COMM)• The project in support of rural microenterprises (PAMER)• The national karite project (PNK)• The fund in support of income-generating activities in agriculture
(FAAGRA)• Various interventions by the system for decentralized finance (SFD)
Only five of these interventions specifically target young people, andonly six are confined to rural areas.
Making Training Systems Work Better for Young PeopleFew interventions in Burkina Faso focus on skills training (althoughentrepreneurship programs often include some training). The ZANUproject is a literacy program for rural areas that aims to create permanentlearning centers and libraries and to boost employment. The only othertraining program is a rural program that trains women in agriculture,animal husbandry, dressmaking, dyeing, and weaving.
Other InterventionsNo interventions in categories 4–7 are examined in the case of BurkinaFaso. Burkina Faso has two comprehensive multiple-service projects, one(PAICB/ LCP) in support of communal initiatives in the struggle againstpoverty, the other (PRPC) aimed at reducing poverty at the level of thecommunity.Two voluntary service programs for young people (productionbrigades and the national service for development) are also in place.
How Well Have Interventions Performed?
A high proportion of interventions can be classified as having had a strongpositive impact in the labor market (table 6B.2; Ouedraogo 2005). Publicworks programs performed well in terms of providing immediate employ-ment, raising incomes, and improving the local economy; longer-term
82 Garcia and Fares
WB62_YALM_CH06 3/12/08 1:20 PM Page 82

impact in future employability is likely to depend on how the experiencetransfers into skills needed by the economy. Among the entrepreneurshipprojects, two stand out: the fund in support of income-earning activitiesfor women (FAARF), which significantly increased women’s access tocredit, and the second program to retain young people in their homeregions (BKF/98/006), which successfully linked them with the bankingand microfinance system. The ZANU project receives a good rating for itscombination of literacy, training, and finance, despite financial and organi-zational constraints. The two multiple-service interventions seem to havehad a substantial impact on participants’ incomes.
Only a third of interventions are oriented toward the disadvantaged.Five of the entrepreneurship projects target women, and one (REPAGE,the project in support of poverty reduction among disadvantaged andmarginalized young people) targets the poor. The two comprehensivemultiple-service projects are oriented toward the poor, while the nationalservice program focuses on the less educated.
Only 29 percent of interventions are youth specific, and 57 percentare countrywide or urban rather than limited to rural areas. This focusmay reflect the higher incidence of unemployment in urban areas.
All but one project in Burkina Faso was evaluated (table 6B.3).Evaluations, however, measured only outcomes; impact (comparing
The Three Pillars of Policy: Lessons from International Experience 83
Table 6B.2. Quality of Employment-Related Interventions in Burkina Faso
Intervention 0 1 2 3 Unknown Total
1. Making the labor market work better for young people1c. Public works programs 2 4 6
2. Improving opportunities for young entrepreneurs 13 2 1 16
3. Providing skills training for young people3b. Literacy and numeracy (young adult
literacy programs) 1 13c. Vocational skills (active labor market
training programs for youth) 1 18. Comprehensive multiple-service approach 2 29. Other, including voluntary national service
programs 2 2Total 18 9 1 28
Sources: Godfrey 2006; Ouedraogo 2005. Note: 0 = Program had negative or zero impact in the labor market (even though outcomes may have been positive).1 = Program had positive impact in the labor market.2 = Program had strong positive impact in the labor market.3 = Program’s positive impact exceeded its cost.Unknown = Program not reviewed by this study.
WB62_YALM_CH06 3/12/08 1:20 PM Page 83
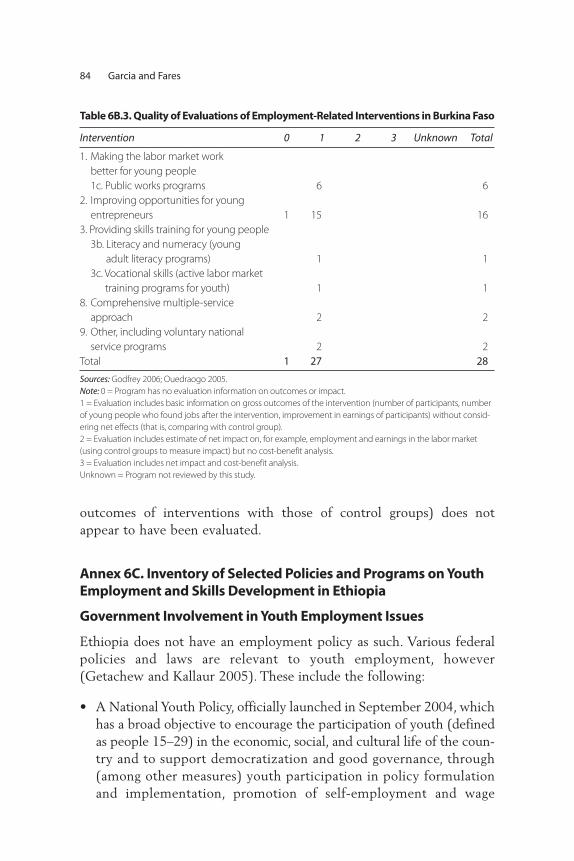
outcomes of interventions with those of control groups) does notappear to have been evaluated.
Annex 6C. Inventory of Selected Policies and Programs on YouthEmployment and Skills Development in Ethiopia
Government Involvement in Youth Employment Issues
Ethiopia does not have an employment policy as such. Various federalpolicies and laws are relevant to youth employment, however(Getachew and Kallaur 2005). These include the following:
• A National Youth Policy, officially launched in September 2004, whichhas a broad objective to encourage the participation of youth (definedas people 15–29) in the economic, social, and cultural life of the coun-try and to support democratization and good governance, through(among other measures) youth participation in policy formulationand implementation, promotion of self-employment and wage
84 Garcia and Fares
Table 6B.3. Quality of Evaluations of Employment-Related Interventions in Burkina Faso
Intervention 0 1 2 3 Unknown Total
1. Making the labor market work better for young people1c. Public works programs 6 6
2. Improving opportunities for young entrepreneurs 1 15 16
3. Providing skills training for young people3b. Literacy and numeracy (young
adult literacy programs) 1 13c. Vocational skills (active labor market
training programs for youth) 1 18. Comprehensive multiple-service
approach 2 29. Other, including voluntary national
service programs 2 2Total 1 27 28
Sources: Godfrey 2006; Ouedraogo 2005. Note: 0 = Program has no evaluation information on outcomes or impact.1 = Evaluation includes basic information on gross outcomes of the intervention (number of participants, numberof young people who found jobs after the intervention, improvement in earnings of participants) without consid-ering net effects (that is, comparing with control group).2 = Evaluation includes estimate of net impact on, for example, employment and earnings in the labor market(using control groups to measure impact) but no cost-benefit analysis.3 = Evaluation includes net impact and cost-benefit analysis.Unknown = Program not reviewed by this study.
WB62_YALM_CH06 3/12/08 1:20 PM Page 84

The Three Pillars of Policy: Lessons from International Experience 85
employment, creation of conditions for young people in rural areas toacquire land, reduction in disparities in educational participation bylocation and gender, and provision of education to out-of-school youth.
• The 2003 Labor Law, which defines the conditions for apprenticeships(for those 14 and older) and layoffs.
• An education policy, established in 1994, and an Education SectorDevelopment Program for 2005–10 that shift the post-grade-10 sys-tem toward technical and vocational education and training, in thehope of facilitating the school-to-work transition.
• A Micro- and Small Enterprises Development Strategy, formulated in1997, which gives priority to enterprises operated by women, schooldropouts, people with disabilities, and unemployed youth.
Description of Policies and Programs
This inventory of policies and programs on youth in Ethiopia describes13 interventions (table 6C.1). It is a selective rather than a comprehen-sive inventory.
Making the Labor Market Work Better for Young PeopleEthiopia has several employment exchange services, run by both publicand private operators. The main program is run by the regional Bureausof the Ministry of Labor and Social Affairs (BOLSAs). The number ofbeneficiaries is small, with just 24,000 job seekers registered in 2001/02.The program is not youth specific, but 84 percent of those registeredwere 15–29, nearly two-thirds of them with at least senior-secondaryeducation. Forty-nine regional public employment services offices offersimilar services. Private employment exchange offices have also emergedin Ethiopia, governed by the Private Employment Agencies Proclamation.
A variety of public works programs are in place, including the ProductiveSafety Nets program.Although youth participate in public works programs,the programs do not specifically target youth, and detailed data on benefi-ciaries are not available.
Legal provisions in Ethiopia protect the rights of people withHIV/AIDS. These provisions cover nondiscrimination in employment.
Improving Opportunities for Young EntrepreneursThe main government programs to encourage entrepreneurship are runby the federal Micro- and Small Enterprise Development Agencythrough its regional offices (ReMSEDAs). The ReMSEDAs vary in size
WB62_YALM_CH06 3/12/08 1:20 PM Page 85

Tab
le 6
C.1
. Sel
ecte
d E
mp
loym
ent-
Rel
ated
Pro
gra
ms
by
Cat
egor
y, L
ocat
ion
, an
d A
ge
of G
roup
Ser
ved
in E
thio
pia
Urb
anRu
ral
Both
Tota
lO
nly
Onl
y O
nly
Onl
y yo
ung
All
youn
gA
llyo
ung
All
youn
gA
llIn
terv
entio
npe
ople
ages
peop
leag
espe
ople
ages
peop
leag
esTo
tal
1.M
akin
g th
e la
bor m
arke
t wor
k be
tter
for y
oung
peo
ple
1a. C
ouns
elin
g, jo
b se
arch
ski
lls3
33
1b. W
age
subs
idie
s1c
. Pub
lic w
orks
pro
gram
s1
11
1d. A
ntid
iscrim
inat
ion
legi
slatio
n1
11
1e. O
ther
2.Im
prov
ing
oppo
rtun
ities
for
youn
g en
trep
rene
urs
11
22
3.Pr
ovid
ing
skill
s tr
aini
ng fo
r yo
ung
peop
le3a
. App
rent
ices
hip
syst
ems
11
13b
. Lite
racy
and
num
erac
y (y
oung
adu
lt lit
erac
y pr
ogra
ms)
11
13c
. Voc
atio
nal s
kills
(act
ive
labo
r mar
ket
trai
ning
pro
gram
s fo
r you
th)
11
22
3d. S
econ
d-ch
ance
and
eq
uiva
lenc
y pr
ogra
ms
3e. O
ther
86
WB62_YALM_CH06 3/12/08 1:20 PM Page 86

4.M
akin
g tr
aini
ng s
yste
ms
wor
k be
tter
for y
oung
peo
ple
4a. I
nfor
mat
ion
4b. C
redi
t (to
indi
vidu
als
or e
nter
prise
s)4c
. Fin
anci
al in
cent
ives
(sub
sidie
s, vo
uche
rs)
4d. O
ther
5.Pr
ogra
ms
to c
ount
erac
t the
isol
atio
n of
disa
dvan
tage
d yo
ung
peop
le5a
. Tra
nspo
rtat
ion
5b. O
ther
11
16.
Impr
ovin
g la
bor m
arke
t reg
ulat
ions
to th
e be
nefit
of y
oung
peo
ple
7.Pr
ogra
ms
for o
vers
eas
empl
oym
ent
of y
oung
peo
ple
11
18.
Com
preh
ensiv
e m
ultip
le-s
ervi
ce a
ppro
ach
9.O
ther
, inc
ludi
ng v
olun
tary
nat
iona
l se
rvic
e pr
ogra
ms
Unc
lass
ified
Tota
l2
11
11
74
913
Sour
ces:
God
frey
2006
; Get
ache
w a
nd K
alla
ur 2
005.
87
WB62_YALM_CH06 3/12/08 1:20 PM Page 87

and type of programs offered. The Addis Ababa and Dire DawaReMSEDAs provide a package of services, including access to work prem-ises, credit, information, and counseling; advice on marketing, businessdevelopment, and technology; help obtaining licenses; and legal support.The ReMSEDAs include unemployed youth and women among theirclients as well as existing business owners. The Addis Ababa ReMSEDAtargets unemployed youth and women (though not exclusively).
Microfinance institutions, which operate in all but three regions inEthiopia, assist young entrepreneurs by providing microcredit.Comprehensive data on borrowers are not available, and youth are notexplicitly targeted for loans, making it difficult to assess the impact onyouth entrepreneurship. Microfinance institutions are believed to meetonly a small fraction of demand.
Providing Skills Training for Young PeopleA variety of schools provide skills training for young people. TheMinistry of Education’s formal technical and vocational education andtraining (TVET) system offers an alternative to the academic programsof traditional secondary schools. Including public as well as privateschools operating under the formal Ministry of Education guidelines,there were 158 TVET schools in Ethiopia in 2004.
The Ministry of Agriculture runs a separate formal agricultural TVETprogram. In addition to the formal TVET schools, the Ministry of Educationoperates adult and nonformal education programs for all ages, focusing onliteracy and numeracy skills. Privately run nonformal education programs,such as those by the German NGO IIZ/DVV, are also available. Someyouth receive training by serving as apprentices in the private sector.
Other InterventionsEthiopia’s 25 licensed microfinance institutions provide credit to indi-viduals. Hundreds of civil society organizations work on youth-relatedissues. Most of these organizations focus on HIV/AIDS and thereforefall outside the scope of this report. However, some organizations, suchas the Addis Ababa Youth Association (and its counterparts in otherregions), organize a variety of programs for members, including skillstraining programs.
The Ethiopian Labor Law stipulates that an Ethiopia national may beemployed abroad if the Ministry of Labor and Social Affairs “hasobtained adequate assurances that his [or her] right and dignity shall berespected in the country of employment.” In accordance with this law,
88 Garcia and Fares
WB62_YALM_CH06 3/12/08 1:20 PM Page 88

The Three Pillars of Policy: Lessons from International Experience 89
work permits are given to Ethiopians whose employment contracts aresubmitted to the ministry. About 5,000 people were given permits towork abroad in 2001/02, suggesting that only a small fraction of migrantsapply for work permits. Of those who went through the formal process,most were relatively well-educated young women who were relocatingto Saudi Arabia and Lebanon to work as domestics.
How Well Have Interventions Performed?
In the absence of proper evaluations, it is almost impossible to assess thequality of the interventions. However, two efforts stand out (table 6C.2).The Hope Enterprise vocational training centers appear to have had animpact exceeding their cost. The nonformal training courses run by theGerman NGO IIZ/DVV using government community skills trainingcenters are based on extensive market analysis and needs assessment inthe local area and are likely to have had a strong positive impact. Two
Table 6C.2. Quality of Employment-Related Interventions in Ethiopia
Intervention 0 1 2 3 Unknown Total
1. Making the labor market work better for young people1a. Counseling, job search skills 1 11c. Public works programs1d. Antidiscrimination legislation
2. Improving opportunities for young entrepreneurs 2 1 3
3. Providing skills training for young people3a. Apprenticeship systems3b. Literacy and numeracy (young
adult literacy programs)3c. Vocational skills (active labor market
training programs for youth) 1 1 1 1 1 55. Programs to counteract isolation of
disadvantaged young people5b. Other 1 1 2
7. Programs for overseas employmentof young people 1 1
Total 2 3 1 1 5 12
Source: Godfrey 2006.Note: 0 = Program had negative or zero impact in the labor market (even though outcomes may have been positive).1 = Program had positive impact in the labor market.2 = Program had strong positive impact in the labor market.3 = Program’s positive impact exceeded its cost.Unknown = Program not reviewed by this study.
WB62_YALM_CH06 3/12/08 1:20 PM Page 89

90 Garcia and Fares
other training interventions, the Entoto Technical and VocationalEducation Training College and the Selam Technical and VocationalCenter, and the Addis Ababa and Dire Dawa ReMSEDAs also seem likelyto have had a positive impact.
The impact of the other seven interventions on young people’s jobopportunities is more difficult to assess. Public works programs arebelieved to be highly beneficial from a safety net perspective, but impactevaluations have not yet been conducted and the long-term effect on theemployability of participants is unclear.
Some programs target women, although data on actual beneficiariesare scarce.The Addis Ababa ReMSEDA targets female entrepreneurs, andsome microfinance institutions target women. Scholarships, often spon-sored by nongovernmental organizations (NGOs), help some of the poorest
Table 6C.3. Quality of Evaluations of Employment-Related Programs in Ethiopia
Intervention 0 1 2 3 Unknown Total
1. Making the labor market work better for young people 1 11a. Counseling, job search skills 1 2 51c. Public works programs1d. Antidiscrimination legislation
2. Improving opportunities for young entrepreneurs 1 1 2
3. Providing skills training for young people3a. Apprenticeship systems3b. Literacy and numeracy (young
adult literacy programs)3c. Vocational skills (active labor market
training programs for youth) 1 3 45. Programs to counteract isolation
of disadvantaged young people5b. Other 1 1
7. Programs for overseas employmentof young people 1 1
Total 6 4 3 13
Source: Godfrey 2006.Note: 0 = Program has no evaluation information on outcomes or impact.1 = Evaluation includes basic information on gross outcomes of the intervention (number of participants, numberof young people who found jobs after the intervention, improvement in earnings of participants) without consid-ering net effects (that is, comparing with control group).2 = Evaluation includes estimate of net impact on, for example, employment and earnings in the labor market(using control groups to measure impact) but no cost-benefit analysis.3 = Evaluation includes net impact and cost-benefit analysis.Unknown = Program not reviewed by this study.
WB62_YALM_CH06 3/12/08 1:20 PM Page 90

attend training programs, as does the fee structure of the formal TVETsystem. Nonformal training courses (second-chance programs designed toprovide basic skills) target relatively poor and vulnerable groups.
Information with which to evaluate the effectiveness of programs forEthiopian youth is scarce and appears limited to information on outcomesand beneficiaries (table 6C.3). The full evaluation of technical andvocational education programs reportedly underway will be very welcome.
Annex 6D. Inventory of Selected Policies and Programs on YouthEmployment and Skills Development in Tanzania
Government Involvement in Youth Employment Issues
A number of recent policy documents in Tanzania address youthemployment (Shitundu 2005). The Vision 2025 document provides aguide to addressing overall and youth employment challenges throughcreative, innovative, and high-quality education and the establishment ofa culture of self-development and entrepreneurship, especially amongyoung people.
The National Strategy for Growth and Reduction of Poverty (November2004) aims to halve the proportion of the population living below the basic needs and food poverty lines and to reduce youth unemployment by50 percent by 2010. The strategy includes the following:
• Implementing strategies that promote employment creation and self-employment. Such strategies include investment tax incentives, espe-cially to training institutions; microfinance; curriculum reform; andskill development.
• Promoting community-based construction and maintenance of roads.• Increasing public investment and promoting private sector investment
in key sectors of the economy.• Strengthening institutional and individual capacity for the efficient
coordination of employment policy.• Developing apprenticeship and entrepreneurship programs targeting
young people.• Reforming and enforcing laws that increase opportunities for youth
employment in both the formal and informal sectors.• Maintaining the policy of free primary school education to encourage
universal access to education for all children.• Providing young people with life skills education, including education
about HIV/AIDS.
The Three Pillars of Policy: Lessons from International Experience 91
WB62_YALM_CH06 3/12/08 1:20 PM Page 91

Tanzania has also developed a National Youth Development Policy,which addresses in a participatory way the range of problems faced byyoung people, including employment.
Description of Policies and Programs
This inventory of policies and programs on youth in Tanzania describes28 interventions (table 6D.1). It is a selective rather than a comprehen-sive inventory.
Making the Labor Market Work Better for Young PeopleTanzania provides information and counseling through the LaborExchange Center. It runs two public works programs, the Dar es SalaamSolid Waste Management Project and the Municipal Service DeliveryProject, both innovative public-private partnership projects. Tanzaniadoes not appear to have used wage subsidies or antidiscrimination legis-lation, which are sometimes used to help make labor markets work betterfor women, ethnic minorities, and people with disabilities.
Improving Opportunities for Young EntrepreneursThe second category of interventions is the largest in Tanzania, accountingfor more than half of the programs reviewed in table 6D.1. These pro-grams include microfinance programs run by the government alone, suchas the National Youth Development Fund; programs run by NGOs, suchas FINCA Tanzania (the second-largest such program in Africa);programs run by the government together with donors, such as theNational Income-Generating Program; and programs run by commercialbanks. Some programs in this category, such as the Tanzania GatsbyTrust, are described as entrepreneurship programs; others, such as theYouth Economic Groups program, are described as microenterprisedevelopment programs.
Providing Skills Training for Young PeopleThe third category of interventions includes the national apprenticeshipprogram and other programs run by the Vocational Education and TrainingAuthority (VETA), an information and communication technology-based program based in Ilonga, and a second-chance ComplementaryBasic Education in Tanzania (COBET) program aimed at out-of-schoolchildren as old as 18. No specific literacy/numeracy programs were iden-tified, although COBET includes literacy and numeracy components.
92 Garcia and Fares
WB62_YALM_CH06 3/12/08 1:20 PM Page 92

Tab
le 6
D.1
. Sel
ecte
d E
mp
loym
ent-
Rel
ated
Pro
gra
ms
by
Cat
egor
y, L
ocat
ion
, an
d A
ge
Gro
up S
erve
d in
Tan
zan
ia
Urb
anRu
ral
Both
Tota
lO
nly
Onl
y O
nly
Onl
y yo
ung
All
youn
gA
llyo
ung
All
youn
gA
llIn
terv
entio
npe
ople
ages
peop
leag
espe
ople
ages
peop
leag
esTo
tal
1.M
akin
g th
e la
bor m
arke
t wor
k be
tter
for y
oung
peo
ple
1a. C
ouns
elin
g, jo
b se
arch
ski
lls1
11
1b. W
age
subs
idie
s1c
. Pub
lic w
orks
pro
gram
s2
11
44
1d. A
ntid
iscrim
inat
ion
legi
slatio
n1e
. Oth
er2.
Impr
ovin
g op
port
uniti
es fo
r you
ngen
trep
rene
urs
312
312
153.
Prov
idin
g sk
ills
trai
ning
for y
oung
peo
ple
3a. A
ppre
ntic
eshi
p sy
stem
s1
11
3b. L
itera
cy a
nd n
umer
acy
(you
ng a
dult
liter
acy
prog
ram
s)3c
. Voc
atio
nal s
kills
(act
ive
labo
r mar
ket
trai
ning
pro
gram
s fo
r you
th)
11
11
23d
. Sec
ond-
chan
ce a
nd e
quiv
alen
cy
prog
ram
s1
11
3e. O
ther
93
(con
tinue
d)
WB62_YALM_CH06 3/12/08 1:20 PM Page 93

Tab
le 6
D.1
. Sel
ecte
d E
mp
loym
ent-
Rel
ated
Pro
gra
ms
by
Cat
egor
y, L
ocat
ion
, an
d A
ge
Gro
up S
erve
d in
Tan
zan
ia (c
ontin
ued)
Urb
anRu
ral
Both
Tota
lO
nly
Onl
y O
nly
Onl
y yo
ung
All
youn
gA
llyo
ung
All
youn
gA
llIn
terv
entio
npe
ople
ages
peop
leag
espe
ople
ages
peop
leag
esTo
tal
4.M
akin
g tr
aini
ng s
yste
ms
wor
k be
tter
for
youn
g pe
ople
4a. I
nfor
mat
ion
4b. C
redi
t (to
indi
vidu
als
or e
nter
prise
s)4c
. Fin
anci
al in
cent
ives
(sub
sidie
s, vo
uche
rs)
11
14d
. Oth
er5.
Prog
ram
s to
cou
nter
act t
he is
olat
ion
of
disa
dvan
tage
d yo
ung
peop
le5a
. Tra
nspo
rtat
ion
5b. O
ther
11
16.
Impr
ovin
g la
bor m
arke
t reg
ulat
ions
to
the
bene
fit o
f you
ng p
eopl
e7.
Prog
ram
s fo
r ove
rsea
s em
ploy
men
t of
youn
g pe
ople
1
11
8.Co
mpr
ehen
sive
mul
tiple
-ser
vice
app
roac
h1
11
9.O
ther
, inc
ludi
ng v
olun
tary
nat
iona
l se
rvic
e pr
ogra
ms
Unc
lass
ified
Tota
l0
20
18
178
2028
Sour
ce: G
odfre
y 20
06.
94
WB62_YALM_CH06 3/12/08 1:20 PM Page 94

The Three Pillars of Policy: Lessons from International Experience 95
Making Training Systems Work Better for Young PeopleThe single program in this category is the formal sector skill develop-ment levy/grant scheme. This scheme gives enterprises an incentive totrain their employees by reimbursing their costs from a levy fund.
Other InterventionsThe Livelihood Skills Development Program is concerned mainly withreducing risk-taking behavior, with particular emphasis on HIV/AIDSand drug abuse, and promoting healthy lifestyles. No attempts appear tohave been made to make labor market regulations more hospitable toyoung people (by lowering minimum wages for younger workers andtrainees, for example, or relaxing employment security regulations). Theprogram for overseas employment of young people is not a migrantworker program along Asian lines but rather a set of small-scale youthexchange programs. The comprehensive multiple-service approach ispart of an International Labour Organization project to promote genderequality and decent work.
How Well Have Interventions Performed?
Based on the limited information available, the quality of the programsappears to have been poor (table 6D.2). Only one intervention—theFINCA microfinance program, which targets poor families—is believedto have had an impact that exceeded its cost, and it is not clear how
Table 6D.2. Quality of Employment-Related Interventions in Tanzania
Intervention 0 1 2 3 Unknown Total
1. Making the labor market work better for young people1a. Counseling, job search skills 1 11c. Public works programs 2 2 4
2. Improving opportunities for young entrepreneurs 1 7 2 1 4 15
3. Providing skills training for young people3a. Apprenticeship systems 1 13c. Vocational skills (active labor market
training programs for youth) 1 1 23d. Second-chance and equivalency
programs 1 1
(continued)
WB62_YALM_CH06 3/12/08 1:20 PM Page 95

96 Garcia and Fares
many young people benefited from the program. Six programs—twoentrepreneurship programs (PRIDE Tanzania and the Youth EconomicGroups); three skills training programs (apprenticeship, information andcommunication technology training, and COBET); and the LivelihoodSkills Development Program—are judged to have had a strong positiveimpact.Thirteen programs are likely to have had a positive impact that didnot exceed their costs, while one credit program (the Local GovernmentYouth and Women Development Funds) seems likely to have had noimpact. The impact of the unevaluated levy/grant scheme is not known,but the scheme is unpopular with enterprises.
Less than 30 percent of the programs reviewed (mainly credit andtraining programs) specifically target young people, and only one program(a public works programs) targets rural areas, where the vast majority ofTanzania’s young people live. A relatively small proportion of interven-tions are oriented toward the disadvantaged: seven programs (mainlycredit and public works) target women, three target the poorest youth,and one targets the least educated youth. No programs appear to beavailable for young people with disabilities.
Evaluation of the programs has been weak or nonexistent (table 6D.3).No evaluation information is available on 5 interventions, the situationfor 3 is unknown, and the remaining 20 report only on outcomes ratherthan impact.
Table 6D.2. Quality of Employment-Related Interventions in Tanzania (continued)
Intervention 0 1 2 3 Unknown Total
4. Making training systems work better for young people4c. Financial incentives (subsidies,
vouchers) 1 15. Programs to counteract the isolation
of disadvantaged young people5b. Others 1 1
7. Programs for overseas employmentof young people 1 1
8. Comprehensive multiple-service approach 1 1Total 1 13 6 1 7 28
Source: Godfrey 2006.Note: 0 = Program had negative or zero impact in the labor market (even though outcomes may have been positive).1 = Program had positive impact in the labor market.2 = Program had strong positive impact in the labor market.3 = Program positive impact exceeded its cost.Unknown = Program not reviewed by this study.
WB62_YALM_CH06 3/12/08 1:20 PM Page 96

The Three Pillars of Policy: Lessons from International Experience 97
Table 6D.3. Quality of Evaluations of Employment-Related Programs in Tanzania
Intervention 0 1 2 3 Unknown Total
1. Making the labor market work better for young people1a. Counseling, job search skills 1 11c. Public works programs 2 2 4
2. Improving opportunities for young entrepreneurs 1 11 3 15
3. Providing skills training for young people3a. Apprenticeship systems 1 13c. Vocational skills (active labor
market training programs for youth) 1 1 23d. Second-chance and equivalency
programs 1 14. Making training systems work better
for young people
4c. Financial incentives (subsidies, vouchers) 1 1
5. Programs to counteract the isolation of disadvantaged young people5b. Other 1 1
7. Programs for overseas employment of young people 1 1
8. Comprehensive multiple-service approach 1 1Total 5 20 3 28
Source: Godfrey 2006.Note: 0 = Program has no evaluation information on outcomes or impact.1 = Evaluation includes basic information on gross outcomes of the intervention (number of participants, numberof young people who found jobs after the intervention, improvement in earnings of participants) without consid-ering net effects (that is, comparing with control group).2 = Evaluation includes estimate of net impact on, for example, employment and earnings in the labor market(using control groups to measure impact) but no cost-benefit analysis.3 = Evaluation includes net impact and cost-benefit analysis.Unknown = Program not reviewed by this study.
Annex 6E. Inventory of Selected Policies and Programs on YouthEmployment and Skills Development in Uganda
The review for Uganda did not include a detailed inventory of interven-tions; analysis comparable to that in annexes 6B–D was thus not possible.Instead, this annex presents the results of a review of policies and programsaffecting youth in Uganda.
Uganda has a wide range of plans, policies, and programs that affectyouth employment. These include the following:
• Vision 2025, which provides a long-term perspective and aims to createa “highly trained, competent and knowledgeable labor force that is
WB62_YALM_CH06 3/12/08 1:20 PM Page 97

98 Garcia and Fares
motivated, responsible, efficient, enterprising, innovative, and indus-trious” and that can find “secure and well-remunerated employment.”
• A Poverty Eradication Action Plan (PEAP), most recently revised in2004, which deals with employment issues in some of its pillars—production, competitiveness, and incomes (especially improving thefunctioning of the labor market and the productivity of workers) andhuman development (especially education and skill development).
• A National Adult Literacy Strategic Investment Plan, 2002/3–2006/7,part of Uganda’s Poverty Eradication Action Plan, which aims to increaseliteracy levels by 50 percent over the plan period.
• The promotion of youth participation in decision making, through theestablishment of a National Youth Council (which has developed astrategic investment plan for 2004–07) and youth representation inlocal councils and parliament.
• A 1992 White Paper on Education, which remains the guiding docu-ment for the sector. This document has found practical expression inan Education Sector Strategic Plan, 2004–15, which emphasizes post-primary vocational training institutions and community polytechnics,and a 2003 Policy for Business, Technical, Vocational Education andTraining (BTVET).
• An Orphans and Vulnerable Children Policy, 2005, which shifts thefocus from helping individual orphans to helping the households inwhich they live, by providing microfinance to grow economicallyviable crops and other interventions.
• A Plan for Modernization of Agriculture, 2000–20, which aims toincrease agricultural productivity and shift farmers from producingprimarily for subsistence to producing for the market to the benefit ofoff-farm employment.
• A Social Development Sector Strategic Investment Plan, 2003–08, inwhich youth is one of the groups of special concern.The plan includesthe promotion of employment and productivity.
Only four interventions have been analyzed in any detail (Okech2005). They include the following:
• The Youth Entrepreneurs Scheme, which improves opportunities foryoung entrepreneurs.
• The Promotion of Children and Youth program, which also improvesopportunities for young entrepreneurs.
WB62_YALM_CH06 3/12/08 1:20 PM Page 98

The Three Pillars of Policy: Lessons from International Experience 99
• The Program for the Promotion of Employment-Oriented Vocationaland Technical Training (PEVOT), which provides vocational skilltraining to young people.
• Basic Education in Urban Poverty Areas (BEUPA), which providesyoung people with second chances.
The Youth Entrepreneurs Scheme has imparted business skills to morethan 4,000 young people, provided credit to 1,812 people between theages of 18 and 34, and increased the capacity of intermediary institutions.The review of the program comments favorably on its achievements andimpact but notes that it disbursed only 35 percent of the funds availableto it. Moreover, the program focuses on elite school-leavers (those withupper-secondary school certificates or higher qualifications).
The Promotion of Children and Youth program, funded by GTZ, pro-motes cooperative ventures and small businesses involving young peopleand builds the capacity of local government in this field. The review ofthe program is favorable, but no evaluation evidence is cited.
The PEVOT, also supported by GTZ, is helping develop and implementreforms of vocational education and training, including a qualificationsframework; improvements in financing (training levies paid by enterprisesare envisaged); and short courses for the disadvantaged. This work is stillin progress, with few measurable achievements to date.
The BEUPA project provides a three-year course, equivalent to primaryschool, and prevocational skills training for urban dropouts 9–18. It alsoorganizes apprenticeships for participants. There is no information on itsoutcomes or impact.
In addition to these interventions, ongoing activities of the Ministryof Gender, Labor, and Social Development include registration and place-ment of job seekers, a review of obsolete labor laws, and developmentof a policy framework to ensure the safety and dignity of Ugandansworking abroad.
The background to these interventions is a steady increase in the pro-portion of young people who have completed primary education (and aclosing of the gender gap) since 1992. As a result of the government’suniversal primary education policy, Uganda now has one of the highestaverage levels of education in Sub-Saharan Africa.
WB62_YALM_CH06 3/12/08 1:20 PM Page 99

WB62_YALM_CH06 3/12/08 1:20 PM Page 100

Abu-Ghaida, Dina N., and Marie Connolly. 2003. “Trends in Relative Demand forWorkers with Secondary Education: A Look at Nine Countries in East Asia,Africa, and MENA.” Background paper prepared for Expanding Opportunitiesand Building Competencies for Young People: A New Agenda for SecondaryEducation. World Bank, Washington, DC.
Acemoglu, Daron. 2003. “Patterns of Skill Premia.” Review of Economic Studies70 (2): 231–51.
Adams, Arvil V. 2006. “The Role of Skills Development in the Transition to Work:Lessons from Global Experience.” Background paper for World DevelopmentReport 2007. World Bank, Washington, DC.
Andvig, J. C. 2000. “Family-Controlled Child Labor in Sub-Saharan Africa: ASurvey of Research.” Working Paper 612. Norwegian Institute of InternationalAffairs (NUPI), Oslo.
Aromolaran, Adebayo B. 2002. “Private Wage Returns to Schooling in Nigeria1996–1999.” Working Paper 849. Yale University, Economic Growth Center,New Haven, CT.
Barro, Robert J., and Jong-Wha Lee. 2000. “International Data on EducationalAttainment: Updates and Implications.” Oxford Economic Papers 53 (3) 541–63.
Bedi, A. S., and J. H. Marshall. 2001. “Primary School Attendance in Honduras.”Journal of Development Economics 69 (1): 129–53.
Bibliography for Part 1
101
WB62_YALM_Biblo 2/4/08 2:58 PM Page 101

Betcherman, Gordon, Karina Olivas, and Amit Dar. 2004. “Impacts of ActiveLabor Market Programs: New Evidence from Evaluations with ParticularAttention to Developing and Transition Countries.” Social ProtectionDiscussion Paper Series 0402. World Bank, Washington, DC.
Bhalotra, S. 2003. “Is Child Work Necessary?” Bristol Economics Discussion Paper03/554. University of Bristol, Department of Economics, Bristol, U.K.
Bhalotra, S., and Chris Heady. 2000. “Child Farm Labor: Theory and Evidence.”STICERD Development Economics Papers 24. London School of Economics,Suntory and Toyota International Centres for Economics and RelatedDisciplines, London.
Bhalotra, S., and Z.Tzannatos. 2002. “Child Labor:What Have We Learnt?” SocialProtection Discussion Paper 0234. World Bank, Washington, DC.
Bloom, David E., and Jeffrey G. Williamson. 1998. “Demographic Transitions andEconomic Miracles in Emerging Asia.” World Bank Economic Review 12 (3):419–55.
Card, David. 1995a. “Earnings, Schooling, and Ability Revisited.” NBER WorkingPaper 4832. National Bureau of Economics, Cambridge, MA.
———. 1995b. “Using Geographic Variation in College Proximity to Estimate theReturns to Schooling.” In Aspects of Labour Market Behaviour: Essays in Honourof John Vanderkamp, ed. L. N. Christodes, E. K. Grant, and R. Swidinsky.Toronto, Canada: University of Toronto Press.
Cockburn, John. 2001. “Child Labor versus Education: Poverty Constraints orIncome Opportunities?” Working Paper. Université Laval, CREFA, Québec,Canada.
———. 2002. “Income Contributions of Child Work in Rural Ethiopia.” WorkingPaper. Centre for the Study of African Economies Series, Oxford, U.K.
Coombe, C., and M. J. Kelly. 2001. “Education as a Vehicle for CombatingHIV/AIDS.” Prospects 31 (3): 435–45.
Dabalen,A. 1998. “Returns to Education in Kenya and South Africa: InstrumentalVariable Estimates.” University of California, Berkeley, CA.
Denu, Berhanu,Abraham Tekeste, and Hannah van der Deijl. 2005. “Characteristicsand Determinants of Youth Employment, Underemployment, and InadequateEmployment in Ethiopia.” Employment Strategy Paper. Employment PoliciesUnit, Employment Strategy Department. International Labour Organization,Geneva.
Emerson, Patrick, and André Portela F. de Souza. 2000. “Is There a Child LaborTrap? Inter-Generational Persistence of Child Labor in Brazil.” Working Paper471. Cornell University, Department of Economics, Ithaca, NY.
Ethiopia Central Statistical Agency. 2001. Ethiopia Labour Force Survey1999/2000. Addis Ababa.
102 Bibliography
WB62_YALM_Biblo 2/4/08 2:58 PM Page 102

Fares, Jean, and Dhushyanth Raju. 2006. “Child Labor across the DevelopingWorld: Patterns, Correlations and Determinations.” Background paper forWorld Development Report 2007. World Bank, Washington, DC.
Freeman, Richard B. 1979. “Why Is There A Youth Labor Market Problem?”NBER Working Paper 365. National Bureau of Economic Research,Cambridge, MA.
Getachew, Martha, and Emily Kallaur. 2005. “Youth Employment in Ethiopia:Overview and Inventory of Existing Policies and Programs.” World Bank,Washington, DC.
Glewwe, Paul. 1996. “The Relevance of Standard Estimates or Rates of Return toSchooling for Education Policy:A Critical Assessment.” Journal of DevelopmentEconomics 51 (2): 267–90.
Godfrey, Martin. 2006. “Youth Employment in Sub-Saharan Africa: AnAssessment of Existing Interventions.” Presentation at the World Bank Youthin Africa’s Labor Market Workshop, Washington, DC. February 7.
Griliches, Z. 1977. “Estimating the Returns to Schooling: Some EconometricsProblem.” Econometrica 45 (1): 1–22.
Haan, Hans Christiaan, and Nicholas Serriere. 2002. Training for Work in theInformal Sector: Fresh Evidence from West and Central Africa. Turin, Italy:International Training Centre of the International Labour Organization.
Ilahi, N., P. Orazem, and G. Sedlacek. 2000. “The Implications of Child Labor forAdult Wages, Income, and Poverty: Retrospective Evidence from Brazil.”World Bank, Washington, DC.
ILO (International Labour Office). 2006. “The End of Child Labour: WithinReach.” International Labour Office, Geneva.
Jacoby, Hanan G., and Emmanuel Skoufias. 1997. “Risk, Financial Markets, andHuman Capital in a Developing Country.” Review of Economic Studies 64 (3):311–35.
Johanson, Richard K., and Arvil V. Adams. 2004. Skills Development in Sub-Saharan Africa. Washington, DC: World Bank.
Kahyarara, G., F. Teal, A. Wambugu, and M. Söderbom. 2004. “The Dynamics ofReturns to Education in Kenyan and Tanzanian Manufacturing.”Development and Comp Systems 0409041, Economics Working PaperArchive. Washington University in St. Louis, MO.
Kalzianga, H. 2002. “Schooling Returns for Wage Earners in Burkina Faso:Evidence from the 1994 and 1998 Living Standard Measurement Surveys.”Yale University, Economic Growth Center, New Haven, CT.
Kielland, A., and Maurizia Tovo. 2006. Children at Work: Child Labor Practices inAfrica. Boulder. CO: Lynne Rienner Publishers.
Bibliography 103
WB62_YALM_Biblo 2/4/08 2:58 PM Page 103

Kingdon, G., and J. Knight. Forthcoming. “How Flexible Are Wages in Response toLocal Unemployment in South Africa?” Industrial and Labor Relations Review.
Korenman, Sanders, and David Neumark. 2000. “Cohort Crowding and YouthLabor Markets:A Cross-National Analysis.” In Youth Employment and Joblessnessin Advanced Countries, ed. David G. Blanchflower and Richard B. Freeman.Chicago, IL, and London: University of Chicago Press for the National Bureauof Economic Research.
Knight, J. B., R. H. Sabot, and D. C. Hovey. 1992. “Is the Rate of Return onPrimary Schooling Really 26 Per Cent?” Journal of African Economies 1 (2):171–91.
Krishnan, Pramila, Tesfaye Gebre Selassie, and Stefan Dercon. 1998. “The UrbanLabour Market During Structural Adjustment: Ethiopia 1990–1997.” CSAEWorking Paper WPS/98.9. University of Oxford, Center for the Study ofAfrican Economies, U.K.
Lam, David. 2006. “The Demography of Youth in Developing Countries and ItsEconomic Implications.” Policy Research Working Paper, WPS 4022. WorldBank, Washington, DC.
Lassibille, G., and J. Tan. 2005. “The Returns to Education in Rwanda.” Journal ofAfrican Economies 14 (1): 92–116.
Llisteri, J., H. Kantis, P. Angelelli, and L. Tejerina. Forthcoming. YouthEntrepreneurship in Latin America. Washington, DC: Inter-AmericanDevelopment Bank.
Mankiw, N. Gregory, David Romer, and David N. Weil. 1992. “A Contribution tothe Empirics of Economic Growth.” The Quarterly Journal of Economics 107(2): 407–37.
Muraközy, Balazs, and László Halpern. 2005. “Does Distance Matter in Spillover?”Discussion Papers 4857. Centre of Economic Policy Research, London.
Mwabu, G., and P. Schultz. 1996. “Education Returns across Quantiles of theWage Function: Alternative Explanations for Returns to Education by Race inSouth Africa.” American Economic Association Papers and Proceedings 86 (2):335–39.
OECD (Organisation for Economic Co-operation and Development). 1998.“Getting Started, Settling In: The Transition from Education to the LabourMarket.” In Employment Outlook 1998. Paris.
———. 1999. Preparing Youth for the 21st Century: The Transition from Educationto the Labor Market. Paris.
———. 2000. From Initial Education to Working Life: Making Transitions Work. Paris.
O’Higgins, Niall. 2003. “Trends in the Youth Labor Market in Developing andTransition Countries.” Social Protection Discussion Paper Series 0321. WorldBank, Washington, DC.
104 Bibliography
WB62_YALM_Biblo 2/4/08 2:58 PM Page 104

Okech, Anthony. 2005. “Uganda Case Study of Literacy in Education for All2005: A Review of Policies, Strategies, and Practices.” Background paper pre-pared for the Education for All Global Monitoring Report 2006. United NationsEducational, Scientific, and Cultural Organization, Paris.
Ouedraogo, Barthélemy M. 2005. “Etude sur L’Emploi au Burkina Faso.” Ministryof Labor and the World Bank. Ougadougou, Burkina Faso.
Psacharopoulos, George, and Harry Anthony Patrinos. 2004.“Returns to Investmentin Education: A Further Update.” Education Economics 12 (2): 111–34.
Raju, Dhushyanth. 2006. “The Effects of Conditional Cash Transfer Programs onChild Work: A Critical Review and Analysis of the Evidence.” Working Paper.World Bank, Washington, DC.
Ravallion, Martin, Emanuela Galasso, Teodoro Lazo, and Ernesto Philipp. 2005.“What Can Ex-Participants Reveal about a Program’s Impact?” Journal ofHuman Resources 40 (1): 208–30.
Ray, Debraj. 1998. Development Economics. Princeton, NJ: Princeton UniversityPress.
Riley, Thira, and William Steel. 1999. “Kenya Voucher Program for Training andBusiness Development Services.” World Bank, Washington, DC.
Sanchez-Paramo, Carolina, and Norbert Schady. 2003. “Off and Running?Technology, Trade, and the Rising Demand for Skilled Workers in LatinAmerica.” Policy Research Working Paper Series 3015. World Bank,Washington, DC.
Schultz, Paul. 2003. Evidence of Return to Schooling in Africa from HouseholdSurveys: Monitoring and Restructuring the Market for Education. New Haven,CT: Yale University.
Shitundu, Joseph M. 2005. “Youth Employment Inventory of Existing Policiesand Programmes in Tanzania.” World Bank, Social Protection Unit,Washington, DC.
Staiger, D., and J. Stock. 1997. “Instrumental Variables Regression with WeakInstruments.” Econometrica 65 (3): 557–86.
Subbarao, K., and Diane Koury. 2004. Reaching Out to Africa’s Orphans: AFramework for Public Action. Washington, DC: World Bank.
Tanzania National Bureau of Statistics. 2003. Tanzania Integrated Labor ForceSurvey. 2000/01. Dar es Salaam, Tanzania.
UN (United Nations). 2005. World Population Prospects: The 2004 Revision.Volume II: Sex and Age Distribution of the World Population. New York.
UNAIDS (United Nations Joint Programme of HIV/AIDS). 2002. Report on theGlobal HIV/AIDS Epidemic. Geneva.
UNAIDS/WHO (World Health Organization). 2005. AIDS Epidemic Update.Geneva: UNAIDS/WHO.
Bibliography 105
WB62_YALM_Biblo 2/4/08 2:58 PM Page 105

UNOWA (United Nations Office for West Africa). 2005. “Youth Unemploymentand Regional Insecurity in West Africa.” Dakar.
Uwaifo, R. 2005. “Africa’s Education Enigma:The Nigerian Story.” PhD dissertation,University of California, Berkeley.
Vilhuber, Lars. 2006. “The Transition from School to the Labor Market inUganda.” Preliminary outline presented at the World Bank Youth in Africa’sLabor Market Workshop, Washington, DC. February 7.
World Bank. 1994–2001. Standard Files and Standard Indicators. Washington, DC.
———. 2000. Can Africa Claim the 21st Century? Washington, DC.
———. 2004. World Development Report 2005: A Better Investment Climate forEveryone. New York and Washington, DC: Oxford University Press and theWorld Bank.
———. 2005. Global Monitoring Report. Washington, DC.
———. 2006. World Development Report 2007: Development and the Next Gene-ration. Washington, DC.
106 Bibliography
WB62_YALM_Biblo 2/4/08 2:58 PM Page 106

P A R T 2
Youth in Africa’s Labor Market: Country Case Studies
Lisa Dragoset, Jean Fares, Lorenzo Guarcello, Florence Kondylis, Scott Lyon, Marco Manacorda, Daniel Parent, Furio Rosati,
Cristina Valdivia, and Lars Vilhuber
WB62_YALM_CH07 3/3/08 5:19 PM Page 107

WB62_YALM_CH07 3/3/08 5:19 PM Page 108

As the international development community centers its attention on theMillennium Development Goals, improving outcomes for children andyouth—the groups most directly related to achieving these goals—is agrowing priority. Young people are especially vulnerable to exclusionfrom economic and societal resources, jeopardizing their future prospectsand overall national progress toward realizing the goals.
Youth unemployment and underemployment are growing concernsworldwide. According to International Labour Organization (ILO) esti-mates (2006), youth made up 44 percent of the world’s unemployed in2005, 85 million people in absolute terms. Young workers everywherehave much higher rates of joblessness and much lower earnings than olderworkers.Young people are also concentrated in low-skill informal work orin hazardous forms of work that are ill-suited to their age and experience.Employment outcomes are typically the worst for former child laborersand others who leave school early, groups with the least opportunity toaccumulate the human capital needed for gainful employment.
The challenge of youth employment in Africa is especially large. In Sub-Saharan Africa, young people ages 15–24 account for 37 percent of the
C H A P T E R 7
School-to-Work Transitions:Regional Overview
Lorenzo Guarcello, Marco Manacorda, Furio Rosati,Jean Fares, Scott Lyon, and Cristina Valdivia
109
WB62_YALM_CH07 3/3/08 5:19 PM Page 109

working age population. As a result of population pressure, the numberof young people in Sub-Saharan Africa in the labor force is expected toincrease by about 24 million people between 2005 and 2015 (ILO 2006).Failure to address youth employment issues will have serious conse-quences for the economy and society. Without opportunities for youngpeople to earn a living, intergenerational cycles of poverty will persist,further affecting societies already made vulnerable by HIV/AIDS, foodinsecurity, and violence.
While youth issues are the subject of growing attention, data for indi-cators relating specifically to youth employment remain scarce in mostdeveloping countries. The empirical basis for formulating policies andprograms promoting youth employment and successful transitions fromschool to work is therefore limited.
This chapter is aimed at beginning to fill this gap by generating andanalyzing a set of youth education and employment indicators based onWorld Bank Priority survey data for 13 countries in Sub-Saharan Africa.1
Particular emphasis is placed on measuring the initial transition fromschool to work for different groups of young people and on identifyingthe factors affecting this transition.
Aggregate Trends
Countries in Sub-Saharan Africa are overwhelmingly poor. Of a total pop-ulation of 650 million, 500 million are estimated to live on less than $2 aday, and 300 million live below the poverty line of $1 a day. Over the lasttwo decades, gross national product per capita and private consumptionhave declined. In the past few years, signs of a turnaround have begun toshow, but with large variations. Burkina Faso, Tanzania, and Uganda haveexperienced high per capita growth rates for more than five years. Growthin Kenya, Nigeria, and Zambia has been stagnant.And Burundi and Liberiaare stuck in a poverty trap and a spiral of conflict and destruction(Betcherman and others 2005).
A small group of middle-income countries in Sub-Saharan Africa hasstarted a demographic transition to lower fertility, but the region as a wholestill has some of the highest population growth rates in the world. Thepopulation in Sub-Saharan Africa is expected to reach 854 million by2010, an increase of 200 million from a decade earlier (Fluitman 2001).According to the ILO (2006), the labor force in the region, estimated tobe 300 million in 2001, is expected to reach 400 million by 2011, addingan average of 10 million job seekers a year.
110 Guarcello, Manacorda, Rosati, Fares, Lyon, and Valdivia
WB62_YALM_CH07 3/3/08 5:19 PM Page 110

Labor Market Implications of Demographic Pressure Traditional labor market concepts such as jobs, employment, unemploy-ment, participation, wages, and earnings are difficult to apply to Africa,where most of the labor force works in family businesses (as owners orunpaid family workers); half work in agriculture, mostly at subsistencelevels; and two-thirds live in rural areas.
The estimated labor force participation rate for youth (defined hereas those ages 15–24) in Sub-Saharan Africa was above 60 percent in thelast two decades, among the highest worldwide and second only to theEast Asia region. These estimates would be even larger if the labor forcedefinition included household chores undertaken by a significant pro-portion of women in the region. Each year 500,000 new entrants comeinto the labor market in Kenya, and 700,000 in Tanzania. These largecohorts will continue to add pressure to the labor market in the region.
Sub-Saharan Africa supplies the highest proportion of child labor inthe world. The ILO (2003) estimates that about 38 million childrenbetween the ages of 5 and 14 are working. Put differently, about a quarterof children ages 5–14 in Sub-Saharan Africa are working, compared with18.7 percent in Asia and 17 percent in Latin America. A high proportionof African children leave school early to work. Among children ages10–14, 31 percent are estimated to be working. In some countries thesenumbers reach even higher proportions, such as 50 percent in Burundi.In West Africa the need for children to work has led to child migration. InBenin, for example, 8 percent of children ages 6–16 are reported to haveleft their parental households to work.
Older cohorts ages 15–24 have also seen their labor market outcomesdeteriorate over the last two decades. The unemployment rate increasedby almost a third between 1993 and 2003, reaching 21 percent. The ILO(2004) estimates that in 2003 more than 18 million youth in Sub-SaharanAfrica were unemployed.
The estimated youth unemployment rate in Sub-Saharan Africa isamong the highest in the world; only the Middle East and North Africaregion has a higher youth unemployment rate (figure 7.1). The youthunemployment rate in Sub-Saharan Africa is 3.5 times higher than theadult unemployment rate, reflecting the relative disadvantage of thiscohort in the job market in Africa.
The regional aggregation hides important country variation in theyouth unemployment rate. A close look at a sample of selected countriesin Sub-Saharan Africa shows that the unemployment rate could exceed30 percent in countries with high urban unemployment (Mozambique
School-to-Work Transitions: Regional Overview 111
WB62_YALM_CH07 3/3/08 5:19 PM Page 111

and Kenya). At the same time, countries with a large rural sector haverelatively low youth unemployment (Burkina Faso and Uganda).
Links with Education The labor force in Sub-Saharan Africa is poorly educated relative tothe rest of the world. Since the 1960s, many African countries haveundertaken major education expansion, but the economic stagnationin the 1970s and the decline that followed in the 1990s slowed thisexpansion. Education levels in Sub-Saharan Africa were comparableto those of South Asia and the Middle East and North Africa in the1960s (figure 7.2). But by the end of the 20th century, due to slowexpansion, Sub-Saharan Africa lagged behind all other regions in yearsof schooling.
Other indicators of the quality of human capital are alarming. Despitean improvement in the late 1990s, primary enrollment rates in Sub-Saharan Africa in 1995 fell below those in 1980. Female enrollment isvery low, less than 50 percent of the total at the primary and secondarylevels and just 35 percent at higher education levels. This slow progressis also reflected in a persistent high illiteracy rate at about 18 percent foryoung men and 27 percent for young women, second only to the SouthAsia region. Mixed outcomes are expected in the coming decades. Byproviding low-cost universal education, Kenya, Tanzania, and Ugandaexpect to lower the illiteracy rate in the labor force to less than 10 percent
112 Guarcello, Manacorda, Rosati, Fares, Lyon, and Valdivia
Figure 7.1. Regional Unemployment Rates, 2003
Source: ILO.
6.89.2
3.36.3
4.8
8.0
12.2 10.913.4
18.6
7.0
16.413.9
16.6
25.6
21.0
5.77.7
2.4 3.4 2.35.4
7.86.0
0
5
10
per
cen
t
15
20
25
30
Indu
strial
econ
omies
Trans
ition
econ
omies
East A
sia
South
east
Asia
South
Asia
Latin
Am
erica
and
the
Caribb
ean
Midd
le Eas
t and
North
Afri
ca
Sub-S
ahar
an A
frica
total youth adult
WB62_YALM_CH07 3/3/08 5:19 PM Page 112

by 2015. Côte d’Ivoire and Ethiopia are still projecting about 30 percentilliteracy for their female labor forces in 2015.
Freeman and Lindauer (1999) argue that the low stock of human capitalin Sub-Saharan Africa seems a natural cause for the lack of economicprogress.A great deal of microeconomic and macroeconomic evidence hasbeen accumulated linking education, productivity, and growth. A betterunderstanding of the relationship between education and labor marketoutcomes for youth could shed light on the validity of this hypothesis.
There are two broad groups of young people in the labor market:those with relatively high educational attainment who are transitioningfrom school to work and those with little or no education who transitionvery early into the labor market, such as child laborers (figure 7.3). Thesecond group predominates in all countries except Kenya, São Tomé andPrincipe, and Zambia, underscoring the generally low level of humancapital accumulation among Sub-Saharan African youth.
Returns to EducationReturns to education, based on microevidence by Psacharaopolous(1994), have been regarded as higher than in other regions. The highestreturns were estimated to be for primary school education. But Bennell(1996) and Glewwe (1991) argue that Psacharopolous’ conclusion reliesheavily on dated studies and unreliable data—and that more careful
School-to-Work Transitions: Regional Overview 113
0
1
2
year
s o
f sc
ho
olin
g
3
4
5
6
7
East A
sia
and
Pacific
Latin
Am
erica
and
the
Caribb
ean
Midd
le Eas
t and
North
Afri
ca
South
Asia
Sub-S
ahar
an
Africa
1960 1980 1999
Figure 7.2. Average Years of Schooling, by Region and Year
Source: World Bank 2004.
WB62_YALM_CH07 3/3/08 5:19 PM Page 113

Mincer-type estimation of returns to education reveals modest effects.These results are more consistent with the observed stagnation or declinein school enrollment in several Sub-Saharan African countries.
According to Collier and Gunning (1999), no statistical finding supportsan effect from education on farm productivity in Sub-Saharan Africa.Glewwe (1991) also estimates increasing returns to secondary and post-secondary education. While these convexities in the earning profilecould reflect the scarcity of skilled labor, exacerbated by the brain drainfrom international migration, it could also reflect the strong selectivitybias and the lack of control for school quality.
An alternative view of the role of education is the link between educa-tion and unemployment. Considerable evidence worldwide indicates thathigher educational attainment leads to better employment outcomes, suchas higher wages and lower unemployment. For youth, however, thisrelationship is not always evident. In some countries in Sub-SaharanAfrica, higher educational attainment has not led to a decrease in theunemployment rate for youth (figure 7.4). Youth with secondary andtertiary education in Burundi, Cameroon, Côte d’Ivoire, Kenya, and
114 Guarcello, Manacorda, Rosati, Fares, Lyon, and Valdivia
Figure 7.3. Educational Attainment of Nonstudent Youth, Sub-Saharan Africa Region
13.121.45.6
76.3
18.50.9
7.7
65.1
80.4
56.6
26.2
46.6
81.9
30.8
48.6
12.0
16.7
61.1
50.936.8
9.1
9.6
21.1
44.0
43.1
11.5
0
10
20
30
40
5060
70
80
90
100
Burkin
a Fa
so
Burun
di
Camer
oon
Côte
d'Ivo
ire
Ethiop
ia
Gambia
, The
Kenya
Mad
agas
car
Mala
wi
Moz
ambiq
ue
São To
mé
and
Princip
e
Ugand
a
Zambia
per
cen
t
completed secondary or higher
completed primary
not completed primary
no education
Source: Understanding Children’s Work calculations based on World Bank Standard Files and Standard Indicatorsdatasets.Note: Some countries do not reach 100 percent because of missing data (Burkina Faso 97.5 percent, Ethiopia99.6 percent, The Gambia 99.1 percent, Kenya 98.2 percent, Madagascar 99.5 percent, Malawi 89.2 percent,Mozambique 99.8 percent, Uganda 99.5 percent).
WB62_YALM_CH07 3/3/08 5:19 PM Page 114

Madagascar have higher rates of unemployment than youth with lowereducational attainment.
Young People’s Time Use
The time use profiles of young people in the Sub-Saharan Africa regionappear to depend considerably on their country of residence (table 7.1).2
Involvement in employment varies from three-fourths of young peoplein Burkina Faso to just one-fifth in Ethiopia, Malawi, and Mozambique.Unemployment is almost nonexistent among 15–24 year-olds in Burundiand Malawi (1 percent of this age group), but affects 10 percent or moreof young people in Cameroon, Côte d’Ivoire, Kenya, Mozambique, SãoTomé and Principe, and Zambia.3 Levels of joblessness (the sum of theunemployed and inactive), arguably a better measure of youth employ-ment disadvantage, are much higher than unemployment figures, owingto the significant proportion of young people who are inactive (absentfrom both the labor force and education).4 Joblessness exceeds one-fifthin 9 of the 13 countries (Cameroon, Ethiopia, The Gambia, Kenya,Malawi, Mozambique, São Tomé and Principe, and Zambia). Only in two(Burundi and Uganda) are less than 10 percent of young people jobless.
Educational enrollment of youth varies widely but does not exceed50 percent in any of the 13 countries. There is a negative correlationbetween school attendance and work across the countries considered,but this correlation is generally not strong. Education and employment
School-to-Work Transitions: Regional Overview 115
01020
per
cen
t
30405060708090
Burkin
a Fa
so
Burun
di
Camer
oon
Côte
d’Ivo
ire
Ethiop
ia
Ghana
Kenya
Mad
agas
car
Mala
wi
Moz
ambiq
ue
Nigeria
São To
mé
and
Princip
e
Ugand
a
Zambia
no education primary secondary tertiary
Figure 7.4. Unemployment Rate for Youth by Educational Attainment in Sub-Saharan African Countries
Source: Understanding Children’s Work calculations based on World Bank Standard Files and Standard Indicatorsdatasets.
WB62_YALM_CH07 3/3/08 5:19 PM Page 115

do not appear complementary because only a relatively small number ofindividuals combine school and work. This fact is surprising and maymerely reflect the data available.
These aggregates mask large variations in young people’s time use bysex, residence, and age (tables 7.2–7.4). Young people in rural areas usetheir time very differently from their counterparts in urban areas in all13 countries. Compared with rural youth, urban young people benefitfrom greater educational opportunities, staying in school longer, and join-ing the labor force at a later age. For the 15–24 age group, educationalinvolvement is much higher for urban youth (except in Kenya), andemployment involvement is much lower (except in Ethiopia, Kenya,Mozambique). Consistent with a Harris-Todaro model, unemploymentis more common among urban youth (except in São Tomé and Principe),presumably because of the wage differentials between the urban andrural sectors. In Burkina Faso, Burundi, Ethiopia, The Gambia, Malawi,and Uganda, rural youth unemployment is 2 percent or less. There is noclear pattern in inactivity by residence; rates of inactivity are higher
116 Guarcello, Manacorda, Rosati, Fares, Lyon, and Valdivia
Table 7.1. Time Use Patterns for Youth Ages 15–24, by Country
Distribution of youth by activity status(percentage)
(1) (3)Only in (2) Only in (4) (5) Jobless
Country education Combininga employment Unemployed Inactiveb (4) + (5)
Burkina Faso 11.04 0.95 77.84 4.22 5.94 10.16Burundi 25.48 — 70.32 0.76 3.43 4.19Cameroon 32.24 2.27 42.99 12.62 9.87 22.49Côte d’Ivoire 25.46 — 47.36 9.57 17.60 27.17Ethiopia 17.84 — 19.72 3.97 58.47 62.44Gambia, The 28.43 1.08 37.25 1.50 31.74 33.24Kenya 41.97 — 20.79 10.47 26.77 37.24Madagascar 23.28 2.30 62.41 8.94 3.07 12.01Malawi 42.29 0.38 21.38 1.42 34.53 35.95Mozambique 18.28 0.61 21.58 14.75 44.78 59.53São Tomé and
Principe 23.31 1.55 31.27 11.29 32.58 43.87Uganda 34.04 9.66 48.23 0.73 7.35 8.08Zambia 29.52 0.62 38.62 11.40 19.84 31.24
Source: Understanding Children’s Work calculations based on World Bank Standard Files and Standard Indicatorsdatasets.Note: — = unavailable data, because the survey instrument structure does not permit identifying the category“combining.”a. Combining refers to youth who both work and attend school.b. Inactive youth are youth who neither attend school nor work nor are unemployed.
WB62_YALM_CH07 3/3/08 5:19 PM Page 116

Tab
le 7
.2. T
ime
Use
Pat
tern
s fo
r You
th A
ges
15–
24, b
y Se
x an
d C
ount
ry
Dis
trib
utio
n of
you
th b
y ac
tivity
sta
tus
(per
cent
age)
(1)
(2)
(3)
(4)
(5)
Jobl
ess
Onl
y in
edu
catio
nCo
mbi
ning
aO
nly
in e
mpl
oym
ent
Une
mpl
oyed
Inac
tiveb
(4) +
(5)
Coun
try
MF
MF
MF
MF
MF
MF
Burk
ina
Faso
13.7
8.7
1.4
0.5
80.0
75.9
3.8
4.6
1.1
10.3
4.9
14.9
Buru
ndi
28.4
23.1
——
67.4
72.8
0.9
0.7
3.3
3.5
4.2
4.2
Cam
eroo
n36
.328
.42.
91.
745
.041
.013
.312
.02.
516
.915
.828
.9Cô
te d
’Ivoi
re33
.817
.8—
—49
.745
.28.
610
.57.
926
.516
.537
.0Et
hiop
ia22
.313
.7—
—25
.514
.33.
54.
448
.767
.652
.172
.1G
ambi
a, T
he37
.819
.61.
30.
831
.742
.61.
81.
227
.535
.829
.337
.0Ke
nya
48.4
36.0
——
23.5
18.3
10.1
10.8
18.0
34.9
28.1
45.7
Mad
agas
car
25.1
21.5
3.1
1.6
64.2
60.7
5.9
11.8
1.7
4.4
7.6
16.2
Mal
awi
54.8
31.5
0.7
0.1
23.3
19.8
2.1
0.8
19.1
47.8
21.3
48.6
Moz
ambi
que
26.1
11.2
1.2
0.1
27.7
16.0
12.5
16.8
32.6
55.8
45.1
72.6
São
Tom
é an
d Pr
inci
pe24
.322
.41.
81.
345
.616
.913
.19.
515
.350
.028
.459
.4U
gand
a38
.629
.714
.74.
841
.854
.31.
00.
53.
810
.74.
811
.2Za
mbi
a37
.222
.70.
90.
437
.839
.313
.49.
610
.728
.024
.137
.6
Sour
ce:U
nder
stan
ding
Chi
ldre
n’s W
ork
calc
ulat
ions
bas
ed o
n W
orld
Ban
k St
anda
rd F
iles
and
Stan
dard
Indi
cato
rs d
atas
ets.
Not
e:—
= u
nava
ilabl
e da
ta, b
ecau
se th
e su
rvey
inst
rum
ent s
truc
ture
doe
s no
t per
mit
iden
tifyi
ng th
e ca
tego
ry “c
ombi
ning
.”a.
Com
bini
ng re
fers
to y
outh
who
bot
h w
ork
and
atte
nd s
choo
l.b.
Inac
tive
yout
h ar
e yo
uth
who
nei
ther
att
end
scho
ol n
or w
ork
nor a
re u
nem
ploy
ed.
117
WB62_YALM_CH07 3/3/08 5:19 PM Page 117

Tab
le 7
.3. T
ime
Use
Pat
tern
s fo
r You
th A
ges
15–
24, b
y R
esid
ence
an
d C
ount
ry
Dis
trib
utio
n of
you
th b
y ac
tivity
sta
tus
(per
cent
age)
(1)
(2)
(3)
(4)
(5)
Jobl
ess
Onl
y in
edu
catio
nCo
mbi
ning
aO
nly
in e
mpl
oym
ent
Une
mpl
oyed
Inac
tiveb
(4) +
(5)
Coun
try
Rura
lU
rban
Rura
lU
rban
Rura
lU
rban
Rura
lU
rban
Rura
lU
rban
Rura
lU
rban
Burk
ina
Faso
4.3
34.8
1.0
0.8
89.6
36.6
1.3
14.5
3.9
13.2
5.2
27.8
Buru
ndi
23.3
58.6
——
73.9
14.8
0.1
11.6
2.7
15.0
2.7
26.6
Cam
eroo
n23
.748
.32.
51.
955
.220
.19.
518
.59.
211
.218
.729
.7Cô
te d
’Ivoi
re14
.934
.8—
—69
.128
.34.
114
.411
.922
.616
.037
.0Et
hiop
ia12
.146
.1—
—18
.426
.42.
013
.567
.514
.169
.627
.6G
ambi
a, T
he20
.537
.01.
50.
656
.016
.90.
82.
321
.143
.321
.945
.5Ke
nya
45.4
27.3
——
17.2
36.2
8.3
19.6
29.1
16.9
37.4
36.5
Mad
agas
car
16.9
39.6
2.5
1.9
72.3
37.1
6.2
16.1
2.2
5.4
8.3
21.4
Mal
awi
40.5
55.1
0.3
0.9
22.3
14.8
1.2
2.8
35.7
26.4
36.9
29.1
Moz
ambi
que
14.9
29.8
0.5
1.1
22.0
20.2
8.4
36.1
54.3
12.8
62.7
48.9
São
Tom
éan
d Pr
inci
pe
14.7
29.3
0.8
2.0
35.4
28.4
15.3
8.6
33.7
31.8
49.1
40.3
Uga
nda
32.7
40.6
10.9
3.5
51.7
31.7
0.4
2.3
4.3
21.9
4.7
24.2
Zam
bia
25.4
35.8
0.8
0.3
53.1
16.6
5.8
19.8
14.8
27.4
20.7
47.3
Sour
ce: U
nder
stan
ding
Chi
ldre
n’s W
ork
calc
ulat
ions
bas
ed o
n W
orld
Ban
k St
anda
rd F
iles
and
Stan
dard
Indi
cato
rs d
atas
ets.
Not
e:—
= u
nava
ilabl
e da
ta, b
ecau
se th
e su
rvey
inst
rum
ent s
truc
ture
doe
s no
t per
mit
iden
tifyi
ng th
e ca
tego
ry“c
ombi
ning
.”a.
Com
bini
ng re
fers
to y
outh
who
bot
h w
ork
and
atte
nd s
choo
l.b.
Inac
tive
yout
h ar
e yo
uth
who
nei
ther
att
end
scho
ol n
or w
ork
nor a
re u
nem
ploy
ed.
118
WB62_YALM_CH07 3/3/08 5:19 PM Page 118

Tab
le 7
.4. T
ime
Use
Pat
tern
s fo
r You
th, b
y A
ge
Gro
up a
nd
Cou
ntry
Dis
trib
utio
n of
you
th b
y ac
tivity
sta
tus
(per
cent
age)
(1)
(2)
(3)
(4)
(5)
Jobl
ess
Onl
y in
edu
catio
nCo
mbi
ning
aO
nly
in e
mpl
oym
ent
Une
mpl
oyed
Inac
tiveb
(4) +
(5)
Coun
try
15–1
920
–24
15–1
920
–24
15–1
920
–24
15–1
920
–24
15–1
920
–24
15–1
920
–24
Burk
ina
Faso
14.2
6.9
1.2
0.6
76.1
80.2
3.8
4.7
4.7
7.6
8.6
12.3
Buru
ndi
31.5
16.1
——
64.3
79.7
0.6
1.1
3.6
3.1
4.2
4.2
Cam
eroo
n43
.419
.33.
21.
233
.753
.811
.913
.57.
812
.219
.725
.7Cô
te d
’Ivoi
re34
.114
.4—
—39
.956
.89.
210
.016
.718
.726
.028
.7Et
hiop
ia25
.56.
3—
—13
.129
.73.
05.
558
.558
.561
.464
.0G
ambi
a, T
he40
.313
.41.
01.
229
.746
.81.
41.
627
.636
.929
.138
.5Ke
nya
64.9
11.2
——
10.0
35.3
8.5
13.2
16.7
40.3
25.1
53.5
Mad
agas
car
36.0
8.5
3.8
0.6
49.9
77.0
7.7
10.4
2.7
3.5
10.4
13.9
Mal
awi
64.4
17.6
0.3
0.5
8.6
35.7
0.5
2.5
26.2
43.8
26.7
46.3
Moz
ambi
que
28.5
5.6
0.7
0.5
11.4
34.2
14.6
15.0
44.9
44.7
59.5
59.6
São
Tom
é an
d Pr
inci
pe
37.9
5.7
1.2
2.0
18.2
47.0
13.2
9.0
29.5
36.3
42.7
45.3
Uga
nda
47.3
314
.512
.75.
133
.070
.60.
41.
26.
58.
66.
99.
8Za
mbi
a46
.010
.00.
80.
426
.952
.59.
014
.217
.223
.026
.237
.2
Sour
ce: U
nder
stan
ding
Chi
ldre
n’s W
ork
calc
ulat
ions
bas
ed o
n W
orld
Ban
k St
anda
rd F
iles
and
Stan
dard
Indi
cato
rs d
atas
ets.
Not
e:—
= u
nava
ilabl
e da
ta, b
ecau
se th
e su
rvey
inst
rum
ent s
truc
ture
doe
s no
t per
mit
iden
tifyi
ng th
e ca
tego
ry“c
ombi
ning
.”a.
Com
bini
ng re
fers
to y
outh
who
bot
h w
ork
and
atte
nd s
choo
l.b.
Inac
tive
yout
h ar
e yo
uth
who
nei
ther
att
end
scho
ol n
or w
ork
nor a
re u
nem
ploy
ed.
119
WB62_YALM_CH07 3/3/08 5:19 PM Page 119

120 Guarcello, Manacorda, Rosati, Fares, Lyon, and Valdivia
among urban young people in eight of the countries, while in the fiveothers the opposite holds true.5
Gender also appears to be an important factor in young people’stime use patterns (table 7.2). In all 13 countries, males are more likelythan females to continue their education longer. Differences by sex ineducational involvement are often stark: male educational enrollmentis double female enrollment in Mozambique and almost doublefemale enrollment in Côte d’Ivoire, Ethiopia, and The Gambia. Onlyin two countries, Madagascar and São Tomé and Principe, does femaleeducational participation approach male participation. In most of thesecountries females, by contrast, are significantly over-represented amonginactive young people, a category that includes household chores andother forms of noneconomic work typically assigned to females.6 Maleemployment exceeds female employment except in Burundi,The Gambia,and Zambia, though the differences are not always large. There is noclear pattern by sex in unemployment. In sum, large differences favor-ing males in education are balanced by large differences “favoring”females in inactivity, while differences by sex in labor force involvementare generally smaller. No systematic pattern across countries seems toemerge from the data.
Most obviously, time use differs with age, because the 15–24 agerange is a period of transition from adolescence to adulthood and fromeducation to working life. Comparing teenagers and young adults, thereare large differences in involvement in education, with relatively fewpeople continuing education beyond their teens into young adulthood.7
Young adults are more represented in the labor force (both employedand unemployed), and a larger number of them are considered inactive.8
The differences by age are most pronounced in countries where initialeducation enrollment is relatively high (such as Kenya and Malawi).They are least pronounced in countries (such as Burkina Faso andEthiopia) where initial school enrollment is very low and the transitionto work begins at an early age.
While almost all young people leave school in the 15–24 age range, alarge proportion of them have not yet settled into employment (figure 7.5).
Status of Young People in the Labor Market
Youth UnemploymentYouth unemployment is the most important and common measure ofyouth labor market status. The effects of prolonged unemployment early
WB62_YALM_CH07 3/3/08 5:19 PM Page 120

School-to-Work Transitions: Regional Overview 121
Burkina Faso Burundi
0102030405060708090
100
15 16 17 18 19 20 21 22 23 24age in years
per
cen
t
0102030405060708090
100
15 16 17 18 19 20 21 22 23 24age in years
per
cen
t
0102030405060708090
100
15 16 17 18 19 20 21 22 23 24age in years
per
cen
t
0102030405060708090
100
15 16 17 18 19 20 21 22 23 24age in years
per
cen
t
0102030405060708090
100
15 16 17 18 19 20 21 22 23 24age in years
per
cen
t
0102030405060708090
100
15 16 17 18 19 20 21 22 23 24age in years
per
cen
t
0102030405060708090
100
15 16 17 18 19 20 21 22 23 24age in years
per
cen
t
0102030405060708090
100
15 16 17 18 19 20 21 22 23 24age in years
per
cen
t
inactive in education onlyemployed only unemployed
inactive in education onlyemployed only unemployed
inactive in education onlyemployed only unemployed
inactive in education onlyemployed only unemployed
inactive in education onlyemployed only unemployed
inactive in education onlyemployed only unemployed
inactive in education onlyemployed only unemployed
inactive in education onlyemployed only unemployed
Cameroon Côte d’Ivoire
Ethiopia The Gambia
Kenya Madagascar
Figure 7.5. Changes in the Time Use Patterns of Young People by Age and Country
(continued)
WB62_YALM_CH07 3/3/08 5:19 PM Page 121
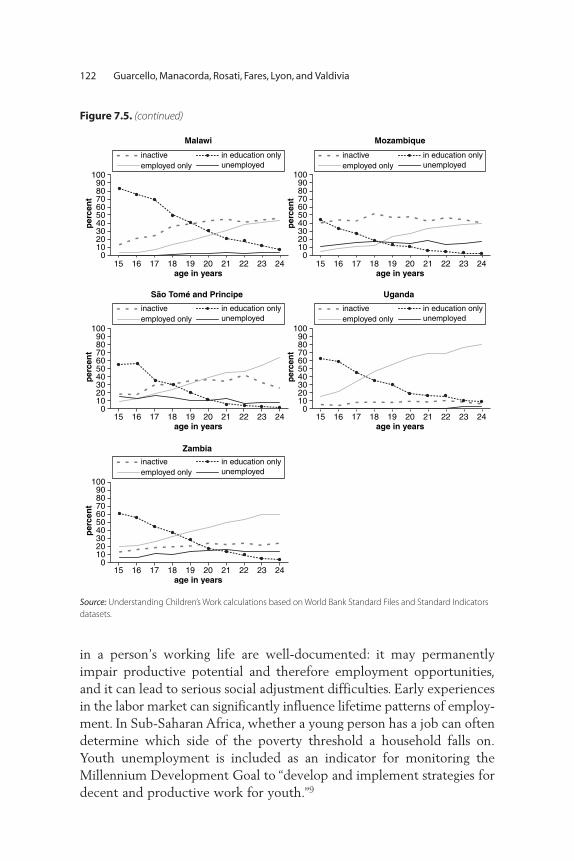
122 Guarcello, Manacorda, Rosati, Fares, Lyon, and Valdivia
in a person’s working life are well-documented: it may permanentlyimpair productive potential and therefore employment opportunities,and it can lead to serious social adjustment difficulties. Early experiencesin the labor market can significantly influence lifetime patterns of employ-ment. In Sub-Saharan Africa, whether a young person has a job can oftendetermine which side of the poverty threshold a household falls on.Youth unemployment is included as an indicator for monitoring theMillennium Development Goal to “develop and implement strategies fordecent and productive work for youth.”9
Figure 7.5. (continued)
0102030405060708090
100
15 16 17 18 19 20 21 22 23 24age in years
per
cen
t
0102030405060708090
100
15 16 17 18 19 20 21 22 23 24age in years
per
cen
t
0102030405060708090
100
15 16 17 18 19 20 21 22 23 24age in years
per
cen
t
0102030405060708090
100
15 16 17 18 19 20 21 22 23 24age in years
per
cen
t
0102030405060708090
100
15 16 17 18 19 20 21 22 23 24age in years
per
cen
t
inactive in education onlyemployed only unemployed
inactive in education onlyemployed only unemployed
inactive in education onlyemployed only unemployed
inactive in education onlyemployed only unemployed
inactive in education onlyemployed only unemployed
Malawi Mozambique
São Tomé and Principe Uganda
Zambia
Source: Understanding Children’s Work calculations based on World Bank Standard Files and Standard Indicatorsdatasets.
WB62_YALM_CH07 3/3/08 5:19 PM Page 122
School-to-Work Transitions: Regional Overview 123
Youth unemployment estimates need to be interpreted with caution,however, particularly in the absence of information on unemploymentdynamics. Low outflows from unemployment and long durations of unem-ployment are likely to indicate employment problems, but high outflowsand short durations may merely reflect active search on the part ofyouth for their preferred work. The negative effects of unemploymentare therefore largely associated with prolonged spells of unemploymentrather than the incidence of unemployment alone. In Sub-Saharan Africa,evidence suggests that many young people face prolonged spells ofunemployment or joblessness in transitioning from school to work.
Note that the youth unemployment rate does not provide a fulldescription of youth difficulties in the labor market. In fact, in countrieswith widespread poverty, the unemployment rate can be misleading,because most youth cannot afford to remain unemployed and their dif-ficulties in the labor market might be reflected better by the quality ofemployment or another measure of underemployment.
There is large variation across the 13 countries in the unemploymentratio (table 7.5): more than one in ten young people are unemployed infive countries (Cameroon, Kenya, Mozambique, São Tomé and Principe,and Zambia), but in four others (Burundi, The Gambia, Malawi, andUganda) less than 2 percent of young people ages 15–24 are unemployed.The picture changes somewhat when unemployment as a proportion ofthe work force (unemployment rate) is examined.
Unemployment as a proportion of population is generally higher foryoung adults than for teenagers, not surprising considering that teenagersare more likely to still be in school and not in the labor force. Onceteenagers are in the work force, however, they often face greater difficul-ties in finding employment than young adults. So, the unemploymentratio of young adults is greater than for teenagers in all but São Tomé andPrincipe and the unemployment rate of young adults is less than that ofteenagers in all but Burkina Faso, Burundi, Malawi, and Uganda.
Differences in the unemployment ratio by sex are noteworthy in Côted’Ivoire, Madagascar, Mozambique, São Tomé and Principe, and Zambia butthere is no systematic pattern in labor market advantage. Females are morelikely to be affected by unemployment in Côte d’Ivoire, Madagascar, andMozambique and males are more likely to be affected in São Tomé andPrincipe and Zambia (figure 7.6).
Urban youth are much more likely to be unemployed than their ruralcounterparts in all but Côte d’Ivoire and São Tomé and Principe, under-scoring the fact that youth unemployment is overwhelmingly an urban
WB62_YALM_CH07 3/3/08 5:19 PM Page 123

Tab
le 7
.5. Y
outh
Un
emp
loym
ent,
Inac
tivi
ty, a
nd
Job
less
Ind
icat
ors,
by
Ag
e G
roup
an
d C
ount
ry
Une
mpl
oym
ent r
atio
Une
mpl
oym
ent r
ate
Inac
tivity
aJo
bles
sb
(as
prop
ortio
n of
tota
l (a
s pr
opor
tion
of to
tal
(as
prop
ortio
n of
(as
prop
ortio
n of
popu
latio
n in
the
sam
e w
ork
forc
e in
the
sam
epo
pula
tion
in s
ame
popu
latio
n in
sam
e ag
e gr
oup)
age
grou
p)ag
e gr
oup)
age
grou
p)
Coun
try
15–1
920
–24
15–2
425
–50
15–1
920
–24
15–2
425
–50
15–1
920
–24
15–2
425
–50
15–1
920
–24
15–2
425
–50
Burk
ina
Faso
3.8
4.7
4.2
1.9
4.7
5.5
5.1
2.0
4.7
7.6
5.9
6.5
8.5
12.3
10.1
8.4
Buru
ndi
0.6
1.1
0.8
1.2
0.8
1.4
1.1
1.2
3.6
3.1
3.4
1.9
4.2
4.2
4.2
3.1
Cam
eroo
n11
.913
.512
.63.
624
.419
.721
.84.
311
.912
.29.
913
.423
.825
.722
.517
.0Cô
te d
’Ivoi
re9.
210
.09.
67.
718
.715
.016
.89.
016
.718
.717
.612
.925
.928
.727
.220
.6Et
hiop
ia3.
05.
54.
04.
418
.615
.616
.97.
358
.558
.558
.539
.061
.564
.062
.543
.4G
ambi
a, T
he1.
41.
61.
58.
04.
43.
23.
89.
427
.636
.931
.714
.429
.038
.533
.222
.4Ke
nya
8.5
13.2
10.5
5.6
45.9
27.2
33.5
8.6
16.7
40.3
26.7
35.0
25.2
53.5
37.2
40.6
Mad
agas
car
7.7
10.4
8.9
7.8
12.5
11.8
12.1
8.2
2.7
3.5
3.1
4.0
10.4
13.9
12.0
11.8
Mal
awi
0.5
2.5
1.4
1.6
5.3
6.5
6.0
2.7
26.3
43.8
34.5
39.2
26.8
46.3
35.9
40.8
Moz
ambi
que
14.6
15.0
14.8
8.8
54.7
30.2
40.0
13.3
44.9
44.7
44.8
33.1
59.5
59.7
59.6
41.9
São
Tom
é an
d Pr
inci
pe13
.29.
011
.33.
240
.515
.525
.64.
429
.536
.332
.626
.642
.745
.343
.929
.8U
gand
a0.
41.
20.
70.
60.
91.
61.
240.
76.
58.
67.
33.
26.
99.
88.
03.
8Za
mbi
a9.
014
.211
.46.
624
.521
.222
.57.
917
.223
.019
.815
.826
.237
.231
.222
.4
Sour
ce: U
nder
stan
ding
Chi
ldre
n’s W
ork
calc
ulat
ions
bas
ed o
n W
orld
Ban
k St
anda
rd F
iles
and
Stan
dard
Indi
cato
rs d
atas
ets.
a. In
activ
e yo
uth
are
yout
h w
ho n
eith
er a
tten
d sc
hool
nor
wor
k no
r are
une
mpl
oyed
.b.
Jobl
ess
is th
e su
m o
f une
mpl
oyed
(as
mea
sure
d by
une
mpl
oym
ent r
atio
) and
inac
tive.
124
WB62_YALM_CH07 3/3/08 5:19 PM Page 124

School-to-Work Transitions: Regional Overview 125
a. Sex
9.09.6
12.4
0.9
13.010.9
1.9
5.9
1.63.4
13.3
0.8
3.5
8.59.1
0.4
9.5
15.2
0.7
11.8
1.2
4.1
11.012.0
4.5
0.7
per
cen
t
male female
b. Residence
1.2
9.5
14.6
2.0
7.4 6.2
1.1
7.4
15.3
0.45.6
18.5
2.1
8.6
32.1
2.5
16.118.4
2.1
12.7
4.4
10.9
18.514.0
0.80.1
per
cen
t
urban rural
c. Ever attended school
2.50.4
8.47.1
2.5 2.5
15.5
0.2
10.8
15.6
0.2
7.08.5
1.0
13.5
11.3
6.1
0.7
10.2
1.5
14.9
11.1
0.8
11.8
Burkin
a Fa
so
Burun
di
Camer
oon
Côte
d’Ivo
ire
Ethiop
ia
Gambia
, The
Kenya
Mad
agas
car
Mala
wi
Moz
ambiq
ue
São To
mé
and
Princip
eUga
nda
Zambia
Burkin
a Fa
so
Burun
di
Camer
oon
Côte
d’Ivo
ire
Ethiop
ia
Gambia
, The
Kenya
Mad
agas
car
Mala
wi
Moz
ambiq
ue
São To
mé
and
Princip
eUga
nda
Zambia
Burkin
a Fa
so
Burun
di
Camer
oon
Côte
d’Ivo
ire
Ethiop
ia
Gambia
, The
Kenya
Mad
agas
car
Mala
wi
Moz
ambiq
ue
São To
mé
and
Princip
eUga
nda
Zambia
per
cen
t
never attended ever attended
Figure 7.6. Unemployment Ratios for Young People Ages 15–24, by Sex, Residence,School Attendance, and Country
Source: Understanding Children’s Work calculations based on World Bank Standard Files and Standard Indicatorsdatasets.
WB62_YALM_CH07 3/3/08 5:19 PM Page 125
126 Guarcello, Manacorda, Rosati, Fares, Lyon, and Valdivia
phenomenon in the Sub-Saharan Africa region (figure 7.6). The differ-ence in youth unemployment by residence is generally very large: theunemployment ratio for urban young people is at least triple that for ruralyoung people in Burkina Faso, Burundi, Ethiopia, Mozambique, Uganda,and Zambia and at least twice that of rural young people in Kenya andMadagascar. These data highlight the different nature of the rural andurban labor markets for young people, particularly the important rolethat the agriculture sector plays in absorbing young rural workers. Notsurprisingly, differences by residence are largest in the countries whereagriculture is the most important.
Unemployment does not appear to be strongly correlated with whethera young person has had some exposure to schooling. Indeed, a larger pro-portion of youth with at least some schooling than youth with no school-ing are unemployed in 9 of the 12 countries (data are unavailable forMadagascar; see figure 7.6), even though a smaller proportion of schoolentrants than nonentrants are in the labor force.
These measures of unemployment understate the extent of the youthunemployment problem, for three reasons:
• First, and most important, these measures fail to capture discouragedworkers who have given up seeking work or who have never entered thelabor market because of meager job prospects. Discouraged workersaccount for part of the young people found in the inactive category.
• Second, and particularly relevant in Sub-Saharan Africa, these measuresfail to capture the group that is simply too poor to be unemployedand therefore must take up work regardless of its quality or level ofremuneration.
• Third, these youth unemployment indicators do not reflect underem-ployment. According to the definition of employment used to generateestimates of employment, anyone undertaking economic activity for anhour or more during the reference week is considered employed, even ifhe or she is actively looking for additional work. It is likely, particularlyin Sub-Saharan Africa, that many young people are technically catego-rized as employed but are putting in fewer hours than they desire.
Youth InactivityA very large proportion of the youth population is also inactive, neitherin education nor in the labor force, in several Sub-Saharan Africa countries(table 7.1). This group is also likely to be at risk of encountering difficultiesin finding and sustaining stable employment. At least one-fifth of young
WB62_YALM_CH07 3/3/08 5:19 PM Page 126
people are inactive in 7 of the 13 countries; inactivity is highest inEthiopia, at 59 percent of the 15–24 age group, and in Mozambique, at45 percent. Inactivity appears to have an important gender dimension:female youth are more likely to be inactive than their male counterpartsin all 13 countries.
To what extent do inactive youth represent discouraged workersrather than people involved in noneconomic work or nonwork activities?The data do not draw a clear line between the two possibilities. Mostinactive young people indicate spending time on noneconomic work(fetching water, fetching wood, cooking, child care, housekeeping), butthis is also the case for young people in the labor force and thereforedoes not necessarily reflect a choice of domestic work over labor marketinvolvement. Inactivity among young people has important economicand social consequences and requires in-depth analysis.
Youth Employment CharacteristicsObtaining employment does not necessarily imply successful entry intothe labor market. The most vulnerable population segments simply can-not afford to be unemployed and must accept work even if difficult,hazardous, socially unacceptable, or poorly paid. Therefore, indicatorsreflecting the conditions of employment are also critical for assessing thelabor market status of young people. Specific work quality indicators,including work intensity, job tenure, contractual and benefits coverage,workplace safety conditions, and so on are unfortunately beyond thescope of the data for the 13 countries. Data from the selected countriesdo, however, allow for the construction of an indicator of the generalmodality of work performed.
Workers fall into four main groups: wage employment, informal sec-tor employment, self-employment,10 and employer. The first three are ofrelevance for the 15–24 age group in Sub-Saharan Africa. The distribu-tion of youth workers across these groups again depends to a large extenton their country of residence (table 7.6). Informal work accounts for theoverwhelming majority of youth workers in Burkina Faso and Burundi,and it predominates in Madagascar. In rural Cameroon, Malawi, andMozambique, self-employment is most important. In rural Ethiopia andSão Tomé and Principe, wage employment is preponderate. Both infor-mal and self-employment are important in rural areas in The Gambiaand Kenya. With some exceptions, wage work is more important inurban areas, and informal (primarily agricultural) work is more impor-tant in rural areas.
School-to-Work Transitions: Regional Overview 127
WB62_YALM_CH07 3/3/08 5:19 PM Page 127

What do these breakdowns say about employment quality? The gener-ally low level of wage employment, even in urban areas, is significant,given that wage employment is typically the most sought-after form ofwork among young people and is most likely to offer a measure ofstability and some benefits coverage. The high level of informal employ-ment in most countries is also a quality concern. Informal work in ruralsettings is mainly associated with agriculture—and is typically low paidand seasonal. In urban settings, informal work frequently means insecure,nonfamily work in settings where labor and safety regulations do notapply, leaving workers susceptible to work place exploitation. In bothurban and rural settings, work in the informal economy is generally apoor alternative to formal sector employment. A high rate of involve-ment in self-employment (for example, in Cameroon, Malawi, andMozambique) can also be a sign of labor market entry difficulties.Evidence from South Africa, for instance, suggests that most young peopleare motivated to start their own businesses because of limited opportu-nities in the rest of the labor market.
Youth Labor Market DisadvantageComparing youth and adult unemployment rates provides some indicationof the extent to which young workers are disadvantaged in relation totheir adult counterparts in securing jobs. The youth unemployment rateexceeds the adult rate in all countries except Burundi and The Gambia
128 Guarcello, Manacorda, Rosati, Fares, Lyon, and Valdivia
Table 7.6. Employment Characteristics for the 15–24 Year-Old Age Group, by Country
Rural UrbanCountry Wage Informal Self Other Wage Informal Self OtherBurkina Faso 0.4 94.8 4.8 0.0 27.9 57.0 14.4 0.7Burundi 1.8 83.3 14.8 0.1 31.3 19.6 43.3 5.8Cameroon 6.3 18.1 68.8 6.8 15.3 56.9 22.0 5.9Côte d’Ivoire — — — — — — — —Ethiopia 55.6 24.8 16.2 3.4 16.2 38.2 23.3 22.3Gambia, The 1.2 53.1 45.0 0.8 42.3 20.7 34.7 2.4Kenya 16.4 40.0 43.6 0.0 21.1 53.3 25.4 0.2Madagascar 5.9 69.7 23.5 1.0 19.3 58.7 18.2 3.8Malawi 15.0 7.1 74.5 3.3 63.8 6.8 19.8 9.5Mozambique 11.8 — 86.7 1.5 40.2 — 53.5 6.3São Tomé and
Principe 59.5 34.3 — 6.2 66.3 24.3 — 9.5Uganda — — — — — — — —Zambia 3.1 60.4 36.1 0.4 40.9 9.6 46.1 3.5
Source: Understanding Children’s Work calculations based on World Bank Standard Files and Standard Indicators datasets.Note: — = unavailable data, because of survey instrument structure.
WB62_YALM_CH07 3/3/08 5:19 PM Page 128

(figure 7.7).Young workers appear particularly disadvantaged in Cameroonand São Tomé and Principe, where the youth unemployment rate is morethan five times that of adults. Youth unemployment does not appear tobe correlated with adult unemployment, suggesting that factors unique tothe youth labor market are important in driving it.
Sub-Saharan Africa countries show a higher (sometimes much higher)ratio of youth to adult unemployment than do Organisation for EconomicCo-operation and Development (OECD) countries (The Gambia andBurundi excepted; figure 7.8).Also striking in the comparison with OECDcountries is the large variation among African countries. The reasons forthis variation are not immediately apparent and merit more detailedinvestigation, with regard to both data and determinants.
Differences between youth and adult work characteristics also providean indication of youth labor market disadvantages. The work performedby young people appears to differ dramatically from that performed byadults (table 7.7).Young people are much less likely to be involved in wagework (Mozambique and São Tomé and Principe excepted) and much morelikely to be performing informal work (São Tomé and Principe excepted).This suggests that adult wage workers in general enjoy a greater degree of
School-to-Work Transitions: Regional Overview 129
Zambia
Burkina FasoBurundi
Cameroon Côte d'IvoireEthiopia
The Gambia
Kenya
Madagascar
Malawi
Mozambique
São Tomé and Principe
0
5
10
15
20
25
30
35
40
45
5 10 15 20 25 30 35 40 45adult unemployment rate (percent)
you
th u
nem
plo
ymen
t ra
te (
per
cen
t)
Figure 7.7. Youth versus Adult Unemployment
Source: Understanding Children’s Work calculations based on World Bank Standard Files and Standard Indicators datasets.Note: The diagonal line indicates that a country’s adult and youth unemployment rates are similar. If the country isabove the line, it indicates youth disadvantage, meaning higher youth unemployment rate compared to adults.
WB62_YALM_CH07 3/3/08 5:19 PM Page 129

2.5
5.1
1.9
2.3
3.9
1.5
2.3
3.0
5.9
1.1
2.9
2.3
2.1
2.3
1.6
2.3
2.1
2.3
4.1
2.2
1.7
2.4
3.0
0.4
0.9
0123456
Burkin
a Fa
soBur
undi Cam
eroo
nCôt
e d’I
voire
Ethiop
iaGam
bia, T
heKen
ya Mad
agas
car
Mala
wiM
ozam
bique
São To
mé
and
Princip
eUga
nda
Zambia
Austra
liaCan
ada
Czech
Rep
ublic Den
mar
kFinl
and Hun
gary
Japa
nNor
waySwed
en Switzer
land
United
King
dom
United
Sta
tes
ratio of youth to adultunemployment
Fig
ure
7.8.
Rat
io o
f You
th to
Ad
ult U
nem
plo
ymen
t Rat
es, S
ub-S
ahar
an A
fric
an C
ount
ries
an
d O
ECD
Cou
ntri
es
Sour
ce:U
nder
stan
ding
Chi
ldre
n’s W
ork
calc
ulat
ions
bas
ed o
n W
orld
Ban
k St
anda
rd F
iles
and
Stan
dard
Indi
cato
rs d
atas
ets
and
OEC
D (2
000)
.N
ote:
25–5
5 ad
ult a
ge c
ohor
t for
OEC
D c
ount
ries;
25–5
0 ad
ult a
ge c
ohor
t use
d fo
r Sub
-Sah
aran
Afri
ca c
ount
ries.
OEC
D d
ata
are
for 1
998.
130
WB62_YALM_CH07 3/3/08 5:19 PM Page 130

job security and social protection and are less exposed to the instabilityand various risks associated with informal sector work. The fact thatyounger workers appear to be scarce among the self-employed suggeststhat they even find it difficult to start their own businesses, perhapsbecause of lack of capital.
The analysis in this section clearly indicates that young people, particu-larly urban young people, face a difficult labor market. Their unemploy-ment and jobless rates are much higher than those of adults and of youthin more developed countries. They rely on informal work lacking basic jobprotections and benefits much more than do their adult counterparts. Thedisadvantaged position of youth in the labor market may be associatedwith, or even a result of, a difficult or inefficient transition from school tothe labor market. The next section looks at this issue by constructing anindicator of the duration of the school-to-work transition, a first and neces-sary step to understanding the process by which young people transition toworking life.
The Transition from School to Work
The transition from school to work is by no means a linear, well-definedprocess with a distinct end point. Individuals alternate between periods of
School-to-Work Transitions: Regional Overview 131
Table 7.7. Youth versus Adult Employment Characteristics by Country
ModalityWage Informal Self Other
Country Youth Adult Youth Adult Youth Adult Youth AdultBurkina Faso 3.24 7.55 90.85 59.29 5.82 32.49 0.09 0.68Burundi 1.66 5.78 85.26 39.51 12.84 54.22 0.24 0.49Cameroon 8.18 16.43 26.12 14.5 65.7 69.07 — —Côte d’Ivoire — — — — — — — —Ethiopia 46.69 75.68 27.81 16.95 17.84 3.75 7.67 3.63Gambia, The 10.07 19.22 46.07 13.83 42.73 65.82 1.13 1.12Kenya 17.94 30.83 44.41 19.74 37.59 48.64 0.07 0.79Madagascar 7.78 15.93 68.08 31.12 22.78 50.63 1.36 2.32Malawi 18.82 26.68 7.12 5.11 70.28 64.89 3.77 3.33Mozambique 15.13 16.61 — — 53.45 69.56 1.19 0.47São Tomé and
Principe 63.21 57.79 28.8 41.53 — — 7.99 0.68Uganda 3.24 7.55 90.85 59.29 5.82 32.49 0.09 0.68Zambia 9.54 23.85 51.76 16.85 37.79 58.3 0.91 1
Source: Understanding Children’s Work calculations based on World Bank Standard Files and Standard Indicators datasets.Note: — = unavailable data, because of survey instrument structure. Youth is 15–24 age group; adult is 25–50 age group.
WB62_YALM_CH07 3/3/08 5:19 PM Page 131
employment and unemployment, change jobs, or even choose to remainout of work.
Young individuals might take up temporary jobs, work in the householdfarm or enterprise, or devote themselves to household chores for lack ofbetter work opportunities or of the prospect of potential returns. Thesetransition problems are particularly relevant in developing countries wherewomen’s labor force participation (at least in the market) is low; and, mostimportant, underemployment, self-employment, home production, andcasual employment are widespread. The process is made even more com-plex by the fact that the time of school leaving is endogenous and mostlikely influenced by expectations about the transition to work. A betterunderstanding of this transition period would require integrating theanalysis of optimal school-leaving age with the analysis of employmentsearch and labor force participation.
Assessment of the Transition to Working Life
The transition to work in Sub-Saharan Africa can take two routes: throughthe schooling system, or from inactivity (or informal schooling11) to thelabor force. This section examines both routes to identify vulnerablegroups and targets for policies. It uses the synthetic indicator developed inannex 1 to provide an overview of the routes young people in Sub-SaharanAfrica take from education to the labor force. For the group enteringdirectly into the labor force, the average age of entry into the labor marketis examined. A nonnegligible number of children drop out of school veryearly. While they are formally included in the youth transiting throughschool, their condition and the problems they face are likely to be closerto those of the children that never attended school.
School-to-Work TransitionsThe timing and length of the transition depends to a considerable extent onthe specific country of residence (table 7.8).The average school-leaving agevaries from 15.9 years (São Tomé and Principe) to 19 years (Cameroon),and the average age at first job from 18.4 years (Côte d’Ivoire) to 24.4 years(Malawi). The total transition duration is just one year in Côte d’Ivoire,compared with almost seven years in Mozambique. The “vulnerability” ofyoung people to unsuccessful transition, as reflected in beginning age andtransition duration, varies greatly by country. The synthetic indicator canhelp to identify the age range upon which policy attention should befocused in each country.
132 Guarcello, Manacorda, Rosati, Fares, Lyon, and Valdivia
WB62_YALM_CH07 3/3/08 5:19 PM Page 132

Tab
le 7
.8. S
choo
l-to
-Wor
k Tr
ansi
tion
Poi
nts
by
Res
iden
ce a
nd
Cou
ntry
Child
ren
ever
in s
choo
lEn
d po
int o
fCh
ildre
n ne
ver
Begi
nnin
g po
int
tran
sitio
nin
sch
ool
of tr
ansi
tion
Aver
age
age
of e
nter
ing
Aver
age
age
of e
nter
ing
Aver
age
age
ofin
to w
ork
for
Tran
sitio
n du
ratio
nin
to w
ork
for
Age
refe
renc
eCo
untr
ysc
hool
leav
ing
the
first
tim
eTo
tal
Urb
anRu
ral
the
first
tim
egr
oup
Burk
ina
Faso
17.1
18.6
1.5
2.9
1.6
8.4
5–24
Buru
ndi
18.8
20.7
1.9
4.5
1.7
10.2
5–24
Cam
eroo
n19
.023
.84.
85.
43.
711
.25–
24Cô
te d
’Ivoi
re17
.418
.41.
00.
33.
011
.55–
24Et
hiop
ia18
.023
.45.
44.
75.
416
.45–
24G
ambi
a, T
he17
.423
.25.
86.
83.
511
.35–
24Ke
nya
17.7
22.6
5.3
5.5
5.0
14.8
5–24
Mad
agas
car
17.2
19.0
1.8
2.5
1.2
FEW
OBS
10–2
4M
alaw
i18
.824
.45.
65.
55.
612
.75–
24M
ozam
biqu
e16
.723
.46.
76.
86.
917
.15–
24Sã
o To
mé
and
Prin
cipe
15.9
21.3
5.4
4.7
5.9
16.3
5–24
Uga
nda
18.0
21.3
3.3
3.8
3.2
13.8
5–24
Zam
bia
17.5
22.4
5.0
7.0
3.6
14.5
5–24
Sour
ce: U
nder
stan
ding
Chi
ldre
n’s W
ork
calc
ulat
ions
bas
ed o
n W
orld
Ban
k St
anda
rd F
iles
and
Stan
dard
Indi
cato
rs d
atas
ets.
Not
e: T
able
sho
ws
estim
ated
pro
babi
litie
s ca
lcul
ated
on
the
basis
of t
he a
ge a
t whi
ch w
ork
part
icip
atio
n ra
te is
at i
ts m
axim
um.
133
WB62_YALM_CH07 3/3/08 5:19 PM Page 133

Looking first at the starting point of the transition, average school-leaving ages appear relatively high (table 7.8 and figure 7.9)12; however,two caveats apply to this conclusion. First, not all young people attendschool, so this conclusion applies only to those who start school. Second,the same leaving age is likely to be associated with lower human capitalaccumulation in less developed countries because of frequent delayedentry into school, intermittent attendance, and grade repetition.
The relatively high school-leaving age in these 13 countries is notewor-thy, particularly against a backdrop of low overall school enrollment ratesin Sub-Saharan Africa. In Burkina Faso, for example, at 17.1 years, theaverage age of school leaving, overall educational involvement stands atjust 15 percent (figure 7.10). The late average leaving age for students everenrolled in school underscores the importance of the selection processassociated with initial enrollment: those children with the opportunity toget into school in the first place tend to stay there well into their teens inall 13 countries examined.
The average age of entering the labor market shows a larger variationacross countries than the age of leaving school, indicating that the tran-sition from school to work is more affected by the characteristics of theprocess of finding a job than by time of school leaving. The length of thetransition phase is strikingly different between urban and rural areas (seetable 7.8). Gender differences are also likely to be important because ofthe lower participation rate of women, especially in urban areas.
Within countries, the characteristics of the transition appear to dependsignificantly on both residence and sex, and on the interaction between thetwo. Overall, females tend to leave school at an earlier age and transition towork more slowly than males, and rural youth tend to start the transitionearlier and find employment more quickly than urban youth. There arefour overall patterns:
• Male youth stay longer in education than female youth. Thus, maleyouth start the transition to work at a later age than females in bothurban areas (except in Kenya) and rural areas (except in Kenya andUganda).
• Urban youth are more advantaged than rural youth in educational attain-ment.The transition to work starts later in urban areas than in rural areasfor both males (all countries) and females (except in São Tomé andPrincipe).
• Residence appears to affect transition duration for female youth butnot male youth. Labor market entry takes longer for female youth in
134 Guarcello, Manacorda, Rosati, Fares, Lyon, and Valdivia
WB62_YALM_CH07 3/3/08 5:19 PM Page 134

School-to-Work Transitions: Regional Overview 135
5.64.0
4.84.2
2.2
4.2
5.6
4.4
2.5
5.7
3.6
4.03.0
7.4
3.12.9
4.6
7.24.6
6.7
5.56.16.9
5.94.1
6.0
1.0 1.52.3
2.63.4
6.66.2
2.84.4
4.53.4
3.72.3
1.3 1.6
3.7
6.94.3
1.0 3.04.8
3.2
1.12.2
3.32.0
15 16 17 18 19 20 21 22 23 24 25 26 27
Burkina Faso
Burundi
Cameroon
Côte d’Ivoire
Ethiopia
Gambia, The
Kenya
Ghana
Madagascar
Malawi
Mozambique
São Toméand Principe
Uganda
Zambia
age in years
male/urban female/urban male/rural female/rural
Figure 7.9. Length and Timing of Transition from School to Work for Children Ever Attending School by Sex, Residence, and Country
Source: Understanding Children’s Work calculations based on World Bank Standard Files and Standard Indicatorsdatasets.
WB62_YALM_CH07 3/3/08 5:19 PM Page 135

urban areas than in rural areas (except in Côte d’Ivoire and São Toméand Principe), but there is no consistent pattern in transition lengthby residence for male youth.The transition for female rural youth is par-ticularly short in Burkina Faso, Burundi, and Madagascar, at only one year.
• Gender appears related to transition duration in urban but not in ruralareas. Urban male youth make the transition to work more quicklythan female urban youth (Côte d’Ivoire excepted), but there is noconsistent pattern in transition duration by sex in rural areas.
As noted at the outset, the synthetic indicator does not permit conclu-sions about the “efficiency” or “success” of the transition in specific countrycontexts. A better understanding of the transition period would requireintegrating the analysis of optimal school-leaving age with that of employ-ment search and labor force participation. Even so, the synthetic indicatordoes reveal two important features of the transition in Sub-Saharan Africacountries that fit within this more detailed analysis—a relatively latestarting age for the transition and its typically long duration.
The transition is very prolonged—five years or longer—in 8 of the13 countries (Cameroon, Ethiopia, The Gambia, Kenya, Malawi,Mozambique, São Tomé and Principe, and Zambia). This suggests thatyoung people in these countries meet significant labor market entryproblems on leaving the school system and must deal with a drawn outperiod of job search or inactivity. It is also interesting to observe that
136 Guarcello, Manacorda, Rosati, Fares, Lyon, and Valdivia
8.311.112.917.019.4
27.527.530.2
34.130.7
14.910.2 7.1 6.3 4.9
18.024.5
27.935.936.8
39.146.9
56.464.5
75.681.1
85.1
55.0
91.2 88.2
10 11 12 13 14 15 16 17 18 19 20 21 22 23 24age in years
per
cen
t
school enrollment as apercentage of allchildren
school enrollment as apercentage of childrenever in school
averageschool-leaving
age
Figure 7.10. School Enrollment by Age and School Attendance in Burkina Faso
Source: Understanding Children’s Work calculations based on World Bank Standard Files and Standard Indicatorsdatasets.
WB62_YALM_CH07 3/3/08 5:19 PM Page 136

while the transition tends to be longer in urban areas in several countries,this is not a general pattern. The transition in rural areas can be equallylong, indicating that problems of entry into the labor market are not anexclusively urban phenomenon. However, given that school attendancerates are generally substantially lower in rural areas, the phenomenontends to be more relevant in absolute terms in urban areas.
An initial period of unemployment following schooling is not unusualas young people spend time looking for the best jobs, but the length ofthis jobless period in Sub-Saharan Africa extends well beyond whatcould plausibly be considered “wait” unemployment. As noted above,long periods of initial joblessness can translate into permanently reducedproductive potential and job prospects. They therefore constitute a par-ticular policy concern.
Factors Affecting the School-to-Work TransitionThe duration of transition from school to work is characterized by largecross-country variation. It is beyond the scope of this report to identifythe individual, household, and institutional characteristics that couldhelp to explain this variation, but the extent to which characteristics ofthe economies considered could affect it are assessed.
GDP growth is an obvious candidate to control for differences in theability of the economies to absorb school leavers in the labor market(figure 7.11). The school nonentrance rate and the share of youth in thetotal population proxy for cross-country differences in the size of theschool leavers’ cohort. Openness to trade (as proxied by the ratio ofexports plus imports to GDP) and the share of industrial value added intotal value added proxy for differences in the structure of the economies.Finally, a measure of income inequality controls for cross-country differ-ences in access to labor markets resulting from wealth.
The data do not suggest any strong relationship between the duration ofthe school-to-work transition and the broader macroeconomic and demo-graphic context (figure 7.11).13 Cross-country variations in transitionduration seem not to be explained on the basis of available information.This suggests that the factors specific to the youth labor market are moreimportant in determining transitions than macroeconomic differences.
Transitions Directly to Working LifeTo this point, only the group of children that has spent at least sometime in formal education has been considered. However, youth enteringthe labor market do not necessarily pass through the schooling system.
School-to-Work Transitions: Regional Overview 137
WB62_YALM_CH07 3/3/08 5:19 PM Page 137

138 Guarcello, Manacorda, Rosati, Fares, Lyon, and Valdivia
Burundi
ZambiaThe Gambia
MozambiqueKenya
Cameroon
Côte d’Ivoire
MadagascarBurkina Faso
UgandaSão Toméand Principe
Ethiopia
Malawi
1
2
3
4
5
6
7
8
–5 0 5GDP growth (5-year average)
tran
siti
on
du
rati
on
(ye
ars)
Burundi
MadagascarBurkina Faso
Uganda
Côte d’Ivoire
Zambia
Kenya
São Toméand Principe
Ethiopia
Mozambique
Malawi
The GambiaCameroon
1
2
3
4
5
6
7
8
–5 0 5 10GDP growth (5-year average)
tran
siti
on
du
rati
on
(ye
ars)
c. Income distribution d. School nonentrance
a. GDP growth rates, transitionduration urban areas
b. GDP growth rates, transitionduration rural areas
Ethiopia
Côte d’Ivoire
Burkina FasoBurundi
Uganda
ZambiaKenya
Mozambique
MalawiThe Gambia
0
1
2
3
4
5
6
7
8
2.5 5.0 7.5 10.0share of income of lowest 20%
tran
siti
on
du
rati
on
(ye
ars)
Ethiopia
Burkina FasoMadagascar
Côte d’Ivoire
Burundi
The Gambia
Cameroon
Mozambique
Malawi
São Toméand Principe
Kenya
Zambia
0
1
2
3
4
5
6
7
8
20 40 60 80youth never entering school (%)
tran
siti
on
du
rati
on
(ye
ars)
Figure 7.11. Correlation between Transition Duration and Selected Macroeconomicand Demographic Factors
A substantial group of young people in most Sub-Saharan African coun-tries never enter school and thus transition directly from inactivity to thelabor force.
This group of school nonentrants is also an important policy concern;with very little human capital, they are especially vulnerable to undesirabletransition outcomes. As children, school nonentrants are among the groupsmost vulnerable to child labor (figure 7.12).
The size of the group of school nonentrants varies considerably acrosscountries. For one broad group, most children (at least 90 percent) attendschool for at least some period (for example, in Kenya, Mozambique, SãoTomé and Principe, and Zambia), and the school-to-work transitionframework is especially relevant for analyzing employment outcomes. For a
(continued)
WB62_YALM_CH07 3/3/08 5:19 PM Page 138

School-to-Work Transitions: Regional Overview 139
second group, the percentage of youth that has not attended school ismuch higher, ranging from 17 percent in Cameroon to 70 percent inBurkina Faso. Differences exist by residence and sex within countries, andrural children, particularly rural female children, are consistently the leastlikely to have had the opportunity to enter school (for example, in BurkinaFaso, Burundi, Cameroon, and Côte d’Ivoire).
No obvious benchmark allows us to establish at what age these chil-dren begin to look for employment. But the average age at first job forchildren never attending school is relatively high in several countries(figure 7.13). These children begin work in Kenya at 15 years old and inEthiopia, Mozambique, and São Tomé and Principe at about 16 yearsold. Rural school nonentrants secure employment at the earliest age
Figure 7.11. (continued)
tran
siti
on
du
rati
on
(ye
ars)
tran
siti
on
du
rati
on
(ye
ars)
tran
siti
on
du
rati
on
(ye
ars)
tran
siti
on
du
rati
on
(ye
ars)
Côte d’Ivoire Burkina Faso
BurundiMadagascar
Uganda
Cameroon
Zambia
EthiopiaKenya
Malawi
São Toméand Principe
The Gambia
Mozambique
0
1
2
3
4
5
6
7
8
35 40 45 50
youth as a percentage of total population
São Toméand Principe
Cameroon
Malawi
Madagascar
Cote d'IvoireBurkina Faso
Burundi
Mozambique
The Gambia
Zambia
KenyaEthiopia
0
1
2
3
4
5
6
7
8
5 10 15
adult unemployment rate
g. Openness to trade h. Industry share in value added
e. Youth population share f. Adult unemployment rate
São Tomé andPrincipe
Zambia
Uganda
BurundiBurkina Faso
Madagascar
Cote d'Ivoire
Malawi
The Gambia
Kenya
Cameroon
Ethiopia
Mozambique
0
1
2
3
4
5
6
7
8
20 40 60 80
trade as share of GDP
Côte d’Ivoire
Burkina FasoMadagascar Burundi
Uganda
Zambia
Cameroon
Mozambique
Kenya
Malawi
São Tomè andPrincipe
The Gambia
Ethiopia
0
1
2
3
4
5
6
7
8
10 20 30
share of industry in value added
Source: Understanding Children’s Work calculations based on World Bank Standard Files and Standard Indicatorsdatasets; World Bank 2004.
WB62_YALM_CH07 3/3/08 5:19 PM Page 139

140 Guarcello, Manacorda, Rosati, Fares, Lyon, and Valdivia
Figure 7.12. The Proportion of Children Ages 8–12 Who Are Economically Active
68.6
51.1
38.1
16.8
4.5
26.7
3.0 3.0
17.3 17.3
7.7
0
10
20
30
40
50
60
70
Burkin
a Fa
so
Burun
di
Côte
d’Ivo
ire
Ethiop
ia
Gambia
, The
Kenya
Mad
agas
car
Mala
wi
Moz
ambiq
ue
São To
mé
and
Princip
eZam
bia
per
cen
t
8-year-olds
10-year-olds
12-year-olds
14-year-olds
Source: Understanding Children’s Work calculations based on World Bank Standard Files and Standard Indicatorsdatasets.
8.4
10.211.2 11.5
16.4
11.3
14.8
12.7
17.116.3
13.814.5
89
101112131415161718
Burkin
a Fa
so
Burun
di
Camer
oon
Côte
d’Ivo
ire
Ethiop
ia
Gambia
, The
Kenya
Mad
agas
car
Mala
wi
Moz
ambiq
ue
São To
mé
and
Princip
eUga
nda
Zambia
year
s
Figure 7.13. Age at First Job for Children Never Attending School, by Country
Source: Understanding Children’s Work calculations based on World Bank Standard Files and Standard Indicatorsdatasets.
(Ethiopia and São Tomé and Principe excepted). Though it is reasonableto assume that because they are not involved in school, these childrenwould start to look for employment rather early, progress in the labormarket is not easy for them either.
The numbers of children who do not enter the school system are rela-tively large in several Sub-Saharan African countries.14 These childrenare likely to enter the labor market in a particularly weak position andgrow to be very vulnerable (employed or unemployed) youth. Children
WB62_YALM_CH07 3/3/08 5:19 PM Page 140

School-to-Work Transitions: Regional Overview 141
who never attended school tend to enter the labor market early, but theymay still face difficulties in finding a job. An analysis of the situation ofyouth in the labor market cannot avoid focusing on these early labormarket entrants. Child laborers of today will be the weakest youthtomorrow. The analysis of child labor should thus be integrated intolabor market analysis to give a consistent picture of the condition ofyouth in the labor market.
Annex 7A.1
Building a Simple Indicator of the School-to-Work TransitionThis annex develops a simple indicator of the transition from school towork that should be comparable across countries. To describe the transi-tion from school to work, the distribution of school-leaving age and thedistribution of age of entry into the first job must be derived. The differ-ence between the average school-leaving age and the average age of firstentry into work is computed as a synthetic indicator of this transition.
This is not the first attempt to describe the school-to-work transi-tion process. For example, OECD (1998, 1999, 2000) uses the age atwhich 50 percent of individuals are in employment to determine theend point of the transition. Measures of transition based on this defini-tion implicitly assume that the overall portion of individuals enteringemployment is above 50 percent (otherwise, no transition would everbe completed) and that the overall proportion of individuals who enteremployment in all countries is roughly comparable (otherwise, thisindicator would be biased by the overall differences in participationacross countries). Neither of these assumptions is likely to be true,especially in developing countries. Similar problems occur when esti-mating the starting point of the transition. For example, OECD indica-tors implicitly assume that all children begin to attend school and thatthe vast majority of them stay in school at least until the end of thecompulsory grade level, an assumption that can hardly be maintainedin most developing countries.
We try to circumvent these problems by standardizing measures ofschool-to-work transition to the population in question: that is, thosewho eventually pass through school and participate in the labor force.
Modeling the transition process from school to work ideally requireslongitudinal data with detailed job history information that follow individ-uals from childhood to adulthood, or alternatively, cross-sectional data withretrospective information to reconstruct work histories. In the absence of
WB62_YALM_CH07 3/3/08 5:19 PM Page 141

142 Guarcello, Manacorda, Rosati, Fares, Lyon, and Valdivia
the longitudinal data (generally unavailable in developing countries), onecan use cross-sectional data to measure the length of the transition. Underappropriate assumptions, the available cross-sectional data allow consistentidentification of the parameters of interest. Because indicators and theirinterpretation depend on the underlying assumptions, it is necessary todescribe the assumptions to allow comparability with other indicators.
Suppose there exists an age amin, such that for a � amin individualsnever transit into school and such that for a � amin individuals nevertransit out of school. In this case, at age amin those who have ever enteredschool are all in school. Thus, if S denotes the event of being in school,the probability of leaving school at age a, denoted by SLa is
SLa� � [P(Sa�1) � P(Sa)] when a � amin. (1)
Equation (1) is the change in enrollment across two consecutive ages,and simply states that if, say, 90 percent of children are in school at age10 and 80 percent are in school at age 11, then 10 percent of childrenmust have dropped out between age 10 and age 11.
Assume in addition that for any age a � amax, individuals never leavework and for a � amax individuals have never entered work. This impliesthat at amax, all who ever work are simultaneously in work. Thisassumption—admittedly more unrealistic than the previous one—rulesout exit from employment before amax and exit from inactivity afteramax. In this case, if W denotes work and EWa denotes the probabilityof entry into work at age a,
EWa � P(Wa�1) � P(Wa), when a � amax. (2)
Equation (2) is the increase in participation from one year to another,and states that if, say, 10 percent of children are in work at age 14 and15 percent are in work at age 15, then 5 percent of children must havestarted to work between age 14 and age 15.
One major difficulty with these indicators is that not all individu-als make a transition through school (a relevant problem in develop-ing countries) and, most important, that not all individuals transitioninto work. This is particularly true for women, especially if work isdefined as participation in a market-oriented economic activity.Hence, these indexes are derived conditional on individuals ever tran-sitioning into the relevant state; as for the others, there is no transitionto be defined.
WB62_YALM_CH07 3/3/08 5:19 PM Page 142

School-to-Work Transitions: Regional Overview 143
Under the foregoing assumptions, the average school-leaving age(conditional on having ever been in school) is expressed as
(3)
and the distribution of age of entry into work is
(4)
Notice that and hence
� 1. A similar reasoning applies to the weights in equation (3).We compute our synthetic index as
I � E(SL) � E(EW). (5)
This index is the average gap between age of entry into work (condi-tional on ever entering work) and age of exit from school (conditional onever entering school).
To the extent that the distribution of school-leaving rates (entry rates)is symmetrical, the indexes in equations (4) and (5) are also the medianof the conditional distributions. In this case, our index differs from theone used by OECD (2000) in the adjustment factor for the populationat risk, which seems necessary in the countries under study.
Empirical ImplementationThis section describes the empirical implementation of the indicatorwhen, as is the case here, only one cross-section is available. As a first step,we fit a probit model on the probability of being in school across all indi-viduals in the sample separately for males and females in each country.Weregress this on a polynomial in age. Fitting a probit model is useful forsmoothing the age participation profiles in the presence of measurementerrors and small sample sizes and allows sample predictions to be made, ifnecessary. The turning point in the estimated age participation profile isamin. We repeat the same procedure for the probability of work. We fit aprobit model on the probability of working across all individuals in thesample separately for males and females in each country. We regress thison a polynomial in age. We use these estimated probabilities to computethe indicators in equations (3) and (4) and, ultimately, equation (5).
There are several drawbacks to this procedure. First, although it isgenerally possible to ascertain whether individuals in work ever attended
P(W )]amax
∑a < a amax[EW /P(W ) = EWa a < a amax max
∑
E(EW) = a [EW P(Wa > a a amax maxΣ / )].×
E(SL) = a [SL P(Sa > a a amin minΣ / )]×
WB62_YALM_CH07 3/3/08 5:19 PM Page 143

144 Guarcello, Manacorda, Rosati, Fares, Lyon, and Valdivia
school, it is impossible to know whether those who attend school everget a job. So, in computing the average age of exit from school we areunable to condition the average age of exit from school on those even-tually transitioning to the labor market. The index in equation (5) is theaverage age gap for those who ever enter into work after school (hence,the true school-to-work transition age gap) only under the assumptionthat age of exit from school is uncorrelated with the probability ofentering into work later in life, an assumption that some may not findcompelling. If early school leavers are less likely to eventually find a job,the gap will be overestimated; if they are more likely to do so, the gapwill be underestimated.
A second drawback of this procedure when applied to a single cross-section is that the index is derived from a comparison of individuals ofdifferent ages at a given time and hence from different birth cohorts.The bias is difficult to determine. If there is a secular increase in school-leaving age without relevant changes in the age of first employmentacross cohorts, it may result in an underestimation of the length of thetransition period from school to work in each country. If the age of firstemployment shows a secular increase, the bias could go in either direc-tion. However, if one is ready to assume that these biases are similaracross countries, it is still possible to make a sensible inference aboutdifferences across countries.
Notes
1. The countries selected for inclusion in this book are Burkina Faso, Burundi,Cameroon, Côte d’Ivoire, Ethiopia, The Gambia, Kenya, Madagascar, Malawi,Mozambique, São Tomé and Principe, Uganda, and Zambia. As part of broaderefforts toward durable solutions to child labor, the International LabourOrganization, United Nations Children’s Fund, and the World Bank initiatedthe interagency Understanding Children’s Work (UCW) project in December2000. The project is guided by the Oslo Agenda for Action, which laid out thepriorities for the international community to fight child labor. Through a vari-ety of data collection, research, and assessment activities, the UCW project isbroadly directed toward improving understanding of child labor, its causes andeffects, how it can be measured, and effective policies for addressing it. Forfurther information, see the project Web site at www.ucw-project.org.
2. An employed person fits in any of the following categories: holding paidemployment, at work, or with a job but not at work now.This includes personswaiting to rejoin employment and employers or persons in self-employment.This classification should include unpaid family laborers who hold jobs in
WB62_YALM_CH07 3/3/08 5:19 PM Page 144

market-oriented establishments, irrespective of the number of hours workedduring a reference period. However, some countries prefer for special reasonsto set a minimum time criterion for the inclusion of unpaid family laboramong the employed. Usually, if a person works for more than seven hoursa day, they are considered employed.
An unemployed person is a person who fulfills any or all of the followingcriteria: without work and currently available for work or seeking work bytaking necessary steps to seek paid employment (such steps include applyingfor jobs or registering with an agency).
An inactive person is a person who is neither in the labor force (employedor unemployed) nor in education.
3. As measured by the unemployment ratio (unemployed as a proportion of thepopulation) rather than the unemployment rate (unemployed as a proportionof the labor force).
4. Joblessness, unlike unemployment, has the advantage of reflecting both unem-ployed and discouraged workers who have left or not entered the work force.
5. Inactivity among youth has important economic and social consequences andwill require an in-depth analysis beyond the scope of the present report.Differences by residence in the composition of the inactive also merit investi-gation. In rural areas, where service coverage is typically less extensive, a largerproportion of inactive young people might in fact be performing chores suchas water collection and fuelwood fetching. In urban areas, however, where theburden of household chores is typically lower, discouraged workers might con-stitute a larger proportion of the inactive.
6. Some forms of economic work, water fetching, for example, are also reflectedin this category.
7. Teenagers refers to the 15–19 age group. Young adults refers to the 20–24 agegroup.
8. The unemployment rate (that is, unemployment as a proportion of the totallabor force in the same age group; not shown in table) is actually higher forteenagers than for young adults. This is a reflection of the fact that teenagersare more likely to be in education and therefore outside the labor force.
9. See http://millenniumindicators.un.org/unsd/mi/mi_goals.asp.
10. Wage employees are all persons in paid employment remunerated by wages andsalaries or commission from sales, price-rates, bonuses, or in-kind payments.Basic remuneration is not directly dependent on revenue of the unit workedfor but on the explicit (written or oral) or implicit employment contract.Wage employees may be regular employees with fixed-term contracts orwithout limits of time, or casual workers without contracts.
Informal sector employees are those employed in a semiorganized unit, whetherlegally registered or not. At an operational level, the ILO informal sector
School-to-Work Transitions: Regional Overview 145
WB62_YALM_CH07 3/3/08 5:19 PM Page 145

surveys define informal sector employment to consist of all own-accountworkers, unpaid family workers who work for seven or more hours per day, andemployers and employees in establishments with fewer than 5 or 10 personsengaged. Paid domestic workers are excluded.
Self-employed persons perform work for profit or family gain either in cashor in kind. The remuneration is dependent on profits derived from the goodsand services produced (own consumption from enterprise is considered partof profits). The self-employed person makes operational decisions affectingthe enterprise or may delegate decisions while retaining the responsibilityfor the welfare of the enterprise.This is a one-person business (meaning a busi-ness headed by a single person) and may include contributing family workers.
11. For example, Koranic schooling.
12.The calculation of average school-leaving age is, however, different in table 7.8and figure 7.9; comparisons are therefore only indicative.
13. We also used different disaggregations of the duration of the transition by sexand by residence, but the results obtained are similar to those presented here.
14. To which should be added those children who drop out very early and whocannot be identified on the basis of the available information.
References
Bennell, P. S. 1996. “Rates of Return to Education: Does the Conventional PatternPrevail in Sub-Saharan Africa?” World Development 24 (1): 183–200.
Betcherman, G., J. Fares,A. Luinstra, and R. Prouty. 2005. “Child Labor, Educationand Children’s Rights.” In Human Rights and Development: Towards MutualReinforcement, ed. P. Alston and M. Robinson. Oxford, United Kingdom:Oxford University Press.
Collier, P., and J. W. Gunning. 1999. “Explaining African Economic Performance.”Journal of Economic Literature 37 (1): 64–111.
Fluitman, F. 2001. “Working, But Not Well: Notes on the Nature and Extent ofEmployment Problems in Sub-Saharan Africa.” International Training Centreof the International Labour Organization, Turin, Italy.
Freeman, R. B., and D. L. Lindauer. 1999. “Why Not Africa?” NBER WorkingPaper No. W6942, National Bureau of Economic Research, Cambridge, MA.
Glewwe, P. 1991. Schooling, Skills and the Returns to Government Investment inEducation: An Exploration Using Data from Ghana. Washington, DC: WorldBank.
ILO (International Labour Organization). 2003. “Key Indicators of the LabourMarket.” 3rd ed. Geneva.
———. 2004. “Global Employment Trends for Youth.” Geneva.
146 Guarcello, Manacorda, Rosati, Fares, Lyon, and Valdivia
WB62_YALM_CH07 3/3/08 5:19 PM Page 146

———. 2006. Global Employment Trends for Youth. Geneva: ILO.
OECD (Organisation for Economic Co-operation and Development. 1998.“Getting Started, Settling In: The Transition from Education to the LabourMarket.” In OECD Employment Outlook—Towards an Employment CenteredSocial Policy. Paris.
———. 1999. Preparing Youth for the 21st Century: The Transition from Educationto the Labour Market. Conference proceedings, “Preparing Youth for the 21stCentury: The Policy Lessons from the Past Two Decades,” Washington, DC,February 23–24.
———. 2000. From Initial Education to Working Life: Making Transitions Work.Paris.
Psacharopoulos, G. 1994. “Returns to Investment in Education: A Global Update.”Policy Research Working Paper Series No. 1067,World Bank,Washington, DC.
World Bank. 2004. World Development Indicators 2004. Washington, DC.
School-to-Work Transitions: Regional Overview 147
WB62_YALM_CH07 3/3/08 5:19 PM Page 147

WB62_YALM_CH07 3/3/08 5:19 PM Page 148

Many young people in Burkina Faso leave school very early in life. Howdo they perform in the labor force? How do their fortunes evolve overtime? How do their labor market outcomes compare with those ofmore educated Burkinabes? How are household characteristics linkedto youth outcomes?
Employment rates in Burkina Faso increased between 1993 and 2003,with nearly all of the increase generated by females.The female unemploy-ment rate also increased, especially for younger, more educated individuals.The increase may reflect the fact that the higher employment rate encour-aged more females to search for jobs. Unemployment also rose amongmales. Stagnant male employment rates across age groups may suggest thatthe labor market prospects of males in Burkina Faso deteriorated.
Urban adolescents, particularly those from poor families, tend to enterthe labor force when their household economic conditions worsen. Theevidence about what makes rural children and younger children enterthe work force is more mixed. However, there is little evidence for any
C H A P T E R 8
What Determines Labor MarketParticipation by Youth in Burkina Faso?
Daniel Parent
149
Special thanks to workshop participants in Ouagadougou and at the World Bank inWashington, DC, especially Jean Fares, who provided very useful comments and suggestions.
WB62_YALM_CH08 2/21/08 12:04 PM Page 149

age group that households take advantage of better economic conditionsto pull their children out of school and make them work.
School proximity is a major determinant of school enrollment in BurkinaFaso. Per capita household income is greater for households living rela-tively close to a school, especially secondary schools, even within narrowlydefined geographical areas. These findings suggest that the rate of return toschooling is significant. The analysis yields several policy implications.
First, macroeconomic policies that reduce poverty (such as freertrade, which would enhance the demand for agricultural products) arenot likely to increase child labor at the cost of basic schooling and literacy.Households value education and take advantage of education opportuni-ties when they can afford to do so, particularly in urban areas.This suggeststhat they are likely to respond to conditional cash transfers to encouragethem to keep (or put) their children in schools.
Second, households that have access to schools tend to take advantageof them. Improving access to schools—by building more schools orimproving transportation infrastructure—therefore seems to represent apromising public investment.
Third, labor resources in Burkina Faso could be harnessed to partici-pate in such infrastructure projects, particularly in rural areas, where asignificant share of the population is underemployed.
Fourth, none of these policies will work well if the quality of educa-tion is not held at least constant. Sufficient numbers of additional teachersmust be hired, teachers must be well qualified and motivated to work inlargely rural areas, and related capital expenditures (books, basic instruc-tional material) must be forthcoming.
Labor Market Indicators
The Household Living Standards Surveys, conducted in Burkina Fasoevery five years, provide data on individuals’ main activities (school only,school and work, work only, unemployment, inactivity) the week pre-ceding the interview.Although this chapter focuses on youth labor marketand schooling outcomes, activities are reported for all age groups to beable to reveal changes in the relative outcomes of younger and olderindividuals not enrolled in school.
Five mutually exclusive categories of activities are defined for thethree years with data (table 8.1): school only, combining school and work,work only, unemployed, and inactive. In general, the school enrollmentrate among children and youth is very low in Burkina Faso. In 2003, only
150 Parent
WB62_YALM_CH08 2/21/08 12:04 PM Page 150
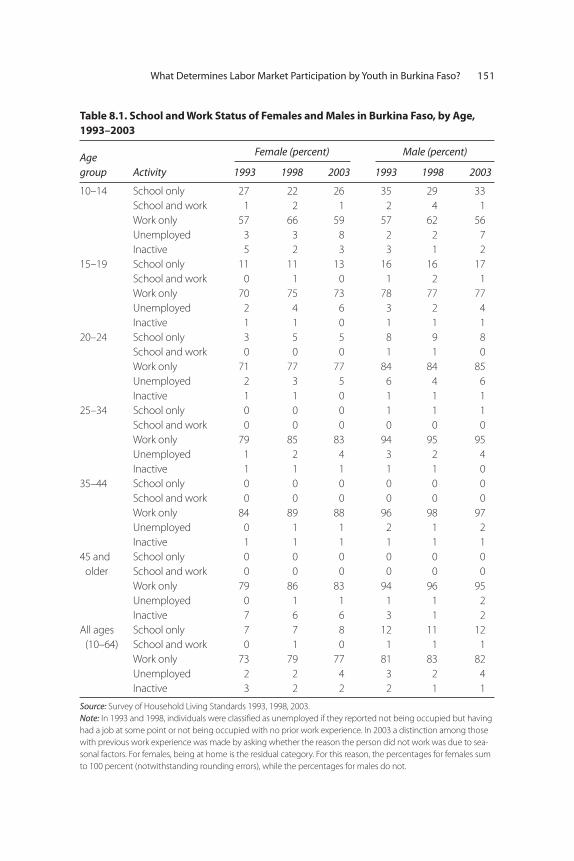
What Determines Labor Market Participation by Youth in Burkina Faso? 151
Table 8.1. School and Work Status of Females and Males in Burkina Faso, by Age,1993–2003
Agegroup Activity 1993 1998 2003 1993 1998 2003
10–14 School only 27 22 26 35 29 33School and work 1 2 1 2 4 1Work only 57 66 59 57 62 56Unemployed 3 3 8 2 2 7Inactive 5 2 3 3 1 2
15–19 School only 11 11 13 16 16 17School and work 0 1 0 1 2 1Work only 70 75 73 78 77 77Unemployed 2 4 6 3 2 4Inactive 1 1 0 1 1 1
20–24 School only 3 5 5 8 9 8School and work 0 0 0 1 1 0Work only 71 77 77 84 84 85Unemployed 2 3 5 6 4 6Inactive 1 1 0 1 1 1
25–34 School only 0 0 0 1 1 1School and work 0 0 0 0 0 0Work only 79 85 83 94 95 95Unemployed 1 2 4 3 2 4Inactive 1 1 1 1 1 0
35–44 School only 0 0 0 0 0 0School and work 0 0 0 0 0 0Work only 84 89 88 96 98 97Unemployed 0 1 1 2 1 2Inactive 1 1 1 1 1 1
45 and School only 0 0 0 0 0 0older School and work 0 0 0 0 0 0
Work only 79 86 83 94 96 95Unemployed 0 1 1 1 1 2Inactive 7 6 6 3 1 2
All ages School only 7 7 8 12 11 12(10–64) School and work 0 1 0 1 1 1
Work only 73 79 77 81 83 82Unemployed 2 2 4 3 2 4Inactive 3 2 2 2 1 1
Source: Survey of Household Living Standards 1993, 1998, 2003. Note: In 1993 and 1998, individuals were classified as unemployed if they reported not being occupied but havinghad a job at some point or not being occupied with no prior work experience. In 2003 a distinction among thosewith previous work experience was made by asking whether the reason the person did not work was due to sea-sonal factors. For females, being at home is the residual category. For this reason, the percentages for females sumto 100 percent (notwithstanding rounding errors), while the percentages for males do not.
Female (percent) Male (percent)
WB62_YALM_CH08 2/21/08 12:04 PM Page 151

33 percent of male children between the ages of 10 and 14 were in school.Among teenagers (ages 15 to 19) this share drops to 17 percent. Forfemales, school incidence is even lower, at 26 percent for the 10–14 agegroup and 13 percent for teenage girls.
Among children ages 10–14, school enrollment appeared to decreasebetween 1993 and 1998 before rebounding to roughly the 1993 level in2003 (table 8.1). Conditioning on the location of households relative toschools, however, enrollment did not drop at all over this period. Theapparent decline in enrollment probably reflects the 1998 survey’s useof a sampling frame that included more households located far awayfrom schools.
Very few Burkinabe youth (2 percent or less) report being both enrolledin school and working as their main activity, suggesting that children leaveschool before going to work.1 There is no evidence that many childrenmove back and forth between school and the labor force: when they quitschool, they do so for good.
A large fraction of children and youth start to work very early inBurkina Faso. More than half of children are already working between 10and 14 years old. This fraction also rises very quickly with age amongboth males and females. Because of the high incidence of poverty andthe lack of options outside the work force, most individuals work andcannot afford to be unemployed or inactive.
Employment rates among youth are high, and unemployment rates arelow (table 8.2). There is evidence that the unemployment rate rosebetween 1993 and 2003 for every age group. Among males and females,however, the employment rate remained fairly constant, at very high levels.
Across all ages and education categories, the period between 1993and 2003 witnessed a substantial increase in the fraction of females
152 Parent
Table 8.2. Employment and Unemployment Rates among Burkinabes Not Enrolled inSchool, by Age and Gender, 1993–2003
Employment rate (percent) Unemployment rate (percent)
Females Males Females Males
Age 1993 1998 2003 1993 1998 2003 1993 1998 2003 1993 1998 2003
15–19 79 85 84 94 95 94 3 4 7 4 3 520–24 74 82 81 92 93 92 3 3 5 6 5 725–34 78 85 83 94 96 95 1 2 4 4 3 535–44 81 87 84 96 97 97 0 2 3 2 2 245 and
older 83 89 88 97 98 97 1 1 1 2 1 3Total 78 86 83 94 95 93 2 3 6 4 3 6
Source: Survey of Household Living Standards 1993, 1998, 2003.
WB62_YALM_CH08 2/21/08 12:04 PM Page 152
What Determines Labor Market Participation by Youth in Burkina Faso? 153
employed in the labor market and a proportionally larger increase in thefraction of females reported to be unemployed.2 The vast majority ofunemployed females were looking for a first job.
Labor market outcomes of the youngest and least educated boys dete-riorated between 1993 and 2003 (table 8.3). For all other age groups andschooling levels, employment rates remained more or less constant.Surprisingly, the employment rate among males ages 20–29 declineswith educational attainment. Individuals who have just completed aschooling period, such as secondary education, have higher unemploy-ment rates than less educated individuals of the same age, but theiremployment rate increases sharply as they age. The key question thenbecomes whether the jobs the more educated individuals eventually getare better than the ones that less educated workers have. This chapterwill return to this question when looking at the transition across occu-pations over time for a given birth cohort.
Employment rates increased for all age groups of urban males(table 8.4). They also increased among females in rural areas, whileremaining unchanged among rural males. The decrease in employ-ment is concentrated among young men with no education. Labormarket indicators did not change dramatically for workers with anyamount of schooling, almost all of whom work in rural areas.
Employment rates for females increased across all age groups, in bothrural and urban areas.The increase was significantly larger in urban areas,where employment rates had been much lower than in rural areas in1993. Female unemployment rates also increased substantially, probablyreflecting the fact that women are more likely to search for jobs than tobe inactive. An argument could even be made that because employmenthas increased for females, women may be more motivated to search forwork, potentially raising the unemployment rate. Overall, the male labormarket showed no sign of deterioration, at least with regard to employ-ment incidence, except among young men ages 20–29. Two phenomenasuggest that Burkina Faso’s labor market expanded between 1993 and2003. Much of the progress, however, occurred between 1993 and 1998,with the 1998–2003 period characterized by stagnation if not declinein employment.
Education appears to increase the chance of being employed, at leastfor boys in rural areas. This may seem somewhat of a paradox becausethe unemployment rate also increases with education. Because the costof being unemployed is high in Burkina Faso given the absence of incomesupport programs, the high unemployment rate probably reflects thefact that individuals believe it is worth waiting (or shopping) for better
WB62_YALM_CH08 2/21/08 12:04 PM Page 153

154
Tab
le 8
.3.E
mp
loym
ent a
nd
Un
emp
loym
ent R
ates
in B
urki
na
Faso
, by
Ag
e, G
end
er, a
nd
Ed
ucat
ion
, 199
3–20
03
Empl
oym
ent r
ate
(per
cent
)U
nem
ploy
men
t rat
e (p
erce
nt)
Fem
ales
Mal
esFe
mal
esM
ales
Educ
atio
nal a
ttai
nmen
tAg
e 19
9319
9820
0319
9319
9820
0319
9319
9820
0319
9319
9820
03
No
scho
olin
g15
–19
8388
8796
9796
12
42
13
20–2
480
8785
9797
961
13
21
425
–29
8189
8696
9897
01
2 2
13
30–3
484
8987
9799
980
12
11
135
–39
8590
9097
9997
00
11
12
Tota
l82
8986
9697
941
14
21
5Pa
rtia
l prim
ary
15–1
963
6970
9292
9010
1817
7
68
20–2
457
5669
9089
927
1315
7
107
25–2
969
5371
9498
931
616
5
27
30–3
460
6373
9698
961
39
32
435
–39
7368
7398
9991
13
13
11
6To
tal
6563
7292
9391
613
15
66
7Pr
imar
y co
mpl
eted
15
–19
3951
4379
6676
519
28
75
1020
–24
3739
4769
7572
810
16
108
925
–29
4852
5680
8789
25
11
75
830
–34
6664
6294
9293
03
10
86
3
WB62_YALM_CH08 2/21/08 12:04 PM Page 154

155
35–3
961
7865
9496
973
20
51
4To
tal
4852
5480
8485
511
16
76
8Pa
rtia
l sec
onda
ry
15–1
939
5143
7966
76
59
35
1324
2020
–24
3739
4769
7572
1425
26
2923
2625
–29
4852
5680
8789
1012
16
1611
1130
–34
6664
6294
9293
413
15
67
735
–39
6178
6594
9697
43
11
44
3To
tal
4852
5480
8485
916
21
1614
14Se
cond
ary
com
plet
ed
20–2
464
4910
082
7387
2225
0 18
2013
25–2
961
6760
7791
8310
1226
23
917
30–3
487
6890
9892
985
510
2
52
35–3
987
8093
9596
100
130
00
40
Tota
l74
6779
8590
9311
1013
14
87
Post
seco
ndar
y 20
–24
2154
—73
5034
250
—27
5066
25–2
941
9065
8381
7848
524
1716
1730
–34
8710
094
9788
958
00
312
135
–39
100
8210
098
9897
018
02
23
Tota
l69
8790
9489
9020
86
610
7
Sour
ce: S
urve
y of
Hou
seho
ld L
ivin
g St
anda
rds,
1993
, 199
8, 2
003.
N
ote:
— =
Not
ava
ilabl
e.
WB62_YALM_CH08 2/21/08 12:04 PM Page 155

jobs, which will eventually materialize; or only those who can afford notto be employed wait for such jobs.
Occupational Transitions over TimeHow do occupations at entry into the labor market vary across educa-tional attainment categories? How does education affect progress overtime from low-paying to high-paying occupations? To answer thesequestions, the study examines how occupations for people of varyingeducation levels evolve over time, starting with 15 to 19 year olds in 1993and tracing their occupations over 10 years, with follow-up samples in1998 and 2003 (Parent 2006).3
156 Parent
Table 8.4. Employment and Unemployment Rates in Urban and Rural Areas of BurkinaFaso, 1993–2003
Female Male
Item Age 1993 1998 2003 1993 1998 2003
Employment ratesUrban 15–19 34 42 45 68 72 73
20–24 35 41 44 67 77 7425–29 42 51 53 80 87 8530–34 55 57 59 88 92 9335–39 54 65 68 90 96 93Total 41 49 52 76 83 81
Rural 15–19 87 92 91 98 98 9720–24 82 91 90 97 98 9825–29 85 92 90 98 99 9830–34 87 93 90 99 99 9935–39 88 94 92 99 99 98Total 85 92 89 97 98 95
Unemployment ratesUrban 15–19 12 28 31 23 22 25
20–24 10 17 24 28 21 2425–29 6 9 16 17 11 1330–34 2 6 12 8 7 735–39 3 3 5 8 4 6Total 8 15 20 18 14 17
Rural 15–19 1 1 3 1 0 220–24 1 0 1 1 0 125–29 0 0 1 0 0 230–34 0 1 1 1 0 135–39 0 0 1 0 0 2Total 1 1 3 1 0 4
Source: Survey of Household Living Standards, 1993, 1998, 2003.
WB62_YALM_CH08 2/21/08 12:04 PM Page 156

For males with no schooling, the only meaningful transition is from afamily helper to an independent worker, possibly as the head of a newhousehold. The overwhelming majority of females stay employed as fam-ily helpers even after 10 years. The fraction of male independent workersbegins to increase significantly after only five years. The picture is basicallythe same for illiterate individuals (as opposed to simply uneducated).
For male workers with a completed primary education, occupationsare somewhat more diversified after 10 years, particularly for those inurban areas. However, even though these individuals are more educated,their entry occupation in 1993 is still clearly family helper. More or less thesame holds for females with a completed primary education. Althoughearly labor market outcomes indicate that upgrading the educationalattainment of young Burkinabes has little impact (leaving aside the pos-sibility that family helpers with primary education may earn more thanuneducated family helpers), those who have completed primary schoolinghave more options as time goes on.
Males with partial secondary education start much at the same place asless educated youth, but transition across occupations much more quickly:after just five years the occupational composition of the sample of 20- to24-year-olds is quite varied. Those 15- to 19-year-olds with partial second-ary education are entering the labor market immediately, unlike individualswith just a primary or no education. Although there are not enough obser-vations in 1993 to infer the occupation distribution for females at thatpoint, the data from 1998 and 2003 show that the allocation of femaleswith partial secondary education across occupations is more varied than forless educated females. Of interest is the fact that women are much morelikely to be independent workers than men with similar education.Womenare also more likely to be working in the trade industry (commerce) thanmen, whose sectors of activity are more diversified.4
The number of workers with a completed secondary education issmall, but they tend to work as managers or skilled workers fairly earlyin their careers and clearly move into management after five years. Thisis true for both males and females. The small size of this category meansthat it is not a high priority group for policy development.
Given that workers with at least some partial secondary education tendto have high-paying occupations after 10 years, relative to the occupationsheld by less educated workers, it is not surprising that the unemploy-ment rate tends to increase with the level of education. Quite simply, if nobetter-paying jobs exist in the economy than the ones they can have whenthey enter the labor force, there would be little point in being unemployed
What Determines Labor Market Participation by Youth in Burkina Faso? 157
WB62_YALM_CH08 2/21/08 12:04 PM Page 157

because the expected gain from attractive offers later would be small.The fact that more educated workers tend to report themselves as beingunemployed than do less educated workers is evidence that educationpays eventually, even if not immediately upon entry. It is also remarkablethat, at least for people with up to a partial secondary education level,the occupation early in one’s career is similar across all educationalattainment groups for both genders.
Those with Multiple Jobs Are UnderemployedHuman resources are underutilized in Burkina Faso, especially in ruralareas. Many Burkinabes hold more than one job (table 8.5). Some 92percent of these workers live in rural areas. Males are more likely thanfemales to hold multiple jobs, although the difference is modest, andolder workers are more likely to do so than younger workers.
Among the 16 percent of all Burkinabe workers who report beingunderemployed (that is, working fewer hours than they would like), theoverwhelming majority hold multiple jobs. While only about 9 percentof people who hold single jobs wish they could work more, 47 percentof multiple job holders would like to do so. Males are more likely thanfemales to want more work.
There is little evidence of a systematic relationship between incomeand holding multiple jobs (table 8.6). The relationship appears to have
158 Parent
Table 8.5. Percentage of Burkinabes Underemployed or Holding More Than OneJob, 2003
Female Male
Age group Comments Urban Rural Urban Rural
10–14 Wants more work 11 8 6 8Holds more than one job 8 7 3 9
15–19 Wants more work 10 13 12 14Holds more than one job 8 14 7 13
20–24 Wants more work 12 16 13 20Holds more than one job 11 18 10 21
25–34 Wants more work 15 17 15 23Holds more than one job 9 21 11 28
35–44 Wants more work 15 18 15 26Holds more than one job 9 25 13 35
45 and older Wants more work 18 16 16 22Holds more than one job 17 24 16 33
Source: Survey of Household Living Standards 2003.
WB62_YALM_CH08 2/21/08 12:04 PM Page 158

an inverted U-shape, with people in the middle quintiles more likely tohold multiple jobs than people in the top or bottom quintiles.
Household Income, School Attendance, and Returns to Education
What factors are behind the low school enrollment rate among youngpeople in Burkina Faso and the high incidence of child labor? Severalexplanations are put forward in the child labor literature and amongpolicy makers. Most common among these are responses to adversehousehold income shocks, low returns to education, and the difficultyin accessing schools.
Household Income Shocks, Distance to School, and Child Labor Force ParticipationOne would expect that the labor force participation of children frompoorer or more disadvantaged households would be more sensitive todeterioration in economic conditions. Is this indeed the case? Table 8.7looks at changes in a household’s most important source of income (as aproxy for changes in total household income during the year). This maybe a suspect proxy if households derive income from equally importantsources.5 To make the distinction as sharp and as easy to interpret as pos-sible, a dummy variable is constructed equal to 1 if income decreasedfrom the previous year and 0 if it increased or stayed the same. Table 8.8examines respondents’ perceptions of their general economic situation,with a second dummy variable equal to 1 if the respondent reports thattheir situation is worse than or as bad as the previous year.
What Determines Labor Market Participation by Youth in Burkina Faso? 159
Table 8.6. Percentage of Burkinabes Holding MoreThan One Job, by Household Income Quintile, 2003
Household income quintile Females Males
1 16 18 2 19 233 22 244 19 235 13 17
Source: Survey of Household Living Standards 2003.
WB62_YALM_CH08 2/21/08 12:04 PM Page 159

160
Tab
le 8
.7.H
ouse
hol
d In
com
e Sh
ocks
an
d L
abor
For
ce P
arti
cip
atio
n in
Bur
kin
a Fa
so, 2
003
Mal
esFe
mal
es
Inde
pend
ent v
aria
ble
(1)
(2)
(3)
(4)
(5)
(6)
(7)
(8)
12- t
o 14
-yea
r-ol
ds li
ving
in u
rban
are
asH
ouse
hold
inco
me
decr
ease
d in
pas
t yea
r0.
045
0.04
90.
037
0.12
10.
053
0.06
20.
026
0.06
0(0
.028
)(0
.029
)(0
.029
)(0
.046
)(0
.027
)(0
.032
)(0
.028
)(0
.044
)D
ecre
ase
in in
com
e �
hous
ehol
d he
ad’s
educ
atio
n–0
.005
–0.0
16(0
.003
)(0
.022
)D
ecre
ase
in in
com
e �
inco
me
in b
otto
m q
uint
ile0.
077
0.27
5(0
.086
)(0
.116
)D
ecre
ase
in in
com
e �
hous
ehol
d siz
e–0
.007
–0.0
01(0
.003
)(0
.003
)30
–59
min
utes
aw
ay fr
om p
rimar
y sc
hool
0.03
10.
031
0.03
10.
033
–0.0
24–0
.024
–0.0
20–0
.024
(0.0
42)
(0.0
42)
(0.0
42)
(0.0
42)
(0.0
40)
(0.0
40)
(0.0
40)
(0.0
40)
60+
min
utes
aw
ay fr
om p
rimar
y sc
hool
0.00
80.
007
0.00
60.
000
0.44
60.
446
0.45
80.
446
(0.1
43)
(0.1
44)
(0.1
39)
(0.1
41)
(0.1
72)
(0.1
72)
(0.1
68)
(0.1
72)
30–5
9 m
inut
es a
way
from
sec
onda
ry s
choo
l0.
031
0.03
10.
032
0.03
00.
015
0.01
50.
015
0.01
5(0
.031
)(0
.031
)(0
.031
)(0
.031
)(0
.030
)(0
.030
)(0
.030
)(0
.030
)60
+ m
inut
es a
way
from
sec
onda
ry s
choo
l0.
061
0.06
10.
054
0.06
50.
049
0.04
90.
037
0.05
0(0
.061
)(0
.061
)(0
.061
)(0
.061
)(0
.063
)(0
.063
)(0
.061
)(0
.063
)N
umbe
r of o
bser
vatio
ns1,
575
1,57
51,
575
1,57
51,
692
1,69
21,
692
1,69
2
12- t
o 14
-yea
r-ol
ds li
ving
in ru
ral a
reas
Hou
seho
ld in
com
e de
crea
sed
in p
ast y
ear
0.00
70.
005
0.00
20.
019
–0.0
10–0
.011
–0.0
05–0
.016
(0.0
16)
(0.0
16)
(0.0
18)
(0.0
24)
(0.0
16)
(0.0
16)
(0.0
18)
(0.0
22)
Dec
reas
e in
inco
me
�ho
useh
old
head
’s ed
ucat
ion
0.01
10.
005
(0.0
04)
(0.0
03)
WB62_YALM_CH08 2/21/08 12:04 PM Page 160

161
Dec
reas
e in
inco
me
�in
com
e in
bot
tom
qui
ntile
0.02
0–0
.022
(0.0
31)
(0.0
38)
Dec
reas
e in
inco
me
�ho
useh
old
size
–0.0
010.
000
(0.0
24)
(0.0
01)
30–5
9 m
inut
es a
way
from
prim
ary
scho
ol0.
060
0.06
00.
060
0.06
00.
033
0.03
20.
033
0.03
3(0
.017
)(0
.017
)(0
.017
)(0
.017
)(0
.017
)(0
.017
)(0
.017
)(0
.017
)60
+ m
inut
es a
way
from
prim
ary
scho
ol0.
170
0.17
00.
170
0.17
00.
091
0.09
10.
091
0.09
1(0
.017
)(0
.017
)(0
.017
)(0
.017
)(0
.021
)(0
.021
)(0
.021
)(0
.021
)30
–59
min
utes
aw
ay fr
om s
econ
dary
sch
ool
0.09
70.
098
0.09
60.
097
0.06
70.
067
0.06
70.
067
(0.0
27)
(0.0
27)
(0.0
27)
(0.0
27)
(0.0
25)
(0.0
25)
(0.0
25)
(0.0
25)
60+
min
utes
aw
ay fr
om s
econ
dary
sch
ool
0.16
50.
166
0.16
40.
165
0.15
10.
151
0.15
10.
151
(0.0
33)
(0.0
33)
(0.0
33)
(0.0
33)
(0.0
32)
(0.0
32)
(0.0
32)
(0.0
32)
Num
ber o
f obs
erva
tions
5,03
35,
033
5,03
35,
033
4,64
34,
643
4,64
34,
643
8- to
11-
year
-old
s liv
ing
in u
rban
are
asH
ouse
hold
inco
me
decr
ease
d in
pas
t yea
r–0
.010
–0.0
20–0
.014
0.01
6–0
.012
–0.0
05–0
.011
–0.0
49(0
.011
)(0
.011
)(0
.012
)(0
.018
)(0
.013
)(0
.014
)(0
.013
)(0
.018
)D
ecre
ase
in in
com
e �
hous
ehol
d he
ad’s
educ
atio
n0.
024
–0.0
21(0
.011
)(0
.013
)D
ecre
ase
in in
com
e �
inco
me
in b
otto
m q
uint
ile0.
028
–0.0
05(0
.035
)(0
.039
)D
ecre
ase
in in
com
e �
hous
ehol
d siz
e–0
.002
0.00
4(0
.001
)(0
.002
)30
–59
min
utes
aw
ay fr
om p
rimar
y sc
hool
0.03
70.
037
0.03
70.
036
0.03
30.
032
0.03
30.
033
(0.0
21)
(0.0
20)
(0.0
20)
(0.0
20)
(0.0
17)
(0.0
17)
(0.0
17)
(0.0
17)
60+
min
utes
aw
ay fr
om p
rimar
y sc
hool
0.04
60.
039
0.05
10.
044
0.09
10.
091
0.09
10.
091
(0.1
19)
(0.1
13)
(0.1
22)
(0.1
17)
(0.0
21)
(0.0
21)
(0.0
21)
(0.0
21)
30–5
9 m
inut
es a
way
from
sec
onda
ry s
choo
l0.
004
0.00
40.
004
0.00
50.
067
0.06
70.
067
0.06
7(0
.012
)(0
.012
)(0
.012
)(0
.012
)(0
.025
)(0
.025
)(0
.025
)(0
.025
)
(con
tinue
d)
WB62_YALM_CH08 2/21/08 12:04 PM Page 161

Tab
le 8
.7.H
ouse
hol
d In
com
e Sh
ocks
an
d L
abor
For
ce P
arti
cip
atio
n in
Bur
kin
a Fa
so, 2
003
(con
tinue
d)
Mal
esFe
mal
es
Inde
pend
ent v
aria
ble
(1)
(2)
(3)
(4)
(5)
(6)
(7)
(8)
60+
min
utes
aw
ay fr
om s
econ
dary
sch
ool
–0.0
10–0
.010
–0.0
12–0
.010
0.15
10.
151
0.15
10.
151
(0.0
21)
(0.0
20)
(0.0
20)
(0.0
21)
(0.0
32)
(0.0
32)
(0.0
32)
(0.0
32)
Num
ber o
f obs
erva
tions
2,19
12,
191
2,19
12,
191
2,15
62,
156
2,15
62,
156
8- to
11-
year
-old
s liv
ing
in ru
ral a
reas
Hou
seho
ld in
com
e de
crea
sed
in p
ast y
ear
–0.0
23–0
.031
–0.0
22–0
.005
–0.0
15–0
.014
–0.0
05–0
.012
(0.0
13)
(0.0
13)
(0.0
15)
(0.0
18)
(0.0
13)
(0.0
13)
(0.0
16)
(0.0
18)
Dec
reas
e in
inco
me
�ho
useh
old
head
’s ed
ucat
ion
0.08
3–0
.006
(0.0
30)
(0.0
06)
Dec
reas
e in
inco
me
�in
com
e in
bot
tom
qui
ntile
–0.0
04–0
.035
(0.0
15)
(0.0
27)
Dec
reas
e in
inco
me
�ho
useh
old
size
–0.0
010.
000
(0.0
01)
(0.0
01)
30–5
9 m
inut
es a
way
from
prim
ary
scho
ol0.
078
0.07
70.
078
0.07
80.
027
0.02
70.
027
0.02
7(0
.015
)(0
.015
)(0
.015
)(0
.015
)(0
.016
)(0
.016
)(0
.016
)(0
.016
)60
+ m
inut
es a
way
from
prim
ary
scho
ol0.
095
0.09
40.
095
0.09
50.
053
0.05
30.
053
0.05
3(0
.020
)(0
.020
)(0
.020
)(0
.020
)(0
.018
)(0
.018
)(0
.018
)(0
.018
)30
–59
min
utes
aw
ay fr
om s
econ
dary
sch
ool
–0.0
44–0
.047
–0.0
44–0
.044
0.05
30.
053
0.05
40.
053
(0.0
29)
(0.0
29)
(0.0
29)
(0.0
29)
(0.0
31)
(0.0
31)
(0.0
31)
(0.0
31)
60+
min
utes
aw
ay fr
om s
econ
dary
sch
ool
–0.0
10–0
.013
–0.0
10–0
.010
0.07
90.
079
0.07
90.
079
(0.0
27)
(0.0
27)
(0.0
27)
(0.0
27)
(0.0
25)
(0.0
25)
(0.0
25)
(0.0
25)
Num
ber o
f obs
erva
tions
8,08
48,
084
8,08
48,
084
7,47
07,
470
7,47
07,
470
Sour
ce:S
urve
y of
Hou
seho
ld L
ivin
g St
anda
rds,
2003
.N
ote:
Rob
ust s
tand
ard
erro
rs in
par
enth
eses
.
162
WB62_YALM_CH08 2/21/08 12:04 PM Page 162

163
Tab
le 8
.8.C
han
ges
in H
ouse
hol
d’s
Eco
nom
ic C
ond
itio
ns
and
Lab
or F
orce
Par
tici
pat
ion
Mal
esFe
mal
es
Inde
pend
ent v
aria
ble
(1)
(2)
(3)
(4)
(5)
(6)
(7)
(8)
12- t
o 14
-yea
r-ol
ds li
ving
in u
rban
are
asEc
onom
ic c
ondi
tions
of h
ouse
hold
det
erio
rate
d
0.08
00.
132
0.06
7–0
.019
0.07
00.
108
0.02
30.
105
over
last
cal
enda
r yea
r(0
.045
)(0
.057
)(0
.046
)(0
.103
)(0
.045
)(0
.057
)(0
.045
)(0
.091
)Co
nditi
ons
dete
riora
ted
�ho
useh
old
–0.0
73–0
.035
head
’s ed
ucat
ion
(0.0
44)
(0.0
29)
Dec
reas
e in
inco
me
�in
com
e in
bot
tom
qui
ntile
0.02
90.
643
(0.1
22)
(0.1
54)
Cond
ition
s de
terio
rate
d �
hous
ehol
d siz
e0.
010
–0.0
04(0
.010
)(0
.009
)30
–59
min
utes
aw
ay fr
om p
rimar
y sc
hool
–0.0
23–0
.023
–0.0
16–0
.027
(0.0
71)
(0.0
68)
(0.0
70)
(0.0
70)
60+
min
utes
aw
ay fr
om p
rimar
y sc
hool
–0.1
90–0
.140
–0.1
91–0
.190
–0.0
67–0
.065
–0.0
54–0
.069
(0.0
57)
(0.0
53)
(0.0
61)
(0.0
56)
(0.0
86)
(0.0
86)
(0.0
85)
(0.0
86)
30–5
9 m
inut
es a
way
from
sec
onda
ry s
choo
l0.
093
0.10
50.
091
0.10
2–0
.080
–0.0
75–0
.106
–0.0
81(0
.058
)(0
.057
)(0
.059
)(0
.060
)(0
.053
)(0
.055
)(0
.053
)(0
.054
)60
+ m
inut
es a
way
from
sec
onda
ry s
choo
l0.
228
0.23
60.
228
0.23
7–0
.119
–0.1
15–0
.131
–0.1
20(0
.129
)(0
.132
)(0
.125
)(0
.132
)(0
.070
)(0
.072
)(0
.062
)(0
.071
)N
umbe
r of o
bser
vatio
ns48
648
648
648
650
850
850
850
8
12- t
o 14
-yea
r-ol
ds li
ving
in ru
ral a
reas
Econ
omic
con
ditio
ns o
f hou
seho
ld d
eter
iora
ted
0.00
80.
006
0.01
2–0
.060
0.00
30.
012
–0.0
02–0
.060
over
last
cal
enda
r yea
r (0
.026
)(0
.027
)(0
.030
)(0
.055
)(0
.025
)(0
.025
)(0
.027
)(0
.057
)
Cond
ition
s de
terio
rate
d �
hous
ehol
d 0.
001
–0.0
87he
ad’s
educ
atio
n(0
.051
)(0
.062
)
(con
tinue
d)
WB62_YALM_CH08 2/21/08 12:04 PM Page 163

Tab
le 8
.8.C
han
ges
in H
ouse
hol
d’s
Eco
nom
ic C
ond
itio
ns
and
Lab
or F
orce
Par
tici
pat
ion
(con
tinue
d)
Mal
esFe
mal
es
Inde
pend
ent v
aria
ble
(1)
(2)
(3)
(4)
(5)
(6)
(7)
(8)
Dec
reas
e in
inco
me
�in
com
e in
bot
tom
qui
ntile
–0.0
210.
019
(0.0
52)
(0.0
58)
Cond
ition
s de
terio
rate
d �
hous
ehol
d siz
e0.
006
0.00
6(0
.005
)(0
.005
)30
–59
min
utes
aw
ay fr
om p
rimar
y sc
hool
0.08
90.
090
0.08
90.
088
0.04
00.
040
0.03
90.
039
(0.0
31)
(0.0
31)
(0.0
32)
(0.0
31)
(0.0
32)
(0.0
32)
(0.0
32)
(0.0
32)
60+
min
utes
aw
ay fr
om p
rimar
y sc
hool
0.20
30.
202
0.20
10.
201
0.05
80.
062
0.05
80.
055
(0.0
28)
(0.0
28)
(0.0
28)
(0.0
28)
(0.0
38)
(0.0
38)
(0.0
37)
(0.0
38)
30–5
9 m
inut
es a
way
from
sec
onda
ry s
choo
l0.
093
0.09
30.
094
0.09
30.
032
0.03
10.
032
0.03
6(0
.049
)(0
.049
)(0
.050
)(0
.049
)(0
.046
)(0
.047
)(0
.046
)(0
.046
)60
+ m
inut
es a
way
from
sec
onda
ry s
choo
l0.
122
0.12
20.
121
0.11
00.
032
0.03
10.
032
0.03
8(0
.060
)(0
.060
)(0
.062
)(0
.061
)(0
.046
)(0
.053
)(0
.053
)(0
.054
)N
umbe
r of o
bser
vatio
ns1,
564
1,56
41,
564
1,56
41,
425
1,42
51,
425
1,42
5
8- to
11-
year
-old
s liv
ing
in u
rban
are
as
Econ
omic
con
ditio
ns o
f hou
seho
ld d
eter
iora
ted
0.
051
0.03
80.
056
0.05
20.
036
0.03
20.
022
0.07
9ov
er la
st c
alen
dar y
ear
(0.0
35)
(0.0
37)
(0.0
35)
(0.0
73)
(0.0
26)
(0.0
31)
(0.0
26)
(0.0
51)
Cond
ition
s de
terio
rate
d �
hous
ehol
d0.
036
0.00
4he
ad’s
educ
atio
n(0
.044
)(0
.017
)
Dec
reas
e in
inco
me
�in
com
e in
bot
tom
qui
ntile
–0.0
460.
248
(0.0
44)
(0.2
46)
Cond
ition
s de
terio
rate
d �
hous
ehol
d siz
e–0
.001
–0.0
04(0
.006
)(0
.004
)30
–59
min
utes
aw
ay fr
om p
rimar
y sc
hool
0.00
10.
001
0.00
10.
001
–0.0
16–0
.016
–0.0
20–0
.017
(0.0
45)
(0.0
45)
(0.0
44)
(0.0
45)
(0.0
32)
(0.0
32)
(0.0
31)
(0.0
32)
164
WB62_YALM_CH08 2/21/08 12:04 PM Page 164

165
60+
min
utes
aw
ay fr
om p
rimar
y sc
hool
0.07
60.
073
0.09
60.
076
0.11
60.
117
0.10
20.
118
(0.2
02)
(0.2
02)
(0.2
20)
(0.2
02)
(0.1
05)
(0.1
06)
(0.0
98)
(0.1
08)
30–5
9 m
inut
es a
way
from
sec
onda
ry s
choo
l0.
035
0.03
20.
040
0.03
50.
019
0.01
80.
020
0.01
8(0
.032
)(0
.033
)(0
.032
)(0
.033
)(0
.029
)(0
.028
)(0
.028
)(0
.028
)60
+ m
inut
es a
way
from
sec
onda
ry s
choo
l0.
113
0.10
50.
076
0.11
3–0
.020
–0.0
21–0
.130
–0.0
20(0
.106
)(0
.107
)(0
.095
)(0
.106
)(0
.019
)(0
.019
)(0
.023
)(0
.020
)N
umbe
r of o
bser
vatio
ns46
946
946
946
964
364
364
364
3
8- to
11-
year
-old
s liv
ing
in ru
ral a
reas
Ec
onom
ic c
ondi
tions
of h
ouse
hold
det
erio
rate
d
–0.0
09–0
.008
–0.0
15–0
.042
–0.0
09–0
.002
–0.0
18–0
.001
over
last
cal
enda
r yea
r(0
.023
)(0
.023
)(0
.025
)(0
.048
)(0
.023
)(0
.024
)(0
.028
)(0
.051
)Co
nditi
ons
dete
riora
ted
�ho
useh
old
–0.0
07
–0.0
98he
ad’s
educ
atio
n(0
.056
)(0
.078
)D
ecre
ase
in in
com
e �
inco
me
in b
otto
m q
uint
ile0.
027
0.02
6(0
.046
)(0
.050
)Co
nditi
ons
dete
riora
ted
�ho
useh
old
size
0.00
3–0
.001
(0.0
04)
(0.0
04)
30–5
9 m
inut
es a
way
from
prim
ary
scho
ol0.
092
0.09
20.
091
0.09
20.
052
0.05
20.
052
0.05
2(0
.032
)(0
.032
)(0
.032
)(0
.032
)(0
.026
)(0
.026
)(0
.026
)(0
.026
)60
+ m
inut
es a
way
from
prim
ary
scho
ol0.
101
0.10
10.
101
0.09
90.
017
0.01
70.
017
0.01
7(0
.039
)(0
.039
)(0
.039
)(0
.039
)(0
.036
)(0
.036
)(0
.036
)(0
.036
)30
–59
min
utes
aw
ay fr
om s
econ
dary
sch
ool
–0.0
52–0
.052
–0.0
51–0
.051
–0.0
15–0
.014
–0.0
14–0
.015
(0.0
45)
(0.0
45)
(0.0
45)
(0.0
45)
(0.0
49)
(0.0
49)
(0.0
49)
(0.0
49)
60+
min
utes
aw
ay fr
om s
econ
dary
sch
ool
–0.0
30–0
.029
–0.0
28–0
.029
0.01
90.
020
0.02
00.
019
(0.0
45)
(0.0
45)
(0.0
45)
(0.0
45)
(0.0
41)
(0.0
41)
(0.0
42)
(0.0
42)
Num
ber o
f obs
erva
tions
2,41
82,
418
2,41
82,
418
2,31
42,
314
2,31
42,
314
Sour
ce: S
urve
y of
Hou
seho
ld L
ivin
g St
anda
rds
2003
. N
ote:
Rob
ust s
tand
ard
erro
rs in
par
enth
eses
.
WB62_YALM_CH08 2/21/08 12:04 PM Page 165

166 Parent
For the youngest age group (8–11 years old), household income has atbest a modest effect on labor force participation. Although the results forboys ages 8–11 living in rural areas suggest that child labor force participa-tion decreases when household income decreases, one should be cautiousin interpreting the measured negative effect because of possible reversecausality: income may have increased over the previous year because thechild quit school to contribute to household farming activities.
In urban areas, higher household income reduces the chance thatolder children (ages 12–14) participate in the labor force (by 4.5 percentfor boys and 5.3 percent for girls). These results are supportive of thehypothesis that Burkinabe households do not pull their adolescent childrenout of school to make them work to take advantage of good economicconditions.6 The results support the notion that macroeconomic policyfavoring growth would reduce child work in urban areas and ultimatelyhelp create a more educated labor force.
Child labor force participation is less sensitive to changes in incomein households where the head is more educated while it is more sensi-tive in households in the bottom quintile of the income distribution. Infact, the effect is quite large for females: their labor force participationincreases by 27.5 percentage points if the household income drops fromone year to the next. So, whether 12- to 14-year-old girls attend schoolinstead of working depends more on changes in the economic fortunesof the poorest households than it does for males.
Looking at the relationship between the self-reported indicators ofwhether general economic conditions improved over the previous year(table 8.8), much the same overall conclusions emerge, with the excep-tion of the youngest age group in urban areas. As in table 8.7, the laborforce participation of individuals ages 12–14 increases when urbanhouseholds report being economically better off relative to the yearbefore. In addition, the impact is more pronounced in households inwhich the head is less educated or is poor, especially for females. Theevidence suggests that boys’ labor force participation behavior respondsmore to shifts in households’ economic conditions when the head isrelatively less educated than is the case for females. But the labor forceparticipation of young females is more responsive to changes in house-holds located in the bottom quintile of the income distribution. Theevidence for ages 8–11 in urban areas is similar to what is reported forthe 12- to 14-year-olds living in urban areas: deterioration in householdeconomic conditions is associated with an increase in child work.7
WB62_YALM_CH08 2/21/08 12:04 PM Page 166

What Determines Labor Market Participation by Youth in Burkina Faso? 167
In rural areas, school proximity is a more important factor in deter-mining labor force participation, at least for males. Distance to schoolincreases the likelihood of participating in the labor force. This effect isnot as significant in urban areas. For females, the results for the impactof school proximity are somewhat different. Although the results forfemales living in rural areas are very similar to the ones for males, theydiverge from the results for males in urban areas: school proximity isa major determinant of labor force participation (see panel A [12- to14-year-olds living in urban areas] of table 8.7). So, labor force partici-pation clearly contains a gender-specific component in its relationshipwith the time it takes to reach the closest school.
Multivariate Analysis of Enrollment DecisionsTo formally assess the role of various household, individual, and institu-tional characteristics in determining school enrollment, a series ofprobits by age group and gender are estimated (table 8.9).The educationof the head of the household is significant across all categories, stronglysuggesting that educational attainment is highly correlated across gener-ations within households, a sign of low intergenerational mobility.
To check this conjecture in a slightly different way, a subsample ofsons and fathers in 2003 was created and used to compute the correla-tion coefficient between their educational attainment for different agegroups. The correlation is 0.42 for sons ages 20–29 and 0.53 for sons ages30–39. In the United States, the correlation is about 0.30; the correlationis lower in European countries. Repeating the same exercise with the1993 data yields lower correlation coefficients, about 0.30 for both agegroups, suggesting that intergenerational mobility in educational attain-ment decreased in Burkina Faso between 1993 and 2003. Although thisis rather impressionistic evidence, it should be cause for concern if it isindeed the case.
Controlling for the educational attainment of the household head, theposition of the household in the income distribution does not appear to bea major driving force behind enrollment. While there is some evidence ofan income gradient, the magnitude is modest relative to the head’s educa-tion, and most of the coefficients are not statistically significant.The effectof being in the lowest income quintile becomes much more significant ifthe household experiences a decrease in income from one year to the next.
One key factor influencing (or at least associated with) school enroll-ment is the time it takes to get to school. Although similar variables have
WB62_YALM_CH08 2/21/08 12:04 PM Page 167
Tab
le 8
.9.S
choo
l En
rollm
ent P
rob
its
for B
urki
na
Faso
, 199
3–20
03
Mal
esFe
mal
esIte
m19
9319
9820
0319
9319
9820
03
7- to
11-
year
-old
sH
ouse
hold
hea
d’s
educ
atio
n: s
ome
prim
ary
0.03
90.
141
0.13
30.
112
0.09
20.
145
(0.0
42)
(0.0
46)
(0.0
45)
(0.0
49)
(0.0
37)
(0.0
43)
Hou
seho
ld h
ead’
s ed
ucat
ion:
prim
ary
com
plet
ed0.
284
0.13
00.
202
0.20
60.
163
0.24
8(0
.055
)(0
.047
)(0
.077
)(0
.043
)(0
.048
)(0
.072
)H
ouse
hold
hea
d’s
educ
atio
n: s
ome
seco
ndar
y0.
272
0.32
90.
409
0.21
20.
284
0.17
9(0
.060
)(0
.068
)(0
.072
)(0
.064
)(0
.065
)(0
.067
)H
ouse
hold
hea
d’s
educ
atio
n: s
econ
dary
com
plet
ed0.
500
0.37
50.
275
0.17
60.
586
0.36
6(0
.076
)(0
.136
)(0
.217
)(0
.160
)(0
.152
)(0
.178
)H
ouse
hold
hea
d’s
educ
atio
n: p
osts
econ
dary
—0.
375
—0.
097
0.10
40.
214
(0.1
36)
(0.0
95)
(0.0
71)
(0.1
42)
Hou
seho
ld h
ead
hand
icap
ped
0.05
5–0
.018
0.10
90.
022
–0.0
04–0
.072
(0.0
56)
(0.0
34)
(0.0
53)
(0.0
51)
(0.0
28)
(0.0
43)
30–5
9 m
inut
es a
way
from
prim
ary
scho
ol–0
.089
–0.0
75–0
.017
–0.0
62–0
.055
–0.0
63(0
.029
)(0
.020
)(0
.022
)(0
.028
)(0
.014
)(0
.021
)60
+ m
inut
es a
way
from
prim
ary
scho
ol–0
.226
–0.2
05–0
.178
–0.1
77–0
.181
–0.1
01(0
.048
)(0
.022
)(0
.029
)(0
.027
)(0
.017
)(0
.025
)30
–59
min
utes
aw
ay fr
om s
econ
dary
sch
ool
–0.0
23–0
.067
0.03
0–0
.056
–0.0
41–0
.044
(0.0
33)
(0.0
28)
(0.0
35)
(0.0
21)
(0.0
19)
(0.0
23)
60+
min
utes
aw
ay fr
om s
econ
dary
sch
ool
–0.1
49–0
.144
0.00
7–0
.110
–0.1
28–0
.087
(0.0
29)
(0.0
32)
(0.0
33)
(0.0
26)
(0.0
25)
(0.0
29)
Hou
seho
ld s
ize
–0.0
11–0
.003
–0.0
16–0
.013
–0.0
02–0
.018
(0.0
02)
(0.0
01)
(0.0
02)
(0.0
02)
(0.0
01)
(0.0
02)
Hou
seho
ld in
com
e in
sec
ond
quin
tile
0.00
8–0
.004
–0.0
06–0
.018
0.00
60.
069
(0.0
30)
(0.0
29)
(0.0
29)
(0.0
32)
(0.0
23)
(0.0
30)
168
WB62_YALM_CH08 2/21/08 12:04 PM Page 168

Hou
seho
ld in
com
e in
third
qui
ntile
–0.0
220.
050
0.05
40.
005
–0.0
050.
072
(0.0
30)
(0.0
28)
(0.0
29)
(0.0
36)
(0.0
24)
(0.0
30)
Hou
seho
ld in
com
e in
four
th q
uint
ile0.
038
0.04
00.
040
0.03
80.
005
0.10
9(0
.033
)(0
.028
)(0
.030
)(0
.036
)(0
.024
)(0
.032
)H
ouse
hold
inco
me
in fi
fth q
uint
ile0.
022
0.04
80.
039
0.09
7–0
.003
0.11
1(0
.032
)(0
.033
)(0
.038
)(0
.038
)(0
.001
)(0
.037
)Ps
eudo
R2
0.34
70.
348
0.34
90.
406
0.38
90.
413
Num
ber o
f obs
erva
tions
5,25
45,
095
3,73
34,
803
4,82
23,
676
12- t
o 14
-yea
r-ol
dsH
ouse
hold
hea
d’s
educ
atio
n: s
ome
prim
ary
0.12
00.
066
0.14
80.
046
0.12
50.
074
(0.1
04)
(0.0
58)
(0.0
65)
(0.0
57)
(0.0
66)
(0.0
49)
Hou
seho
ld h
ead’
s ed
ucat
ion:
prim
ary
com
plet
ed0.
053
0.14
60.
162
0.10
50.
119
0.17
0(0
.066
)(0
.070
)(0
.106
)(0
.049
)(0
.049
)(0
.088
)H
ouse
hold
hea
d’s
educ
atio
n: s
ome
seco
ndar
y0.
290
0.34
40.
246
0.11
40.
157
0.20
0(0
.092
)(0
.083
)(0
.091
)(0
.048
)(0
.052
)(0
.072
)H
ouse
hold
hea
d’s
educ
atio
n: s
econ
dary
com
plet
ed—
0.52
50.
300
0.27
70.
250
0.10
4(0
.199
)(0
.224
)(0
.124
)(0
.125
)(0
.128
)H
ouse
hold
hea
d’s
educ
atio
n: p
osts
econ
dary
—0.
583
0.59
80.
065
0.19
50.
026
(0.1
13)
(0.1
56)
(0.0
82)
(0.1
16)
(0.0
80)
Hou
seho
ld h
ead
hand
icap
ped
–0.0
53–0
.021
–0.0
12–0
.032
0.06
30.
104
(0.0
65)
(0.0
45)
(0.0
66)
(0.0
43)
(0.0
47)
(0.0
71)
30–5
9 m
inut
es a
way
from
prim
ary
scho
ol–0
.017
0.03
8–0
.038
–0.0
26–0
.015
–0.0
36(0
.038
)(0
.031
)(0
.032
)(0
.026
)(0
.020
)(0
.029
)60
+ m
inut
es a
way
from
prim
ary
scho
ol–0
.014
–0.0
19–0
.185
–0.0
26–0
.067
–0.0
65(0
.050
)(0
.038
)(0
.040
)(0
.048
)(0
.030
)(0
.038
)30
–59
min
utes
aw
ay fr
om s
econ
dary
sch
ool
–0.0
70–0
.074
–0.1
10–0
.049
–0.0
68–0
.023
(0.0
39)
(0.0
33)
(0.0
34)
(0.0
21)
(0.0
22)
(0.0
29)
(con
tinue
d)
169
WB62_YALM_CH08 2/21/08 12:04 PM Page 169

Tab
le 8
.9.S
choo
l En
rollm
ent P
rob
its
for B
urki
na
Faso
, 199
3–20
03 (c
ontin
ued)
Mal
esFe
mal
esIte
m19
9319
9820
0319
9319
9820
03
60+
min
utes
aw
ay fr
om s
econ
dary
sch
ool
–0.1
15–0
.177
–0.1
38–0
.090
–0.1
76–0
.013
(0.0
38)
(0.0
37)
(0.0
41)
(0.0
25)
(0.0
33)
(0.0
33)
Hou
seho
ld s
ize
–0.0
11–0
.001
–0.0
09–0
.006
–0.0
02–0
.010
(0.0
02)
(0.0
01)
(0.0
02)
(0.0
01)
(0.0
01)
(0.0
03)
Hou
seho
ld in
com
e in
sec
ond
quin
tile
0.05
40.
042
–0.0
12–0
.029
–0.0
390.
007
(0.0
42)
(0.0
36)
(0.0
41)
(0.0
28)
(0.0
26)
(0.0
34)
Hou
seho
ld in
com
e in
third
qui
ntile
0.00
10.
070
0.04
5–0
.033
–0.0
040.
042
(0.0
41)
(0.0
40)
(0.0
43)
(0.0
26)
(0.0
27)
(0.0
39)
Hou
seho
ld in
com
e in
four
th q
uint
ile0.
042
0.02
50.
032
0.03
6–0
.001
0.02
5(0
.065
)(0
.044
)(0
.045
)(0
.040
)(0
.027
)(0
.036
)H
ouse
hold
inco
me
in fi
fth q
uint
ile–0
.003
0.00
10.
064
0.01
8–0
.030
–0.0
29(0
.042
)(0
.042
)(0
.047
)(0
.032
)(0
.028
)(0
.038
)Ps
eudo
R2
0.34
50.
350
0.39
00.
400
0.40
30.
421
Num
ber o
f obs
erva
tions
2,48
92,
539
2,02
32,
454
2,33
01,
879
15- t
o 18
-yea
r-ol
dsH
ouse
hold
hea
d’s
educ
atio
n: s
ome
prim
ary
0.03
40.
021
0.02
70.
036
0.05
00.
002
(0.0
22)
(0.0
35)
(0.0
35)
(0.0
22)
(0.0
42)
(0.0
16)
Hou
seho
ld h
ead’
s ed
ucat
ion:
prim
ary
com
plet
ed0.
019
0.08
30.
057
0.04
30.
107
0.08
1(0
.029
)(0
.033
)(0
.040
)(0
.021
)(0
.037
)(0
.038
)H
ouse
hold
hea
d’s
educ
atio
n: s
ome
seco
ndar
y0.
097
0.21
70.
074
0.10
30.
114
0.03
3(0
.038
)(0
.046
)(0
.035
)(0
.036
)(0
.034
)(0
.036
)H
ouse
hold
hea
d’s
educ
atio
n: s
econ
dary
com
plet
ed0.
133
0.38
40.
486
0.08
90.
147
0.01
0(0
.108
)(0
.147
)(0
.182
)(0
.076
)(0
.089
)(0
.032
)
170
WB62_YALM_CH08 2/21/08 12:04 PM Page 170

171
Hou
seho
ld h
ead’
s ed
ucat
ion:
pos
tsec
onda
ry0.
212
0.32
50.
327
0.06
90.
114
–0.0
07(0
.110
)(0
.099
)(0
.126
)(0
.039
)(0
.054
)(0
.016
)H
ouse
hold
hea
d ha
ndic
appe
d–0
.003
–0.0
16–0
.041
0.00
3–0
.010
–0.0
18(0
.039
)(0
.026
)(0
.029
)(0
.015
)(0
.017
)(0
.034
)30
–59
min
utes
aw
ay fr
om p
rimar
y sc
hool
0.05
20.
036
–0.0
090.
024
–0.0
04–0
.016
(0.0
21)
(0.0
25)
(0.0
19)
(0.0
17)
(0.0
12)
(0.0
12)
60+
min
utes
aw
ay fr
om p
rimar
y sc
hool
–0.0
720.
027
–0.0
800.
035
–0.0
20–0
.024
(0.0
19)
(0.0
27)
(0.0
18)
(0.0
45)
(0.0
18)
(0.0
17)
30–5
9 m
inut
es a
way
from
sec
onda
ry s
choo
l–0
.072
–0.0
43–0
.023
–0.0
27–0
.018
–0.0
05(0
.01)
(0.0
15)
(0.0
17)
(0.0
06)
(0.0
10)
(0.0
10)
60+
min
utes
aw
ay fr
om s
econ
dary
sch
ool
–0.1
72–0
.147
–0.0
76–0
.088
–0.0
77–0
.071
(0.0
24)
(0.0
25)
(0.0
21)
(0.0
14)
(0.0
19)
(0.0
18)
Hou
seho
ld s
ize
–0.0
06–0
.002
–0.0
06–0
.002
–0.0
01–0
.003
(0.0
01)
(0.0
01)
(0.0
02)
(0.0
01)
(0.0
01)
(0.0
01)
Hou
seho
ld in
com
e in
sec
ond
quin
tile
–0.0
020.
004
–0.0
510.
002
–0.0
17–0
.011
(0.0
27)
(0.0
24)
(0.0
31)
(0.0
19)
(0.0
15)
(0.0
20)
Hou
seho
ld in
com
e in
third
qui
ntile
0.03
90.
008
0.08
00.
031
–0.0
050.
022
(0.0
28)
(0.0
25)
(0.0
33)
(0.0
20)
(0.0
16)
(0.0
22)
Hou
seho
ld in
com
e in
four
th q
uint
ile–0
.012
0.02
10.
068
0.03
3–0
.003
0.03
0(0
.021
)(0
.026
)(0
.032
)(0
.018
)(0
.015
)(0
.026
)H
ouse
hold
inco
me
in fi
fth q
uint
ile0.
057
0.01
80.
127
0.06
60.
009
0.06
1(0
.029
)(0
.025
)(0
.040
)(0
.022
)(0
.017
)(0
.029
)Ps
eudo
R2
0.38
90.
397
0.37
80.
423
0.38
70.
433
Num
ber o
f obs
erva
tions
2,86
02,
865
2,32
12,
629
2,77
42,
260
Sour
ce: S
urve
y of
Hou
seho
ld L
ivin
g St
anda
rds.
Not
e: S
tand
ard
erro
rs a
re in
par
enth
eses
. All
indi
vidu
als
for w
hom
the
head
of h
ouse
hold
had
the
indi
cate
d le
vel o
f edu
catio
n w
ere
enro
lled
in s
choo
l, hen
ce th
ose
obse
rvat
ions
wer
e dr
oppe
d.O
ther
regr
esso
rs in
clud
e re
gion
of r
esid
ence
, whe
ther
the
head
of h
ouse
hold
is h
andi
capp
ed, t
he ti
me
it ta
kes
to re
ach
the
food
mar
ket,
and
whe
ther
oth
er s
iblin
gs a
re a
lso e
nrol
led.
WB62_YALM_CH08 2/21/08 12:04 PM Page 171

been used in the economics of education literature (Card 1995; Laszlo2005), the variable is usually the distance from the home to the school.It is plausible that time matters more in developing countries, where themain modes of transportation to school are more varied.
In Burkina Faso, enrollment is associated with having a school nearby.Although one would expect that older individuals’ decisions to enroll insecondary school would be primarily affected by the time it takes to getto a secondary school, the time to primary school is a significant deter-minant of enrollment for secondary school–age individuals. Similarly, thetime it takes to reach a secondary school is negatively associated with theenrollment of primary school–age children. It seems unlikely that somehouseholds would not enroll their children in primary schools becausesecondary schools are far away, so these variables must be picking upmany things other than just the time-to-school dimension. Note alsothat the time-to-school factor affects males slightly more than females.
Economic Returns to EducationThe estimated annual return to one year of additional education inBurkina Faso is 11.5 percent (table 8.10).8 This estimate is at the high endof the range of returns estimated in developed countries but in line withestimates for developing countries (Psacharopoulos and Patrinos 2002).
Inclusion of the head of household’s educational attainment in theregression makes a substantial difference: the estimated return per cate-gory of schooling drops by more than 35 percent when the head ofhousehold’s education is included in the regression. This strongly sug-gests that household and family background factors are important jointdeterminants of educational attainment.9
Having a literate household head has a very large effect on householdincome (not shown). Limiting the sample to households in which thehead has some primary education yields an even larger effect of headliteracy on household income, suggesting that the basic skills learned inschool play an important role in the welfare of the household.
The relationship between schooling and earnings is roughly linear inurban areas. In contrast, in rural areas the return to education increasesmarkedly for people with some secondary education.
Many unmeasured confounding factors could be driving the estimatedpositive relationship between schooling and household income. Forexample, it is likely that unmeasured household and institutional char-acteristics exhibit considerable heterogeneity across geographic areasand that this variation is systematically related to both schooling and
172 Parent
WB62_YALM_CH08 2/21/08 12:04 PM Page 172

What Determines Labor Market Participation by Youth in Burkina Faso? 173
household income. Although the regressions include dummy variables tocontrol for region of residence, more refined regional variation—drivenin part by ethnic differences—could have an impact on the results.
Columns 3 and 4 of table 8.10 show the results when unrestrictedcensus-zone dummy variables are added to the model. These surveys areconducted in more than 400 such zones. With census-zone fixed effects,the estimated returns are obtained by exploiting only the variation inhousehold income and schooling within census zones. The resultingdecline is modest.
Controlling for unmeasured heterogeneity within census zones doesnot control for the joint endogeneity of educational attainment andhousehold income. This problem stems from two main sources. The firsthas to do with unmeasured household ability, which could be positivelycorrelated with both schooling and income. The second is associatedwith the marginal cost of acquiring extra education. Households with
Table 8.10. Rate of Return to Schooling in Burkina Faso, 2003Dependent variable: Log of total per capita household income in 2003
Ordinary Ordinary Census- Census-least least zone fixed zone fixed
squares squares effects effectsVariable (1) (2) (3) (4)
Average educational 0.350 0.211 0.285 0.175attainment in household (0.019) (0.028) (0.018) (0.029)
Number of household 0.085 0.102 0.050 0.057members enrolled in school (0.045) (0.044) (0.041) (0.041)
Educational attainment of —
0.125—
0.101head of household (0.019) (0.021)
Fraction of females –0.113 –0.143 –0.066 –0.089in household (0.065) (0.065) (0.063) (0.063)
Household size 0.059 0.060 0.058 0.059(0.005) (0.005) (0.004) (0.004)
Lives in rural area –0.521 –0.528— —
(0.071) (0.007)Average age of 0.043 0.039 0.031 0.028
household members (0.010) (0.010) (0.009) (0.009)Average age squared � 100 –0.060 –0.050 –0.042 –0.037
(0.010) (0.015) (0.013) (0.013)
Source: Survey of Household Living Standards 2003.Note: — indicates that the variable is not included in the regression. Results are based on a sample of 7,125 indi-viduals ages 10–60 not enrolled in school. Regional dummies are included in all specifications. Ordinary leastsquares standard errors are adjusted for the clustering at the census-zone level. Individual educational attainmentis aggregated into six categories: none, partial primary, primary completed, partial secondary, secondary completed,and postsecondary.
WB62_YALM_CH08 2/21/08 12:04 PM Page 173

174 Parent
little taste for education and households with financial constraints areobservationally the same, in that both are likely to have fairly high discountrates. Larger returns to education are needed to induce such householdsto send their children to school. This line of argument comes fromBecker’s classic schooling model, in which individuals face constraintsand have preferences and abilities related to acquiring education. If the(individual-specific) marginal rate of return to education is decreasingand the (individual-specific) marginal cost of acquiring education isincreasing, there should be a distribution of educational attainment inany given population as long as there is some heterogeneity on either thecost or the ability side.
To identify the true average marginal return to education, the meas-ures of access to schooling (primary or secondary) are used as exclusionrestrictions in a simultaneous equation system. To provide for an extrasource of variation, the measures of access to secondary schooling areinteracted with the educational attainment of the head of the household.The idea behind such an interaction is that one would expect the edu-cational attainment decisions of poorer households to be more sensitiveto the proximity of a primary or secondary school.
The results indicate that the instruments are very good predictors ofhousehold educational attainment (table 8.11). The estimated instru-mental variable returns are at least as large as the ordinary least squaresestimates and substantially larger than the fixed-effects estimates, sug-gesting that if ability is biasing the ordinary least squares estimatesupward, other, empirically more important factors are biasing themdownward. These other factors could be measurement error or constraintson access to school. One can think of the instrumental variable results asrepresenting the marginal return to schooling for those whose levels ofeducational attainment were affected by the instruments (Imbens andAngrist 1994).10
To see whether the cross-sectional heterogeneity in returns to educationis at least partly attributable to geographical differences, the longitudinalstructure (along census regions lines) of the data is exploited to estimatefixed-effects instrumental variable models (table 8.12). Whether oneallows for the time-to-school measures to have a direct effect on householdincome does not make any substantial difference, in large part becausethose main effects are both modest and not statistically significant. Theevidence suggests that much of the heterogeneity across households inthe returns to education that could have been the source of the testrejecting the same overidentifying restrictions in table 8.11 were driven
WB62_YALM_CH08 2/21/08 12:04 PM Page 174

175
Tab
le 8
.11.
Inst
rum
enta
l Var
iab
les
Esti
mat
es o
f Rat
e of
Ret
urn
to S
choo
ling
Dep
ende
nt v
aria
ble:
Log
of h
ouse
hold
tota
l inc
ome
per h
ead
in 2
003
Mod
el [1
]M
odel
[2]
Mod
el [3
]Va
riabl
esFi
rst-
stag
eIV
-est
imat
eFi
rst-
stag
eIV
-est
imat
eFi
rst-
stag
eIV
-est
imat
e
Hou
seho
ld a
vera
ge e
duca
tiona
l att
ainm
ent
0.36
90.
385
1.49
7(0
.030
)(0
.028
)(0
.624
)N
umbe
r of h
ouse
hold
mem
bers
enr
olle
d0.
292
0.08
00.
292
0.10
40.
256
–0.1
85in
sch
ool
(0.0
20)
(0.0
45)
(0.0
20)
(0.0
47)
(0.0
17)
(0.1
71)
Hea
d of
hou
seho
ld’s
educ
atio
nal a
ttai
nmen
t—
——
—0.
642
–0.6
42(0
.011
)(0
.367
)Fr
actio
n of
fem
ales
in h
ouse
hold
–0.2
84–0
.115
–0.2
84–0
.109
–0.2
86–0
.209
(0.0
32)
(0.0
70)
(0.0
32)
(0.0
70)
(0.0
26)
(0.1
93)
Hou
seho
ld s
ize
–0.0
090.
045
–0.0
090.
045
–0.0
050.
051
(0.0
02)
(0.0
06)
(0.0
02)
(0.0
05)
(0.0
02)
(0.0
06)
Live
s in
rura
l are
a–0
.389
–0.6
00–0
.389
–0.6
13–0
.295
–0.2
74(0
.020
)(0
.071
)(0
.020
)(0
.080
)(0
.017
)(0
.199
)Ti
me
to p
rimar
y sc
hool
0.01
4—
0.01
40.
171
–0.0
320.
201
(0.0
11)
—(0
.011
)(0
.046
)(0
.009
)(0
.051
)Ti
me
to s
econ
dary
sch
ool
–0.2
63—
–0.2
63–0
.043
–0.0
630.
049
(0.0
11)
—(0
.011
)(0
.040
)(0
.010
)(0
.068
)H
ead’
s ed
ucat
ion
�tim
e to
sec
ond.
sch
ool
0.32
2—
0.32
2—
–0.0
36—
(0.0
04)
(0.0
04)
(0.0
07)
Firs
t-st
age
F24
30.9
6731
.928
.24
Ove
riden
tific
atio
n te
st s
tatis
tic12
.597
Just
iden
tifie
dJu
st id
entif
ied
[P-V
alue
]0.
002
Num
ber o
f obs
erva
tions
: 7,1
25
Sour
ce: S
urve
y of
Hou
seho
ld L
ivin
g St
anda
rds.
Not
e: S
tand
ard
erro
rs a
re in
par
enth
eses
.
WB62_YALM_CH08 2/21/08 12:04 PM Page 175

Tab
le 8
.12.
Pan
el D
ata
IV E
stim
ates
Dep
ende
nt v
aria
ble:
Log
of h
ouse
hold
tota
l inc
ome
per h
ead
in 2
003
Mod
el [1
]M
odel
[2]
Mod
el [3
]Va
riabl
esFi
rst-
stag
eIV
-est
imat
eFi
rst-
stag
eIV
-est
imat
eFi
rst-
stag
eIV
-est
imat
e
Hou
seho
ld a
vera
ge e
duc.
att
ainm
ent
0.35
40.
350
0.79
3(0
.027
)(0
.027
)(0
.603
)
Hea
d of
hou
seho
ld’s
educ
. att
ainm
ent
——
——
0.59
8–0
.241
(0.0
12)
(0.3
36)
Tim
e to
prim
ary
scho
ol0.
001
—0.
001
0.01
9–0
.024
0.00
9(0
.014
)—
(0.0
14)
(0.0
29)
(0.0
12)
(0.0
32)
Tim
e to
sec
onda
ry s
choo
l–0
.232
—–0
.232
–0.0
30–0
.020
0.01
3(0
.016
)—
(0.0
16)
(0.0
31)
(0.0
14)
(0.0
40)
Hea
d’s
educ
. �tim
e to
sec
ond.
sch
ool
0.29
6—
0.29
6—
–0.0
29—
(0.0
04)
(0.0
04)
(0.0
07)
Firs
t-st
age
F14
37.2
942
86.1
514
.95
Ove
riden
tific
atio
n te
st s
tatis
tic2.
191
Just
iden
tifie
dJu
st id
entif
ied
[P-V
alue
]0.
334
Num
ber o
f obs
erva
tions
: 7,1
25
Sour
ce: S
urve
y of
Hou
seho
ld L
ivin
g St
anda
rds.
Not
e: S
tand
ard
erro
rs a
re in
par
enth
eses
.
176
WB62_YALM_CH08 2/21/08 12:04 PM Page 176

by variation across census regions.11 This cross-region variation is absorbedwith the fixed effects and the models in table 8.12 use only the within-census-region variation to estimate the return to education.
Finally, the returns estimated with model 3 in table 8.12 are suspi-ciously large, although they are smaller than in table 8.11. Again, thedirect effect of the head of household’s education, controlling for thepredicted schooling, is negative.This does not appear realistic.As explainedabove, the likely problem is that there is simply insufficient variation inthe head’s educational attainment variable, with such a large fractionhaving no schooling at all.
The analysis of the economic returns to education suggests that thereturns to education are large, and there is no indication that the sim-ple cross-sectional estimates overstate the true effect of education onhousehold income. One possible explanation for the result is that ruralhouseholds with more education use better farming technology (for ananalysis along these lines, see Laszlo [2005] for Peru and Jolliffe [2002]for Ghana).
Notes
1. The school enrollment question is distinct from the one on the main activityduring the survey week.This allows the construction of a school and work indi-cator, a combination that is not one of the choices among the main activities.
2. Because of the small number of girls going beyond primary schooling, conclu-sions for females with more education are based on very imprecise estimates,especially for older age groups.
3. For the underlying data, see Parent (2006). The approach used in the back-ground paper relies on the assumption that the group of individuals understudy is statistically the same in 1993, 1998, and 2003. That is, even thoughthe samples are made up of different individuals, the assumption is that indi-viduals in all three surveys are drawn from the same underlying population, sothat 25- to 29-year-olds in 2003 are on average the same as the 15- to 19-year-olds in 1993. The main threat to the validity of this assumption is emigration.Even migration within the country poses problems if occupation and industrystructures differ significantly across regions.
4. Educated people’s sectors of activity are also much more diversified than arethose for uneducated workers, who are virtually all employed in primaryindustries (agriculture, fishing, and hunting).
5. The less-than-ideal quality of this measure would be expected to bias towardzero whatever impact there might be, thus likely providing a lower boundestimate of the true impact.
What Determines Labor Market Participation by Youth in Burkina Faso? 177
177
WB62_YALM_CH08 2/21/08 12:04 PM Page 177
178 Parent
6. The theoretical impact of increased income on child work is a prioriambiguous, as Edmonds and Pavcnik (2005) note. On the one hand, favor-able labor market conditions raise the pure price effect of sending one’s childto school, making labor force participation procyclical. On the other hand,the wealth effect of economic growth may allow households to consumemore education.
7. It is interesting to speculate as to why we can detect it with the self-reportedindicator of changes in the overall household economic conditions but notwith the constructed income change measure. One possibility is that thebias-inducing mechanical relationship between child work and householdincome by which income should increase if children are asked to leave schoolto contribute is less of a factor with the reported change in overall economicconditions. It could be, for example, that even if income increased somewhat,households might still report that they were better off the year before ifincreases in living costs outstripped the increase in income.
8. This estimate is based on the assumption that partial primary education corre-sponds to 3 years of education, primary completed to 6 years, partial secondaryto 9 years, secondary completed to 12 years, and postsecondary to 14 years.
9. The same regressions run on the subsample of individuals living in rural areas(not shown) produced similar, albeit slightly weaker, results. The estimatedreturns were higher for people living in urban areas.
10. Even with this type of underlying mechanism in mind, the very large returnestimated in model 3 in table 8.11, in which the household head’s educationhas a direct effect on income, appears unrealistically high. One likely reasonis that the variation in the education of heads of households is relatively small.Model 3 attempts to use the variation in the household head’s educationinteracted with the time it takes to reach a secondary school to predict averagehousehold education at the same time it is used to predict income conditionalon predicted education. This is asking quite a lot from that variable, and in factthe household head’s education has a large and negative effect on income(conditional on predicted education), which does not make much sense.
11. Excluding the time-to-school variables along with the interaction of the time ittakes to get to a secondary school with the educational attainment of the headallows testing of the overidentification restrictions. Contrary to the analogousmodel in table 8.11, the overidentifying restrictions easily pass the test.
References
Card, David. 1995. “Using Geographic Variation in College Proximity to Estimatethe Return to Schooling.” In Aspects of Labor Market Behaviour: Essaysin Honour of John Vanderkamp, ed. L. N. Christofides, E. K. Grant, andR. Swidinsky. Toronto: University of Toronto Press.
WB62_YALM_CH08 2/21/08 12:04 PM Page 178

What Determines Labor Market Participation by Youth in Burkina Faso? 179
Edmonds, Eric, and Nina Pavcnik. 2005. “Child Labor in the Global Economy.”Journal of Economic Perspectives 19 (1): 199–220.
Imbens, Guido W., and Joshua D. Angrist. 1994. “Identification and Estimation ofLocal Average Treatment Effects.” Econometrica 62 (2): 467–75.
Jolliffe, Dean. 2002. “Whose Education Matters in the Determination ofHousehold Income? Evidence from a Developing Country.” EconomicDevelopment and Cultural Change 50 (2): 287–312.
Laszlo, Sonia. 2005. “Self-Employment Earnings and Returns to Education inRural Peru.” Journal of Development Studies 41 (7): 1247–87.
Parent, Daniel. 2006. “Youth Labor Market in Burkina Faso: Recent Trends.” SocialProtection Discussion Paper No. 0607, World Bank, Washington, DC.
Psacharopoulos, George, and Harry Anthony Patrinos. 2002. “Returns toInvestment in Education: A Further Update.” Policy Research Working PaperNo. WPS2881, World Bank, Washington, DC.
WB62_YALM_CH08 2/21/08 12:04 PM Page 179

WB62_YALM_CH08 2/21/08 12:04 PM Page 180

Youth unemployment and underemployment represent growing concernsworldwide. In 2002, some 88 million young people (those ages 15–24)were unemployed, representing about 41 percent of the world’s unem-ployed, according to the International Labour Organization (ILO 2004).Young workers everywhere have much higher rates of joblessness andmuch lower earnings than older workers. In many countries young peopleare also concentrated in low-skill informal work or in hazardous formsof work that are ill-suited to their age and experience. Employmentoutcomes are typically worst for former child laborers and other earlyschool leavers, groups with the least opportunity to accumulate thehuman capital needed for gainful employment.1
The challenge of youth employment is especially great in Sub-SaharanAfrica, where people ages 15–24 account for 36 percent of the working-age population. The number of young people looking for work is expectedto increase by 28 percent—an additional 30 million people—over the next15 years. Failure to address youth employment issues will have ominousconsequences for the economy and society. Without opportunities foryoung people to earn a living, intergenerational cycles of poverty willpersist, exacerbating problems in societies already made vulnerable byHIV/AIDS, food insecurity, and violence.
C H A P T E R 9
Child Labor and Youth Employment in Ethiopia
Lorenzo Guarcello, Scott Lyon, and Furio Rosati
181
WB62_YALM_CH09 3/12/08 12:10 PM Page 181

The problem of youth unemployment is particularly acute in Ethiopia,home to one of the largest youth populations in Sub-Saharan Africa. Thelack of employment opportunities for young people is among the criticaldevelopment challenges facing Ethiopia and a key barrier to nationalefforts toward meeting the Millennium Development Goals. Only about40 percent of Ethiopian children complete primary education, and just13 percent are enrolled in secondary education, meaning that most youngpeople enter the labor market with low levels of human capital (seechapter 7 of this volume).
The specific factors affecting youth employment in Ethiopia havereceived little research attention. There is, therefore, limited empiricalbasis for formulating policies and programs promoting youth employ-ment and successful school-to-work transitions in Ethiopia. This chapteraims to begin to fill this gap, by analyzing a set of youth employmentindicators drawn primarily from the 2001 Ethiopia Labour Force Survey.The chapter looks at the labor market outcomes of young people andkey factors influencing these outcomes, including early labor market entryand human capital accumulation. It also examines the process of labormarket entry and the duration of the transition from school to work.
National Context
This section describes the main features of Ethiopia as background forunderstanding both child labor and youth employment in the country.
Macroeconomic TrendsEthiopia has witnessed high but erratic output growth since the end ofthe civil war in 1991. Growth has averaged about 6 percent a year, one ofthe most rapid rates in Africa. Year-to-year fluctuations in economic per-formance, however, have been large (table 9.1). Annual growth rangedfrom 1 percent to 10 percent between 1991–92 and 1997–98 (Easterly2002, as cited in World Bank 2005).
Despite the government’s commitment to agriculture-led develop-ment, the main sources of growth have been nonagricultural, led by theservice and industrial sectors. Annual growth in the agriculture sectoraveraged about 3.6 percent a year between 1992 and 1996, and thendecreased to 2.3 percent a year between 1997 and 2000, while servicesgrew about 9 percent a year. Though much smaller, industry contributedas much to growth as agriculture between 1992 and 2000 (Easterly2002, as cited in World Bank 2005).
182 Guarcello, Lyon, and Rosati
WB62_YALM_CH09 3/12/08 12:10 PM Page 182

Levels of poverty are very high in Ethiopia, with annual per capitaincome in 2003 standing at just US$102 (about US$800 in purchasingpower parity; MOFED [2002], as cited in Denu,Tekeste, and van der Deijl[2005]). In 1999, about 44 percent of the population lived below thepoverty line ($1.50 in 1993 purchasing power parity; World DevelopmentIndicators 2000 data, as cited in Getachew and Kallaur [2005]). WorldBank poverty assessments point to a rise in urban poverty over the pastdecade and to only a marginal decline in rural poverty (MOFED [2002],as cited in Getachew and Kallaur [2005]).
Demographic TrendsEthiopia has undergone rapid population growth in recent decades. Thepopulation was estimated at 73 million people in 2005, making Ethiopiathe second most populous country in Sub-Saharan Africa after Nigeria.Ethiopia’s population is heavily concentrated in the young age cohorts,with more than half the population under age 25. People 65 and olderrepresent just 3 percent of the total population, a reflection of Ethiopia’slife expectancy of just 44 years (UN population data for 2001, as citedin Getachew and Kallaur [2005]).
The proportion of people ages 15–24 increased over the past two decades,rising from 14 percent of the population in 1984 to about 20 percent in2005. The youth population is projected to grow in absolute terms, fromabout 15 million in 2005 to 26 million in 2030, but it will remain atabout one-fifth of the population (Central Statistical Authority, as citedin Getachew and Kallaur [2005]).
Labor Market CharacteristicsRapid population growth during recent decades has resulted in a largeincrease in the labor force (figure 9.1). The national labor force included
Child Labor and Youth Employment in Ethiopia 183
Table 9.1. Macroeconomic Indicators for Ethiopia, 1982–2001
Sector or indicator 1982–86 1987–91 1992–96 1997–2001
Average annual percentage changeReal GDP –0.4 3.9 4.6 4.7Real GDP per capita –3.0 0.9 1.8 2.0Agriculture –1.5 5.5 3.6 2.3Industry 6.2 –5.3 8.4 6.1
Percentage of GDPGross domestic investment 13.5 13.8 14.4 16.3Gross domestic savings 5.7 7.1 5.8 3.1
Source: Data on agriculture and industry are from ECA (2002) and MEDaC (1999, 2000). All other data are fromWorld Bank (2002), as cited in Denu, Tekeste, and van der Deijl (2005).
WB62_YALM_CH09 3/12/08 12:10 PM Page 183

an estimated 32.2 million people in 2005, up from 12.9 million people in1984.The labor force is projected to double again over the next 25 years,placing a huge strain on the labor market even under the most optimisticgrowth scenario.
More than 80 percent of the labor force is employed in subsistence agri-culture, with little difference in labor force composition between youngpeople and adults. Most people with jobs cannot read or write and workin the informal sector as casual workers (Central Statistical Authority, ascited in Denu, Tekeste, and van der Deijl [2005]).
The activity rate of the working-age population was 72 percent in 1999,one of the highest in the world. Underemployment is prevalent, however,because economic necessity dictates that individuals secure some form ofwork when no full-time jobs are available. Informal sector work is there-fore important, with the sector employing some 4.8 million people in1999 (Denu, Tekeste, and van der Deijl 2005). Open unemployment isconfined largely to the middle class, with people awaiting positions in thepublic sector accounting for a significant share (Woldehanna, Guta, andFerede 2005).
Education TrendsEducational attainment in Ethiopia is very low: in 2004 the average maleadult had completed 1.8 grades, the average female had completed just0.9 grades, and only 5 percent of the population had some secondary orhigher education (Getachew and Kallaur 2005).
184 Guarcello, Lyon, and Rosati
Figure 9.1. Ethiopia’s Labor Force Tripled between 1960 and 2002
0
10
20
30
40
50
60
70
1960
mill
ion
peo
ple
1970 1980 1990 2000 2002
population labor force
Source: Central Statistical Authority (various years), as cited in Denu, Tekeste, and van der Deijl (2005).
WB62_YALM_CH09 3/12/08 12:10 PM Page 184

A major government effort in recent years has led to significant progressin expanding access to education (figure 9.2). Between 1995 and 2003 theprimary gross enrollment ratio more than doubled (from 26 percent to64 percent) and secondary gross enrollment almost tripled (from 7 percentto 19 percent). Primary school enrollment rose from 2.64 million studentsin 1994 to 8.74 million students in 2003, while enrollment in secondaryschool increased from about 357,000 students in 1994 to more than586,000 in 2003 (Ministry of Education 1999, 2003).
Despite such improvement, universal primary enrollment remains adistant target, especially in rural areas, where primary enrollment is lessthan half that in cities and towns. Disparities between girls and boys arealso significant. The primary gross enrollment ratio was 75 percent andthe secondary gross enrollment ratio 24 percent for boys in 2003, whilethe corresponding figures for females were 54 percent and 14 percent.Rural girls are particularly disadvantaged with regard to educationopportunities (Ministry of Education 2003).
Child Labor
In Ethiopia, as in several other Sub-Saharan Africa countries, a largeproportion of the labor force enters the labor market before age 15,with little or no formal education. For better or worse, children’s workrepresents an important avenue of access to the labor market. Ananalysis of youth in the labor market would therefore not be completewithout considering early labor market entry and the consequences ofearly entry for labor market outcomes.
Child Labor and Youth Employment in Ethiopia 185
Figure 9.2. Gross Primary School Enrollment in Ethiopia More Than Doubledbetween 1995 and 2003
0
10
20
30
40
50
60
70
1995 1996 1997 1998 1999 2000 2001 2002 2003
per
cen
t
primary education secondary education
Source: Ministry of Education 2003.
WB62_YALM_CH09 3/12/08 12:10 PM Page 185

Child Involvement in Economic ActivityEthiopia has one of the highest rates of child labor in the world. Half ofall 5- to 14-year-olds—more than 7.5 million children—were involved ineconomic activity in 2001.2 Child labor is closely related to youth labormarket outcomes because early experiences in the labor market can sig-nificantly influence lifetime patterns of employment, earnings, and unem-ployment. With low levels of human capital, former child laborers are ata particular disadvantage in finding and maintaining a place in the adultlabor force.
Child economic activity rises sharply with age (figure 9.3), but 40 per-cent of even the youngest children (those ages 5–9) are involved ineconomic activity. Rural children and boys face the greatest risk ofinvolvement in child labor: 54 percent of rural children ages 5–14 areinvolved in economic activity, compared with only 15 percent of theirurban counterparts (table 9.2). The economic activity rate of boysexceeds that of girls by 20 percentage points, although this differencedoes not take into account the performance of household chores, such aswater and fuelwood collection, which are typically the domain of girls.
Household demand for labor has been identified as the most importantreason for not sending children to school in Ethiopia (Yamano 2000).Indeed, children’s productivity often constitutes a vital component ofhousehold survival strategies. Although the marginal productivity of achild worker is about one-third to one-half that of a working adultman (Cockburn 2002), each working child contributes 4–7 percent ofa household’s income in rural areas (and the contribution can reach ashigh as 50 percent).
186 Guarcello, Lyon, and Rosati
Figure 9.3. Rural Residents and Boys in Ethiopia Are More Likely to Work as ChildrenThan Urban Residents and Girls
0
20
40
60
80
100
5 6 7 8 9 10 11 12 13 14age in years
per
cen
tag
e w
ho
wo
rk
urban, male
urban, female
rural, male
rural, female
Source: Understanding Children’s Work calculations based on Ethiopia Labour Force Survey 2001.
WB62_YALM_CH09 3/12/08 12:10 PM Page 186

Very high levels of child labor translate into very low levels of schoolenrollment. Only 28 percent of 6- to 9-year-olds, and a little more thanhalf of 10- to 14-year-olds, are enrolled in school. Nonentrance and lateentrance in school are both important concerns; 63 percent of childrenages 10–14 have no formal schooling, and many more from this age groupenter school after the official starting age of six. Those managing to enrollin school, however, tend to remain well into their teens. Indeed, childrenentering school do not leave, on average, until after their 19th birthdays.
Low enrollment is primarily a rural problem: enrollment for 6- to 14-year-olds in urban areas exceeds 80 percent, but only 30 percent of ruralchildren 6–14 are enrolled in school. Some 71 percent of rural 10- to14-year-olds have never entered school, compared with only 17 percentof their urban counterparts. Girls are disadvantaged compared withboys, with rural girls least likely to benefit from schooling opportunities.
What Kinds of Work Do Children Perform? The agriculture sector absorbs 80 percent of children involved in economicactivity. Just 12 percent work in services and 4 percent in manufacturing.More than 90 percent of working children work for their families withoutwages; just 2 percent work outside the family for wages.
Child Labor and Youth Employment in Ethiopia 187
Table 9.2. Work and School Activity of Ethiopian Children, by Age, Gender, and Urban-Rural Location
Gender Only in Only in Combining Neither in Age and work school work and school nor In work In schoolgroup location (1) (2) school (3) working (4) (1) + (3) (2) + (3)
5–9 Male 36.2 15.0 12.4 36.4 48.6 27.4Female 24.3 16.8 5.7 53.3 30.0 22.5Urban 2.0 67.4 3.1 27.5 5.1 70.5Rural 33.4 10.2 9.7 46.6 43.1 19.9Total 30.3 15.9 9.1 44.7 39.4 25.0
10–14 Male 37.6 22.0 36.2 4.2 73.8 58.2Female 34.8 29.1 17.5 18.5 52.4 46.7Urban 5.7 72.9 17.2 4.2 22.9 90.1Rural 41.5 17.3 28.8 12.4 70.4 46.1Total 36.3 25.5 27.1 11.1 63.4 52.6
5–14 Male 36.8 18.1 22.7 22.4 59.5 40.8Female 28.8 22.0 10.8 38.5 39.5 32.8Urban 3.9 70.3 10.6 15.2 14.5 80.9Rural 36.8 13.2 17.7 32.3 54.5 30.9Total 32.9 20.0 16.8 30.3 49.7 36.8
Source: Understanding Children’s Work calculations based on Ethiopia Labour Force Survey 2001.
WB62_YALM_CH09 3/12/08 12:10 PM Page 187

The composition of children’s work changes somewhat as they ageand are able to take on more complex tasks. Older children are slightlyless likely to work in agriculture and more likely to work in manufactur-ing and services. They are also slightly more likely to take on wage workand self-employment outside the family unit.
The composition of children’s work in urban and rural areas differs sig-nificantly, a reflection of underlying differences in rural and urban labormarkets. Virtually all rural child workers work in family-based agriculture.In contrast, in urban areas the service sector is the most important sourceof child work, accounting for 42 percent of urban child workers; agricultureranks second, accounting for 30 percent of urban child workers.Construction (including mining and quarrying; and electricity, gas, andwater) and manufacturing are also important in urban areas, with 17 per-cent of urban children working in construction and 11 percent working inmanufacturing. More than a third of child laborers work outside the familyin urban areas, compared with only 4 percent of their rural counterparts.
Labor Market Status of Young People in Ethiopia
This section describes the labor situation of young people in Ethiopia.
Time UseMost Ethiopians between the ages of 15 and 24 are working.Almost three-fourths of them are employed, while less than one-fifth are involved insome form of education or training.Another 5 percent are actively seekingwork but unable to find it.3 Some 13 percent of young people are “inac-tive,” that is, neither in the labor force nor in education, a category that alsoincludes discouraged workers and disabled people.4
These aggregates mask large variations in time use by age. This is notsurprising because the 15–24 age range is a period of transition from ado-lescence to adulthood and from education to working life. Relatively fewEthiopians remain in school past their teens. Young adults (ages 20–24)are more likely than teenagers (ages 15–19) to be in the labor force (bothemployed and unemployed), although the labor force participation rateof teenagers is also very high (more than 70 percent).5 Young adults aremore likely than teenagers to be inactive, owing in part to the fact thatyoung adulthood coincides with the beginning of childbearing for mostEthiopian women.
The time-use profiles of young Ethiopians are also strongly affected byunderlying differences in the rural and urban labor markets. Compared
188 Guarcello, Lyon, and Rosati
WB62_YALM_CH09 3/12/08 12:10 PM Page 188

with rural youth, urban youth stay in school longer and join the laborforce later. Involvement in education is more than three times higher forurban youth than for rural youth, while the employment rate of ruralyouth is almost twice that of their urban counterparts. Measured unem-ployment is much higher among urban youth, while underemploymentmay be more of a problem among rural youth.
UnemploymentUnemployment is the most important measure of the labor marketdifficulties of young people. Prolonged unemployment early in life maypermanently impair a person’s productive potential (and thereforeemployment opportunities), leading to serious social adjustment difficul-ties. In Sub-Saharan Africa, whether a young person has a job can oftendetermine on which side of the poverty line his or her household lays.6
Levels of measured unemployment are relatively low among youngpeople in Ethiopia: almost 5 percent of all 15- to 24-year-olds and over6 percent of those in the labor force are unemployed (see table 9.3).Levels of joblessness (the sum of unemployed and inactive), arguably
Child Labor and Youth Employment in Ethiopia 189
Table 9.3. Youth Unemployment, Inactivity, and Joblessness Indicators in Ethiopia,by Age Group, Gender, and Urban–Rural Location
Unemployment Unemploymentratioa rateb Inactivityc Joblessnessd
Item (percent) (percent) (percent) (percent)
Age range10–14 1.2 1.9 9.9 11.215–17 2.2 3.1 8.5 10.718–19 5.8 7.8 14.0 19.820–24 6.0 7.4 15.1 21.015–24 4.9 6.4 13.0 17.8
GenderMale 3.4 4.0 3.2 6.7Female 6.1 8.9 21.5 27.6
LocationUrban 9.7 18.6 11.7 21.4Rural 3.7 4.6 13.2 17.0
Source: Understanding Children’s Work calculations based on Ethiopia Labour Force Survey 2001.a. Unemployment ratio refers to total unemployed expressed as a proportion of total population in same agerange.b. Unemployment rate refers to total unemployed as a proportion of total work force in the same age range.c. Inactivity rate refers to people who neither attend school nor work nor are classified as unemployed, as a propor-tion of total population in same age range.d. Joblessness refers to total number of jobless people as a proportion of total population in same age range.
WB62_YALM_CH09 3/12/08 12:10 PM Page 189

a better measure of youth employment disadvantage because it alsocaptures discouraged workers, are higher.7 Some 18 percent of all 15- to24-year-olds and 28 percent of 15- to 24-year-old females are jobless.Unemployment and joblessness are lower for the 10–17 age group,perhaps indicating that youth who enter the labor market with higherlevels of human capital face more difficulties finding employment.These levels place Ethiopia in the middle range of countries in Sub-Saharan Africa (figure 9.4).
Young people in urban Ethiopia are much more likely to be unem-ployed than their rural counterparts, underscoring the different nature ofthe urban and rural economies, in particular the important role that theagriculture sector plays in absorbing young rural workers. High publicsector wages are a possible cause of unemployment among urban youngpeople. Differences in urban unemployment levels begin to emerge at age17 and peak at age 23, when 20 percent of urban youth are unable to findwork, compared with 3 percent of their rural counterparts (figure 9.5). Forthe 15–24 age group as a whole, urban residents are three times as likelyas rural residents to be unemployed.
While measured youth unemployment appears to be primarily an urbanphenomenon, data on hours worked suggest that youth underemploy-ment may be more prevalent in rural areas.8 Urban workers work morehours per week than rural workers for all age cohorts beyond age 15(though seasonality may explain some of the difference; figure 9.6).9
190 Guarcello, Lyon, and Rosati
Figure 9.4. The Unemployment Ratio and Rate of Joblessness among 15-to 24-Year-Olds in Ethiopia Are About Average for Sub-Saharan Africa
4.90
10
20
30
40
50
60
70
4.2 0.8
12.6 9.81.5
10.5 8.91.4
14.811.3
0.7
17.810.2
3.4
17.6
33.226.8
12
35.9
59.5
43.9
0.3
16.76
5.141.07
22.6916.8
3.9
33.5
12.5
6.2
40.6
26.5
1.5
22.8
11.4
22.5
31.2
Ethiop
ia
per
cen
t
Burkin
a Fa
so
Burun
di
Camer
oon
Côte
d'Ivo
ire
Gambia
, The
Kenya
Mad
agas
car
Mala
wi
Moz
ambiq
ue
Saõ To
mé
and
Princip
e
Ugand
a
Zambia
unemployment ratio joblessness unemployment rate
Source: Understanding Children’s Work calculations based on World Bank Standard Files and Standard Indicators(SFSI) Database.
WB62_YALM_CH09 3/12/08 12:10 PM Page 190

Child Labor and Youth Employment in Ethiopia 191
Figure 9.6. Urban Workers in Ethiopia Work Many More Hours per Week Than Rural Workers
urban rural
20
age range
25
30
35
40
45
10–14 15–19 20–24 25–29 30–34 35–39 40–44 45–49 50–54 55–59 60–64 65+
ho
urs
wo
rked
in t
he
last
7 d
ays
Source: Understanding Children’s Work calculations based on Ethiopia Labour Force Survey 2001.
Figure 9.5. Youth Unemployment Ratios in Ethiopia Are Much Higher in Urban Thanin Rural Areas
0
5
10
15
20
15 16 17 18 19 20 21 22 23 24age in years
per
cen
t
urban rural
Source: Understanding Children’s Work calculations based on Ethiopia Labour Force Survey 2001.
The correlation between age and employment appears to depend onlocation. In cities and towns the risk of unemployment rises sharply asyouth grow older, while in rural areas unemployment varies little by age.
Unemployment indicators differ by gender. Across all ages, femaleyouth are more likely to be unemployed and much more likely to be job-less than male youth (table 9.3). Females are also significantly overrep-resented among inactive young people, a category that includes people
WB62_YALM_CH09 3/12/08 12:10 PM Page 191

performing household chores and other forms of noneconomic worktypically assigned to females.10
The 2001 Ethiopia Labour Force Survey does not provide data on theduration of unemployment. Evidence from the 2003 Urban BiannualEmployment Unemployment Survey (CSA 2003) suggests that much ofurban youth unemployment is structural rather than transitory.About one-third of unemployed teenagers and almost half of unemployed youngadults had been without a job for at least a year at the time of the 2003 sur-vey (figure 9.7). Even more worrisome is that the share of youth with verylong spells of unemployment (more than two years) increases with age.
Unemployment and jobless rates do not fully capture youth difficul-ties in the labor market. In fact, in countries such as Ethiopia, wherepoverty is widespread, the unemployment rate may be misleadingbecause many youth are simply too poor to be unemployed and musttake up work regardless of its quality, decency, or level of remuneration.Obtaining employment itself is therefore an insufficient condition forsuccessful entry into the labor market; indicators reflecting the conditionsof the employed are also critical to assessing the labor market success ofyoung people.
Nonwage labor performed within the household is by far the mostimportant form of youth work: more than two of every three employedyoung people work without monetary wages for their families (table 9.4).
192 Guarcello, Lyon, and Rosati
Figure 9.7. The Duration of Urban Unemployment in Ethiopia Is a Cause for Concern
42
29
33
25
181718
22
1614
28
31
0
5
10
15
20
25
30
35
40
45
unemployedteenagers
unemployed youngadults
all unemployed
per
cen
t
1–6 months 7–12 months
1–2 years more than 2 years
Source: 2003 Urban Biannual Employment Unemployment Survey, as cited in Denu, Tekeste, and van der Deijl(2005).
WB62_YALM_CH09 3/12/08 12:10 PM Page 192

Tab
le 9
.4. W
ork
Mod
alit
y, S
ecto
r of E
mp
loym
ent,
an
d A
vera
ge
Wee
kly
Hou
rs o
f Em
plo
yed
Eth
iop
ian
You
th
Aver
age
Wor
k m
odal
itya
wee
kly
Age
Sex
and
Dom
estic
Wag
e Se
lf-U
npai
dO
ther
Sect
orb
wor
king
grou
pre
side
nce
empl
oyee
empl
oyee
empl
oyed
fam
ily w
orke
rem
ploy
men
tAg
ricul
ture
Man
ufac
turin
gSe
rvic
esc
Oth
erd
hour
s
5–14
Mal
e0.
33.
21.
494
.80.
396
.80.
42.
30.
536
.1Fe
mal
e1.
00.
92.
495
.20.
689
.62.
65.
72.
129
.4U
rban
9.6
5.3
14.5
63.9
6.6
30.2
10.5
42.3
17.0
26.7
Rura
l0.
32.
21.
396
.00.
296
.20.
92.
30.
633
.815
–19
Mal
e0.
78.
78.
681
.00.
989
.91.
76.
61.
731
.6Fe
mal
e4.
63.
812
.578
.20.
972
.46.
615
.75.
425
.0U
rban
17.8
15.8
26.9
34.7
4.7
15.4
15.4
46.4
22.7
36.0
Rura
l0.
75.
48.
485
.00.
589
.82.
66.
51.
127
.8To
tal
2.5
6.5
10.3
79.8
0.9
82.0
3.9
10.7
3.4
28.6
20–2
4 M
ale
0.5
11.7
38.9
48.4
0.4
86.5
2.2
9.0
2.3
32.6
Fem
ale
2.7
6.3
23.6
67.0
0.4
74.1
5.6
16.8
3.5
25.8
Urb
an11
.435
.235
.816
.01.
68.
916
.856
.817
.527
.6Ru
ral
0.3
5.7
31.0
62.8
0.2
90.3
2.1
6.8
0.9
43.0
Tota
l1.
69.
231
.657
.30.
480
.63.
812
.72.
929
.315
–24
Mal
e0.
610
.122
.765
.90.
788
.31.
97.
72.
032
.0Fe
mal
e3.
75.
017
.972
.70.
673
.36.
116
.24.
425
.4U
rban
14.6
25.7
31.4
25.1
3.1
12.0
16.1
51.8
20.1
39.5
Rura
l0.
55.
519
.174
.50.
390
.02.
36.
71.
027
.7To
tal
2.1
7.8
20.5
69.1
0.7
81.4
3.8
11.7
3.1
29.0
Sour
ce:U
nder
stan
ding
Chi
ldre
n’s W
ork
calc
ulat
ions
bas
ed o
n Et
hiop
ia L
abou
r For
ce S
urve
y 20
01.
a. P
erce
ntag
e di
strib
utio
n of
em
ploy
ed p
opul
atio
n in
eac
h ag
e gr
oup.
b.
Per
cent
age
dist
ribut
ion
of e
mpl
oyed
pop
ulat
ion
in e
ach
age
grou
p. S
ecto
r bre
akdo
wn
base
d on
ISIC
Rev
ision
3 if
info
rmat
ion
is av
aila
ble.
c. S
ervi
ces
incl
ude
who
lesa
le a
nd re
tail
trad
e, h
otel
s an
d re
stau
rant
s, tr
ansp
ort,
finan
cial
inte
rmed
iatio
n, re
al e
stat
e, p
ublic
adm
inist
ratio
n, e
duca
tion,
hea
lth a
nd s
ocia
l wor
k, o
ther
com
mun
ity s
ervi
ces,
and
priv
ate
hous
ehol
d se
rvic
es.
d. O
ther
incl
udes
min
ing
and
quar
ryin
g; e
lect
ricity
, gas
, and
wat
er; c
onst
ruct
ion;
and
ext
rate
rrito
rial o
rgan
izat
ion.
193
WB62_YALM_CH09 3/12/08 12:10 PM Page 193

Of the remaining working youth, 21 percent are self-employed11; just8 percent work for wages.12 Hence, most youth seem to be engaged innonpaying (or low-paying) activities. These aggregates mask large differ-ences between the rural and urban youth labor markets. Unpaid familywork is preponderate in rural areas, while domestic employment, wageemployment, self-employment, and unpaid family work prevail in urbanareas. The agricultural sector absorbs most of Ethiopia’s labor force,including workers ages 15–24. About 81 percent of employed youth areengaged in agriculture, followed by 12 percent in services and 4 percentin manufacturing. Differences by location are large (table 9.4). While agri-culture predominates in rural areas, the services sector is the most impor-tant source of youth employment in cities and towns, accounting for halfof all employed youth. The construction and manufacturing sectors arealso important in urban areas, accounting for 20 percent and 16 percent,respectively, of total employed youth. The modality and composition ofemployment vary somewhat by the age and gender of the worker. Withage, there is a shift away from family-based nonwage work toward wagework and self-employment outside the family. Nonwage family worknonetheless still accounts for more than half of total employment for the20–24 age group. The sectoral composition of work changes little movingacross the 15–24 age spectrum. There appears to be a significant degreeof employment specialization by gender. Compared with male youth,female youth are less likely to be in wage work and more likely to be inunpaid family work; they are less concentrated in the agricultural sectorand more concentrated in the services and manufacturing sectors.
What do these breakdowns by employment modality and composi-tion say about employment quality? The generally low level of wageemployment is significant, given that wage employment is typically themost sought after form of work among young people and is most likelyto offer a measure of job stability and provide some form of benefits.Informal farm work, by contrast, is typically low paid and seasonal, andit does not constitute a reliable route out of poverty. In urban areas,informal work frequently means insecure, nonfamily work in settingswhere labor and safety regulations do not apply, leaving workers suscep-tible to work place exploitation. According to the 2003 Urban BiannualEmployment Unemployment Survey, more than half of employed urbanyouth are in the informal sector.13
Labor Market DisadvantageComparing youth and adult unemployment rates provides some indicationof the extent to which young workers are disadvantaged relative to adults
194 Guarcello, Lyon, and Rosati
WB62_YALM_CH09 3/12/08 12:10 PM Page 194

in securing jobs. Youth are more likely than adults to be unemployed, butunemployment (expressed as a percentage of either the population or thelabor force) is relatively low for both groups (figure 9.8). The differencebetween youth and adult unemployment levels is not large in comparisonwith other countries in Sub-Saharan Africa (table 9.5).
The picture changes somewhat when rural and urban labor markets areexamined separately (figure 9.9). Rural youth appear to encounter littledifficulty in securing employment; rural unemployment is very low andvaries little across the 15–55 age spectrum. This is not the case for youthliving in cities and towns.The urban unemployment ratio peaks among 20-to 24-year-olds but remains very high among the next population cohort
Child Labor and Youth Employment in Ethiopia 195
Table 9.5. Ratio of Youth to Adult Unemployment Rates in Selected Sub-SaharanAfrican Countries
Country Total Urban Rural
Ethiopia 1.4 1.7 1.4Burkina Faso 2.5 3.4 1.9Burundi 0.9 3.3 0.3Cameroon 5.1 4.0 15.7Côte d’Ivoire 1.9 1.6 4.6Gambia, The 0.4 0.7 0.5Kenya 3.9 3.7 3.9Madagascar 1.5 2.2 1.3Malawi 2.3 5.0 2.1Mozambique 3.0 2.4 3.6São Tomé and Principe 5.9 5.0 6.9Uganda 1.1 2.2 2.1Zambia 2.9 3.7 2.5
Source: Understanding Children’s Work calculations based on Ethiopia Labour Force Survey 2001 and World BankStandard Files and Standard Indicators data sets.
Figure 9.8. Youth Have Weaker Labor Indicators Than Adults in Ethiopia, but Unemployment among Both Groups Is Low
76.0 71.2
84.9 81.1
4.817.8
6.413.018.6
4.414.9
3.80
20
40
80
60
100
in laborforce
employed unemployed inactive jobless unemploymentrate
per
cen
t
youth (15–24 years) adults (25–55 years)
Source: Understanding Children’s Work calculations based on Ethiopia Labour Force Survey 2001.
WB62_YALM_CH09 3/12/08 12:10 PM Page 195

196 Guarcello, Lyon, and Rosati
(ages 25–29) before falling sharply thereafter. In many cases the periodrequired to settle into work extends well into adulthood.
Differences in youth and adult work characteristics also provide anindication of youth labor market disadvantage. The sectoral compositionof youth and adult employment differs in urban but not in rural areas. Inurban areas, compared to youth, adult workers are more likely to workin family farming and construction and less likely to work in services. Inboth rural and urban areas, young workers are much more concentratedin unpaid work and less concentrated in self-employment than adults.Urban young people are much less likely to secure wage employmentthan adults; about the same proportion of adults and youth work in theinformal sector (CSA 2003).
Young people in urban areas of Ethiopia face a significant labor marketdisadvantage. Their unemployment and jobless rates are much higher thanthose of adults, and they are only half as likely as adult workers to be inwage employment. The disadvantaged position of youth in the labor mar-ket can be associated with, or even the result of, a difficult or inefficienttransition from school to the labor market.
The next section looks at this issue by constructing an indicator of theduration of the school-to-work transition. As will be apparent later, sucha measure is not able to indicate precisely where the problem lays, but itis a first and necessary step toward understanding the process by whichyoung people make the transition to working life.
Transition to Working Life
The transition to work can take two routes: through the schooling systemor directly from inactivity (or informal schooling) to the labor force. This
Figure 9.9. The Unemployment Ratio among Ethiopian Adults of All Ages Is Higher inUrban Than in Rural Areas
per
cen
tag
e
urban rural
0
5
10
15
20
10–14 15–19 20–24 25–29 30–34 35–39 40–44 45–49 50–54 55–59 60–64 65+age in years
Source: Understanding Children’s Work calculations based on Ethiopia Labour Force Survey 2001.
WB62_YALM_CH09 3/12/08 12:10 PM Page 196

section examines both routes to identify vulnerable groups and targets forpolicies. It uses a synthetic indicator to provide an overview of the routesyoung people take from education to the labor force.14 For the grouptransitioning directly to the labor force, it examines the average age ofentry into the labor market.
A substantial number of children drop out of school very early. Whilethey are formally included in the youth transitioning through school,their condition and the problems they face are likely to be closer to thoseof children who never attended school.
The School-to-Work TransitionThe average school-leaving age (that is, the starting point of the transition)in Ethiopia is high compared with other countries in Sub-Saharan Africa(figure 9.10). Most children entering school stay there well beyond thebasic cycle. To the extent that schooling is an indicator of human capitallevels and labor market preparedness, Ethiopians leave the schooling sys-tem seemingly well-equipped for the transition to working life.15
A number of caveats apply to this conclusion. First, as emphasizedbelow, not all young people transition through school. Second, a givenschool-leaving age is likely to be associated with lower human capitalaccumulation in less developed countries, as a result of frequent delayed
Child Labor and Youth Employment in Ethiopia 197
Figure 9.10. Ethiopian Youth Begin the Transition from School to Work Later ThanYouth in Other Countries in Sub-Saharan Africa
17.5
17.4
17.7
18.0
17.1
18.8
19.0
17.4
17.2
18.8
16.7
15.9
19.4
15 16 17 18 19 20 21 22 23 24 25
Burkina Faso
Burundi
Cameroon
Côte d’Ivoire
Gambia, The
Kenya
Madagascar
Malawi
Mozambique
São Tomé and Principe
Uganda
Zambia
Ethiopia
age in years
Source: Understanding Children’s Work calculations based on Ethiopia Labour Force Survey 2001 and World BankStandard Files and Standard Indicators data sets.
WB62_YALM_CH09 3/12/08 12:10 PM Page 197

entry into school, intermittent attendance, grade repetition, and poorschool quality and relevance.
The relatively high school-leaving age in Ethiopia is noteworthy, par-ticularly against the backdrop of a low overall school enrollment rate(table 9.6). The late average leaving age among youth who ever attendedschool (19.4 years) underscores the importance of the selection processassociated with initial enrollment: those children with the opportunityto get into school in the first place tend to stay there almost to the endof their teens (figure 9.11).
The characteristics of the transition appear to depend significantly ongender, on place of residence, and on the interaction between the two(figure 9.12). Four patterns are evident:
• Male youth stay in school longer than female youth in both urban andrural areas.
• The transition starts later in urban than in rural areas for both malesand females.
• Male and female youth in rural areas find employment more quicklythan their counterparts in urban areas.
• Female youth find employment more quickly than male youth in ruralareas. In urban areas the opposite holds true.
198 Guarcello, Lyon, and Rosati
Table 9.6. School-to-Work Transition Points in Ethiopia, by Gender and Urban-Rural Location
Children never Children ever in school in school
Beginning point of End point of transition Average age oftransition average age of Transition entering into
(average age of (entering into work duration work for theItem school leaving) for the first time) (years) first time
Total 19.4 23.4 4.0 8.0Male 19.6 23.9 4.3 8.1Female 19.1 21.5 2.4 7.5
LocationUrban 19.3 23.4 4.1 9.5Rural 18.9 23.6 4.7 8.0Male urban 20.0 23.8 3.8 9.5Female urban 18.8 23.8 5.0 9.5Male rural 19.0 21.8 2.8 8.2Female rural 17.5 19.5 2.0 7.0
Source: Understanding Children’s Work calculations based on Ethiopia Labour Force Survey 2000, except “Childrennever in school”data are from Ethiopia Labour Force Survey 2000.
WB62_YALM_CH09 3/12/08 12:10 PM Page 198

The synthetic indicator does not permit conclusions to be drawnabout the “efficiency” or “success” of the transition in specific countrycontexts. A better understanding of the transition period would requireintegrating the analysis of optimal school-leaving age with the analysis ofemployment search and labor force participation. Nonetheless, the syn-thetic indicator does reveal two important features of the transition in
Child Labor and Youth Employment in Ethiopia 199
Figure 9.11. Ethiopian Children Who Start School Tend to Remain in School throughTheir Teens
19.020.629.2
35.440.3
55.7
69.5
85.481.590.4
94.593.796.996.297.4
45.7 44.7 46.0 47.1 46.8 45.736.4 39.1
29.722.0
14.2
11.0 11.0 8.0 7.4
100
102030405060708090
100110120
11 12 13 14 15 16 17 18 19 20 21 22 23 24age in years
per
cen
t
school enrollment
as percentage of children ever in schoolas percentage of all children
average school-leavingage
Source: Understanding Children’s Work calculations based on Ethiopia Labour Force Survey 2001.
Figure 9.12. Gender and Location Affect the Duration and Timing of the Transitionfrom School to Work in Ethiopia
Source: Understanding Children’s Work calculations based on Ethiopia Labour Force Survey 2000.
20.0
18.8
19.0
17.5
23.8
23.8
21.8
19.5
17 18 19 20 21 22 23 24 25
male, urban
female, urban
male, rural
female, rural
age in years
WB62_YALM_CH09 3/12/08 12:10 PM Page 199

Ethiopia that fit within this more detailed analysis: the relatively latestarting age of the transition and its long average duration (four years).
An initial period of unemployment following schooling is not unusual,because young people spend time looking for the best job match. InEthiopia, however, the length of this jobless period extends well beyondwhat could plausibly be considered “wait” unemployment. Because longperiods of initial joblessness can translate into permanently reduced pro-ductive potential and job prospects, this problem constitutes an importantpolicy concern.
Transitions Directly to WorkThe majority of 15- to 24-year-old Ethiopians never enter school, transi-tioning directly from inactivity to the labor force. Among these people,the average child begins work at age eight, much earlier than in otherSub-Saharan Africa countries (figure 9.13). Rural school nonentrantssecure employment earliest, though rural-urban differences in startingage are not large (see table 9.6).
Child Labor, Human Capital, and Youth Labor Market Outcomes
This section examines the consequences of child labor for human capital—and thus for the labor market.
200 Guarcello, Lyon, and Rosati
Figure 9.13. Ethiopian Children Begin Work Much Earlier Than Children in Other Countries in Sub-Saharan Africa
8.0 8.4
10.211.2 11.5 11.3
14.8
12.7
17.116.3
13.814.5
56789
101112131415161718
Ethiop
ia
age
in y
ears
Bur
kina
Faso
Burun
di
Camer
oon
Côte
d’Ivo
ire
Gambia
, The
Kenya
Mala
wi
Moz
ambiq
ue
São To
mé
and
Princip
e
Ugand
a
Zambia
Source: Understanding Children’s Work calculations based on World Bank Standard Files and Standard Indicators(SFSI) datasets.
WB62_YALM_CH09 3/12/08 12:10 PM Page 200

Child Labor and Youth Employment in Ethiopia 201
Figure 9.14. Employment Rates among Ethiopians Ages 20–24 Decrease with Education, and Unemployment Rates Increase
64.773.6
78.085.6
employment
per
cen
t
unemployment
78.1
0102030405060708090
100
4.2 4.97.9
12.7
22.7
no sc
hooli
ng
prim
ary o
r les
s
lower
seco
ndar
y not
com
plete
d
lower
seco
ndar
y com
plete
d
highe
r edu
catio
n
no sc
hooli
ng
prim
ary o
r les
s
lower
seco
ndar
y not
com
plete
d
lower
seco
ndar
y com
plete
d
highe
r edu
catio
n
per
cen
t
0
4
8
12
16
20
24
28
Source: Understanding Children’s Work calculations based on Ethiopia Labour Force Survey 2001.
Educational Attainment Most young people in Ethiopia have had very little opportunity toacquire human capital. More than 8.3 million 15- to 24-year-olds(three-quarters of this age group) possess only a primary education orless; 6.6 million of these people possess no formal education at all.Limited formal education is much more common in rural areas than inurban areas, and it is more common among young adults (ages 20–24)than among teenagers (ages 15–19), indicating progress over time inexpanding access to basic level schooling.
These school nonentrants and early leavers are a serious policy concern,because they are especially vulnerable to undesirable transition outcomes.As children, school nonentrants are among the groups most vulnerable tochild labor, underscoring that the issue of finding satisfactory employmentas adults cannot be separated from the issue of child labor.16
Human Capital Levels and Labor Force Status: Descriptive EvidenceThe rate of unemployment increases with education level, peaking amongthose with higher education (figure 9.14). This partially reflects the factthat less-educated young people begin their transition to work at an ear-lier age and therefore have had longer exposure to the labor market andmore time to secure employment. In addition, because the reservationwage is likely to rise with skill level, search time may increase with the
WB62_YALM_CH09 3/12/08 12:10 PM Page 201

202 Guarcello, Lyon, and Rosati
level of human capital. This finding itself, therefore, says little about linksbetween human capital levels and success in the labor market.
Educational attainment appears to have a positive influence on thetype of employment (table 9.7). More-educated workers are much morelikely to be in wage employment and much less likely to be in unpaidwork than their less-educated counterparts (figure 9.15).
Human Capital Levels and Labor Force Status:Econometric AnalysisThis section examines the determinants of youth employment, payingspecial attention to the role of the stock of human capital with whichyouth enter the labor market and to local labor market conditions. Youthwho enter the labor market with little or no education are more likelyto be employed than youth with more education. Whether this is dueto human capital or earlier entry in the labor market is impossible todetermine, however. In view of this problem, we try to identify whetherthe effects of the explanatory variables considered vary with the levelof education. While this approach does not directly indicate the pos-sible effect of human capital on employability, it may provide someindirect evidence.
The sample is divided into five groups: never attended school, primaryschool or less, some lower secondary school, completed lower secondaryschool, and at least some higher education (including higher secondary).Separate regressions are run on the employment probability on each ofthese subsamples, using the explanatory variables described below. Theobvious problem of sample selection is exacerbated here by the fact thatthe choice subsuming the selection is not generated by a bivariate normal.One way to deal with this issue would be to estimate a selection modeland follow a generalized Heckman procedure. However, there is growingevidence (consistent with current empirical practice) that once majorobservable characteristics are taken into account, estimates of interestoften do not change with respect to the naive model. Moreover, there aretwo potential costs to estimating the selection model. First, the bias inthe coefficients can sometimes be worse than in the naive model. Second,the coefficients in the selection model can be much less precisely estimated,especially if the instruments are weak.
For these reasons, both simple probit equations and selection modelsare estimated here. The data sets do not offer a wide choice of instru-ments, so household structure (number of adults and of siblings) wasused to identify the selection (school grade) equation.17 The focus is on
WB62_YALM_CH09 3/12/08 12:10 PM Page 202

203
Tab
le 9
.7. E
mp
loym
ent S
tatu
s an
d E
mp
loym
ent M
odal
ity
of E
thio
pia
ns
Not
in S
choo
l, b
y Ed
ucat
ion
al A
ttai
nm
ent a
nd
Ag
e G
roup
(per
cent
)
Age
grou
p an
d hi
ghes
t ed
ucat
ion
Dom
estic
U
npai
d fa
mily
leve
l att
aine
dEm
ploy
edU
nem
ploy
edIn
activ
eem
ploy
eeW
age
empl
oyee
Self-
empl
oyed
wor
ker
Oth
er
20–2
4N
o sc
hool
ing
78.1
4.2
17.7
1.4
5.1
30.1
63.2
0.2
Prim
ary
or le
ss85
.64.
99.
52.
17.
836
.353
.30.
5Lo
wer
sec
onda
ry n
ot c
ompl
eted
78.0
7.9
14.0
2.2
10.0
38.5
49.0
0.3
Low
er s
econ
dary
com
plet
ed73
.612
.713
.71.
418
.934
.843
.21.
7H
ighe
r edu
catio
n64
.722
.712
.61.
551
.825
.619
.21.
9
25–5
5N
o sc
hool
ing
79.6
3.3
17.1
0.5
4.0
60.4
35.0
0.2
Prim
ary
or le
ss89
.42.
38.
20.
87.
777
.813
.40.
4Lo
wer
sec
onda
ry n
ot c
ompl
eted
86.0
4.6
9.5
1.0
13.5
73.8
11.1
0.6
Low
er s
econ
dary
com
plet
ed83
.86.
69.
60.
716
.467
.714
.40.
9H
ighe
r edu
catio
n82
.59.
58.
00.
961
.332
.25.
10.
6
Sour
ce: U
nder
stan
ding
Chi
ldre
n’s W
ork
calc
ulat
ions
bas
ed o
n Et
hiop
ia L
abou
r For
ce S
urve
y 20
01.
a. P
erce
ntag
e di
strib
utio
n of
em
ploy
ed p
opul
atio
n in
eac
h ag
e gr
oup.
b.
Per
cent
age
dist
ribut
ion
of e
mpl
oyed
pop
ulat
ion
in e
ach
age
grou
p. S
ecto
r bre
akdo
wn
is ba
sed
on U
N In
tern
atio
nal S
tand
ard
Indu
stria
l Cla
ssifi
catio
n Re
visio
n 3
if in
form
atio
n is
avai
labl
e.
Empl
oym
ent s
tatu
saEm
ploy
men
t mod
ality
b
WB62_YALM_CH09 3/12/08 12:10 PM Page 203

the probit estimates, for reasons mentioned above and because the selec-tion terms in the generalized Heckman model are not significant.
The 2000 Ethiopia Labour Force Survey does not contain a large amountof information. In fact, only a few variables relevant to the analysis ofemployment are included. The level of expenditure of the household,household size, and home ownership (as a proxy for household wealth)are used here. Because the data for household expenditures are availableonly in categories and do not allow per capita expenditures to be com-puted, household size is used to control for the number of householdmembers. The information is obviously very scant, so these results mustbe interpreted with caution.
To eliminate possible biases in the results from the fact that someyouth do not live with their parent (or extended family), models wereestimated including and excluding youth who do not live at home. Theresults do not show any significant difference.
To better reflect the large differences between rural and urban settingsin Ethiopia, all equations are estimated separately for rural and urbanareas. The effects of local labor market conditions on the probability ofbeing employed are proxied by two variables that should be related to thesupply and demand sides of the market. As an indicator of the conditionof demand, we used the adult (ages 25–55) employment-to-populationratio. To proxy the supply side, we used the proportion of youth (ages15–24) in the working-age population.
Defining the relevant local labor market is difficult empirically.Several different approaches were followed. First, the local labor marketas defined at the administrative regional level was identified, computing
204 Guarcello, Lyon, and Rosati
Figure 9.15. The Higher Their Level of Education, the More Likely Ethiopians Ages20–24 Are to Work in Wage Employment
wage employment unpaid family employment
per
cen
t
0102030405060708090
100
per
cen
t
0102030405060708090
10091.6
2.9
23.3
43.249.053.341.9
18.910.07.8
prim
ary o
r les
s
lower
seco
ndar
y not
com
plete
d
lower
seco
ndar
y com
plete
d
uppe
r sec
onda
ry
highe
r edu
catio
n
prim
ary o
r les
s
lower
seco
ndar
y not
com
plete
d
lower
seco
ndar
y com
plete
d
uppe
r sec
onda
ry
highe
r edu
catio
n
Source: Understanding Children’s Work calculations based on Ethiopia Labour Force Survey 2001.
WB62_YALM_CH09 3/12/08 12:10 PM Page 204
all indicators for the 11 regions of Ethiopia. Anecdotal evidence of migra-tion and labor market flows and discussion with labor market experts ledto the conclusion that the smaller administrative unit (that is, the zone)covers too limited an area to define a local labor market. However, if itis reasonable to assume that flows of work can occur within the rural andurban areas of the same region, it is also true that the integration of ruraland urban labor markets may be far from perfect, especially in the shortto medium run (as a result of the cost of migration, difficulties commut-ing, lack of information, and the like). For this reason, the indicators forlocal labor markets were also computed separately for rural and urbanareas of each region.
We tried to exploit the information available on internal migration toidentify local labor markets. Obviously, administrative boundaries arenot adequate confines for an area’s economy. A local economy and itslabor market should be defined on the basis of the interrelationshipsbetween buyers and sellers of labor. The only information available inthis respect is the flow of migrants across administrative zones. Usingthis information, a two-way flow matrix was built, and normalized andmade symmetric. Each cell of the matrix reflects the gross flow ofmigration between (to and from) a few zones.18 The application to thismatrix of hierarchical cluster analysis helped identify groups of zonesthat are clustered together and hence can be defined as constituting alocal labor market. This kind of methodology involves a substantialdegree of value judgment because there are no general criteria for fix-ing the threshold for the intensity of exchanges that define the locallabor markets.
Estimation Results This section presents the results for the probit estimates of the proba-bility of employment by level of education, with the standard errorscorrected for clustering. As expected, the results show large differencesbetween urban and rural areas and across levels of education (tables 9.8and 9.9). In urban areas, the probability of being employed increaseswith age only for youth with no education or less than primary educa-tion. This could indicate that less-educated youth face fewer difficultiesfinding employment, although the result may be biased by the fact thatthere is too little variation in exposure to job searching for youth withmore than primary education.
Gender effects are large: the probability of a female being employedis 14–22 percent lower than that of a male. The gender bias in employ-ment is weaker for the less-educated and for the most-educated youth.
Child Labor and Youth Employment in Ethiopia 205
WB62_YALM_CH09 3/12/08 12:10 PM Page 205

206
Tab
le 9
.8. P
rob
abili
ty o
f Em
plo
ymen
t am
ong
Eth
iop
ian
s A
ges
10–
24: P
rob
it E
stim
ates
Usi
ng
Reg
ionw
ide
Def
init
ion
of L
ocal
Lab
or M
arke
t
Nev
er a
tten
ded
Not
com
plet
ed
Low
er s
econ
dary
scho
olPr
imar
y o
r les
slo
wer
sec
onda
ryco
mpl
eted
Hig
her e
duca
tion
Varia
ble
dy/d
xz
dy/d
xz
dy/d
xz
dy/d
xz
dy/d
xz
Urb
anAg
e0.
1409
6.51
0.06
221.
97–0
.018
4–0
.38
0.16
321.
39–0
.079
1–0
.64
Age
squ
ared
–0.0
038
–6.0
8–0
.001
8–1
.90.
0003
0.25
–0.0
041
–1.4
50.
0022
0.75
Fem
ale*
–0.1
493
–3.6
2–0
.203
6–4
.08
–0.2
224
–5.8
–0.1
818
–4.2
1–0
.141
1–1
0.73
Hou
seho
ld s
ize
–0.0
040
–0.9
3–0
.010
5–1
.73
–0.0
103
–1.9
40.
0069
1.04
–0.0
097
–2.8
5H
omeo
wne
r*–0
.004
9–0
.19
0.04
760.
910.
0025
0.09
0.02
270.
910.
0065
0.39
Expe
nditu
re q
uint
ile 1
*–0
.383
4–4
.51
–0.4
583
–7.1
7–0
.269
3–3
.56
–0.0
785
–0.9
7–0
.137
7–1
.78
Expe
nditu
re q
uint
ile 2
*–0
.380
1–5
.49
–0.3
963
–8.3
2–0
.220
7–3
.92
–0.0
041
–0.0
5–0
.072
7–1
.62
Expe
nditu
re q
uint
ile 3
*–0
.194
5–2
.11
–0.3
244
–5.6
3–0
.235
7–3
.73
–0.0
533
–0.6
–0.0
672
–1.8
7Ex
pend
iture
qui
ntile
4*
–0.0
671
–0.9
1–0
.217
8–4
.35
–0.0
987
–1.4
0.10
101.
13–0
.071
1–1
.14
Loca
l lab
or m
arke
t ind
icat
orAd
ult e
mpl
oym
ent r
atio
2.34
182.
711.
3490
5.4
1.36
977.
261.
7341
4.69
1.02
342.
83Sh
are
of p
opul
atio
n–5
.208
8–2
.53
–3.0
692
–5.2
4–1
.652
8–2
.28
–1.9
929
–2.4
30.
4631
0.48
WB62_YALM_CH09 3/12/08 12:10 PM Page 206

207
Rura
lAg
e0.
0314
2.74
0.02
902.
380.
0649
1.57
–0.2
079
–1.3
0.06
970.
26Ag
e sq
uare
d–0
.000
8–2
.65
–0.0
007
–2.1
3–0
.001
7–1
.60.
0052
1.25
–0.0
009
–0.1
4Fe
mal
e*–0
.251
3–1
5.32
–0.2
041
–7.5
4–0
.178
3–5
.3–0
.128
4–2
.63
–0.1
642
–2.5
6H
ouse
hold
siz
e0.
0006
0.29
0.00
030.
110.
0005
0.16
0.00
440.
58–0
.001
6–0
.26
Hom
eow
ner*
0.06
361.
630.
0282
0.82
0.13
452.
450.
1457
2.19
–0.0
515
–0.6
5
Hou
seho
ld e
xpen
dit
ure
qui
ntile
(ref
eren
ce g
roup
: top
qui
ntile
)Ex
pend
iture
qui
ntile
1*
–0.0
349
–0.2
2–0
.082
9–0
.99
–0.0
650
–1.0
8–0
.181
4–2
.40.
1865
11.2
Expe
nditu
re q
uint
ile 2
*–0
.033
1–0
.22
–0.0
766
–1.2
3–0
.089
3–1
.55
–0.0
206
–0.6
90.
3717
7.94
Expe
nditu
re q
uint
ile 3
*0.
0003
0–0
.052
8–0
.63
–0.1
340
–1.1
7–0
.035
8–0
.87
0.16
064.
53Ex
pend
iture
qui
ntile
4*
0.00
600.
050.
1689
5.8
Loca
l lab
or m
arke
t ind
icat
orAd
ult e
mpl
oym
ent r
atio
0.64
002.
140.
3376
2.33
0.45
332.
531.
4439
4.88
0.22
420.
52Sh
are
of p
opul
atio
n0.
8467
1.25
0.45
901.
12–0
.261
4–0
.79
–1.7
349
–2.1
60.
8189
0.61
Sour
ce:U
nder
stan
ding
Chi
ldre
n’s W
ork
calc
ulat
ions
bas
ed o
n Et
hiop
ia L
abou
r For
ce S
urve
y 20
01.
*dy/
dx is
for d
iscre
te c
hang
e of
dum
my
varia
ble
from
0 to
1.
WB62_YALM_CH09 3/12/08 12:10 PM Page 207

208
Tab
le 9
.9. P
rob
abili
ty o
f Em
plo
ymen
t am
ong
Rur
al a
nd
Urb
an E
thio
pia
ns
Ag
es 1
0–24
, by
Leve
l of E
duc
atio
n: P
rob
it E
stim
ates
Ob
tain
ed
Usi
ng
Ind
icat
ors
of L
ocal
Lab
or M
arke
t Sep
arat
ed fo
r Rur
al a
nd
Urb
an A
reas
Not
com
plet
ed
Low
er s
econ
dary
Nev
er a
tten
ded
scho
olPr
imar
y or
less
low
er s
econ
dary
com
plet
edH
ighe
r edu
catio
n
Varia
ble
dy/d
xz
dy/d
xz
dy/d
xz
dy/d
xz
dy/d
xz
Urb
anAg
e0.
141
6.5
0.06
11.
89–0
.021
–0.4
40.
158
1.33
–0.0
75–0
.6Ag
e sq
uare
d–0
.004
–6.0
5–0
.002
–1.8
10.
000
0.3
–0.0
04–1
.40.
002
0.72
Fem
ale*
–0.1
55–3
.88
–0.2
05–4
.08
–0.2
25–5
.83
–0.1
82–4
.24
–0.1
42–1
1.02
Hou
seho
ld s
ize
–0.0
01–0
.3–0
.009
–1.5
3–0
.010
–2.0
70.
007
1.03
–0.0
11–2
.65
Hom
eow
ner*
–0.0
09–0
.43
0.04
40.
83–0
.001
–0.0
30.
023
0.88
0.00
70.
4
Hou
seho
ld e
xpen
dit
ure
qui
ntile
(ref
eren
ce g
roup
: top
qui
ntile
)Ex
pend
iture
qui
ntile
1*
–0.4
01–4
.31
–0.4
57–7
.1–0
.274
–3.5
8–0
.066
–0.7
9–0
.144
–1.8
3Ex
pend
iture
qui
ntile
2*
–0.3
96–5
.21
–0.3
95–8
.19
–0.2
23–3
.96
0.00
60.
07–0
.080
–1.7
8Ex
pend
iture
qui
ntile
3*
–0.2
15–2
.13
–0.3
29–5
.49
–0.2
39–3
.84
–0.0
46–0
.53
–0.0
72–1
.96
Expe
nditu
re q
uint
ile 4
*–0
.084
–1.0
5–0
.219
–4.4
3–0
.100
–1.4
50.
103
1.15
–0.0
74–1
.21
Loca
l lab
or m
arke
t ind
icat
orAd
ult e
mpl
oym
ent r
atio
1.91
82.
850.
993
3.91
1.31
210
.35
1.50
33.
631.
436
3.32
Shar
e of
pop
ulat
ion
–1.8
96–2
.54
–1.2
92–2
.89
–0.1
26–0
.41
–0.1
04–0
.25
0.99
41.
28
WB62_YALM_CH09 3/12/08 12:10 PM Page 208

209
Rura
lAg
e–0
.075
–0.6
00.
029
2.30
0.06
01.
43–0
.199
–1.0
30.
070
0.26
Age2
0.00
20.
72–0
.001
–2.0
6–0
.002
–1.4
60.
005
1.00
–0.0
01–0
.14
Fem
ale*
–0.1
42–1
1.02
–0.2
05–8
.05
–0.1
79–6
.08
–0.1
05–2
.73
–0.1
64–2
.51
Hou
seho
ld s
ize
–0.0
11–2
.65
0.00
10.
170.
000
0.15
0.00
60.
72–0
.002
–0.2
7H
omeo
wne
r*0.
007
0.40
0.03
00.
870.
134
2.34
0.22
72.
36–0
.053
–0.6
8
Hou
seho
ld e
xpen
dit
ure
qui
ntile
(ref
eren
ce g
roup
: top
qui
ntile
)Ex
pend
iture
qui
ntile
1*
–0.1
44–1
.83
–0.0
85–1
.04
–0.0
58–0
.97
–0.1
08–1
.80
0.18
710
.81
Expe
nditu
re q
uint
ile 2
*–0
.080
–1.7
8–0
.078
–1.2
9–0
.084
–1.4
50.
011
0.27
0.37
37.
36Ex
pend
iture
qui
ntile
3*
–0.0
72–1
.96
–0.0
54–0
.65
–0.1
27–1
.11
–0.0
07–0
.13
0.16
24.
54Ex
pend
iture
qui
ntile
4*
–0.0
74–1
.21
0.16
95.
68
Loca
l lab
or m
arke
t ind
icat
orAd
ult e
mpl
oym
ent r
atio
1.43
63.
320.
441
4.73
0.86
68.
050.
398
0.65
0.25
70.
48Sh
are
of p
opul
atio
n0.
994
1.28
0.35
32.
57–0
.848
–6.0
61.
305
1.05
0.60
00.
76
Sour
ce:U
nder
stan
ding
Chi
ldre
n’s W
ork
calc
ulat
ions
bas
ed o
n Et
hiop
ia L
abou
r For
ce S
urve
y 20
01.
*dy/
dx is
for d
iscre
te c
hang
e of
dum
my
varia
ble
from
0 to
1.
WB62_YALM_CH09 3/12/08 12:10 PM Page 209

The level of income or wealth, as proxied by the expenditure dummyvariables, is significant for less-educated youth; the effects of expenditureson the probability of employment lose size and significance as the levelof education increases. If household resources are important for findinga job, credit rationing or social networking might be important elementsin determining youth employment. However, this interpretation shouldbe taken with care because the data do not allow the exclusion fromhousehold income of the income generated by possibly employed youth(the data on expenditures are ranked in categories), hence reverse causa-tion cannot be ruled out. Especially in poor households, where we expectto find relatively less-educated youth, the additional employment ofone household member might substantially alter the expenditure level ofthe household.
Local labor market conditions appear to substantially influence theprobability of finding employment. The regional adult employment ratiois significant for all groups considered and indicates that an increase of10 percentage points in the adult employment ratio increases the prob-ability of youth finding employment by 10–25 percentage points. Thiseffect is stronger for youth who never attended school and substantiallyweaker for other groups, especially youth with at least some higher edu-cation. The supply of youth labor, as proxied by the share of young peoplein the population, seems to negatively affect the possibility of findingemployment. The effect is larger for youth who never attended schooland smaller for other groups. It is not significant for people with somehigher education. Similar results are obtained when the labor marketconditions are computed only for the urban areas of each region (seetable 9.9). Local labor market conditions are hence important for deter-mining youth employment, especially for youth with little or no education.Not surprisingly, supply and demand conditions are most relevant forthe less-qualified work force, which is more exposed to the phases of theeconomic cycle, because all the factors that put a wedge between theeconomic cycle and firm employment behavior (labor hoarding, hiringand firing costs, and the like) are far less relevant for these groups.
In rural areas, the results are similar but much more attenuated becauseof the dominance of agricultural self-employment and underemployment.The effect of age is present for the less-qualified work force but is muchsmaller than that observed in urban areas.
Gender biases are large and somewhat more pronounced than inurban areas, especially for youth with little or no formal education. Thelink between household income and employment is weak and not
210 Guarcello, Lyon, and Rosati
WB62_YALM_CH09 3/12/08 12:10 PM Page 210

Child Labor and Youth Employment in Ethiopia 211
well-defined, possibly because of the lack of employment opportuni-ties or the prevalence of underemployment in the agriculture sector.
The adult employment ratio appears to have a positive effect on theemployment probability of youth. The effect is stronger for youth whonever attended school but overall much smaller than that observed inurban areas. The relative size of the youth cohort is not significant forany of the groups considered.
In short, there appears to be much less of a market for labor in rural areasthan in urban areas. The prevalence in agriculture of self-employment,often subsistence employment—and hence underemployment—insulatesthis part of the economy from the workings of a competitive labor market.
Policies and Programs for Youth Employment in Ethiopia
The government ministries in Ethiopia most directly concerned withyouth and the labor force are the Ministry of Youth, Sports, and Culture;the Ministry of Education; the Ministry of Labour and Social Affairs(MOLSA); and the Ministry of Trade and Industry.19 The policies witharguably the most significant impact on youth labor force employmentopportunities are the education policy and the set of policies governingmicro- and small enterprises.
National Youth Policy The Ministry of Youth, Sports, and Culture formulated Ethiopia’s firstNational Youth Policy in March 2004, with the broad objectives ofencouraging the active participation of youth (defined as those ages15–29) in the economic, social, and cultural life of the country and sup-porting democratization and good governance. The policy was officiallylaunched in September 2004. Both the strategic plan and action plan arestill under preparation. The ministry and its regional bureaus (Bureausfor Labour and Social Affairs—BOLSAs) are responsible for coordinat-ing, integrating, and evaluating implementation of the policy.
The basic principles of the policy are to ensure that youth are active par-ticipants in and beneficiaries of democratization and economic develop-ment activities, to bring about unity, to allow youth to organize themselvesto protect their rights and interests, and to build capacity (through skillstraining, for example). The policy addresses a wide range of issues, rangingfrom HIV/AIDS to environmental protection and social services.
The youth and economic development policy sets out to facilitate theparticipation of youth in the formulation, implementation, and evaluation
WB62_YALM_CH09 3/12/08 12:10 PM Page 211
of national development polices, strategies, and programs. It also promisesto facilitate growth of self-employment and formal and informal employ-ment opportunities and to create favorable conditions for rural youth toacquire farming plots and grazing lands on the basis of existing laws.
The youth, education, and training policy outlines a vision for creatingan enabling environment for youth to benefit from education and train-ing and for out-of-school youth to develop their reading and writing skillsthrough adult education services. It acknowledges rural-urban, gender,and interregional disparities in education participation and aims to worktoward reducing them.
Labor Proclamation 377/2003Ethiopia’s Labor Law was proclaimed in 2003 to ensure that worker-employer relations are governed by certain basic principles, to guarantee therights of workers and employers to form associations, and to strengthen anddefine labor administration.20 The law applies to the entire labor force,though some provisions may be more relevant for youth than others.Article29 states that in the event of a reduction in the size of an organization’swork force, the employer, in consultation with trade unions, shall give pri-ority based on workers’ skills and productivity. In the case of equal skills andproductivity, the workers to be affected first by reduction should be thosewith the shortest length of service and those with the fewest dependents.
Article 48 discusses apprenticeships and allows for contracts to beformed with people at least 14 years old. The article covers the contentsof the contract, obligations of the parties, termination of a contract, andcertification. Article 110 includes provisions for the payment of benefitsto dependents and payment of funeral expenses (equal to at least twomonths’ wages) in the case of work-related injuries. Because regulationson formal and informal apprenticeships are the responsibility of MOLSA,apprenticeship training centers are required to have a contract agree-ment with relevant BOLSAs to ensure that they are in conformity withthe Labor Law.
Part of the Labor Law is devoted to 14- to 18-year-olds. The procla-mation prohibits employment of people under age 14 and prohibitsemployment of young workers for activities that endanger their lives andhealth. Prohibited activities include the following:
• Work involving the transport of passengers and goods (by road, rail-way, air, internal waterway, and docksides) or heavy lifting, pulling,pushing, or any other related type of labor
212 Guarcello, Lyon, and Rosati
WB62_YALM_CH09 3/12/08 12:10 PM Page 212

• Work connected with electric power generation plants, transformers,or transmission lines
• Underground work (such as mining or quarrying)• Work in sewers or tunnels
Article 90 states that the normal workday for young workers should notexceed seven hours (one hour less than for other workers). In addition,employers are prohibited from hiring young workers for overtime work orwork performed at night (between 10 p.m. and 6 a.m.), on weekly restdays, or on public holidays.
Education PolicyIn 1994, a new education policy that dramatically changed the educationsystem was introduced. The policy included a major supply-side push ontechnical and vocational education and training (TVET) to facilitate theschool-to-work transition. Before 1994, primary school included grades1–6, junior secondary included grades 7–8, and secondary school includedgrades 9–12. In grade 12, students took a school-leaving exam thatdetermined their eligibility to pursue higher education. Only a smallpercentage of students could enroll in higher education. The majority ofstudents left school without any readily marketable professional ortechnical skills.
The new education policy aimed to change this picture by focusing onproducing a skilled labor force rather than a large cohort of relativelyunskilled secondary school graduates. Grades 1–8 are now considered pri-mary school and grades 9–10 the first cycle of secondary school. Both lev-els provide general academic education. A national exam is given uponcompletion of grade 10, with those who score well promoted to the secondcycle of secondary school (grades 11 and 12), which is considered collegeor university preparatory. Those who do not score well enough to continuein secondary school have the opportunity to pursue formal TVET, whichtakes one to three years. One- and two-year training programs (known as“10 � 1” and “10 � 2”) are considered certificate level, while three years oftraining (“10 � 3”) is considered diploma level.
A pilot tracer study of TVET is currently under way to gather infor-mation on graduates, including their employment status, to see if thenew system is effective. The Ministry of Education is also working on astudy, in cooperation with Deutsche Gesellschaft für TechnischeZusammenarbeit, of the projected demand for mid-level humanresources to better understand current skill gaps in the labor force and
Child Labor and Youth Employment in Ethiopia 213
WB62_YALM_CH09 3/12/08 12:10 PM Page 213

thus to inform education policy. The Ministry of Education has formeda stakeholder network, which includes employers, to help prepare theTVET curriculum. Since 1999, the Ministry of Education has offeredsummer training for teachers of technical and vocational education toimprove the quality and practical relevance of its programs. It continuesto face the challenge of making its programs responsive to the changingneeds of the market.
Education Sector Development Program III The main objectives of the education sector in Ethiopia are to ensureaccess to a good-quality primary school education for all children by 2015and to create a skilled labor force at all levels. The government developedits Third Education Sector Development Program (ESDPIII), covering2005/06–2010/11, to continue implementation of its education policy.TVET, along with general tertiary education, is a major element of theESDPIII, reflecting the government’s belief that encouraging and equip-ping youth (through a strong skills-based training program) to becomeself-employed is an important way to reduce youth unemployment.
According to the action plan, the government will
• provide relevant and demand-driven education and training by monitor-ing the labor market and reorienting and refocusing the TVET system;
• provide education and training for basic- and junior-level trainees;• ensure the quality of TVET by establishing a testing system through-
out the country in all trades;• regard income-generating activities as a source of income and a compo-
nent of training to reduce government allocations to the TVET sector;• develop demand-oriented curricula based on occupational standards
by involving experts from the work world;• completely revise the curricula of technical teacher training institu-
tions at universities and institutes to improve instruction; and• use aptitude tests to avoid rigid trainee selection placement procedures.
To increase the efficiency of TVET, the Ministry of Education issueda proclamation in March 2004 providing procedural guidelines on preac-creditation, accreditation, internships, certification, board and councilestablishments, vocational guidance and counseling, cost sharing, andproduction centers. It also issued a handbook on the development ofoccupational standards.
214 Guarcello, Lyon, and Rosati
WB62_YALM_CH09 3/12/08 12:10 PM Page 214

Micro- and Small Enterprises Development StrategyIn recognition of the economic and social role of micro- and small enter-prises in providing goods and services, creating employment opportunities,and generating income, the Ministry of Trade and Industry formulated themicro- and small enterprises development strategy in 2004. The strategydefines microenterprises as formal or informal enterprises with paid-upcapital not exceeding Ethiopian birr (Br) 20,000 (US$2,300). Small enter-prises are defined as firms other than high-tech firms with paid-up capitalof Br20,000–50,000 (US$2,300–$5,750). The objectives of the strategyare to
• strengthen micro- and small enterprises to facilitate economic growthand bring about equitable development;
• create long-term jobs;• strengthen cooperation among micro- and small enterprises;• provide a basis for medium- and large-scale enterprises;• promote exports; and• balance preferential treatment between micro- and small enterprises
and medium- and large-scale enterprises.
The strategy gives priority to enterprises operated by women. It alsofavors enterprises operated by school dropouts, people with disabili-ties, and previously unemployed youth. It outlines key limitations facedby micro- and small enterprises and sets out the goal of providing thefollowing kinds of support: credit services, entrepreneurship and busi-ness management training, appropriate technology research, market sup-port, information and counseling, business development services, andinfrastructure provision, including roads, electricity, and water and accessto land and work places.
Industrial Development StrategyThe Ethiopian industrial development strategy, formulated in 2001, rec-ognizes the private investor as the engine for industrial development andencourages the development of labor-intensive industries. The strategyunderlines the importance of micro- and small enterprises, recognizingthe role these enterprises play in youth employment. It acknowledgesmicro- and small enterprises as important vehicles in ameliorating unem-ployment and boosting investment and savings. These enterprises aresecond only to the agriculture sector for employment generation.
Child Labor and Youth Employment in Ethiopia 215
WB62_YALM_CH09 3/12/08 12:10 PM Page 215

Licensing and Supervision of Microfinance InstitutionsThe National Bank of Ethiopia has the authority to license and supervisemicrofinance institutions, which must adhere to its regulations. To operatelegally, microfinance institutions must be licensed, which requires mini-mum paid-up capital of Br200,000 (US$23,000). This amount was setfairly low to attract investors to the microbanking sector. Some micro-finance institutions were originally founded by nongovernmental organiza-tions, but a change in the law means that a minimum of five shareholders isrequired to operate a microfinance institution, so many are jointly owned bya mixture of public, nongovernmental organization, and private sharehold-ers. The National Bank of Ethiopia’s loan policy requires that microfinanceinstitutions give preference to poor rural farmers and microeconomic activ-ities of rural and urban communities with small cash requirements.
Until the law was amended, the minimum annual interest rate paid onsavings and time deposits of microfinance institutions was 7 percent, andindividual microfinance institutions could set their own interest rates onloans, up to a maximum of 15.5 percent a year. Since the change in thelaw in 1998, each institution’s board of directors can set interest rates onloans and advances. The minimum interest rate payable on savings andtime deposits was also amended and lowered to 6 percent. The cap ofBr5,000 (US$575) per loan was relaxed to accommodate borrowers whoneeded medium-size loans—more than microfinance institutions couldoffer but not enough to access credit from commercial banks. Currently,microfinance institutions can offer up to 20 percent of their annual lend-ing amount in loans larger than Br5,000.
HIV/AIDS PolicyEthiopia’s HIV/AIDS policy was crafted in 1998—more than a decadeafter the first reported AIDS cases—in response to the alarming spreadof HIV/AIDS. It contains several provisions relevant to employment.Article 3, subarticle 3.3, states that no person should be forced to under-go HIV screening for job recruitment purposes unless the nature ofthe occupation requires such testing. Article 8, subarticle 8.2, outlinesthe rights of people with HIV/AIDS for access to employment and asso-ciated privileges, education and training facilities, and public facilities.Subarticle 8.4 strengthens this provision by stating that people shouldnot be subjected to discriminatory practices on the basis of HIV/AIDS.
In 2003, the HIV/AIDS Prevention and Control Office developeda mainstreaming guideline to provide both conceptual and practicalguidance and information on how government sectors should respond
216 Guarcello, Lyon, and Rosati
WB62_YALM_CH09 3/12/08 12:10 PM Page 216

to the threat of the epidemic in the work place. The guideline empha-sized mainstreaming HIV/AIDS awareness into routine operations ofall federal ministries and organizations to encourage prevention. MOLSAwas requested to incorporate HIV/AIDS awareness in its developmentplan, strategies, and policies; to undertake studies on the impact ofHIV/AIDS on women, youth, and children; and to coordinate andassist relevant organizations in eliminating HIV/AIDS.
Through MOLSA’s Labour Affairs Department, the ministry is sup-posed to provide guidance on employment procedures and the labor lawto prevent mandatory preemployment and periodic medical checkupsfor HIV/AIDS. It is supposed to develop and disseminate a nationalHIV/AIDS code of conduct for the work place. Through its Childrenand Family Affairs Department, MOLSA is required to establish andstrengthen youth anti-AIDS clubs and peer-to-peer leadership forums tocombat the epidemic.
Conclusions and Policy Recommendations
Despite recent increases in enrollment rates, young people in Ethiopiaenter the labor market with very low levels of human capital. This isespecially true in rural areas, where more than 70 percent of 15- to24-year-olds have never attended school and only 17 percent haveattended primary school. In urban areas the situation is less dramatic,but even there about 30 percent of young people have no more thana primary education, while another 24 percent have not completedlower secondary school.
These low levels of educational attainment result in a large numberof youth who enter the labor market at an early age. By age 18, about80 percent of rural residents and 40 percent of urban residents areworking. Gender differences are large, especially in rural areas, wherefemales are much less likely than their male counterparts to be informal employment.
Strong rural-urban differences also characterize the status of youngpeople in the labor market. In rural areas, youth unemployment is low(about 4 percent), transition from school to work for the few whoattend school is about two years, and youth workers are not disadvan-taged with respect to adult workers in either employment type or unem-ployment. However, employment is overwhelmingly in the agriculturesector (largely subsistence), labor income is low, and underemploymentis widespread.
Child Labor and Youth Employment in Ethiopia 217
WB62_YALM_CH09 3/12/08 12:10 PM Page 217

In urban areas, youth unemployment is high (almost 20 percent),and the transition from school to work is more than twice as long asin rural areas. Urban youth are at a disadvantage with respect to theadult population in employment and type of occupation. In particular,they face more difficulty finding wage jobs and employment in theformal sector.
Education appears to help young people secure better jobs, but difficul-ties in finding a job increase with the level of human capital. Unem-ployment rates are also higher for better-educated prime-age adults. Thesefindings need to be interpreted with caution, however, because not enoughinformation is available to assess how much of the higher unemploy-ment rate of the more educated may be “wait” unemployment.
The econometric analysis confirms most of the descriptive findingsand adds some insights on the effects of household background and locallabor markets. The estimates indicate that rural employment is less influ-enced than urban employment by household characteristics and by thestatus of the local labor market.
Household background characteristics, in particular the level ofexpenditures, seem to affect the probability of employment, especiallyfor youth entering the labor market with low levels of human capital.Although this result should be interpreted with care, it seems to indicatethat credit rationing and parental support are important determinants ofemployment probability.
Local labor market conditions influence the probability of employ-ment, especially but not exclusively for youth with low levels of humancapital. Youth employment appears to respond to the demand for laborand to the relative supply of young people. Macroeconomic improve-ment is thus likely to help reduce the labor disadvantage of youth.
Several policy issues emerge from this research:
• The very high levels of child labor and associated very low levels ofschool attainment affect patterns of employment (unemployment),job quality, and remuneration later in life. Developments in theeducation sector have resulted in some progress in raising atten-dance, but addressing the access and quality issues influencing par-ents’ decisions to enroll their children in school remains a majorchallenge in rural areas. Developing and expanding policies designedto offset or minimize the opportunity costs of rural children’s timein school—such as flexible school scheduling designed around the
218 Guarcello, Lyon, and Rosati
WB62_YALM_CH09 3/12/08 12:10 PM Page 218

agricultural seasons or school attendance incentive schemes—mayhold promise.
• A large number of youth in the labor market have very low levels ofhuman capital. Even if the general enrollment situation improves,the current generation of young people will have few chances to seereal changes in their circumstances. More investment in special train-ing and skill formation activities is therefore needed in parallel withbroader education expansion efforts to improve the employmentprospects of this stock of low-educated or uneducated youth.
• Unemployment is higher among the minority of youth (primarilyurban) with higher levels of human capital. More information is neededto identify the causes of this phenomenon and to distinguish volun-tary from involuntary unemployment. Distinguishing between waitunemployment and an employability problem is important in formu-lating policy, especially because successful education policies willsubstantially increase the relative number of educated youth in thelabor market in the near future. An assessment of the determinants ofexcess unemployment and of the education-specific unemploymentof youth will be essential to designing appropriate policies.
• Although a number of labor market surveys have been carried out inEthiopia, especially in urban areas, information gaps persist, prevent-ing a complete picture of the youth labor market situation from beingdrawn. It would be useful to introduce minor changes in the currentsurvey instruments to fill these gaps. The addition of a few retrospec-tive questions could go a long way in compensating for the absence ofpanel data.
• Low skill levels and the likely impact of credit rationing have negativeeffects on youth labor force outcomes. These results underscore therelevance of the government’s micro- and small enterprise develop-ment and microfinance strategies. Unfortunately, no information isavailable for an assessment of the impact of such strategies. Fillingthese gaps should be a priority.
• The strong role that labor market conditions play in determining theprobability of employment indicates that macroeconomic growth iscrucial to youth employment and that youth employment hinges to alarge extent on the success of national development policies. The factthat labor market effects are particularly strong for the less-educatedlabor force points to the special vulnerability of these groups and tothe need to introduce risk-reduction policies.
Child Labor and Youth Employment in Ethiopia 219
WB62_YALM_CH09 3/12/08 12:10 PM Page 219

Notes
1. A longer version of this chapter is available as “Child Labor and YouthEmployment: Ethiopia Country Study,” (Guarcello and Rosati 2007).Data tables supporting the assertions in this chapter can be found in thelonger version.
2. “Child economic activity” is used as a proxy for child labor in this chapter.Technically, child labor is a narrower concept than child economic activity,referring only to those forms of work that are injurious, negative, or undesirablefor children and that should be targeted for elimination in accordancewith International Labour Organization Conventions 138 (minimum age)and 182 (worst forms). Economically active children include all childrenperforming at least one hour of economic activity during the referenceweek. Economic activity is defined in the sense of the System of NationalAccounts and corresponds to the international definition of employmentadopted by the 13th International Conference of Labour Statisticians in1982. Economic activity covers all market production (paid work) and cer-tain types of nonmarket production (unpaid work), including production ofgoods for own use. It excludes household chores performed by children intheir own household.
3. The data do not allow us to unambiguously identify youth who are bothworking and attending school. An employed person is someone who isinvolved in paid employment, at work, or has a job but is not currently atwork. This includes people waiting to rejoin employment and employers orpeople in self-employment. This category should include unpaid familylaborers who hold jobs in a market-oriented establishment irrespective ofthe number of hours worked during a reference period. However, somecountries set a minimum time criterion for including unpaid family labor-ers among the employed. Usually, if a person works more than seven hoursa day, he or she is considered employed. An unemployed person is a personwho is without work, currently available for work, or seeking work by tak-ing necessary steps to seek paid employment, such as applying for jobs orregistering with an agency.
4. The data do not allow us to clearly identify people with disabilities. Evenlooking at the main reason for not attending school, we could identify only2 percent of idle youth in the 15–24 age range as ill or disabled.
5. The unemployment rate (unemployment as a proportion of the total laborforce in the same age group) is actually higher for teenagers, because teenagersare more likely to be in school and therefore outside the labor force.
6. Youth unemployment is included as an indicator for monitoring MillenniumDevelopment Goal Target 16, to “develop and implement strategies for decentand productive work for youth.” See http://millenniumindicators.un.org/unsd/mi/mi_goals.asp.
220 Guarcello, Lyon, and Rosati
WB62_YALM_CH09 3/12/08 12:10 PM Page 220

7. Unlike unemployment, joblessness has the advantage of reflecting bothunemployed and discouraged workers (workers who have left or did not enterthe work force).
8. According to the very broad definition of employment used in generating esti-mates of employment, anyone who is undertaking economic activity for onehour or more during the reference week is considered employed, even if heor she is actively looking for additional work.
9. In the 1999 Labour Force Survey, rural youth respondents did not indicate agreater willingness or availability to work extra hours than their urban coun-terparts, raising the possibility that rural youth may be working more hoursthan reported.
10. Some forms of economic work, such as fetching water, are also included inthis category.
11. A self-employed person is one who performs some work for profit or familygain, in cash or in kind.The remuneration is dependent on the profits derivedfrom the goods and services produced (own consumption from enterprise isconsidered part of profits). The incumbent makes operational decisionsaffecting the enterprise or may delegate decisions while retaining the respon-sibility for the welfare of the enterprise. Self-employed people work in one-person businesses that may include contributing family workers.
12. Wage employees are people who are remunerated by wages or salaries. Wageemployees may also receive remuneration in the form of commissions fromsales, price rates, bonuses, or in-kind payments. Basic remuneration is notdirectly dependent on revenue of the unit one works for but on the explicit(written or oral) or implicit employment contract. A wage employee may bea regular employee with or without a fixed-term contract or a casual workerwithout a contract.
13. The Ethiopia Labour Force Survey 2001 did not collect information oninformal sector work.
14. See chapter 7 of this book for development of the indicator.
15. This, of course, is a strong assumption because school quality, the relevance ofschooling to labor market demands, and student characteristics, among otherfactors, also affect labor market preparedness.
16. In the absence of retrospective information on work involvement, it is notpossible to estimate the proportion of young people who worked as children.
17. The method used is that suggested in Bourguignon, Fournier, and Gurgand(2001), who generalize the approach originally proposed by Lee (1983).
18. For a detailed description of the methodology followed, see Tolbert andKillian (1987).
19. This section draws on Getachew and Kallaur (2005).
20. Ethiopia does not have an official employment policy or a minimum wage law.
Child Labor and Youth Employment in Ethiopia 221
WB62_YALM_CH09 3/12/08 12:10 PM Page 221

References
Bourguignon, F., M. Fournier, and M. Gurgand. 2001 “Selection Bias CorrectionBased on the Multinomial Logit Model.” CREST Working Paper, Center forResearch in Economics and Statistics, Paris, France.
CSA (Central Statistical Authority of Ethiopia). 2003. Urban BiannualEmployment Unemployment Survey 2003 data set. Addis Ababa.
Cockburn, J. 2002. “Income Contribution of Child Work in Rural Ethiopia.”Working Paper 2002-12, Oxford University, Centre for the Study of AfricanEconomies, Oxford, United Kingdom.
Denu, B., A. Tekeste, and H. van der Deijl. 2005. “Employment Strategy Papers:Characteristics and Determinants of Youth Unemployment, Under-employment and Inadequate Employment in Ethiopia.” International LabourOrganization, Employment Policies Unit Employment Strategy Department,Geneva.
Easterly, W. 2002. “Growth in Ethiopia: Retrospect and Prospect.” Center forGlobal Development, Institute of International Studies, Washington, DC.
ECA (Economic Commission for Africa). 2002. “Economic Report on Africa2002: Tracking Performance and Progress.” ECA, Addis Ababa, Ethiopia.
Getachew, M., and E. Kallaur. 2005. “Youth Employment in Ethiopia: Overviewand Inventory of Existing Policies and Programs.”World Bank,Washington, DC.
Guarcello, L., and F. Rosati. 2007. “Child Labor and Youth Employment: EthiopiaCountry Study.” Social Protection Discussion Paper No. 0704, World Bank,Washington, DC.
ILO (International Labour Office). 2004. “Global Employment Trends for Youth.”ILO, Geneva.
Lee, Lung-Fei. 1983. “Generalized Econometric Models with Selectivity.”Econometrica 51(2): 507–12.
MEDaC (Ministry of Economic Development and Cooperation). 1999. “Surveyof the Ethiopian Economy: Review of the Post Reform Developments.” AddisAbaba.
———. 2000. “Ethiopian Economy in Figures: Selected Indicators.” Departmentof Macroeconomic Planning and Policy Analysis, MEDaC, Addis Ababa,Ethiopia.
MOE (Ministry of Education). 1999. Educational Statistics Annual Abstract 1991E.C. (1998–99). Education Management Information Systems, Addis Ababa.
———. 2003. Educational Statistics Annual Abstract 1995 E.C (2002–03).Education Management Information Systems, Addis Ababa.
MOFED (Ministry of Finance and Economic Development). 2002. “SustainableDevelopment and Poverty Reduction Program.” Addis Ababa.
222 Guarcello, Lyon, and Rosati
WB62_YALM_CH09 3/12/08 12:10 PM Page 222

Tolbert, C. M., and M. S. Killian. 1987. “Labor Market Areas for the UnitedStates.” U.S. Department of Agriculture, Washington, DC.
Woldehanna T., F. Guta, and T. Ferede. 2005. “Labour Market Flexibility andEmployment Security in Ethiopia: Economic Part.” International LabourOffice, Employment Strategy Department, Geneva.
World Bank. 2002. “The Federal Democratic Republic of Ethiopia: DevelopingExports to Promote Growth.” Sector Report 23294-ET, Washington, DC.
———. 2005. “Ethiopia Risk and Vulnerability Assessment.” Report No. 26275-ET, Africa Region, Human Development Group III, Washington, DC.
Yamano, T. 2000. “Does Food Aid Reduce Child Farm Labor Supply in Ethiopia?”World Bank, Washington, DC.
Child Labor and Youth Employment in Ethiopia 223
WB62_YALM_CH09 3/12/08 12:10 PM Page 223

WB62_YALM_CH09 3/12/08 12:10 PM Page 224

Like many Sub-Saharan African countries, Tanzania suffered fromsevere youth unemployment and inactivity in urban areas in the 1990s(Mjema 1997). Despite sustained growth in the second half of the lastdecade, labor market outcomes have deteriorated (Government ofTanzania 2003).
Unemployment is largely an urban phenomenon in Tanzania, but labormarket outcomes of rural youth are also weak. Rural children begin towork very early in life, with little or no schooling or sometimes in combi-nation with school (Beegle and Burke 2004; Beegle, Dehejia, and Gatti2006). Most end up in low-productivity jobs on household farms. Pooremployment prospects may be a major reason behind increasing migra-tion from the countryside to urban areas (U.S. Census Bureau 1995), evenin the face of poor and deteriorating urban labor market prospects.
This chapter aims to shed some light on youth unemployment inTanzania. It provides evidence on different dimensions of youth labor
C H A P T E R 1 0
Youth in the Labor Market and the Transition from School to Work in Tanzania
Florence Kondylis and Marco Manacorda
225
The authors are grateful to Jean Fares, Marito Garcia, and seminar participants at theworkshop “Youth in Africa’s Labor Market,” held February 7, 2006, in Washington, DC,for comments and suggestions.
WB62_YALM_CH10 3/12/08 12:10 PM Page 225

market performance from the 2000/01 Tanzanian Integrated LabourForce Survey (NBS 2003). This large household survey, covering morethan 11,000 households, provides a rich array of information on employ-ment, job search, schooling, training, and migration, together with basicinformation on individual and household characteristics. This chapterattempts to identify the determinants of youth labor market outcomesand to tease out significant predictors of labor market success and failureusing simple regression tools.
The first section of this chapter presents an overview of the youth unem-ployment problem.The second section presents the data as well as detaileddescriptive statistics on youth labor market performance. The third sectionpresents the regression results. The last section draws conclusions.
Why Is Unemployment Higher among Youth?
An extensive literature analyzes youth labor market outcomes and thetransition to adulthood in developed countries, especially the UnitedStates (OECD 1996, 1998, 1999, 2000; Ryan 2001). Youth typicallydisplay lower labor market attachment and have lower employmentrates than older workers (Rees 1986). Some of them are in school fulltime or combine education with work; others devote time to job searchingor move from one job to another as part of their investment in humancapital or as a process of mutual information gathering with employers.From this perspective, youth joblessness reflects a potentially efficientmechanism of allocating workers to jobs. Lack of dependents and thepossibility of relying on parental support often make joblessness a lesspainful alternative for young workers and less of a problem from theviewpoint of social planners. Lower wages associated with lower experi-ence levels or stronger preferences for leisure may also imply lower disu-tility of not working.
Young people not only display higher rates of joblessness and unem-ployment than adults due to frictional reasons at any given time, they alsoappear to be more sensitive to the state of the economic cycle. The youthunemployment problem in most developed countries (in particular, theOrganisation for Economic Co-operation and Development countriesfollowing the oil shocks of the 1970s) has been attributed largely to theweakness of the economy and to overall lack of labor demand (Rees 1986;Freeman and Wise 1982; Blanchflower and Freeman 2000a, 2000b; ILO2000; Card and Lemieux 2000). Disadvantaged youth in particular appearto bear a disproportionate share of the cost of economic downturns or
226 Kondylis and Manacorda
WB62_YALM_CH10 3/12/08 12:10 PM Page 226

weak labor demand (Freeman 1991; Freeman and Rodgers 1999). Thevulnerability of youth to economic downturns results largely from theirlower levels of labor market skills (experience and sometimes education)and lower labor market attachment (including lower job search), theirlack of employment protections, and hiring and firing rules that oftenpenalize recently hired workers.
Aggregate supply matters, too. For a given level of labor demand, anincrease in the proportion of youth in the labor market disproportion-ately hurts youth. This is consistent with a world in which youth andadults are only imperfect substitutes in production. Excess supply relativeto demand affects wages, employment, or both (Welch 1979; Card andLemieux 2001; Koreman and Neumark 2000). As young workers seetheir employment prospects deteriorate, not only do they tend to workless, they also respond with adjustments by staying in school, residingwith parents (Card and Lemieux 2000), and possibly committing crime(Freeman 1996, 1999).
Much less is known about the behavior of youth in developingcountries. Rosenzweig (1988) and O’Higgins (2003) show that unem-ployment and joblessness are higher among youth in many developingcountries. Guarcello and others (2005) document very high inactivityrates among youth in 13 Sub-Saharan African countries. Otherresearchers present similar pictures from other parts of the developingworld (see, for example, Rama [2003] for Sri Lanka).
A commonly held view about urban labor markets in developingcountries is that youth joblessness is a luxury accessible only to thosefrom more advantaged backgrounds, often proxied by their education.Unemployment is often regarded as an option pursued by youth queuingfor jobs in the public sector or waiting to fill vacancies in the formal privatesector. In the presence of widespread poverty and the absence of publicprovision of welfare, nonemployment is a not a viable option for thepoor, who have no choice but to make ends meet through informal andcasual work. From this perspective, the youth unemployment problemshould not on its face be a source of major policy concern, because it islargely a voluntary phenomenon.
The rest of this chapter documents youth labor market outcomes inTanzania. It attempts to determine what role, if any, market forces playin shaping these outcomes and how individuals respond to changingeconomic incentives. It argues that youth joblessness is by no means avoluntary phenomenon in Tanzania and suggests potential roles forpolicy makers.
Youth in the Labor Market and the Transition from School to Work in Tanzania 227
WB62_YALM_CH10 3/12/08 12:10 PM Page 227

Descriptive Evidence
This section presents data on individuals’ labor force status and schoolattendance. It then examines the characteristics of youth who workbefore focusing on youth who are out of work.
The Tanzanian Integrated Labour Force Survey The Integrated Labour Force Survey is a large sample survey (43,558individual observations in 11,158 households) collecting a rich array ofinformation on work activity, schooling, and job search. This sectiondraws on this survey to present evidence on teenagers (ages 15–19) andyoung adults (ages 20–24)—collectively termed “youth”—relative toprime-age adults (35–49). Separate results are presented for men andwomen and for the main geographical areas of the country—Dar esSalaam, other urban areas, and rural areas.
Differences between groups of workers are exploited to uncover thedeterminants of youth labor market outcomes. While this strategy hasthe advantage of generating sufficient variation in the data to crediblyidentify the impact of the variables of interests, it implies that we remainlargely indifferent to the macro determinants (that is, determinants com-mon to everyone in the labor market) of the state of the labor marketin Tanzania.
School Enrollment and Labor Force Participation The data illustrate that school attendance is about 58 percent for maleteenagers in Dar es Salaam and tends to be lower in other urban areasand lower still in rural areas, where school attendance is about 39 percent(table 10.1). A similar pattern can be identified for male young adults,with about 14 percent of them in school in Dar es Salaam and only2 percent in rural areas. Among youth out of school, some drop out at anearlier age while others never attend. School attendance at some pointin life is almost universal in Dar es Salaam (about 97 percent for men).A similar picture emerges in other urban areas where the proportion ofmales who never attended school is about 4 percent, irrespective of age.School attendance, though, is far from universal in rural areas: 15 percentof male young adults there have never attended school. This proportionrises to 19 percent for prime-age adult men, suggesting an improve-ment in education outcomes across subsequent cohorts of men.
Patterns of work participation illustrated in column table 10.1 are, toa large extent and in all areas, the mirror image of patterns of schoolattendance. Work refers to any work activity in the week before the
228 Kondylis and Manacorda
WB62_YALM_CH10 3/12/08 12:10 PM Page 228

survey. The data include people who have a job but are temporarilyabsent from it. While about 20 percent of male teenagers are working inDar es Salaam, the corresponding proportion is 43 percent in otherurban areas and 76 percent in rural areas. Similar patterns can be identi-fied for male young adults, with an employment-to-population ratio thatincreases from 47 percent in Dar es Salaam to 76 percent in other urbanareas. By contrast, the majority of male young adults living in rural areasare employed, with an employment-to-population ratio of 92 percent.Teenager and young adult participation rates are always below those ofprime-age adult men, which are about 95–97 percent with little varia-tion across areas.
Youth in the Labor Market and the Transition from School to Work in Tanzania 229
Table 10.1. Labor Force and Schooling Status in Tanzania, 2000/01 (percent)
Never attended Work and No work andItem School school Work school no school
MalesDar es SalaamTeens 58.1 2.6 20.6 3.6 24.9Young adults 14.2 4.2 47.2 2.0 40.7Prime-age adults 0 2.1 97.4 0 2.6
Other urbanTeens 50.8 4.0 43.5 12.2 17.8Young adults 7.8 3.8 76.0 1.6 17.7Prime-age adults 0 4.2 94.9 0 5.1
RuralTeens 39.1 14.6 76.1 21.9 6.7Young adults 2.3 15.4 92.2 0.9 6.5Prime-age adults 0 19.2 96.8 0 3.2
FemalesDar es SalaamTeens 44.2 3.6 26.5 2.7 31.9Young adults 5.4 4.3 37.4 0.9 58.0Prime-age adults 0 12.0 69.3 0 30.7
Other urbanTeens 36.8 6.1 44.5 8.9 27.6Young adults 2.5 5.0 67.2 0 30.4Prime-age adults 0 15.7 89.2 0 10.8
RuralTeens 34.3 18.6 76.2 16.9 6.5Young adults 1.2 21.3 92.4 0.7 7.1Prime-age adults 0 47.4 95.1 0 4.9
Source: Integrated Labour Force Survey 2000/01.
WB62_YALM_CH10 3/12/08 12:10 PM Page 229

Table 10.1 clearly indicates that combining work and school is essen-tially a phenomenon affecting teenagers in rural areas. In other urbanareas, a small proportion of male individuals do both activities, but thisproportion rises to 22 percent in rural areas, probably because ruralteenagers are able to provide their work services on the household farm,without the need for a lengthy job search or formal contractual arrange-ments. In addition, lower household income in these areas makes theseindividuals potentially more likely to work while still in school, while thelack of substantial alternative work opportunities other than on thehousehold farm makes the return to search quite low.
Analysis of the proportion of individuals who are neither at work norat school (sometimes defined as joblessness; see Ryan 2001) provides afirst illustration of the problems young people face in Tanzania’s labormarket. Around 25 percent of male teenagers and 41 percent of maleyoung adults are neither at school nor at work in Dar es Salaam. The cor-responding proportions in other urban areas are 18 percent for bothteenagers and young adults. In rural areas, joblessness is lower, about7 percent for both groups.
There are some notable differences between the labor force statusof men and that of women (table 10.1). Women are less likely to bein school than men of the same age. This is particularly evident inurban areas: in Dar es Salaam the proportions of female teenagers andyoung adults in school are 44 percent and 5 percent respectively (thatis, 14 percentage points and 9 percentage points less than males of thesame age). In other urban areas, the proportions of female teenagersand young adults in school are 37 percent and 2 percent respectively(14 percentage points and 5 percentage points less than males of thesame age). In rural areas, where boys’ school attendance is lower, dif-ferences between girls and boys are less evident, with a proportion offemale teenagers in school of 34 percent and a proportion of femaleyoung adults in school of 1 percent (that is, 5 percentage points and1 percentage point less than males of similar age).
The proportion of female teenagers and young adults who neverattended school is about 4 percent in Dar es Salaam and 5–6 percent inother urban areas, exhibiting little difference from males. This suggeststhat conditional on enrollment, girls are on average less likely to remainin school than boys are. The proportion of female teenagers and youngadults who never attended school is much higher in rural areas: 19 percentand 21 percent respectively, or 4–6 percentage points more than males.Although girls appear to do worse than boys with regard to school
230 Kondylis and Manacorda
WB62_YALM_CH10 3/12/08 12:10 PM Page 230

attendance, a comparison with older individuals shows that recentcohorts of women have experienced remarkable progress relative to menin both rural and urban areas. The proportion of prime-age adult womenwho never attended school is 12 percent in urban areas (10 percentagepoints more than men), 16 percent in other urban areas (12 percentagepoints more than men), and 47 percent in rural areas (28 percentage pointsmore than men).
As with men, employment ratios for women increase with age in allareas, and they are at their lowest in Dar es Salaam and at their highestin rural areas. The proportion of female teenagers at work is 27 percentin Dar es Salaam, 45 percent in other urban areas, and 76 percent in ruralareas. The corresponding proportions among female young adults are37 percent, 67 percent, and 92 percent. In general, teenage girls are morelikely to be working than teenage boys; the differences range from 6 per-centage points in Dar es Salaam to 1 percentage point in other urbanareas. Differences are statistically significant. No differences emerge inrural areas. The pattern is reversed among young adults, as young womenare less likely to be at work than young men. Here, differences rangefrom 10 percentage points lower in Dar es Salaam to 9 percentage pointslower in other urban areas. No differences emerge between girls andboys in rural areas. One potential explanation for this pattern is that girlsin urban areas drop out of school earlier than boys and enter the labormarket earlier. However, as they age, some of them tend to withdrawfrom the labor market, as they become gradually absorbed by childrear-ing and other domestic activities, while potentially a smaller proportionof female school leavers enter the labor market. This is confirmed by ananalysis of employment-to-population ratios among prime-age adultwomen, showing a negative female-male gap. The employment-to-population ratio of prime-age adult women is 28 percentage pointslower than that of men in Dar es Salaam, and 5 percentage points lowerthan that of men in other urban areas. Differences in rural areas are onlyabout 1 percentage point.
Girls are also less likely than boys to combine work and education. Thisis largely a reflection of the fact that fewer women are in school full time.If one standardizes the proportion of those combining work and school(see table 10.1) to the proportion in school, results are very similar formen and women. Conditional on being in school, then, the probability ofwork is similar for boys and girls. Finally, the proportion of women neitherat school nor at work shows that in urban areas, females are more likely tobe jobless than males. This likely reflects a lower labor supply of women
Youth in the Labor Market and the Transition from School to Work in Tanzania 231
WB62_YALM_CH10 3/12/08 12:10 PM Page 231

together with a potentially lower demand for their work services. As withmen, it appears that young women ages 20–24 are at greater risk of beingneither in school nor at work. For example, the proportion of joblesswomen rises from 32 percent for teenagers in Dar es Salaam to 58 percentfor young women and falls to 31 percent for prime-age adult women. Thecorresponding proportions in other urban areas are 28 percent, 30 percent,and 11 percent. There are no discernible differences in the prevalence ofjoblessness between males and females in rural areas.
In sum, there is evidence that a nonnegligible proportion of the popu-lation drops out of school and starts to work at an early age, especially inrural areas. In general, girls drop out and enter the labor market earlierthan boys do. As an increasing proportion of students drop out of school,the chance of finding a job falls in urban areas. Whereas most men appearto eventually become absorbed into the labor market, a large proportionof women remain out of the labor market, especially in Dar es Salaam.Some of these women may be devoting their time to home production.
The data suggest a smoother transition in rural areas, where a largeproportion of males and females transition into work at an early age. Thissmoother transition may result from the need for young people in ruralareas to start work earlier to guarantee their own survival and that oftheir households, as well as from the lower returns to education and jobsearch in rural areas. Rural jobs are likely to provide only a subsistenceliving for many individuals. More rapid transitions may therefore be asso-ciated with worse lifetime outcomes in rural areas than in urban areas.
Nature of EmploymentWorkers are divided into five categories: those in paid employment(employees), the self-employed with employees, the self-employedwithout employees, those performing unpaid work in the family non-agricultural business (typically shops), and those working on their ownfarms (table 10.2). Work for pay includes payment both in cash and inkind. The data refer to the individual’s main occupation in the weekbefore the survey. Male youth are in general more likely to perform workfor the household farm or business and less likely to be in paid employ-ment or to run their own businesses than prime-age adult men. Forexample, among teenagers the proportions of employees are 41 percent,15 percent, and 4 percent in Dar es Salaam, other urban areas, and ruralareas, respectively. For prime-age adult men these proportions are 55 percent, 37 percent, and 9 percent. Similarly, the proportions who areworking in the family business (table 10.2, columns 4 and 5 together) in
232 Kondylis and Manacorda
WB62_YALM_CH10 3/12/08 12:10 PM Page 232

Tab
le 1
0.2.
Nat
ure
of E
mp
loym
ent i
n T
anza
nia
, 200
0/01
(per
cent
, exc
ept w
here
indi
cate
d ot
herw
ise)
(1)
(2)
(3)
(4)
(5)
(6)
(7)
(8)
Self-
empl
oyed
Self-
empl
oyed
,U
npai
dO
wn
Aver
age
Mul
tiple
Item
Empl
oyee
with
em
ploy
ees
no e
mpl
oyee
sfa
mily
wor
ker
farm
wee
kly
hour
sjo
bsU
nder
empl
oyed
Mal
esD
ar e
s Sal
aam
Teen
s40
.76
027
.20
22.7
59.
2953
.061
0.3
6.6
Youn
g ad
ults
47
.38
1.72
38.3
66.
655.
8858
.077
2.1
4.2
Prim
e-ag
e ad
ults
54.4
610
.32
30.0
00
5.22
57.8
087.
81.
0
Oth
er u
rban
Teen
s15
.05
0.21
16.7
45.
2462
.76
44.1
3716
.02.
8Yo
ung
adul
ts
21.7
73.
0622
.49
3.82
48.8
758
.180
10.4
3.7
Prim
e-ag
e ad
ults
36.9
45.
5428
.48
0.38
28.6
662
.288
21.1
2.1
Rura
lTe
ens
3.63
0.04
2.32
3.47
90.5
443
.116
12.5
4.8
Youn
g ad
ults
5.
620.
344.
630.
8388
.57
52.8
7618
.35.
7Pr
ime-
age
adul
ts
8.95
0.99
4.44
0.25
85.3
754
.701
24.0
3.3
Fem
ales
Dar
es S
alaa
mTe
ens
52.0
60.
4226
.12
15.2
46.
1656
.324
3.6
7.1
Youn
g ad
ults
36
.38
2.77
53.8
24.
372.
6654
.724
2.5
13.6
Prim
e-ag
e ad
ults
27
.22
3.27
55.7
90.
3913
.34
50.4
257.
010
.4
233
(con
tinue
d)
WB62_YALM_CH10 3/12/08 12:10 PM Page 233

Tab
le 1
0.2.
Nat
ure
of E
mp
loym
ent i
n T
anza
nia
, 200
0/01
(con
tinue
d)(p
erce
nt, e
xcep
t whe
re in
dica
ted
othe
rwise
)
(1)
(2)
(3)
(4)
(5)
(6)
(7)
(8)
Self-
empl
oyed
Self-
empl
oyed
,U
npai
dO
wn
Aver
age
Mul
tiple
Item
Empl
oyee
with
em
ploy
ees
no e
mpl
oyee
sfa
mily
wor
ker
farm
wee
kly
hour
sjo
bsU
nder
empl
oyed
Oth
er u
rban
Teen
s16
.77
1.27
11.7
220
.86
49.3
943
.443
18.7
12.2
Youn
g ad
ults
19
.08
1.08
35.1
86.
5138
.14
48.9
7615
.07.
8Pr
ime-
age
adul
ts
14.1
25.
8528
.40
2.88
48.7
752
.829
26.3
9.5
Rura
lTe
ens
1.86
0.00
1.91
5.16
91.0
641
.728
13.6
8.0
Youn
g ad
ults
1.
320.
281.
941.
3895
.08
46.9
4314
.910
.9Pr
ime-
age
adul
ts
2.29
0.19
3.03
0.78
93.7
048
.642
19.9
8.2
Sour
ce:I
nteg
rate
d La
bour
For
ce S
urve
y 20
00/0
1.
234
WB62_YALM_CH10 3/12/08 12:10 PM Page 234

the three areas are 32 percent, 68 percent, and 94 percent for teenagersand 5 percent, 29 percent, and 86 percent for prime-age adult men. Self-employment (columns 2 and 3 together) describes respectively 27 percent,17 percent, and 2 percent of teenagers and 40 percent, 34 percent, and5 percent of prime-age adult men. One possible interpretation of thesefigures is that paid employment might require a lengthy job search, andself-employment might require either capital or access to credit, withboth these conditions probably harder to fulfill for younger individuals.1
In general, workers in urban areas tend to work more hours. Prime-age adult men work on average 58 hours a week in Dar es Salaam and62 hours in other urban areas. In rural areas, average hours of work arelower, about 55 hours. Both teens and young adults tend to work lessthan prime-age adult men, but patterns across areas largely reflect thoseof prime-age adult men. The average number of hours of work amongmale teenagers is about 53 in Dar es Salaam, 44 in other urban areas, and43 in rural areas. For young men, these numbers are 58, 58, and 53.
A nonnegligible proportion of individuals in Tanzania hold at leasttwo jobs. Multiple job holding is particularly widespread in other urbanareas and rural areas and is more common among prime-age adult menthan among teenagers and young adults. For example, only 2 percent ofyoung adults in employment have a second job in Dar es Salaam, com-pared with about 8 percent of prime-age adult men. In rural areas thesefigures are 18 percent and 24 percent. Overall, it appears that youthwork fewer hours than prime-age adult men and are less likely to holdmore than one job.
Do these differences in hours worked across different age groups reflectdifferences in either the supply of or the demand for labor? In an admit-tedly imperfect measure of the imbalance between demand and supply ofhours of work across age groups, an indicator of underemployment isreported in table 10.2, column 8. This measures the proportion of individ-uals who work fewer than 40 hours a week and declare a desire to workmore hours. It is interesting to observe that this proportion is always thehighest among youth. For instance, in Dar es Salaam 7 percent of teenagersand 4 percent of young adults declare being underemployed. For prime-age adult men in Dar es Salaam, this proportion is only 1 percent. In ruralareas the corresponding proportions are, respectively, 5 percent, 6 percent,and 3 percent.
Teenage girls appear to be more likely to work as employees thanteenage boys in urban areas (52 percent and 17 percent in Dar es Salaamand other urban areas, respectively, versus 41 percent and 15 percent) and
Youth in the Labor Market and the Transition from School to Work in Tanzania 235
WB62_YALM_CH10 3/12/08 12:10 PM Page 235

less likely to work in the family enterprise. Changes in the distribution ofwomen’s employment over the life cycle also appear rather different frommen’s. As with men, the proportion in nonagricultural self-employmentrises with age in each area (from 27 percent to 56 percent in Dar esSalaam, from 13 percent to 36 percent in other urban areas, and about2 percent in rural areas), and the proportion in unpaid nonagriculturalfamily work falls (from 15 percent to less than 1 percent in Dar es Salaam,from 21 percent to 3 percent in other urban areas, and from 5 percent to1 percent in rural areas). However, in contrast to men, the proportion insalaried employment falls with age or stays constant, while engagementin the household farm rises in Dar es Salaam. In urban areas, prime-ageadult working women are less likely to be in paid employment or to beself-employed with employees than men, and they are more likely to beself-employed with no employees or to work in the family enterprise thanprime-age adult men. In rural areas, most working women tend to engagein work on the household farm. These women account for 94 percent ofworking women in rural areas (compared with 85 percent of workingmen). These patterns might reflect different opportunities in access tosalaried employment for women compared with men, possibly because oftheir poor labor market characteristics (for example, education) or as aresult of gender discrimination.The need to take care of children and fami-lies might also make salaried dependent employment a less attractiveoption for women in Tanzania.
Information on hours shows that on average women tend to workfewer hours than men. Differences in average hours of work betweenprime-age adult women and men vary from nine fewer in urban areas tosix fewer in rural areas. The same does not apply to teenage girls: theaverage differences in hours of work among teenage girls and boys rangefrom three more hours in Dar es Salaam to one less hour elsewhere. Thisis consistent with the notion that women tend to engage increasingly inhousehold chores, although an alternative explanation may be thatwomen who start to work at very early ages are those with the highermarginal utility of consumption relative to leisure, that is, those frompoorer backgrounds or whose leisure their parents value less, hence thosewho provide more hours in the market. Underemployment is higher forfemales than for males. For example, 14 percent of female young adultsin Dar es Salaam declare being underemployed, compared with only4 percent of male young adults.
In sum, the career profiles of men and women appear to be ratherdifferent. As they become older, urban men tend to move away fromwork in the household enterprise or farm toward salaried employment
236 Kondylis and Manacorda
WB62_YALM_CH10 3/12/08 12:10 PM Page 236

Youth in the Labor Market and the Transition from School to Work in Tanzania 237
and self-employment. At the same time, they tend to work more hours.This change may reflect a combination of true job changes and the factthat those who leave school later are more likely to engage in salariedwork or self-employment. A large majority of working men in ruralareas work on the household farm, although they too tend to movetoward salaried employment and self-employment as they age.
As they grow older, women in urban areas increasingly work forthemselves (with no employees) or on the family farm. In part, this mayreflect a move away from salaried employment due to the need for moreflexible working arrangements to attend to domestic duties. In ruralareas, women’s participation is higher at every age, and there is littleindication that rural women withdraw from the labor market. Almost allthese women work on the household farm. Women tend to work fewerhours than men, but they are also more likely to report being under-employed. In this sense, the lower labor market attachment of womendoes not seem to be attributable entirely to their lower labor supply.There is evidence that women in Tanzania find it particularly difficult toaccess the labor market in urban areas, probably because of a combina-tion of discrimination and lower market skills.
Inactivity and UnemploymentNot surprising, activity rates increase with age and are lowest in Dar esSalaam and highest in rural areas among teenagers and young adults,paralleling patterns of employment. Activity rates among teenagersincrease from 39 percent for boys and 47 percent for girls in Dar esSalaam to 77 percent in rural areas (table 10.3). Activity rates for youngadults vary between 79 percent for men and 68 percent for women inDar es Salaam and 94 percent in rural areas. For prime-age adult men,participation is almost universal, with the proportion of inactive indi-viduals varying between 1 percent in Dar es Salaam and 3 percent inrural and other urban areas. Unemployment rates—defined as the ratioof the number of (strictly) unemployed individuals to the number ofactive individuals (ILO 2000)—are remarkably high among teenagersand young adults in urban areas. There is virtually no unemployment inrural areas. For teenage males, these rates range from 47 percent in Dares Salaam to 13 percent in other urban areas. Similar patterns emergeamong young adult males: unemployment rates are about 40 percent inDar es Salaam and 11 percent in other urban areas. Of interest, unem-ployment rates are virtually zero among prime-age adult men. Maleunemployment in Tanzania is hence primarily an urban phenomenondisproportionately affecting young workers.
WB62_YALM_CH10 3/12/08 12:10 PM Page 237

Tab
le 1
0.3.
Act
ivit
y an
d U
nem
plo
ymen
t Sta
tus
in T
anza
nia
, 200
0/01
(per
cent
, exc
ept w
here
oth
erw
ise in
dica
ted)
Une
mpl
oym
ent-
Avai
labl
e an
dVe
ryU
nem
ploy
men
tto
-pop
ulat
ion
not s
earc
hing
Not
Long
-ter
mlo
ng-t
erm
Une
mpl
oym
ent
Item
Activ
era
tera
tiofo
r wor
kav
aila
ble
unem
ploy
men
tun
empl
oym
ent
dura
tion
(yea
rs)
Mal
esD
ar e
s Sal
aam
Teen
s38
.646
.518
.02.
75.
448
.726
.53.
60Yo
ung
adul
ts79
.040
.332
.02.
07.
379
.848
.89.
13Pr
ime-
age
adul
ts
98.9
1.5
2.0
0.4
0.7
59.9
49.9
3.39
Oth
er u
rban
Teen
s49
.812
.66.
03.
58.
270
.152
.55.
03Yo
ung
adul
ts85
.010
.69.
01.
67.
773
.764
.65.
66Pr
ime-
age
adul
ts
96.5
1.7
2.0
0.5
3.0
49.3
36.7
1.97
Rura
lTe
ens
77.3
1.6
1.0
2.5
3.7
24.5
20.8
1.78
Youn
g ad
ults
93.6
1.5
1.0
1.9
3.2
26.5
15.6
1.73
Prim
e-ag
e ad
ults
97
.40.
71.
00.
71.
833
.423
.71.
68
238
WB62_YALM_CH10 3/12/08 12:10 PM Page 238

Fem
ales
Dar
es S
alaa
mTe
ens
46.6
43.1
20.0
6.1
7.0
59.9
37.3
4.72
Youn
g ad
ults
67.9
44.9
31.0
9.1
18.5
61.9
43.2
5.89
Prim
e-ag
e ad
ults
77
.810
.99.
05.
616
.649
.844
.52.
81
Oth
er u
rban
Teen
s47
.25.
73.
011
.813
.866
.356
.33.
51Yo
ung
adul
ts75
.010
.48.
08.
314
.378
.463
.45.
43Pr
ime-
age
adul
ts
90.6
1.5
1.0
4.1
5.3
83.8
61.6
9.27
Rura
lTe
ens
76.7
0.7
1.0
3.1
3.8
26.6
22.2
1.63
Youn
g ad
ults
93.5
1.2
1.0
2.1
3.9
31.0
19.0
1.58
Prim
e-ag
e ad
ults
95
.40.
40
0.7
3.9
22.4
18.9
1.43
Sour
ce: I
nteg
rate
d La
bour
For
ce S
urve
y 20
00/0
1.
Not
e:“A
ctiv
e”an
d “u
nem
ploy
men
t rat
e”ar
e as
def
ined
by
ILO
.
239
WB62_YALM_CH10 3/12/08 12:10 PM Page 239

Activity rates are higher among teenage girls than teenage boys inDar es Salaam. In other urban areas, females are slightly less likely to beactive than males. In rural areas there is no significant difference betweenthe activity rates of teenage boys and girls. Although female activity ratesincrease with age, the rise is less pronounced than for males. As a result,men overtake women by the time they reach prime age. However, at leastas high a proportion of active women are unemployed. Unemploymentrates in Dar es Salaam are 43 percent among female teenagers (3 per-centage points less than males), 45 percent among female young adults(5 percentage points more than men), and 11 percent among prime-agewomen (9 percentage points more than men). In other urban areas,females are less likely to be unemployed than males in their teens (6 per-cent compared with 13 percent) but equally likely to be unemployedat ages 20–24. As with males, there is virtually no unemployment inrural areas.
In urban areas, long-term unemployment accounts for at least half oftotal unemployment. The average unemployment duration is remarkablyhigh in urban areas, especially for young adults.2 In Dar es Salaam it rangesfrom 3.6 years for male teenagers to 9.1 years for young adults. In otherurban areas the average duration is 5.0 years for male teenagers and 5.7years for young adults. Among adult men, the duration of unemploymentis higher in Dar es Salaam (3.4 years) than in other urban areas (2.0 years).
The rate of long-term unemployment is particularly high amongyoung adults, among whom it accounts for more than 70 percent ofunemployment. Among prime-age men it accounts for 36–60 percentof unemployment.
Females are generally unemployed for shorter periods than males,except for teenagers in Dar es Salaam. The average duration of unem-ployment among young adults in Dar es Salaam is 5.9 years for womenand 9.1 years for men; in other urban areas average duration is 5.4 yearsfor women and 5.7 years for men. The fact that a nonnegligible propor-tion of women enter into inactivity, an option largely unavailable to men,may explain why observed durations are shorter for women.
In rural areas, where unemployment is almost nonexistent, the fewwho declare being unemployed return to employment more rapidly.Long-term unemployment represents 25–33 percent of rural unemploy-ment and decreases with age.
Do these data provide a good indication of the extent of the jobless-ness of different age groups? If individuals who are out of school have alower probability of finding jobs, these figures overestimate the extent of
240 Kondylis and Manacorda
WB62_YALM_CH10 3/12/08 12:10 PM Page 240

unemployment for a random individual in an age group. By contrast, ifthose who have no job opportunities stay in school or declare themselvesinactive, these figures underestimate the extent of unemployment for arandom individual in an age group.
An alternative measure of joblessness relates the number of unem-ployed to the entire population, regardless of whether these individualsare in school (or even active). Even if unemployment is standardized toa much larger population at risk (that is, the entire population in an agegroup), unemployment is still higher among young adults and teenagersthan among prime-age adults.
Not all of those out of work (or school) are unemployed: some are avail-able to take a job if offered and some are unavailable for work. These aregroups with lower labor market attachment. The proportion of individu-als who are available to work but declare not having searched for work theprevious week is small at all ages and in all areas. It is most prevalentamong teenagers, about 3 percent of whom fall into this category.
A significant percentage of youth are not available: 5 percent ofteenagers and 7 percent of young adults in Dar es Salaam, 8 percent forboth age groups in other urban areas, and 4 percent of teenagers and3 percent of male young adults in rural areas. These figures make theextent of joblessness even more worrisome and suggest that unemploy-ment ratios may understate the magnitude of the problem.
Reasons for InactivityA large proportion of respondents indicate that they are not looking fora job because of their low expectations of finding one (table 10.4). Thisproportion is particularly high for teenagers and young adults in urbanareas. In Dar es Salaam, 65 percent of teenage boys, 60 percent ofteenage girls, and 67 percent of female young adults report this as themain reason for not looking for a job.
A significant share of those not looking report that they are waiting fora reply to a job application or waiting for a job to start. No systematic pat-terns are observed across areas or age groups, with figures ranging from5 percent to 100 percent depending on age, gender, and location.
In both rural and urban areas, a large proportion of young peoplereport not looking for work because of household responsibilities (exceptfor male youth in Dar es Salaam). In rural areas, 31 percent of male and29 percent of female teenagers and 38 percent of male and 47 percent offemale young adults report that household duties prevent them fromlooking for work. In urban areas other than Dar es Salaam, 18 percent of
Youth in the Labor Market and the Transition from School to Work in Tanzania 241
WB62_YALM_CH10 3/12/08 12:10 PM Page 241

Tab
le 1
0.4.
Rea
son
s W
hy T
anza
nia
ns
Are
Not
Loo
kin
g fo
r or A
re N
ot A
vaila
ble
for W
ork
(per
cent
)
Reas
on n
ot lo
okin
gRe
ason
not
ava
ilabl
e(1
) (2
)(4
)(5
)(7
)Th
ough
t W
aitin
g (3
)H
ouse
hold
Tem
pora
rily
(6)
Hou
seho
ld(8
)(9
)Ite
mw
ould
not
find
for j
ob o
r rep
lyO
ff-se
ason
dutie
sill
Oth
erdu
ties
IllO
ther
Mal
esD
ar e
s Sal
aam
Teen
s64
.513
.60
3.2
3.6
15.2
28.0
11.3
60.7
Youn
g ad
ults
25.6
32.5
02.
70
39.3
18.7
24.7
56.6
Prim
e-ag
e ad
ults
010
0.0
00
00
010
0.0
0
Oth
er u
rban
Teen
s28
.348
.80
7.5
1.5
13.9
25.8
31.7
42.5
Youn
g ad
ults
51.8
21.8
018
.00
8.3
16.9
15.7
67.4
Prim
e-ag
e ad
ults
16.2
7.0
38.3
00
38.5
12.6
83.4
4.0
Rura
lTe
ens
17.4
22.1
8.3
30.7
1.3
20.2
22.7
45.9
31.4
Youn
g ad
ults
19.9
27.9
8.7
37.6
05.
910
.558
.630
.9Pr
ime-
age
adul
ts33
.839
.417
.79.
10
03.
292
.14.
7
242
WB62_YALM_CH10 3/12/08 12:10 PM Page 242

243
Fem
ales
Dar
es S
alaa
mTe
ens
60.0
8.5
012
.51.
018
.143
.017
.639
.4Yo
ung
adul
ts67
.52.
70
24.6
05.
273
.115
.111
.7Pr
ime-
age
adul
ts42
.919
.916
.717
.00
3.6
77.8
20.1
2.1
Oth
er u
rban
Teen
s16
.728
.91.
748
.00
4.8
40.5
18.1
41.4
Youn
g ad
ults
15.4
17.9
3.5
47.1
1.8
14.4
45.8
27.6
26.6
Prim
e-ag
e ad
ults
36.5
20.5
10.3
29.1
03.
746
.446
.96.
8
Rura
lTe
ens
17.2
18.3
20.8
28.6
015
.11
21.4
54.9
23.7
Youn
g ad
ults
22.4
5.2
18.5
46.6
07.
424
.357
.118
.6Pr
ime-
age
adul
ts47
.225
.314
.30
8.1
5.0
12.8
85.8
1.4
Sour
ce: I
nteg
rate
d La
bour
For
ce S
urve
y 20
00/0
1.
WB62_YALM_CH10 3/12/08 12:10 PM Page 243

244 Kondylis and Manacorda
male young adults, 48 percent of female teens, and 47 percent of femaleyoung adults cite this reason. “Inactivity” thus appears to hide someproductive employment in the household, leading to an overestimate ofthe true extent of joblessness among young people.
Many inactive young people report being unavailable for work becauseof illness or disability. The figures are particularly high among urbanteenage boys (32 percent), rural male young adults (59 percent), andrural female teens (55 percent) and young adults (57 percent).These veryhigh figures probably reflect the impact of the HIV/AIDS epidemic.3
The proportion of people available for work but not looking is muchhigher among females than among males (table 10.3). In Dar es Salaam9 percent of female young adults (compared with 2 percent of males)are available but not searching; 18 percent of young women (comparedwith 7 percent of young men) are idle (not available). Idleness is low andstable over age groups in rural areas.
More than half of female teenagers and young adults in Dar es Salaamnot looking for a job report that they are not looking because they do notbelieve they will find a job. Women are more likely than men to reportnot looking for family reasons. Not surprisingly, a higher proportion ofidle women report household duties as the main reason for not beingavailable for work. This proportion tends to increase with age in urbanareas, consistent with the notion that inactive women are engaged inproductive work at home.
Job Search MethodsTanzanians use a variety of methods to search for jobs (table 10.5).Formal inquiries of potential employers is the most widespread method.As individuals age, they are less likely to use informal search channels(asking friends or relatives) than to ask employers or to attempt to starttheir own businesses. Young people are more likely than prime-age adultsto use informal channels, perhaps because they have a smaller chance offinding jobs through formal job applications. No substantial differencesemerge in the patterns of job search between males and females.
SummaryUrban unemployment is primarily a youth phenomenon in Tanzania (anda problem for prime-age adult women in Dar es Salaam). Unemploymentfigures probably underestimate the extent of joblessness, because a smallproportion of individuals declare that they are available but are not lookingfor work because of their low expectations of finding a job. Inactivity ratesare also remarkably high (although some inactive people are engaged in
WB62_YALM_CH10 3/12/08 12:10 PM Page 244

Youth in the Labor Market and the Transition from School to Work in Tanzania 245
household chores). A small but nonnegligible proportion of Tanzanians areinactive because of health reasons (4 percent of men and 2 percent ofwomen between the ages of 20 and 25 in Dar es Salaam). It is plausible thatthe inactivity rates reflect the widespread prevalence of HIV/AIDS.
Women seem to fare worse than men. Although dropping out of thelabor force is an option for a nonnegligible proportion of women in urbanareas, possibly itself the result of lower labor demand, joblessness remainshigher for women even conditional on participation.
Long-term unemployment is particularly widespread, especiallyamong young adults. Rather than cycling in and out of the labor marketin an attempt to gain employment for life, young adults in urban Tanzania
Table 10.5. Job Search Methods in Tanzania(percent)
Inquired with Found job through Attempted to startItem employer family or friends own business
MalesDar es SalaamTeens 75.3 19.0 5.7Young adults 58.4 30.8 10.9Prime-age adults 64.3 8.9 26.8
Other urbanTeens 67.8 28.6 2.2Young adults 79.3 12.9 7.8Prime-age adults 89.5 0 10.5
RuralTeens 39.7 25.9 28.1Young adults 51.1 20.2 24.8Prime-age adults 64.6 5.9 29.6
FemalesDar es SalaamTeens 55.2 38.4 5.2Young adults 53.6 29.2 17.2Prime-age adults 36.5 19.4 41.2
Other urbanTeens 63.1 21.9 15.0Young adults 59.1 17.4 20.3Prime-age adults 56.9 12.0 31.2
RuralTeens 44.3 0 55.7Young adults 67.7 0 27.6Prime-age adults 69.1 0 30.9
Source: Integrated Labour Force Survey 2000/01.
WB62_YALM_CH10 3/12/08 12:10 PM Page 245

remain out of the labor force for very long periods. Females tend to beunemployed for shorter periods than males, probably because some ofthem transition to inactivity, an option rarely pursued by males.
Prime-age women have very high rates of unemployment and under-employment in Dar es Salaam. Participation is also lower for females inother urban areas. Although this may signal that their productivity athome is higher than the wage they are offered in the market (or thatthey have stronger preferences for home production relative to marketactivities), it may also reflect poor labor market prospects.
Unemployment and underemployment are not major problems inrural areas, where both participation and employment are high. Thesestatistics, of course, reveal nothing about the quality of jobs these indi-viduals hold or their standards of living.
Determinants of Labor Force Status among Youth
This section investigates the labor force status and schooling choices ofteenagers and young adults using simple regression tools. It examines therole of aggregate indicators of the state of the local labor market and theindividual characteristics that predict employment, unemployment, andschool attendance.
For different labor market outcomes Y, we run the regression
(1)
where i denotes a generic individual living in region R, the X ′Rs denote
regional characteristics, the X′is denote individual characteristics, and u is
an error term.One might expect lack of job opportunities to be a major factor
explaining the poor labor market outcomes of teenagers and youngadults in Tanzania; if wages are far from perfectly flexible, low labordemand will increase joblessness. To measure the level of local labordemand, the ratio of the employment of prime-age adults to the popu-lation in the region of residence is used. Employment of prime-age indi-viduals is used because they are presumably the group with the highestlabor market attachment and the group in which employment is mostlikely to be exogenous to that of youth.4
A rise in the supply of young workers is likely to have an effect on theiremployment prospects. The model includes the share of teenagers andyoung adults in the working-age population (ages 15–60) in each region.
Y 0 1 2iR R i iRX X u= + + +β β β′ ′ ′
246 Kondylis and Manacorda
WB62_YALM_CH10 3/12/08 12:10 PM Page 246

Because rural-to-urban migration is high in Tanzania (about 28 percent allteenagers and young adults in urban areas are rural migrants), only thosewho report being born in the area are included. This allows us to controlfor the potential bias that would stem from endogenous migration. Ifmigration toward cities in which labor demand is stronger is greater (seeCard 2001), including the share of all young residents (rather than onlynatives) would overestimate the (presumably negative) correlationbetween youth labor supply and the youth employment rate.5
Average travel time to the closest secondary school (in hours) isincluded as an additional measure of local opportunities. These datacome from the 2000/01 Household Budget Survey (NBS 2002). Thedata were aggregated by region and rural-urban status and this variablewas included on the right-hand side of the regressions.
A number of individual controls are also included. The first is adummy variable denoting whether the individual received any type oftraining in his or her life. This includes both on-the-job training, suchas apprenticeship, and off-the-job training, such as formal vocationaleducation. The second is a dummy variable indicating whether theindividual is a migrant, which measures returns to migration. Becausethe aim is to investigate the role of individuals’ family backgrounds indetermining their labor market outcomes, we also include the averageyears of education of the head of household.
All of the regressions control for the following covariates: Four educa-tion dummy variables are included—never attended school (zero years ofeducation), incomplete primary (one to six years of completed education),completed primary (seven years of completed education), and at least oneyear of secondary education (eight or more years of education). To controlfor the circumstance that labor force participation rises and school atten-dance falls as individuals get older, unrestricted dummy variables areincluded for potential experience.To control for different household struc-tures, dummy variables are included for the individual’s relationship to thehousehold head (head, spouse, child, other relative, domestic employee, orunrelated family member). Quarter-of-year dummy variables are alsoincluded to allow for potential seasonal patterns in employment.To controlfor potentially unobserved differences between Dar es Salaam and otherurban areas, we include a dummy variable for residence in Dar es Salaam.6
Standard errors are clustered by region of residence.The regression coefficients (table 10.6) should be interpreted with
caution. Ideally, only exogenous variables should appear on the right-hand side to keep the ordinary least squares estimates consistent; this is
Youth in the Labor Market and the Transition from School to Work in Tanzania 247
WB62_YALM_CH10 3/12/08 12:10 PM Page 247

Tab
le 1
0.6.
Det
erm
inan
ts o
f Lab
or F
orce
Sta
tus
and
Sch
oolin
g C
hoi
ces
of Y
outh
in T
anza
nia
(1)
(2)
(3)
(4)
(5)
(6)
Scho
ol a
nd
No
wor
k an
d Ite
mW
orka
Scho
olb
wor
kcW
ork
only
dSc
hool
eno
sch
oolf
Mal
esU
rban
Adul
t em
ploy
men
t rat
e1.
075*
*0.
092
0.58
1**
0.49
4**
–0.4
89*
–0.5
86**
(0.3
78)
(0.1
86)
(0.2
28)
(0.2
18)
(0.2
68)
(0.2
77)
Yout
h sh
are
–0.4
80**
0.00
4–0
.322
***
–0.1
590.
326*
*0.
154
(0.2
13)
(0.1
18)
(0.1
10)
(0.1
38)
(0.1
35)
(0.1
76)
Tim
e to
sch
ool
0.05
50.
111
0.05
00.
005
0.06
1–0
.116
(0.1
12)
(0.0
81)
(0.0
67)
(0.0
79)
(0.0
87)
(0.0
91)
Trai
ning
0.13
7***
–0.1
85**
*–0
.004
0.14
1***
–0.1
81**
*0.
044
(0.0
24)
(0.0
23)
(0.0
13)
(0.0
25)
(0.0
22)
(0.0
28)
Mig
rant
–0.0
34–0
.052
*–0
.009
–0.0
24–0
.043
*0.
077
(0.0
38)
(0.0
26)
(0.0
15)
(0.0
34)
(0.0
22)
(0.0
46)
Hea
d of
hou
seho
ld e
duca
tion
0.00
10.
020*
**–0
.004
0.00
60.
024*
**–0
.025
***
(0.0
07)
(0.0
04)
(0.0
05)
(0.0
04)
(0.0
07)
(0.0
03)
Num
ber o
f obs
erva
tions
2,00
42,
004
2,00
42,
004
2,00
42,
004
R–sq
uare
d0.
331
0.51
70.
241
0.38
10.
427
0.16
3
Rura
lAd
ult e
mpl
oym
ent r
ate
0.76
20.
141
0.54
40.
218
–0.4
02–0
.360
*(0
.465
)(0
.182
)(0
.390
)(0
.221
)(0
.440
)(0
.181
)Yo
uth
shar
e0.
275
0.06
60.
199
0.07
6–0
.133
–0.1
42(0
.334
)(0
.140
)(0
.337
)(0
.164
)(0
.300
)(0
.114
)Ti
me
to s
choo
l–0
.044
–0.0
04–0
.025
**–0
.019
0.02
10.
024
(0.0
26)
(0.0
07)
(0.0
12)
(0.0
18)
(0.0
14)
(0.0
19)
248
WB62_YALM_CH10 3/12/08 12:10 PM Page 248

Trai
ning
0.03
2–0
.094
***
–0.0
40**
0.07
2***
–0.0
54**
*0.
022
(0.0
23)
(0.0
24)
(0.0
15)
(0.0
24)
(0.0
14)
(0.0
27)
Mig
rant
–0.0
07–0
.009
0.01
6–0
.023
–0.0
250.
031
(0.0
37)
(0.0
13)
(0.0
20)
(0.0
28)
(0.0
17)
(0.0
31)
Hea
d of
hou
seho
ld e
duca
tion
–0.0
16**
*0.
010*
*0.
002
–0.0
17**
*0.
009*
*0.
007*
(0.0
02)
(0.0
04)
(0.0
04)
(0.0
04)
(0.0
03)
(0.0
04)
Num
ber o
f obs
erva
tions
3,97
13,
971
3,97
13,
971
3,97
13,
971
R–sq
uare
d0.
150
0.46
40.
247
0.38
00.
197
0.05
9
Fem
ales
Urb
anAd
ult e
mpl
oym
ent r
ate
0.41
0*0.
068
0.06
70.
344*
0.00
2–0
.412
**(0
.197
)(0
.097
)(0
.065
)(0
.181
)(0
.120
)(0
.152
)Yo
uth
shar
e–0
.652
*0.
165
–0.1
64–0
.488
0.32
9**
0.32
3(0
.326
)(0
.179
)(0
.136
)(0
.288
)(0
.147
)(0
.278
)Ti
me
to s
choo
l–0
.002
0.07
50.
023
–0.0
260.
052
–0.0
50(0
.189
)(0
.098
)(0
.082
)(0
.163
)(0
.062
)(0
.193
)Tr
aini
ng0.
148*
*–0
.177
***
–0.0
27**
0.17
4***
–0.1
50**
*0.
003
(0.0
59)
(0.0
24)
(0.0
10)
(0.0
53)
(0.0
27)
(0.0
52)
Mig
rant
0.03
1–0
.036
–0.0
070.
038
–0.0
29–0
.001
(0.0
38)
(0.0
21)
(0.0
18)
(0.0
46)
(0.0
22)
(0.0
34)
Hea
d of
hou
seho
ld e
duca
tion
–0.0
150.
013
–0.0
10–0
.005
0.02
3***
–0.0
08(0
.012
)(0
.009
)(0
.007
)(0
.007
)(0
.008
)(0
.011
)N
umbe
r of o
bser
vatio
ns2,
383
2,38
32,
383
2,38
32,
383
2,38
3R-
squa
red
0.27
20.
446
0.16
10.
311
0.38
40.
196
(con
tinue
d)
249
WB62_YALM_CH10 3/12/08 12:10 PM Page 249

Tab
le 1
0.6.
Det
erm
inan
ts o
f Lab
or F
orce
Sta
tus
and
Sch
oolin
g C
hoi
ces
of Y
outh
in T
anza
nia
(con
tinue
d)
(1)
(2)
(3)
(4)
(5)
(6)
Scho
ol a
nd
No
wor
k an
d Ite
mW
orka
Scho
olb
wor
kcW
ork
only
dSc
hool
eno
sch
oolf
Rura
lAd
ult e
mpl
oym
ent r
ate
0.07
90.
368*
**0.
168
–0.0
890.
200
–0.2
79(0
.540
)(0
.123
)(0
.323
)(0
.301
)(0
.338
)(0
.283
)Yo
uth
shar
e–0
.017
–0.0
25–0
.041
0.02
50.
016
0.00
1(0
.285
)(0
.093
)(0
.165
)(0
.191
)(0
.212
)(0
.152
)Ti
me
to s
choo
l–0
.017
–0.0
28**
*–0
.023
**0.
006
–0.0
050.
022
(0.0
19)
(0.0
04)
(0.0
10)
(0.0
14)
(0.0
11)
(0.0
13)
Trai
ning
0.04
6*–0
.085
**–0
.030
0.07
6***
–0.0
55**
*0.
009
(0.0
24)
(0.0
30)
(0.0
22)
(0.0
21)
(0.0
19)
(0.0
31)
Mig
rant
–0.0
10–0
.009
–0.0
06–0
.004
–0.0
030.
013
(0.0
28)
(0.0
12)
(0.0
11)
(0.0
32)
(0.0
06)
(0.0
28)
Num
ber o
f obs
erva
tions
2,38
32,
383
2,38
32,
383
2,38
32,
383
R–sq
uare
d0.
272
0.44
60.
161
0.31
10.
384
0.19
6
Sour
ce:I
nteg
rate
d La
bour
For
ce S
urve
y 20
00/0
1.N
ote:
Stan
dard
erro
rs in
par
enth
eses
. *
Sign
ifica
nt a
t the
10
perc
ent l
evel
.**
Sig
nific
ant a
t the
5 p
erce
nt le
vel.
***
Sign
ifica
nt a
t the
1 p
erce
nt le
vel.
a. P
roba
bilit
y of
wor
king
, reg
ardl
ess
of w
heth
er in
sch
ool.
b. P
roba
bilit
y of
bei
ng in
sch
ool,
rega
rdle
ss o
f whe
ther
wor
king
.c.
Pro
babi
lity
of c
ombi
ning
wor
k an
d sc
hool
.d.
Pro
babi
lity
of o
nly
wor
king
.e.
Pro
babi
lity
of o
nly
goin
g to
sch
ool.
f. Pr
obab
ility
of n
eith
er w
orki
ng n
or g
oing
to s
choo
l.
250
WB62_YALM_CH10 3/12/08 12:10 PM Page 250
Youth in the Labor Market and the Transition from School to Work in Tanzania 251
probably not the case here. If individuals with otherwise better labormarket prospects are more likely to acquire education and receive train-ing, the erroneous conclusion might be drawn that education and trainingboost employment. Similar concerns arise with the variables capturingthe age and education structure of the household or the child’s relation-ship to the household head, because living arrangements may be endoge-nous to latent labor market outcomes. Along the same lines, one has to beextremely cautious in interpreting the coefficient on the migrant dummyvariable as the causal effect of migration. Those who migrate are mostlikely those with larger potential gains from or lower costs of migration(Borjas 1999). Their performance can thus not be extrapolated to thepopulation of potential migrants at large.
Among urban males, a 10 percentage point rise in adult employmentleads to an increase in youth employment of about 10 percentage points(column 1).The increase does not affect school attendance. However, a risein local labor demand leads to a significant increase in both the probabilityof combining work and school (0.58) and the probability of working fulltime (0.49) (columns 3 and 4). The rise in employment following a risein local labor demand hence comes in about equal proportions from a risein part-time work among students and a decline in inactivity (column 6).
Local labor supply also affects urban males’ labor force status. A 10percentage point rise in the share of youth in the working-age popula-tion leads to a drop in employment of 4.8 percentage points and a risein full-time school attendance of 3.3 percentage points.An improvementin the state of the local labor market appears to have no effect on overallschool attendance, but it tends to reduce the share of urban males whocombine work and school.
Distance from school (proxied by time to school) does not appear tobe a binding constraint for urban males. Training is associated with high-er employment and lower schooling. This could mean that trainingboosts employment. Alternatively, it could mean that people who areworking or have a higher probability of working are more likely toreceive training. Migrant males are less likely to be in school, but thereis no apparent correlation with employment or inactivity. The negativeeffect of migration on school attendance probably reflects the fact thatmost individuals migrate after they have left school. Higher householdeducation increases males’ probability of school attendance and reducesjoblessness. One additional year of education by all other householdmembers is associated with a rise in school attendance of 2 percentagepoints and a drop in joblessness of 2.5 percentage points. This suggests
Youth in the Labor Market and the Transition from School to Work in Tanzania 251
WB62_YALM_CH10 3/12/08 12:10 PM Page 251

252 Kondylis and Manacorda
that family background is an important predictor of labor market out-comes in Tanzania: urban individuals from more educated householdsare more likely to be in school and less likely to be inactive.
Results in rural areas are qualitatively similar. Neither local labordemand nor the youth share of the labor force has a statistically signifi-cant effect on males’ labor force status, probably because most maleswork on the household farm. An alternative explanation is that emigra-tion from rural areas occurs when labor market opportunities weaken, sothat youth employment falls as labor supply increases, leading to a regres-sion coefficient that is biased toward zero.
Unlike in urban areas, distance to school appears to be an importantdeterminant of youth labor force status in rural areas.This is consistent withthe notion that distance to school acts as a fixed cost of school attendance,reducing the incentives for individuals to combine work and school.
The coefficients on the other variables appear in line with those inurban areas. As in urban areas, higher household education increasesschool attendance, but in rural areas it is associated with a decline inemployment and a slight rise in inactivity. Males from more privilegedbackgrounds give up work in exchange for either school or leisure in ruralareas, while in urban areas they stay in school rather than remainingunemployed or inactive.
Results for females are qualitatively similar. One difference is thatchanges in local labor demand appear to affect inactivity and full-timework for urban females. A 10 percentage point increase in employmentof adult women is associated with about a 4 percentage point rise infemale youth employment. Unlike for males, school in combination withwork does not appear to be important for urban females in response tochanges in the state of the local labor market. Aggregate labor supply (asrepresented by the adult employment rate) also appears to be an importantdeterminant of labor force status among females in urban areas. Noappreciable differences can be detected between males and females withregard to the other coefficients.
Local labor market conditions do not appear to matter for females.Surprisingly, stronger labor demand is associated with higher schoolattendance. Distance to school is an important determinant of laborforce status, with longer distance to school associated with a decline inpart-time school attendance and hence an overall fall in school attendancein rural areas.
A number of robustness checks were performed on the data (notreported). First, the ratio of employed prime-age adults to the population
252 Kondylis and Manacorda
WB62_YALM_CH10 3/12/08 12:10 PM Page 252

Youth in the Labor Market and the Transition from School to Work in Tanzania 253
was computed. The fact that some prime-age adults live in the samehouseholds with youth might bias the estimates of the effect of local labordemand. This potential bias stems from the correlation between differenthousehold members’ labor supply arising from reasons other than locallabor demand and supply (for example, patterns of substitution or com-plementarity in individuals’ labor force status within the household oradded worker effects). In fact, the results are essentially unchanged.
Second, adult employment was computed using different age brack-ets for adults. In general, the results are qualitatively similar, althoughless precise.
Third, the effect of local labor demand and supply was estimated,ignoring most of the other (potentially endogenous) covariates includedin the models in table 10.6. We ran these estimates to address the concernthat the inclusion of endogenous variables might affect the consistencyof the estimates of the arguably exogenous indicators for the state of thelocal labor market. Results were qualitatively unchanged, although pointestimates were less precise.
In sum, there is evidence that the labor force status of teenagers andyoung adults in Tanzania is strongly affected by local labor demand, asproxied by adult employment, especially in urban areas. While an increasein local labor demand translates into an increase in employment for bothmales and females, the effect is larger for males, because a nonnegligibleproportion of males (but not females) tend to combine work with schoolas demand increases. For both males and females, stronger local labordemand tends to reduce joblessness—that is, to increase employment ratesamong those who would otherwise have been out of school. There is noevidence that local labor demand affects school stay-on rates. This maysuggest that widespread early dropout in Tanzania is not due to the needfor children to engage in work but rather to the potentially high costs ofor low returns to schooling (for evidence on low returns to education, seeSöderbom and others 2004). This conclusion is consistent with the obser-vation that school in combination with work is not uncommon and thatlabor market prospects are poor in urban areas. At a given level of localdemand, a rise in the aggregate supply of youth to the labor market alsoappears to depress young people’s labor market prospects.
Local labor demand and supply indicators appear to explain little ofthe variation in employment across rural areas.This may be because ruralyouth are disproportionately employed on the household farm andhence isolated from the local labor market. Endogenous out-migrationmay also partly explain the lack of correlation.
Youth in the Labor Market and the Transition from School to Work in Tanzania 253
WB62_YALM_CH10 3/12/08 12:10 PM Page 253

Distance to school appears to be a constraint only in rural areas.Greater distance to school tends to reduce the incentive to combinework with school, reducing school attendance, with no significant effecton work.
Socioeconomic background, as proxied by the average education ofother household members, is a strong predictor of labor force status. It isassociated with a decline in work (in rural areas) and joblessness (inurban areas) and a rise in schooling.
Conclusions and Policy Implications
Joblessness in Tanzania is largely due to the lack of sufficient aggregatedemand for labor relative to aggregate supply. The problem is particu-larly acute among urban teenagers and young adults, who are four tofive times more likely than prime-age adults to be jobless. This ratio ismuch higher than in most developed countries, where youth unemploy-ment is about twice that of prime-age adults (ILO 2000).
The evidence from Tanzania is not consistent with the widespreadview that joblessness in developing countries is a luxury for the betteroff. Youth unemployment does not appear to reflect queuing by youngpeople for rationed well-paying jobs: in urban areas young people frommore advantaged families are more likely to attend school and less likelyto be jobless, suggesting that joblessness is a more severe problem forthe poor.
Girls in urban areas start working earlier than boys, sometimes inmenial jobs characterized by long working hours, but their transition tothe labor market during the life cycle is slower because a substantialproportion of females are absorbed in home production (particularlychildbearing and childrearing). A large number of women classify them-selves as being involuntarily unemployed or underemployed; improve-ments in labor market conditions lead to declines in women’s inactivityrates. These findings indicate that a substantial proportion of women,particularly young women, are inactive because of poor labor marketprospects, suggesting that labor market outcomes for women do notsimply represent culture or preferences.
Despite increasing joblessness in urban areas, migration from rural tourban areas continues to grow. This suggests that the employmentprospects of rural youth may not be rosier than those of their urbancounterparts.
Analysis of the Tanzanian labor market’s inability to absorb all avail-able workers goes beyond the scope of this chapter. One can speculate,
254 Kondylis and Manacorda
WB62_YALM_CH10 3/12/08 12:10 PM Page 254

though, that the economic reforms of the mid-1990s, which put thecountry on a path of fiscal discipline and macroeconomic stabilizationand led to extensive privatization, disproportionately affected thoseattempting to enter the labor market for the first time. The sustainedGDP growth registered since the mid-1990s does not appear to havecompensated for this effect. The increase in the proportion of youth inthe labor market and increasing urbanization have further weakenedthe labor market prospects of recent cohorts of urban workers. Someof the reasons invoked for youth unemployment in developed coun-tries (minimum wages, union power, employment protection legisla-tion, the perverse incentives associated with welfare) are unlikely toapply to Tanzania (or to most developing countries), where the labormarket is largely unregulated, welfare is essentially nonexistent, andunions operate only in the formal public sector (Freeman 1993;LO/FTF 2003).
How do young people cope without jobs? One possibility is thatthey engage in informal work that is not recorded in the IntegratedLabour Force Survey. To the extent that this is the case, the measures ofunemployment and joblessness in this chapter overestimate the natureof the problem. This point merits further research.
A second possibility is that young people engage in illegal activities.Evidence from the United States indicates that criminal behavior isresponsive to labor market opportunities, especially among youth withpoor labor market prospects. This behavior does not show up in theIntegrated Labour Force Survey, although data from the United NationsDevelopment Programme (UNDP 2005) based on victimization ratesindicate very high property crime and robbery rates in Dar es Salaam.Prostitution may be another way for young people to make ends meet.If young people in Tanzania respond to poor labor market prospects byengaging in criminal or hazardous activities, this might provide an addi-tional rationale for policy intervention aimed at the youth unemploy-ment problem.
A third possibility is that households provide support. Young peoplemay live with family members or pool resources with relatives living in dif-ferent households. Migration of some household members from rural tourban areas may be a way for rural households to spread the risk of eco-nomic downturns affecting cities and rural areas differently (Rosenzweig1988). More rural-biased development (after decades of urban bias), inparticular land redistribution, might relieve some of the pressure on theurban labor market (Mjema 1997), although it is not obvious that suchdevelopment can guarantee sustained growth.
Youth in the Labor Market and the Transition from School to Work in Tanzania 255
WB62_YALM_CH10 3/12/08 12:10 PM Page 255

Youth can react to labor market shocks in various ways. One strategyis to stay in school. If the alternative to school is inactivity or unemploy-ment, why do so many youth in Tanzania appear to drop out early in theabsence of work opportunities? We find no evidence that school enroll-ment is affected by the state of the local labor market, although urbanmales are more likely to combine work with school in good times. Inrural areas, distance to school remains an impediment to attendance.Policies aimed at improving stay-on rates, possibly by improving schoolquality and building new schools, could potentially alleviate some of theproblems in the youth labor market.
Another mechanism for coping with joblessness is migration.Potential gains might come from increasing mobility across urban areasby providing more effective information systems about job vacancies.
A third strategy is self-employment. Young people are substantiallyless likely than prime-age adults to be self-employed. Difficulty access-ing credit, a lack of entrepreneurial culture and skills, and a legal frame-work that has long discouraged small (informal) enterprises (Mjema1997) are all likely to explain why this avenue is rarely pursued byTanzanian youth. This seems to suggest room for policy intervention.
The government of Tanzania is not indifferent to the problem ofyouth unemployment. Since the mid-1980s it has implemented policies,and the government, nongovernmental organizations, and internationalorganizations have launched activities. Analysis of the policies proposedand partly implemented during the 1990s suggests that these effortswere generally ineffective (Shitundu 2005).7 Underinvestment, the verylimited number of beneficiaries, mismanagement, lack of coordination,and political patronage among the different agents involved all ham-pered these efforts.
In recent years the government has intervened more actively toreduce youth joblessness, creating the National Youth DevelopmentFund, the Women’s Development Fund, the National EntrepreneurshipFund, and the Local Government Youth and Women DevelopmentFunds. It adopted the National Employment Policy of 1997, the NationalPoverty Eradication Strategy of 1998, the National Youth DevelopmentPolicy, the Poverty Reduction Strategy of 2000, the National Strategy forGrowth and Reduction of Poverty of 2004, the New EmpowermentPolicy of 2004, and the Income Tax Act of 2004.
Several supply-side interventions have been launched. The PrimaryEducation Development Programme of 2002 abolished school fees andis apparently responsible for the unprecedented rise in primary school
256 Kondylis and Manacorda
WB62_YALM_CH10 3/12/08 12:10 PM Page 256

enrollment after more than a decade of stagnation. Access to and qualityof secondary education have also improved, as a result of halving schoolfees, constructing schools, and introducing scholarships (under theSecondary Education Development Programme). Complementary BasicEducation in Tanzania, a program in force since the 1990s to provideremedial education to school dropouts, has proved effective. The ILOproject, Promoting Gender Equality and Decent Work Throughout AllStages of Life, provides apprenticeship and skills training. Efforts toreform the vocational school system (Vocational Training and EducationAuthority and Folk Development Colleges) are on the agenda but still tobe implemented.
Major interventions on the demand side have sought to improve thebusiness climate, provide credit to microentrepreneurs (through, forexample, the Small Entrepreneurs Loan Facility program, cofinanced bythe Inter-African Development Bank and the government), and providepublic jobs with potential training content (through public-private part-nerships, such as the Dar es Salaam Solid Waste Management Programme,the ILO Integrated Urban Employment Promotion, which is part of theJobs for Africa Programme, and Community-Based Programmes under theTanzania Social Action Fund scheme). Other efforts, such as the LaborExchange Centre in Dar es Salaam, are being made to increase the matchbetween the supply of and demand for labor and to strengthen techni-cal capability in government offices dealing with employment issues.
Policy makers appear to be placing much greater emphasis on youthunemployment in Tanzania. Financial resources have increased substan-tially to match the scale of the problem, and a much greater level ofcoordination has been achieved.
Notes
1. A compositional effect is also likely to be at work, because as the labor forceages, an increasing proportion of it is made up of individuals with higher edu-cation. These trends potentially reflect the circumstance that more educatedindividuals are more likely than less educated individuals to enter into paidemployment or to start their own businesses (especially businesses that hireemployees). Regression results (not reported) show that conditional on edu-cation, the probability of being an employee does not increase with age.However, for self-employment with employees there is a pronounced ageevent, even conditioned on education.This suggests that compositional effectsare important in explaining the growth in dependent employment over thelife cycle but not the growth in self-employment with employees.
Youth in the Labor Market and the Transition from School to Work in Tanzania 257
WB62_YALM_CH10 3/12/08 12:10 PM Page 257

258 Kondylis and Manacorda
2. Cross-sectional data typically report information on unemployment durationonly for the unemployed. The simple average of these durations underesti-mates actual unemployment duration, potentially by a large amount. Toderive duration here, we use the following identity, which holds in steadystate: u = i/(i + h), where u is the unemployment rate, i is the inflow rate, andh is the outflow rate (Machin and Manning 1999). In steady state, averageduration equals the reciprocal of the outflow rate (that is, 1/h). To obtainthese figures, we compute unemployment rates as the number of individualsavailable (that is, strict and nonstrict unemployed) divided by the number ofpeople working, in school, or available. We compute inflow rates as the num-ber of people with at most three months of unemployment, standardized tothe sum of those working and those in school.
3. Tanzania has one of highest prevalence rates of HIV/AIDS in Sub-SaharanAfrica. Recent estimates indicate a prevalence of 8.8 percent among thepopulation ages 14–49—considerably higher than the 7.3 percent average for Sub-Saharan Africa (UNDP 2005).
4. After experimenting with the data, we chose individuals ages 35–44, segre-gated by sex.
5. In principle, one would want to reimpute those who migrated to urban areasback to their rural area of origin to measure local labor supply net of out-migration (exactly as we do in urban areas, where migrants are excluded).Unfortunately, the Integrated Labour Force Survey does not identify whereurban migrants come from (except, generically, whether they are from anurban or rural part of the country).
6. This implies that we do not exploit differences between Dar es Salaam andother urban areas to identify the effect of aggregate indicators. These coeffi-cients are completely identified based on differences across other urban areas.Observations from Dar es Salaam, however, contribute to the identification ofthe effect of all other variables in the model.
7. An exception is the microfinance programs implemented during the 1990s,which benefited some young entrepreneurs.
References
Beegle, Kathleen, and K. Burke. 2004. “Why Children Aren’t Attending School:The Case of Rural Tanzania.” Journal of African Economies 13 (2): 333–55.
Beegle, Kathleen, Rajeev Dehejia, and Roberta Gatti. 2006. “Child Labor andAgricultural Shocks.” Journal of Development Economics 81 (1): 80–96.
Blanchflower, David G., and Richard B. Freeman. 2000a. “The Declining EconomicStatus of Young Workers in OECD Countries.” In Youth Employment andJoblessness in Advanced Countries, ed D. G. Blanchflower and R. B. Freeman.Chicago: University of Chicago Press.
WB62_YALM_CH10 3/12/08 12:10 PM Page 258

Youth in the Labor Market and the Transition from School to Work in Tanzania 259
———. 2000b. “Introduction.” In Youth Employment and Joblessness in AdvancedCountries, ed D. G. Blanchflower and R. B. Freeman. Chicago: University ofChicago Press.
Borjas, George. 1999. “The Economic Analysis of Immigration.” In Handbook ofLabour Economics, vol. 3, ed. O. Ashenfelter and D. Card. Amsterdam: Elsevier.
Card, David. 2001. “Immigrant Inflows, Native Outflows, and the Local LabourMarket Impacts of Higher Immigration.” Journal of Labour Economics 19 (1):22–63.
Card, David, and Thomas Lemieux. 2000. “Adapting to Circumstances: TheEvolution of Work, School, and Living Arrangements Among North AmericanYouth.” In Youth Employment and Joblessness in Advanced Countries, ed D. G.Blanchflower and R. B. Freeman. Chicago: University of Chicago Press.
———. 2001.“Can Falling Supply Explain the Rising Return to College for YoungerMen? A Cohort-Based Analysis.” Quarterly Journal of Economics 116 (2):705–46.
Freeman, Richard B. 1991. “Crime and the Employment of Disadvantaged Youths.”NBER Working Paper No. 3875, National Bureau of Economic Research,Cambridge, MA.
———. 1993. “Labor Markets and Institutions in Economic Development.”American Economic Review 83 (2): 403–8.
———. 1996. “Why Do So Many Young American Men Commit Crimes andWhat Might We Do About It?” Journal of Economic Perspectives 10 (1): 25–42.
———. 1999. “The Economics of Crime.” In Handbook of Labour Economics,vol. 3, ed. O Ashenfelter and D. Card. Amsterdam: North-Holland.
Freeman, Richard B., and William M. Rodgers III. 1999. “Area EconomicConditions and the Labor Market Outcomes of Young Men in the 1990sExpansion.” Working Paper No. 7073, National Bureau of Economic Research,Cambridge, MA.
Freeman, Richard B., and David A. Wise. 1982. “The Youth Labor Market Problem:Its Nature, Causes, and Consequences.” In The Youth Labor Market Problem: ItsNature, Causes, and Consequences, ed. R. B. Freeman and D. A. Wise. NBERConference Volume. Chicago: University of Chicago Press.
Government of Tanzania. 2003. “Unemployment Issues: Perspectives from theMinistry of Labour, Youth Development and Sports.” Poverty Policy Week2003: Speeches, Presentations and Papers.
Guarcello, Lorenzo, Marco Manacorda, Furio Rosati, Jean Fares, Scott Lyon, andCristina Valdivia. 2005. “School-to-Work Transitions in Sub-Saharan Africa:An Overview.” Working Paper No. 15, Understanding Children’s WorkProject, Rome.
ILO (International Labour Organization). 2000. Employing Youth: PromotingEmployment-Intensive Growth. Geneva: ILO.
WB62_YALM_CH10 3/12/08 12:10 PM Page 259

260 Kondylis and Manacorda
Koreman, Sanders, and David Neumark. 2000. “Cohort Crowding and Youth LaborMarkets: A Cross-National Analysis.” In Youth Employment and Joblessness inAdvanced Countries, ed D. G. Blanchflower and R. B. Freeman. Chicago:University of Chicago Press.
LO/FTF (Danish Trade Union Council for International Development). 2003.“Profile of the Labour Market and Trade Unions in Tanzania.” Project No.036/002/01, Copenhagen.
Machin, Steve, and Alan Manning. 1999. “The Causes and Consequences of Long-Term Unemployment in Europe.” In Handbook of Labour Economics, vol. 3, ed.O. Ashenfelter and D. Card. Amsterdam: North-Holland.
Mjema, Godwin D. 1997. “Youth Unemployment in Tanzania: New Strategiesfor Combating an Old Problem.” Journal of Population Studies andDevelopment 4 (1).
NBS (National Bureau of Statistics of Tanzania). 2002. “Household Budget Survey2000/01.” Dar es Salaam.
———. 2003. “2000/01 Integrated Labour Force Survey.” Dar es Salaam.
O’Higgins, Niall. 2003. “Trends in the Youth Labour Market in Developing andTransition Countries.” Social Protection Discussion Paper No. 321, World Bank,Washington, DC.
OECD (Organisation for Economic Co-operation and Development). 1996. 1996Employment Outlook. Paris: OECD.
———. 1998. 1998 Employment Outlook. Paris: OECD.
———. 1999. Preparing Youth for the 21st Century: The Transition from Education tothe Labour Market. Paris: OECD.
———. 2000. From Initial Education to Working Life—Making Transitions Work.Paris: OECD.
Rama, Martin. 2003. “The Sri Lankan Unemployment Problem Revisited.” Reviewof Development Economics 7 (3): 510–25.
Rees, Albert. 1986. “An Essay on Youth Joblessness.” Journal of Economic Literature24 (2): 613–28.
Rosenzweig, Mark R. 1988. “Labor Markets in Low-Income Countries.” InHandbook of Development Economics, vol. 1, ed. H. Chenery and T. Srinivasan.Amsterdam: North-Holland.
Ryan, Paul. 2001. “The School-to-Work Transition: A Cross-National Perspective.”Journal of Economic Literature 39 (1): 34–92.
Shitundu, Joseph M. 2005. “Youth Employment Inventory of Existing Policies andProgrammes in Tanzania.” Background Paper, Social Protection Unit, WorldBank, Washington, DC.
WB62_YALM_CH10 3/12/08 12:10 PM Page 260

Söderbom, Måns, Francis Teal, Anthony Wambugu, and Godius Kahyarara. 2004.“The Dynamics of Returns to Education in Kenyan and TanzanianManufacturing.” Working Paper WPS/2003-17, Oxford University, Centre forthe Study of African Economies, Oxford, United Kingdom.
UNDP (United Nations Development Programme). 2005. Human DevelopmentReport 2005. New York: UNDP.
U.S. Census Bureau. 1995. Population Trends Tanzania. PPT/92-10. U.S. Departmentof Commerce, Economics and Statistics Administration, Bureau of the Census,Washington, DC.
Welch, Finis. 1979. “Effects of Cohort Size on Earnings: The Baby Boom Babies’Financial Bust.” Journal of Political Economy 87 (5): S65–S97.
World Bank. 2007. “Tanzania: Sustaining and Sharing Economic Growth—CountryEconomic Memorandum and Poverty Assessment.” Report No. 39021-TZ,World Bank, Washington, DC.
Youth in the Labor Market and the Transition from School to Work in Tanzania 261
WB62_YALM_CH10 3/12/08 12:10 PM Page 261

WB62_YALM_CH10 3/12/08 12:10 PM Page 262

Uganda implemented its universal primary education program in 1997.As a result, primary school enrollment rose from 3 million in 1997 to7.6 million in 2002 (World Bank 2005; Deininger 2003). This chapterexamines how primary school enrollment rates, returns to education, andemployment patterns changed in Uganda after universal primary edu-cation was implemented. The focus is not on estimating the returns toeducation or the labor participation rate but rather on estimating a cred-ible, time-consistent model for two time periods and analyzing thechanges in the estimates.
The chapter first describes how participation in the educational systemchanged over time. It then examines changes in the returns to educationand in the relative shares of formal and informal (or entrepreneurial)employment. It compares sets of repeated cross-sections of Ugandansociety from various household surveys and investigates how different(synthetic) cohorts have fared at similar points in their careers.
C H A P T E R 1 1
How Did Universal PrimaryEducation Affect Returns toEducation and Labor MarketParticipation in Uganda?
Lisa Dragoset and Lars Vilhuber
263
WB62_YALM_CH11 2/21/08 12:05 PM Page 263

Several phenomena may keep children from enrolling in school, evenif it is free. First, households bear the opportunity cost of forgone earn-ings of children in school, a potentially significant barrier to expandingeducation. A large literature discusses the trade-off faced by families indeveloping countries in choosing whether to send children to school orto work, whether at home or on the family farm (Psacharopoulos 1997;Ersado 2005; Drèze and Kingdon 2001; Hazarika and Bedi 2003; Ravallionand Woodon 2000; Burke and Beegle 2004; Ranjan 2000, 2001, 2002;Singh 1992; Gisser 1968). “Engaging in income-generating activities” isthe primary reason why boys and one of the top five reasons why girlsdo not attend school in Uganda, despite universal primary education(World Bank 2003). As the investment climate improves, the earningspotential of these out-of-school children also increases—and with it thelikelihood that at least some children continue to stay away from school.
Second, job opportunities for the educated may be lacking. If jobsare not available once students finish school, schooling merely delaysentry into poverty and there is no incentive to enroll. Acknowledgingthis problem (World Bank 2003), policy makers have implementedpolicies to alleviate credit constraints, improve infrastructure, and createa better business environment—with the goal of facilitating wealthcreation by existing businesses and removing barriers to the creation ofnew enterprises, particularly small businesses and opportunities for self-employment. A better investment climate goes hand in hand with abetter educational system: the educational system creates the skills tofeed the investment climate; a successful economy creates incentivesto participate in the educational system in the first place.
Third, if access to secondary and higher education is not also widelyavailable, participation in primary education falls—again, it only delaysentry into poverty. Demand for primary education may be high as an entryticket to secondary education. According to Appleton, Hoddinott, andKnight (1996), the rate of return to primary education in Uganda may beeven higher than usually estimated if the economy has high demand forpostprimary educated workers and secondary education is easily accessible.Court (1999) studies the impact of changes in the fee structure of Uganda’sMakerere University, finding that enrollment rates doubled as a result offinancing reform.
Fourth, schooling quality may decline as enrollment rates increase.Indeed, Deininger (2003) found that student-teacher ratios rose to nearthe highest in the world, regardless of efforts to increase quality, andthat in 1999, only three-quarters of participating students passed final
264 Dragoset and Vilhuber
WB62_YALM_CH11 2/21/08 12:05 PM Page 264

examinations in primary school. Moll (1996) finds that decreases in schoolquality in South Africa between 1960 and 1990 reduced the returns toprimary education. Many empirical studies demonstrate the importance ofschooling quality for economic growth and increasing returns to education(Lee and Barro 2001; Rangazas 2002; Behrman and Birdsall 1983; Schultz1999; Harmon and Walker 2000; Moll 1992). Fuller, Edwards, and Gorman(1986) find that increases in educational quality had significant effects oneconomic growth in Mexico from 1888 to 1940 but that increases in quan-tity (school expansion) had inconsistent effects. Card and Krueger (1992)show that higher school quality created higher returns to education for menborn in the United States between 1920 and 1949. These findings suggestthat investments in schooling quality must accompany those in universalprimary education for the increase in primary school enrollment rates totranslate into higher human capital and social welfare.
Education and Earnings in Uganda
The education-earnings profile in Uganda is steep—more schooling trans-lates rapidly into more income—suggesting that families have positiveincentives to send their children to school (figure 11.1). However, only asmall fraction of the work force actually derives its income from the formalsector (table 11.1).
How Did UPE Affect Education and Labor Market Participation in Uganda? 265
Figure 11.1. Income Rises with Level of Education in Uganda
500
no sc
hooli
ng
pres
choo
l
prim
ary,
not c
omple
ted
prim
ary c
omple
ted,
no
seco
ndar
y
seco
ndar
y, no
t com
plete
d
seco
ndar
y com
plete
d
terti
ary
no sc
hooli
ng
pres
choo
l
prim
ary,
not c
omple
ted
prim
ary c
omple
ted,
no
seco
ndar
y
seco
ndar
y, no
t com
plete
d
seco
ndar
y com
plete
d
terti
ary
1,000
1,500
2,000
2,500
0tho
usa
nd
Ug
and
a sh
illin
gs
tho
usa
nd
Ug
and
a sh
illin
gs
b. total household income byeducational levels
a. individual labor income byeducational levels
1,000
2,000
3,000
4,000
5,000 agriculture nonagriculture
Source: 1999 Uganda National Household Survey data.
WB62_YALM_CH11 2/21/08 12:05 PM Page 265

The Literature on Educational Participation in Developing Countries
The most direct evidence on educational participation comes fromDeininger (2003), who finds a dramatic increase in primary school enroll-ment in Uganda from 1992 to 1999. Inequalities in enrollment rates bygender, income, and region also declined significantly over this period.
Appleton (2001) examines returns to education and employmentpatterns in Uganda during the 1990s. He finds that returns to educationincreased for all three major income sources: farming, nonagriculturalself-employment, and wage employment. Both secondary and tertiaryeducation had large and significant effects on access to wage employ-ment, but this positive effect for secondary education was offset by anegative impact on nonwage earnings. In contrast, primary educationdid not have a significant effect on wage employment, but it did raiseincome by increasing access to nonagricultural self-employment.
A large body of empirical literature looks at how returns to educationhave changed over time in other developing economies. Globally, returnsto primary education have continued to increase (Psacharopoulos 1994),but returns have failed to rise in several African countries. The Mincerianreturns to primary education have fallen in Kenya (Appleton, Bigsten,and Kulundu 1999) and South Africa (Moll 1996), and they have stag-nated in Ethiopia (Krishnan, Selaissie, and Dercon 1998).
266 Dragoset and Vilhuber
Table 11.1. A Large Proportion of Uganda’s Labor ForceWorks Outside the Formal Sector
Percentage of work force notIndustry earning labor income
Agriculture 83Mining and quarrying 83Commerce 81Manufacturing 68Other 37Transport 27Construction 20Banking/financial services 12Utilities 11Professional 10Public administration 4Total 72
Source: Authors’calculations based on Uganda National Household Survey, 1999.
WB62_YALM_CH11 2/21/08 12:05 PM Page 266

Other studies examine the effect of education on occupationalattainment and employment patterns. They find that education has a sig-nificant effect on the probability of nonfarm labor market participationand increases wages earned in nonfarm work in both Ghana (Abdulaiand Delgado 1999) and Pakistan (Fafchamps and Quisumbing 1999).Schiefelbein and Farrell (1984) find that schooling quality was a strongpredictor of occupational attainment in Chile during the 1970s.
Several studies estimate the impact of large-scale education policies indeveloping countries. Duflo (2001) finds that Indonesia’s 1973 schoolconstruction program increased both years of education (by 0.12–0.19years) and wages (by 1.5–2.7 percent). Mingat (1998) studies the impactof education policies in high-performing Asian economies. He finds thatcountries with higher proportional investments in primary educationwere significantly more likely to have greater development afterward. Inaddition, both the quantity (average duration of schooling) and the quality(retention rates and levels of student learning) of education had increasedin the high-investment countries relative to other Asian economies. Otherstudies confirm the increase in educational attainment and wages result-ing from educational reform (Paxson and Schady 2002; Clark and Hsieh2000; Patrinos and Sakellariou 2005; Pomponio and Lancy 1986;Dronkers 1993; Post 1994).
The Model
Consider the choice faced by families with children in school (Becker1975). The child’s earnings are a function of the child’s identity i, thefraction of total hours h spent earning such income, the level of school-ing s achieved, and the policy environment p in effect at the time ofwork. If the child does not go to school, earnings are I(i,1,s,p); if the childgoes to school for one additional year, earnings are I(i,0,s ) during theschool year and I(i,1,s +1,p) a year later.
To send a child to school, parents must be able to cover direct schoolingcosts, k(p), which include books, school fees, food, and possibly lodging.Some of these components, such as school fees, are directly related topolicy. Uganda’s universal primary education reduced some costs, butothers persist. Parents will send their children to school if
(1)
where � is the discount factor. This expression can be rewritten as
I i s I i s p p I i s p( ,0, ) ( ,1, 1, ) k( ) > (1 ) ( ,1, , )+ + − +δ δ
How Did UPE Affect Education and Labor Market Participation in Uganda? 267
WB62_YALM_CH11 2/21/08 12:05 PM Page 267

(2)
where the left-hand term is the discounted benefit from investing in anadditional year of schooling and the right-hand term includes the directand indirect costs of that additional year of schooling.
Two points about this simple specification are important. First, thecondition is satisfied at all levels of education, including after the end offree primary education. As long as the condition holds, the child will goto school; when the condition no longer holds, the child will leave.Second, policy decisions affect both sides of the expression—costs andincentives. While universal primary education reduces direct costs, theimproved economic climate can lead to a presumably short-term reduc-tion in school enrollment at certain levels of schooling if the decrease inschooling costs does not offset the increase in alternate employmentopportunities. This is unlikely in the early years, given the substantialreduction in schooling costs from free universal primary education, butk remains positive. Other economic changes, such as an increase in theprice of essential food, can be integrated through changes in the discountfactor or through explicit modeling of credit and budget constraints.
Results
Cross-sections of the Uganda National Household Survey for 1992 and1999, using data for 2002 where available, were examined.1 For part of theanalysis, synthetic 5- and 10-year cohorts of young people are constructedbased on their age in 1992. Because the data are not in true panel form,these individuals cannot be followed over time. We can, however, identifysurvey respondents in later surveys who would have been in the same agegroup in 1992. Their outcomes serve as proxies for the unobserved out-comes of the actual 1992 survey respondents.The assumption is that thesetwo largely distinct groups have the same characteristics and thus experi-ence similar outcomes on average. Some of the measured outcomessuggest that this condition is not always satisfied.
Two indicators of education are focused upon: some primary educationand some secondary education. The information available on the highestachieved education level varies across years and has been standardized.
Primary education has seven levels (grades), denoted by P1 through P7.We aggregate any completed level of primary into one category and anylevel of completed postprimary education (J1 through J3, S1 through S6)into a second category. Formally,
δ[ ( ,1, 1, ) ( ,1, , )] > ( ,1, , ) ( ,0, ) ( )I i s p I i s p I i s p I i s k p+ − − +
268 Dragoset and Vilhuber
WB62_YALM_CH11 2/21/08 12:05 PM Page 268

(3)
and
(4)
where i is individual “i” in time period “t.” For the regression analysis,we use years of education, linearized from the educational achieve-ment categories.
Changes in EnrollmentEnrollment (and consequently education levels) increased between 1992and 2002, as other studies have pointed out (Deininger 2003; WorldBank 2005). The number of girls and boys ages 5–10 and ages 10–15 whocompleted some level of primary school rose significantly (table 11.2).Among 15- to 20-year-olds, the number of Ugandans with no more thana primary education fell, reflecting the increase in postprimary educationin older groups.
By 1997, when universal primary education was implemented, thefirst cohort was ages 10–15, possibly still young enough to benefit fromthe program (table 11.3). The schooling rate for males of the first cohortrose to 83 percent in 1999. As they aged another three years, the ratedropped again with their acquisition of additional education.
By the time universal primary education was implemented, the thirdcohort was in its early 20s. In 1992, 70 percent had obtained someprimary education and another 20 percent had completed some secon-dary education. By 2002, another 14 percent had gone on to somesecondary education.
The second cohort (children ages 10–15 in 1992) falls between thesetwo groups. Some members may have benefited from universal primaryeducation to prolong their stay in the educational system. Between 1999(when the youngest members of this cohort were 17) and 2002, thenumber of males with some primary education rose 2 percentage points.The number of people in this cohort who obtained some secondary edu-cation also increased almost 2 percentage points.
Compared with the cohort that was ages 15–20 in 1992, the cohortof the same age in 2002 has a significantly higher educational level. Morethan 95 percent of the males in the younger cohort had at least a pri-mary education, compared with only 90 percent in the older cohort.Only 20 percent of males in the 15–20 cohort in 1992 had any secondary
EDUC (2) (EDUC P7)it it= I >
EDUC (1) (EDUC {P1 P })it it= I ∈ − 7
How Did UPE Affect Education and Labor Market Participation in Uganda? 269
WB62_YALM_CH11 2/21/08 12:05 PM Page 269

education, compared with 41 percent in the 10–15 cohort. For women theprimary education differential increased with age.
The older cohorts (ages 15–20 and ages 20–25) were not directlyaffected by universal primary education. However, their secondary educa-tional achievement increased between 1992 and 2002. Free universalprimary education may have freed household resources, allowing house-holds to keep children in school longer (a demand-side explanation).
270 Dragoset and Vilhuber
Table 11.2. The Percentage of Ugandans with Some Secondary Education Rosebetween 1992 and 2002
1992 1996 1999 2002
(a) With no more than primary educationMale5–10 39.87 — 54.58 53.4011–15 85.25 — 89.27 90.5916–20 70.05 — 59.95 58.0921–25 59.57 — 52.37 52.15
Female5–10 39.25 — 54.56 54.9511–15 77.67 — 87.66 90.0916–20 63.55 — 55.69 57.1321–25 55.91 — 53.73 55.20
(b) With some secondary educationMale5–10 0.00 — 0.15 0.0011–15 1.75 — 2.95 4.8616–20 20.44 — 31.27 37.4521–25 28.41 — 38.43 41.5226–30 28.45 — 28.26 35.0131–35 26.55 — 30.28 33.1136–40 23.74 — 29.96 29.4841–45 21.54 — 27.33 30.31
Female5–10 0.00 — 0.03 0.0211–15 2.20 — 4.27 5.0916–20 15.76 — 28.38 33.6521–25 16.23 — 23.56 30.3826–30 13.45 — 16.84 21.7931–35 10.82 — 14.90 18.5836–40 8.01 — 10.23 14.7541–45 8.09 — 9.77 13.25
Source: Authors’ calculations based on data from the Uganda National Household Surveys.Note: — = Not available.
WB62_YALM_CH11 2/21/08 12:05 PM Page 270

Alternately, decreases in the cost of secondary education may haveincreased participation.
The fraction of young (ages 20–30) male heads of households with atleast a primary education increased from 86 percent in 1992 to 93 percentin 2002 (table 11.4). Of interest, heads of household were neither morenor less likely to have more education than other household members.
How Did UPE Affect Education and Labor Market Participation in Uganda? 271
Table 11.3. The Free Primary Education Policy Has Freed Household Resources,Allowing Families to Keep Children in School Longer
Observed in
Age in 1992 1992 1996 1999 2002
(a) With no more than primary educationMale5–10 39.87 — 82.73 58.0911–15 85.25 — 50.85 52.1516–20 70.05 — 56.18 56.3621–25 59.57 — 57.78 58.42
Female5–10 39.25 — 77.84 57.1311–15 77.67 — 52.09 55.2016–20 63.55 — 54.35 57.7721–25 55.91 — 52.57 51.19
(b) With some secondary educationMale5–10 0.00 — 10.25 37.4511–15 1.75 — 39.63 41.5216–20 20.44 — 32.95 35.0121–25 28.41 — 27.73 33.1126–30 28.45 — 32.25 29.4831–35 26.55 — 27.22 30.3136–40 23.74 — 29.32 27.1441–45 21.54 — 28.77 37.25
Female5–10 0.00 — 13.34 33.6511–15 2.20 — 27.25 30.3816–20 15.76 — 21.98 21.7921–25 16.23 — 16.67 18.5826–30 13.45 — 12.75 14.7531–35 10.82 — 8.77 13.2536–40 8.01 — 10.18 9.7941–45 8.09 — 8.65 12.33
Source: Authors’ calculations based on data from the Uganda National Household Surveys.
WB62_YALM_CH11 2/21/08 12:05 PM Page 271

Educational attainment of household heads increased in all regions.Male household heads in the Central Region still have a higher educa-tional level than those in other regions. However, in the Western Region,where only half as many household heads had some secondary educationas in the Central Region, educational levels caught up with those of therest of the country. By 1999, all regions attained the 1992 level of theCentral Region. Education levels increased over 1992 in both rural andurban areas, with particularly strong gains for rural women (table 11.5).
Changes in the Returns to EducationReturns to education are reported for both wages and a measure of house-hold income. A large portion of earnings are nonlabor earnings, whichcannot be consistently attributed to individuals.2 Those earnings thereforeare attributed to the head of the household. For consistency in the sampleselection, some of the wage earning regressions are restricted to householdheads as well.
272 Dragoset and Vilhuber
Table 11.4. The Average Educational Level of Household Heads in Uganda Rosebetween 1992 and 2002
Some Some At leastprimary secondary primary
(a) All agesMale1992 56.80 20.11 76.911999 56.74 25.15 81.892002 57.96 29.32 87.28
Female1992 33.44 10.67 44.111999 36.87 13.08 49.952002 45.87 19.56 65.44
(b) Young (20–30) headsMale1992 63.20 22.99 86.191999 64.73 25.01 89.742002 60.92 31.86 92.78
Female1992 46.27 23.21 69.471999 47.99 26.21 74.202002 54.14 31.64 85.77
Source: Authors’calculations based on data from the Uganda National Household Surveys.
WB62_YALM_CH11 2/21/08 12:05 PM Page 272

The basic reduced form regression we estimate is
(5)
with linear effects for demographic characteristics (gender, marital status,region) and quadratic effects for age and years of education. Eht can beeither the labor income of the household head or the total earnings of theentire household. Depending on the left-hand side variable, equation (5)can be interpreted as a Mincerian wage equation or a reduced-form house-hold production function.
Because education is generally considered endogenous in this type ofequation, we instrument it. Candidate instruments are the distance toschool, other household members’ education, and parental education.For none of these measures are data consistently available for all years.The results presented generally use as an instrument a quadratic indistance to school and a quadratic in the difference of an individual’seducation from the average household education.
Ten different specifications were estimated. Across most of them, theincrease in the returns to education between 1992 and 1999 was strong,robust, and statistically significant. Some of the ordinary least squares
log f1(demographics) f2(age)
f3(education)
Eht = + ++β β β
β0 1 2
3
How Did UPE Affect Education and Labor Market Participation in Uganda? 273
Table 11.5. Educational Levels Increased in Both Rural and Urban Areas
1992 1996 1999 2002
(a) With some primary educationMaleRural 59.99 — 63.41 63.24Urban 51.85 — 50.97 50.69
FemaleRural 48.32 — 56.00 60.32Urban 56.71 — 54.92 52.24
(b) With primary or secondary educationMaleRural 70.75 — 76.81 80.49Urban 86.77 — 89.16 90.52
FemaleRural 53.19 — 63.43 70.81Urban 81.29 — 85.36 87.64
Source: Authors’calculations based on data from the Uganda National Household Surveys.Note: — = Not available.
WB62_YALM_CH11 2/21/08 12:05 PM Page 273

results are weakened or do not hold up when returns to education areinstrumented. The result no longer holds for women, for men in someregions, and for the oldest age group. It does hold for men in general andfor younger age groups (ages 21–30 and ages 31–40)—precisely the agegroups one might expect to benefit directly from greater access to theeducation system.
The instrumented variable results for the younger cohorts are verysimilar to the ordinary least squares results, suggesting that positiveselection is not driving the ordinary least squares results: all workers withhigher education enjoyed higher returns to education in 1999, not justthe high-ability workers. Some of the specifications and samples showsigns of weak instruments.
Including only wage income for the household head is restrictive,particularly for women, who are not usually household heads but oftencontribute outside wages to household earnings. Although the returnsto education of female heads of household do not increase significantlywhen other wage income is included, the returns to education for otherfemale household members do.
The returns to education can also be measured by considering totalhousehold income. While the ordinary least squares results show the sameincrease in returns to education across genders, regions, and age groups, theinstrumented variables results confirm the results only in some regions andonly for the youngest male cohorts. For the oldest male cohort, the instru-mented variables results show a decrease in the returns to education whenusing household income. Instruments are generally weak, indicating thatthe model that successfully explains wage income works less well forhousehold income and that the results should be interpreted with caution.
Changes in Employment PatternsEmployment increased across all age groups between 1992 and 1999(table 11.6). Except among men ages 15–20, the generally small increasein employment reflected primarily increases in the “employer” category.3
For men ages 15–30, overall employment rose about 1 percentage point.The increase in employment was much higher among young women,particularly women ages 15–25.
In the cohort of men ages 20–25 in 1992, employment rose from94.2 percent to 95.5 percent. This compares with a 1992 employmentrate of 94.5 percent among men ages 25–30.Among all male cohorts, therate of unemployment was higher for the younger cohort. This patterndoes not hold for all female cohorts. The employment rate of most
274 Dragoset and Vilhuber
WB62_YALM_CH11 2/21/08 12:05 PM Page 274
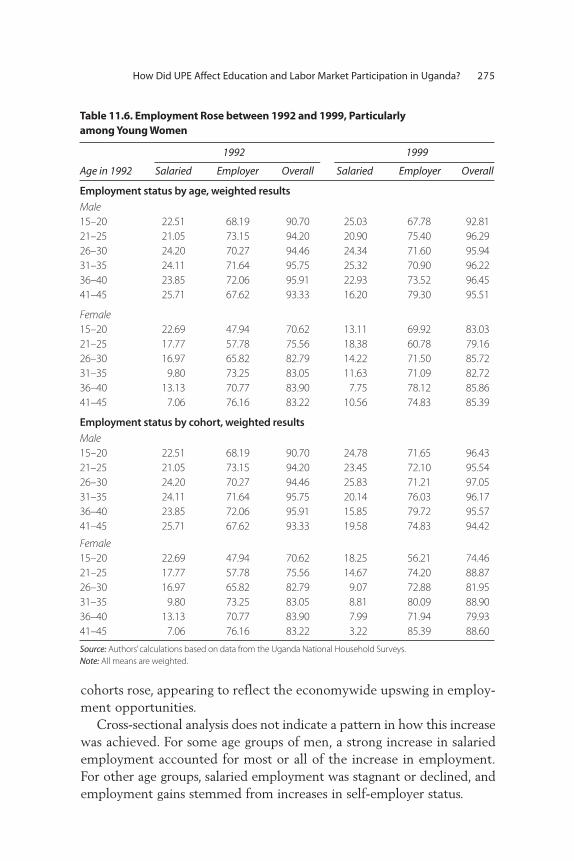
cohorts rose, appearing to reflect the economywide upswing in employ-ment opportunities.
Cross-sectional analysis does not indicate a pattern in how this increasewas achieved. For some age groups of men, a strong increase in salariedemployment accounted for most or all of the increase in employment.For other age groups, salaried employment was stagnant or declined, andemployment gains stemmed from increases in self-employer status.
How Did UPE Affect Education and Labor Market Participation in Uganda? 275
Table 11.6. Employment Rose between 1992 and 1999, Particularly among Young Women
1992 1999
Age in 1992 Salaried Employer Overall Salaried Employer Overall
Employment status by age, weighted resultsMale15–20 22.51 68.19 90.70 25.03 67.78 92.8121–25 21.05 73.15 94.20 20.90 75.40 96.2926–30 24.20 70.27 94.46 24.34 71.60 95.9431–35 24.11 71.64 95.75 25.32 70.90 96.2236–40 23.85 72.06 95.91 22.93 73.52 96.4541–45 25.71 67.62 93.33 16.20 79.30 95.51
Female15–20 22.69 47.94 70.62 13.11 69.92 83.0321–25 17.77 57.78 75.56 18.38 60.78 79.1626–30 16.97 65.82 82.79 14.22 71.50 85.7231–35 9.80 73.25 83.05 11.63 71.09 82.7236–40 13.13 70.77 83.90 7.75 78.12 85.8641–45 7.06 76.16 83.22 10.56 74.83 85.39
Employment status by cohort, weighted resultsMale15–20 22.51 68.19 90.70 24.78 71.65 96.4321–25 21.05 73.15 94.20 23.45 72.10 95.5426–30 24.20 70.27 94.46 25.83 71.21 97.0531–35 24.11 71.64 95.75 20.14 76.03 96.1736–40 23.85 72.06 95.91 15.85 79.72 95.5741–45 25.71 67.62 93.33 19.58 74.83 94.42
Female15–20 22.69 47.94 70.62 18.25 56.21 74.4621–25 17.77 57.78 75.56 14.67 74.20 88.8726–30 16.97 65.82 82.79 9.07 72.88 81.9531–35 9.80 73.25 83.05 8.81 80.09 88.9036–40 13.13 70.77 83.90 7.99 71.94 79.9341–45 7.06 76.16 83.22 3.22 85.39 88.60
Source: Authors’calculations based on data from the Uganda National Household Surveys.Note: All means are weighted.
WB62_YALM_CH11 2/21/08 12:05 PM Page 275

Cohort rather than cross-sectional age group analysis sheds some lighton this phenomenon. The younger male cohorts saw strong increases insalaried employment, while older cohorts saw a decline. Salaried employ-ment generally declined for female cohorts, coupled with strong increasesin employer status. All increases in female employment rates were drivenby increased self-employer status. Most of the increase in female employ-ment was driven by increases in employment from a low base.
Concluding Remarks
Educational participation and achievement in Uganda rose significantlybetween 1992 and 2002. The fraction of the population with no formaleducation declined by about a third (13 percentage points), and thefraction of the population with at least some secondary education increasedby more than 6 percentage points.
At the same time, the returns to education increased substantiallyfor many demographic groups, particularly for some of the youngermale cohorts, and in some geographic areas. Much of this increasereflected increases in returns to secondary education, which may berelated to pull factors in the labor market. The strong result for youngermen is robust to some specification of the endogeneity of education,and instrumented variables results are very similar to ordinary leastsquares results. This suggests that the result is valid across a broad abilityspectrum of the young male population, with little polarization.Results for household income, rather than formal wage earnings, arebroadly similar, albeit weaker.
Self-employment (or entrepreneurial employment) rose among bothmen and women. While the returns to education are similar for the twoearnings measures, it is difficult to determine whether the increase inemployment was due to push factors (reduction in public sector employ-ment) or pull factors (higher returns). Government programs aimed tofacilitate entrepreneurial activity. Whether they succeeded is difficult todetermine because the data do not allow distinguishing formal employ-ment from informal employment in a time-consistent manner. Furtherstudy is warranted to investigate this point.
Notes
1. Weighted data are not available for 1996. Data for 2002 are available oneducation, but the earnings data are not comparable. We therefore exclude2002 data from the regression analysis.
276 Dragoset and Vilhuber
WB62_YALM_CH11 2/21/08 12:05 PM Page 276

2. Each individual reported labor and nonlabor income for up to three activitiesin 1992. Nonlabor income is reported only at the household level in 1999.
3. In this case, employer actually means self-employed.
References
Abdulai, A., and C. Delgado. 1999. “Determinants of Nonfarm Earnings of Farm-Based Husbands and Wives in Northern Ghana.” American Journal ofAgricultural Economics 81 (1): 117–30.
Appleton, S. 2001. “Education, Incomes and Poverty in Uganda in the 1990s.”Working Paper 01/22, University of Nottingham, Centre for Research inEconomic Development and International Trade, Nottingham, United Kingdom.
Appleton, S., A. Bigsten, and M. Kulundu. 1999. “Have Returns to EducationChanged over Time? Evidence from Kenya, 1978–1995.” Centre for the Studyof African Economies Working Paper 1999/6, University of Oxford, Oxford,United Kingdom.
Appleton, S., J. Hoddinott, and J. Knight. 1996. “Primary Education as an Inputinto Post-Primary Education: A Neglected Benefit.” Oxford Bulletin ofEconomics and Statistics 58 (1): 211–9.
Becker, G. S. 1975. Human Capital: A Theoretical and Empirical Analysis, withSpecial Reference to Education. Cambridge, MA: National Bureau of EconomicResearch.
Behrman, J., and N. Birdsall. 1983. “The Quality of Schooling: Quantity Alone IsMisleading.” American Economic Review 73 (5): 928–46.
Burke, K., and K. Beegle. 2004. “Why Children Aren’t Attending School:The Caseof Northwestern Tanzania.” Journal of African Economies 13 (2): 333–55.
Card, D., and A. Krueger. 1992.“Does School Quality Matter? Returns to Educationand the Characteristics of Public Schools in the United States.” Journal ofPolitical Economy 100 (1): 1–40.
Clark, D., and C.-T. Hsieh. 2000. “Schooling and Labor Market Impact of the1968 Nine-Year Education Program in Taiwan.” Working Paper 1009, HongKong Institute of Economics and Business Strategy, Hong Kong, China.
Court, D. 1999. “Financing Higher Education in Africa: Makerere, the QuietRevolution.” Tertiary Education Thematic Group Series 22883, World Bank,Washington, DC.
Deininger, K. 2003. “Does Cost of Schooling Affect Enrollment by the Poor?Universal Primary Education in Uganda.” Economics of Education Review 22(3): 291–305.
Dréze, K., and G. Kingdon. 2001. “School Participation in Rural India.” Review ofDevelopment Economics 5 (1): 1–24.
How Did UPE Affect Education and Labor Market Participation in Uganda? 277
WB62_YALM_CH11 2/21/08 12:05 PM Page 277

Dronkers, J. 1993. “Educational Reform in the Netherlands: Did It Change theImpact of Parental Occupation and Education?” Sociology of Education 66 (4):262–77.
Duflo, E. 2001.“Schooling and Labor Market Consequences of School Constructionin Indonesia: Evidence from an Unusual Policy Experiment.” American EconomicReview 91 (4): 795–813.
Ersado, L. 2005. “Child Labor and Schooling Decisions in Urban and Rural Areas:Comparative Evidence from Nepal, Peru, and Zimbabwe.” World Development33 (3): 455–80.
Fafchamps, M., and A. Quisumbing. 1999. “Human Capital, Productivity, and LaborAllocation in Rural Pakistan.” Journal of Human Resources 34 (2): 369–406.
Fuller, B., J. Edwards, and K. Gorman. 1986. “When Does Education BoostEconomic Growth? School Expansion and School Quality in Mexico.” Sociologyof Education 59 (3): 167–81.
Gisser, M. 1968. “On Benefit-Cost Analysis of Investment in Schooling in RuralFarm Areas.” American Journal of Agricultural Economics 50 (3): 621–9.
Harmon, C., and I. Walker. 2000. “The Returns to the Quantity and Quality ofEducation: Evidence for Men in England and Wales.” Economica 67 (265):19–35.
Hazarika, G., and A. Bedi. 2003. “Schooling Costs and Child Work in RuralPakistan.” Journal of Development Studies 39 (5): 29–64.
Krishnan, P., T. Selassie, and S. Dercon. 1998. “The Urban Labour Market DuringStructural Adjustment: Ethiopia 1990–1997.” Centre for the Study ofAfrican Economies Working Paper 98-9, University of Oxford, Oxford,United Kingdom.
Lee, J., and R. Barro. 2001. “Schooling Quality in a Cross-Section of Countries.”Economica 68 (272): 465–88.
Mingat, A. 1998. “The Strategy Used by High-Performing Asian Economies inEducation: Some Lessons for Developing Countries.” World Development 26(4): 695–715.
Moll, P. 1992. “Quality of Education and the Rise in Returns to Schooling inSouth Africa.” Economics of Education Review 11 (1): 1–10.
———. 1996. “The Collapse of Primary Schooling Returns in South Africa1960–90.” Oxford Bulletin of Economics and Statistics 58 (1): 185–209.
Patrinos, H., and C. Sakellariou. 2005. “Schooling and Labor Market Impacts of aNatural Policy Experiment.” LABOUR 19 (4): 705–19.
Paxson, C., and N. Schady. 2002. “The Allocation and Impact of Social Funds:Spending on School Infrastructure in Peru.” World Bank Economic Review 16(2): 297–319.
278 Dragoset and Vilhuber
WB62_YALM_CH11 2/21/08 12:05 PM Page 278

Pomponio, A., and D. Lancy. 1986. “A Pen or a Bushknife? School, Work, and‘Personal Investment’ in Papua New Guinea.” Anthropology and EducationQuarterly 17 (1): 40–61.
Post, D. 1994. “Educational Stratification: School Expansion, and Public Policy inHong Kong.” Sociology of Education 67 (2): 121–38.
Psacharopoulos, G. 1994. “Returns to Investment in Education:A Global Update.”World Development 22 (9): 1325–44.
———. 1997. “Child Labor versus Educational Attainment: Some Evidence fromLatin America.” Journal of Population Economics 10 (4): 377–86.
Rangazas, P. 2002. “The Quantity and Quality of Schooling and U.S. LaborProductivity Growth (1870–2000).” Review of Economic Dynamics 5 (4):932–64.
Ranjan, P. 2000. “Child Labor, Child Schooling, and Their Interaction with AdultLabor: Empirical Evidence for Peru and Pakistan.” World Bank EconomicReview 14 (2): 647–67.
———. 2001. “Credit Constraints and the Phenomenon of Child Labor.” Journalof Development Economics 64 (1): 81–102.
———. 2002. “The Determinants of Child Labour and Child Schooling inGhana.” Journal of African Economies 11 (4): 561–90.
Ravallion, M., and Q. Woodon. 2000. “Does Child Labour Displace Schooling?Evidence on Behavioural Responses to an Enrollment Subsidy.” EconomicJournal 110 (462): 158–75.
Schiefelbein, E., and J. Farrell. 1984. “Education and Occupational Attainment inChile: The Effects of Educational Quality, Attainment, and Achievement.”American Journal of Education 92 (2): 125–62.
Schultz, T. 1999. “Health and Schooling Investments in Africa.” Journal ofEconomic Perspectives 13 (3): 67–88.
Singh, R. 1992. “Underinvestment, Low Economic Returns to Education, and theSchooling of Rural Children: Some Evidence from Brazil.” EconomicDevelopment and Cultural Change 40 (3): 645–64.
Uganda, Republic of. 1992. “Integrated Household Survey 1992: MainQuestionnaire.” Technical Report. Ministry of Finance, Planning andEconomic Development, Statistics Department, Kampala.
———. 1996. “Uganda National Household Survey 1996/1997: Labour ForcePilot and Socio-Economic Survey Questionnaire.” Technical Report. Ministryof Finance, Planning and Economic Development, Statistics Department,Kampala.
———. 1999a. “Multipliers for Uganda National Household Survey 1999/2000.”Technical Report. Uganda Bureau of Statistics, Kampala.
How Did UPE Affect Education and Labor Market Participation in Uganda? 279
WB62_YALM_CH11 2/21/08 12:05 PM Page 279
———. 1999b. “Uganda National Household Survey 1999/2000—Socio-EconomicSurvey Questionnaire.”Technical Report. Uganda Bureau of Statistics, Kampala.
———. 2002a. “Uganda National Household Survey 2002/2003: Manual ofInstructions.” Technical Report. Uganda Bureau of Statistics, Kampala.
———. 2002b. “Uganda National Household Survey 2002/2003: Socio-EconomicSurvey Questionnaire.” Technical Report. Uganda Bureau of Statistics,Kampala.
World Bank. 2003. “Poverty Reduction Strategy Paper Annual Progress Report.”Report 26567-UG, Washington, DC.
——— 2005. “Uganda: From Periphery to Center, A Strategic Country GenderAssessment.” Report 30136-UG, Office of the Sector Director, PovertyReduction and Economic Management, Africa Region, Washington, DC.
280 Dragoset and Vilhuber
WB62_YALM_CH11 2/21/08 12:05 PM Page 280

A
Africa Action Plan, xxvAfrican labor market, youth in. See youth
in African labor marketage
at entry into labor market, 134child laborers’ average age at first job,
139–40, 140ftransition from school to work,
22–23, 23finactivity by, 121–22f, 124tschool-leaving age and educational
attainment, 22–23, 23f, 132–34, 133t,135f
teenagers (15–19) vs. young adults(20–24), 35t, 36f, 37
time use differences by, 119t, 120,121–22f
youth defined as ages 12–24, xxviAgence d’Exécution des Travaux d’Intérêt
Public (AGETIP), Senegal, 72agriculture
early entry into labor force in, 17–18, 19tland-rich vs. land-poor families, 18
modalities of employment in, 56, 59fmultiple job holding in, 60school calendars allowing for agricultural
cycle, 69AIDS. See HIV/AIDSAppleton, S., 264, 266apprenticeships, 10–11, 70Argentina, 71, 72
B
Benin, 7, 17Bennell, P. S., 113Botswana, 6bboys vs. girls. See gender issuesBrazil, 69Burkina Faso, 149–79
age at leaving school in, 22, 23f, 134, 135fage, time use differences by, 120, 121fcombined school and employment,
151t, 152development and economic growth in,
110early entry into labor force, 16, 139,
152, 159–67, 160–65t
Index
281
Boxes, figures, notes, and tables are indicated by b, f, n, and t, respectively.
WB62_YALM_Index 3/12/08 12:35 PM Page 281

education and skillscombined school and employment,
151t, 152determinants of school enrollment,
45, 167–72, 168–71teconomic returns on, 40, 172–77,
173t, 175–76temployment, relationship to, 44enrollment rates, 150–52, 151thousehold income affecting, 46,
47n5, 69levels attained, xxviii, xxx, 8, 16, 22,
23f, 45, 46parental education levels, 167, 172,
178n10time required to get to school, 46,
150, 167, 172employment
combined with education,151t, 152
education, relationship to, 44, 153,156–58
proportion of youth in, 151trates of, 29, 115, 149, 152–56, 152t,
154–56tentrepreneurism programs, 79–82gender differences, 30, 149, 152–53,
154–55t, 166–67, 172HIV/AIDS in, 54household income
child labor force participation and,159–67, 160–65t
education levels affected by, 46,47n5, 69
inactivity levels and, 37time use by youth and, 34f
Household Living Standards Surveys,150
inactivity of youth in, 151tliteracy program, 73macroeconomic and demographic
factors, youth vulnerability to, xxixmodalities of employment in,
55, 127multiple job holding in, 60f, 158–59toccupational transitions over time,
156–58policy issues, 150proportion of youth at school vs. at
work, xxviii, 29, 30, 49rural vs. urban youth in, 32, 116,
149–50, 153, 156t, 166–67
second-chance interventions in, xxxteenagers (15–19) vs. young adults
(20–24) in, 37time required to get to school in, 46,
150, 167, 172time use in, 150–56, 151ttransition to working life in, 23, 139underemployment in, 60f, 158–59tunemployment in, 28, 123, 149, 151t,
152–56, 152t, 154–56tyouth programs in, 73, 74t, 78–84,
80–81t, 83–84tBurundi
age, time use differences by, 121fdevelopment and economic growth, lack
of, 110disadvantages of youth in labor market,
128, 129early entry into labor force, 16, 139education and employment/unemploy-
ment, relationship between, 42, 114employment rates in, 29gender differences in education and
employment in, 30, 52, 120household income
inactivity levels and, 37youth time use and, 34f
informal and self-employment sectors,youth involvement in, 9
joblessness in, 29modalities of employment in,
55, 127proportion of youth at school vs. at
work, xxviii, 49rural vs. urban youth in, 32, 116teenagers (15–19) vs. young adults
(20–24) in, 37unemployment in, 28, 61, 114,
115, 123
C
Cameroonage
at leaving school, 132time use differences by, 121f
combined school and work, youth pursuing, 30
disadvantages of youth in labor market,129
early entry into labor force, 16, 139
282 Index
WB62_YALM_Index 3/12/08 12:35 PM Page 282

education employment/unemployment,relationship between, 42, 114
education levels in, 16informal and self-employment sectors,
youth involvement in, 10joblessness in, 29modalities of employment in, 55, 56,
127, 128rural vs. urban youth in, 32teenagers (15–19) vs. young adults
(20–24) in, 36f, 37transition to working life
length of school-to-work transitionperiod, 21, 136
school nonentrants, 139unemployment associated with,
xxviii, 15unemployment in, xxviii, 15, 28, 61,
114, 115, 123Cape Verde, 11Card, D., 265child labor. See early entry into the labor
marketChile, 71, 72, 267Collier, P., 114combined school and work, youth
pursuing, 30, 70, 116–19tconditional cash transfers for educational
uses, 69Congo, Democratic Republic of, 5Côte d’Ivoire
ageat leaving school, 132time use differences by, 121f
education and employment/unemploy-ment, relationship between,42, 114
gender differences in education andemployment in, 30, 120, 123, 136
literacy rates, 11, 113rural vs. urban youth in, 123, 136teenagers (15–19) vs. young adults
(20–24) in, 36f, 37transition to working life
length of school-to-work transitionperiod, 21–22, 23
rural vs. urban youth in, 136school nonentrants, 139unemployment associated with,
xxviii, 15unemployment in, xxviii, 15, 28, 114,
115, 123
D
Deininger, K., 264, 266demand for labor, decrease in, 50Democratic Republic of Congo, 5demographics
as development dividend, xxvi–xxvii, 3,4–7, 5f
education and vulnerability to, xxix, 53,54t
HIV/AIDS affecting, 5, 6bnumber of young people in Sub–Saharan
African labor force, 109–10population growth rates in Sub-Saharan
Africa, 110rural vs. urban youth, 50, 50–51tyouth vulnerability to forces of,
xxviii–xxix, 5, 11, 12f, 50–51t, 50–52,111–12, 112f, 139f
development and economic growthbroadening employment opportunities,
xxix, 12–13, 68–69, 73, 74tdemographic dividend’s potential contri-
bution to, xxvi–xxvii, 3, 4–7, 5feducation, relationship to, 44, 264GDP. See gross domestic productinvestment climate, improving,
68–69political stability, advantages of, 69school-to-work transition period and,
137, 138–39fin Sub-Saharan Africa, 110
discouraged workersdistinguishing from other forms of
employment problem, 29failure of unemployment measurements
to capture, 28, 126gender differences in, 52, 65as proportion of inactive population,
38n7, 127Dragoset, Lisa, xix, 263Duflo, E., 267
E
early entry into labor market, xxvii–xxviii,8, 9f. See also under specific countries
average age at first job, 139–40, 140fdemographic pressures, 111proportion of children 8–12 who work,
140f
Index 283
WB62_YALM_Index 3/12/08 12:35 PM Page 283

regional analysis of, 19–20t, 137–41,138f, 140f
school nonentrants, 15–21, 16–17f,19–20t, 137–41, 138f, 140f
UCW project, 144n1East Asia
demographic dividend in, xxvi, 5economic growth and youth employ-
ment opportunities in, 68economic growth. See development and
economic growtheconomic returns on education, 7, 8f,
39–42, 41f, 42t, 264–67education and skills. See also under specific
countriesAfrican youths’ overall lack of,
xxvii–xxviii, 7, 112–13, 113–14fage at leaving school and educational
attainment, 22–23, 23f, 132–34, 135fapprenticeships, 10–11, 70attainment levels, 44–47, 114fcombined school and work, youth
pursuing, 30, 70, 116–19tconditional cash transfers, 69determinants of school enrollment,
45–46, 46tdevelopment and growth, relationship
to, 44, 264early entry into labor market affecting,
8–9, 15–16employment/unemployment, relation-
ship to, xxx, 42–44, 43fgender differences in, xxviii, 30–32, 31t,
45–46, 46t, 52–53, 134HIV/AIDS and. See under HIV/AIDShousehold income, relationship to,
39–47economic returns on education, 7, 8f,
39–42, 41f, 42t, 264–67employment outcomes and education
levels, 42–44, 43fenrollment and attainment levels, 32,
34t, 45, 46literacy, effect on income of, 40
investment in human capital outside ofschool, 10–11
job training programs, 72literacy rates. See literacy/illiteracymacroeconomic and demographic
factors, vulnerability to, xxix, 53, 54tnational programs addressing, 73, 74tparental education, effects of, 45–46, 46t
percentage of youth 15–24 in school inSub-Saharan Africa, xxvii–xxviii, 7,29–32, 115–16, 116–19t
policy issues, xxix–xxx, 13, 69–71,73, 74t
proportion of youth at school vs. atwork, xxviii, 27, 29, 30, 49
public-private partnerships, 70–71quality of schooling, 9, 10f, 254–65regional comparisons, 113freturns on, 7, 8f, 39–42, 41f, 42t,
113–15rising levels of, 7rural vs. urban youth, xxviii, 23, 32, 33t,
45–46, 46t, 134second-chance interventions, xxx, 13,
71–72, 73, 74tstudies on educational participation in
developing countries, 266–67technical and vocational training, 44,
70–71, 88, 92teenagers (15–19) vs. young adults
(20–24), 35t, 36f, 37time required to get to school, 46transition from school to work, 15,
21–25, 23f, 24f, 75–78unemployment, relationship to, xxx,
42–44, 43f, 114–15, 115f, 125f, 126Edwards, J., 265employment, 127–28. See also under
specific countriescombined school and work, youth
pursuing, 30, 70, 116–19tdefined, 37–38n3, 144–45n2education and skills, relationship to, xxx,
42–44, 43fgender differences, 30–32, 31t, 50, 51t,
52–53modalities of, 9–10, 55–59, 55t, 57–58t,
59f, 127, 128tpercentage of young people in
Sub-Saharan Africa engaged in, 115,116–19t
political stability and, 69rate vs. ratio, 28
entrepreneurism, encouraging, 71. See alsounder specific countries
entry into labor market. See transition toworking life
Eritrea, 7Ethiopia, 181–223
age, time use differences by, 120, 121f
284 Index
WB62_YALM_Index 3/12/08 12:35 PM Page 284

agricultural sector, importance of, 184,187–88, 194
combined work and school, 220n3demographic factors, youth vulnerability
to, xxix, 5, 50, 51t, 53, 54t, 183–84,184f
disadvantages of youth in labor market,194–96, 195–96f, 196t
early entry into labor force, 185–88age at first job, 16policy recommendations, 218–19school nonentrants, 139, 140type and sector of employment, 19ttypes of work performed, 187–88urban/rural and gender differences,
17f, 186–87, 186f, 187tuse of terms, 220n2
education and skillsagricultural cycle, school calendar
allowing for, 69attainment levels, xxviii, 7, 8, 45,
184–85, 185f, 201combined work and school, 220n3early entry into labor market
affecting, 186–87economic returns on, 266employment, relationship to, 42–43,
201–11, 201f, 203t, 204f, 206–9tnew education policy (1994), 85,
213–14policy recommendations, 218–19technical and vocational training, 88,
213–14Third Education Development Sector
Program, 85, 214–15time use profile, 188–89vulnerability of youth to demographic
and macroeconomic factors affectedby, 53, 54t
employmentcombined work and school, 220n3defined, 221n8education, relationship to, 42–43,
201–11, 201f, 203t, 204f, 206–9tidentification of local labor markets,
205, 206–7tincreased demand, positive response
of youth employment to, xxix, 12flabor market characteristics,
183–84levels of, 115time use profile, 188–89
entrepreneurism programs, 85–88,215–16
gender differences indemographic and macroeconomic
effects, 51tearly entry into labor force, 186–87,
186f, 187teconometric analysis, 205–11education, 30, 185employment, 30, 53school-to-work transition period,
198f, 199ftime use patterns, 120unemployment and inactivity, 11, 52,
53, 191–92HIV/AIDS in, 54, 181, 216–17inactivity, 29, 63, 127, 188, 189tindustrial development strategy, 215joblessness, 29, 189–90, 189t, 190fLabor Law, 85, 88–89, 212–13Labour Force Survey (2001), 182literacy rates, 113long-term unemployment in, 61–63, 62fmacroeconomic factors, youth vulnera-
bility to, xxix, 5, 53, 54t, 182–83,183t
micro- and small-enterprises develop-ment strategy, 85–88, 215
microfinance institutions in, 88, 216migration patterns in, 52modalities of employment in, 59f, 193t
defined, 221n11–12educational attainment and age group
affecting, 203thousehold non-wage labor, 192, 194informal sector work, importance of,
184self-employment, 194unpaid household work, 56–59wage employment, 55, 65n3, 127
National Youth Policy, 84–85, 211–12policy issues
existing programs and policies, 73,74t, 84–91, 86–87t, 89–90t,211–17
failures of policy, 69recommendations regarding, 217–19
proportion of youth at school vs. atwork, 30
rural vs. urban youth inearly transition to work, 17f, 186f,
187t, 188, 200
Index 285
WB62_YALM_Index 3/12/08 12:35 PM Page 285

education and skills, 32, 187, 205,208–9t
policy recommendations, 217–18school nonentrants, 200school-to-work transition period,
198f, 199ftime use, 116, 188–89, 189tunemployment, 190–91, 191f,
195–96, 196fsecond-chance interventions in, xxxtechnical and vocational training in, 88,
213–14teenagers (15–19) vs. young adults
(20–24) in, 36f, 37time use of youth in, 188–89transition to working life, 196–200
age at leaving school, 197–98school nonentrants, 139, 140, 200fschool-to-work transition period,
136, 197–200, 197f, 198t, 199funemployment associated with,
xxviii, 15underemployment in, 59, 184unemployment in, xxviii, 189–94, 189t
education and, 201–2, 201fin Ethiopia generally, 184gender differences, 11, 191–92long-term, 61–63, 62fpolicy recommendations, 218–19rural vs. urban youth, 190–91, 191f,
195–96, 196fyouth programs in, 73, 74t, 84–91,
86–87t, 89–90t, 211–17evaluation of youth programs. See under
national youth programs
F
Fares, Jean, xix, 1, 109farming. See agricultureFarrell, J., 267females. See gender issuesFuller, B., 265
G
The Gambiaage, time use differences by, 121fdisadvantages of youth in labor market,
128, 129
gender differences in education andemployment in, 30, 52, 120
informal and self-employment sectors,youth involvement in, 9
joblessness in, 29modalities of employment in, 55,
65n3, 127rural vs. urban youth in, 32, 116transition to working life
length of school-to-work transition,136
unemployment associated with,xxviii, 15
unemployment in, xxviii, 15, 28,61, 123
Garcia, Marito, xix, 1GDP. See gross domestic productgender issues. See also under specific
countriesapprenticeships, 11average hours worked, 18economic returns on secondary
education in Uganda, rise in, 7education levels, xxviii, 30–32, 31t,
45–46, 46t, 52–53, 112, 134employment rates, 30–32, 31t, 50, 51t,
52–53migration patterns, 52rural vs. urban youth, 134–36school leaving age, 23time required to get to school, effects on
education levels of, 46–47time use patterns by, 117t, 120transition to working life, xxviii, 23,
24t, 134unemployment and inactivity, 11,
30–32, 31t, 63–65, 63f, 123, 125fGermany, 70Ghana, 72, 267girls vs. boys. See gender issuesGlewwe, P., 113, 114Gorman, K., 265gross domestic product (GDP)
school-to-work transition and,137, 138f
in Sub-Saharan Africa generally, 110youth employment affected by, 25, 68
growth. See development and economicgrowth
Guarcello, Lorenzo, xix, 109, 181, 227Guinea, 7Gunning, J. W., 114
286 Index
WB62_YALM_Index 3/12/08 12:35 PM Page 286

H
health issues. See also HIV/AIDSemployment and education
opportunities limited by, 54sexually transmitted infections, 54
HIV/AIDSdemographic dividend affected by, 5, 6bearly entry into labor market due to, 17education and skills
attainment levels affected by infectionrates in children and family members, 47
impact of education on infectionrates, 44
opportunities, limitation of, 54employment opportunities limited by,
54second-chance interventions and, 13
Hoddinott, J., 264household income. See also under specific
countriesearly entry into labor force and, 18–21,
20teducation and skills, relationship to. See
under education and skillsmodalities of employment affected by,
56school-to-work transition period and,
138ftime use by youth and, 32–37, 34funemployment and inactivity levels, 37
human capital investment outside ofschool, 10–11
I
illiteracy. See literacyILO (International Labour Organization),
109, 181inactivity, 28–29, 126–27. See also under
specific countriesby age, 121–22f, 124tdefined, 28, 38n3, 145n2discouraged workers, 38n7, 127gender differences, 30, 63–65, 63fhousehold income and, 37of rural vs. urban youth, 32, 38n7, 51t,
145n5of teenagers (15–19) vs. young adults
(20–24), 35t, 36f, 37
of youth in Sub-Saharan Africa generally,116–19t, 121–22f, 124t, 126–27
income. See household incomeIndonesia, 68, 267informal employment. See modalities of
employmentInternational Labour Organization (ILO),
109, 181investment climate, improving, 68–69investment in human capital outside of
school, 10–11
J
job training programs, 72joblessness
defined, 115levels of, 115as measure of time use by youth, 28–29percentage of youth in Sub-Saharan
Africa experiencing, 116–19t
K
Kenyaage, time use differences by, 120, 121fapprenticeship programs, 70demographic dividend in, 5development and economic growth, lack
of, 110early entry into labor force, 16, 139economic growth, lack of, 5economic returns on education in,
40, 266education and employment/unemploy-
ment, relationship between, 42, 114educational levels in, 113gender differences in education and
employment in, 134household income, effects of, 32, 37joblessness in, 29literacy/illiteracy, 11, 47n4, 112modalities of employment in, 10, 55,
56, 127proportion of youth at school vs. at
work, xxviii, 29, 49public-private education partnerships, 70rural vs. urban youth in, 32, 116teenagers (15–19) vs. young adults
(20–24) in, 37
Index 287
WB62_YALM_Index 3/12/08 12:35 PM Page 287

transition to working lifelength of school-to-work transition,
136school nonentrants, 139unemployment associated with, xxviii
unemployment in, xxviii, 28, 111, 114,115, 123
Knight, J., 264Kondylis, Florence, xix, 225Krueger, A., 265
L
labor market in Africa, youth in. See youthin African labor market
Latin Americaconditional cash transfers for education
in, 69demographic dividend in, xxvieconomic returns on education in,
267quality of education in, 265second-chance interventions in, 72vocational and technical training in, 71
Liberia, 110literacy/illiteracy
household income affected by, 40national plans, 47n4, 73rates of, 9, 10f, 11, 45
long-term unemployment, 61–63,62–63f
Lyon, Scott, xix, 109, 181
M
macroeconomic factorsearly entry into labor force due to,
18–21education and vulnerability to, xxix,
53, 54tschool-to-work transition period and,
137, 138–39fyouth disproportionately affected by,
xxviii–xxix, 11, 12fMadagascar
age, time use differences by, 121feducation and unemployment, relation-
ship between, 114employment and education, relationship
between, 42
employment rates in, 29gender differences in education and
employment in, 30, 52, 120, 123inactivity of youth in, 29modalities of employment in, 55,
56, 127proportion of youth at school vs. at
work, 27rural vs. urban youth in, 32teenagers (15–19) vs. young adults
(20–24) in, 36f, 37transition to working life in, 23unemployment in, 114, 123
Malawiage
at leaving school, 132time use differences by, 120, 122f
education levels, 7employment levels, 115joblessness in, 29modalities of employment in, 55, 56,
65n3, 127, 128proportion of youth at school vs. at
work, xxviii, 27, 29, 49rural vs. urban youth in, 32, 116teenagers (15–19) vs. young adults
(20–24) in, 37transition to working life
length of school-to-work transition,136
length of school-to-work transitionperiod, 21
unemployment associated with,xxviii, 15
unemployment in, xxviii, 15, 28, 115,123
males. See gender issuesMali, 7Manacorda, Marco, xix, 109, 225Mauritius, 70MDGs (Millennium Development Goals),
xxv, 27, 109, 122, 182Mexico, 69, 264microfinance institutions in Ethiopia,
88, 216migration patterns
child laborers, 17gender differences in, 52in Tanzania, 51t, 52, 225, 247, 251, 253,
255, 256urban migration and youth employment,
51t, 52
288 Index
WB62_YALM_Index 3/12/08 12:35 PM Page 288

Millennium Development Goals (MDGs),xxv, 27, 109, 122, 182
Mincer-type estimation of returns on education, 114
Mingat, A., 267modalities of employment (wage
employment, informal employment,self-employment), 55–59, 55t. Seealso under specific countries
defined and described, 65n2, 145–46n10disadvantages of youth vs. adults in labor
market, 129–31, 131fhigh regional rate of self-employment,
challenges of, 9–10regional analysis of, 127, 128trural vs. urban youth, 57–58t
Moll, P., 265Mozambique
ageat leaving school, 132time use differences by, 122f
early entry into labor force, 16education levels, xxviii, 8employment levels, 115gender differences in education and
employment in, 30, 120, 123household income and inactivity levels
in, 37inactivity of youth in, 29, 63, 127joblessness in, 29modalities of employment in, 55, 56,
127, 128, 129rural vs. urban youth in, 32, 116transition to working life
length of school-to-work transitionperiod, 22, 136
school nonentrants, 139unemployment associated with,
xxviii, 15unemployment, xxviii, 11, 15, 27, 28,
111, 115, 123multiple job holding, 60f
N
Namibia, 9national youth programs, 73–75, 74t
in Burkina Faso, 73, 74t, 78–84, 80–81t,83–84t
in Ethiopia, 73, 74t, 84–91, 86–87t,89–90t, 211–17
evaluation of, 73–75in Burkina Faso, 82–84, 93–84tin Ethiopia, 89–90t, 89–91in Tanzania, 95–96, 95–97t
in Tanzania, 73, 74t, 91–97, 93–97t,256–57
in Uganda, 73, 74t, 97–99Nigeria, 40, 42, 110
O
O’Higgins, Niall, 227Organisation for Economic Co-operation
and Development (OECD), 75–76,129, 130f, 141
P
Pakistan, 267Parent, Daniel, xix, 149parental education, effects of, 45–46, 46tpartnerships in education, public-private,
70–71Peru, 72policy issues, xxix–xxx, 11–13, 67–75. See
also under specific countriesAfrican national programs addressing,
73–75, 74tbroadening employment opportunities,
xxix, 12–13, 68–69, 73, 74teducation and skills, xxix–xxx, 13,
69–71, 73, 74tfailures of market policy, effects of,
68–69future research needs, 75second-chance interventions, xxx, 13,
71–72, 73, 74tpolitical stability, advantages of, 69poverty
early entry into labor market due to,18–21, 20t
second-chance interventions counteract-ing, xxx, 13, 71–72
in Sub-Saharan Africa generally, 110the too poor to be unemployed, 28, 125,
127, 192youth unemployment and, 27
private-public partnerships in education,70–71
proximity to school, 46
Index 289
WB62_YALM_Index 3/12/08 12:35 PM Page 289

Psacharaopolous, G., 113public-private partnerships in education,
70–71public works programs, 72
R
Rosati, Furio, xix, 109, 181Rosenzweig, Mark R., 227rural vs. urban youth. See also under specific
countriesaverage hours worked, 18demographics affecting, 50, 50–51tearly entry into labor force, 17–18, 17f,
139–40education levels, xxviii, 23, 32, 33t,
45–46, 46t, 134gender differences, 134–36inactivity of, 32, 38n7, 51tlong-term unemployment, 62f, 63ftime use by, 32, 33t, 116–20, 118ttransition to working life, xxviii, 23, 24f,
134–37, 139–40underemployment, 59–60, 60funemployment rates, 123–26, 125furban migration and youth employment,
51t, 52Rwanda, 40
S
São Tomé and Principeage
at leaving school, 132time use differences by, 122f
disadvantages of youth in labor marketin, 129
early entry into labor force, 16, 139,140
education levels, 7, 113gender differences in education and
employment in, 30, 52, 120, 123, 136joblessness in, 29modalities of employment in, 55, 127,
129rural vs. urban youth in, 32, 116, 123,
134, 136transition to working life
length of school-to-work transitionperiod, 21, 23, 136
rural vs. urban youth in, 136school nonentrants, 139, 140unemployment associated with,
xxviii, 15unemployment in, xxviii, 15, 28, 61,
115, 123Schiefelbein, E., 267school proximity, 46schooling. See education and skillssecond-chance interventions, xxx, 13,
71–72, 73, 74tself-employment. See modalities of
employmentSenegal, 72sexually transmitted infections, 54. See also
HIV/AIDSskills. See education and skillsSouth Africa
economic returns on education in,40, 266
HIV/AIDS in, 6bliteracy rates, 11modalities of employment in, 128quality of schooling in, 265
T
Tanzania, 225–61combined school and work in, 225,
229t, 230, 231criminal behavior and youth joblessness,
255demographic and macroeconomic
factors, youth vulnerability to, xxix, 5,50–51t, 226–27, 246, 251–55
development and economic growth in,110
early entry into labor force, 17, 225economic growth, lack of, 5education and skills
attainment levels, xxx, 45combined school and work, 225,
229t, 230, 231determinants of school enrollment,
45, 46t, 246–54, 248–50teconomic returns on, 40employment, relationship to, xxx, 43,
52–53, 256, 257n1job training, 247patterns of school participation,
228–32, 229t
290 Index
WB62_YALM_Index 3/12/08 12:35 PM Page 290

time required to get to school, 47,247, 251, 252, 253
employmentcombined school and work, 225,
229t, 230, 231compositional effect in, 257n1determinants of labor force status,
246–54, 248–50teducation, relationship to, xxx, 43,
52–53, 256, 257n1modalities of, 56, 232–37, 233–34t,
256multiple job holding, 235number of hours of work, 235,
236patterns of work participation,
228–32, 229tentrepreneurism programs, 92gender differences in
determinants of labor force statusand school enrollment, 252
education and skills, 230–32employment, 230–32modalities of employment,
235–37number of hours worked, 236relationship between education and
employment, 52–53unemployment, underemployment,
joblessness, and inactivity, 240,244, 245, 246, 253
HIV/AIDS in, 47, 54, 244, 245, 258n3inactivity in, 64t, 65, 229t, 230,
238–39t, 241–44, 242–43tIntegrated Labour Force Survey (2003),
226, 228job search methods, 244, 245tjoblessness, 229t, 230, 240–41, 253literacy/illiteracy, 11, 47n4, 73, 112long-term unemployment in, 61–63, 63f,
238–39t, 240, 258n2migration within, 51t, 52, 225, 247, 251,
253, 255, 256modalities of employment in, 56,
232–37, 233–34t, 256multiple job holding, 235policy considerations for, 253–57rural vs. urban youth
determinants of labor force statusand school enrollment for,251–52
education and skills, 232
employment, 225, 231, 232, 235,253
inactivity, 241, 244number of hours worked, 235unemployment and underemploy-
ment, 240, 246second-chance interventions in, xxxunderemployment, 246unemployment, 225, 244–46
gender differences, 240, 244, 245,246, 253
long-term, 61–63, 63f, 238–39t, 240,258n2
rates of, 237–41, 238–39treasons for higher rates among youth,
226–27rural vs. urban youth, 240, 246
youth programs in, 73, 74t, 91–97,93–97t, 256–57
technical and vocational training, 44,70–71, 88, 92
Togo, 7Trabajar Program, Argentina, 72training. See education and skillstransition to working life, xxviii, 15–25,
131–44. See also under specificcountries
age at leaving school and at labor marketentry, 22–23, 23f
average hours worked, 18difficulties faced in, 49–53GDP growth affecting, 25gender differences in, xxviii, 23, 24t, 134methodology for measuring, 75–78,
141–44poverty, household income, and macro-
economic factors affecting,18–21, 20t
proportion of youth at school vs. atwork, xxviii, 27, 29, 30, 49
reasons for focusing on, 4rural vs. urban youth, xxviii, 23, 24f,
134–37, 139–40school nonentrants, 15–21, 137–41,
138f, 140fschool-to-work transition period, 15,
21–25, 23f, 24f, 75–78, 132–37,133t, 135f
technical and vocational training asmeans of easing, 44
unemployment associated with,xxviii, 15
Index 291
WB62_YALM_Index 3/12/08 12:35 PM Page 291

U
UCW (Understanding Children’s Work)project, 144n1
Ugandaage, time use differences by, 122fcombined school and work, youth
pursuing, 30development and economic growth in,
110early entry into labor force, 16economic returns on education in, 7, 8f,
40–42, 42t, 264–66, 265f, 272–74, 276education levels and enrollment rates, 7,
269–72, 270–73t, 276entrepreneurism programs, 98–99gender differences in education and
employment in, 30, 134, 274–76, 275fHIV/AIDS in, 54household income, effects of, 34f, 37inactivity levels, 37literacy/illiteracy, 47n4, 73, 112modalities of employment in, 55, 265,
266t, 276National Household Surveys, 268rural vs. urban youth in, 32, 116, 273tsecond-chance interventions in, xxxtime use by youth, 34ftransition to working life, unemploy-
ment associated with, xxviiiunemployment in, xxviii, 27, 123universal primary education program,
study of effects of, 263–80employment patterns, 274–76, 275tliterature review, 266–67model, 267–68rate of return on education, 264–67,
265f, 272–74, 276reasons for failure to attend school,
264–365results, 268–76school enrollment rates, 269–72,
270–73t, 276youth programs in, 73, 74t, 97–99
underemployment, 28, 59–60, 60f, 126Understanding Children’s Work (UCW)
project, 144n1unemployment, 11, 60–65, 61f. See also
under specific countriesdefined, 145n2demographic factors affecting,
xxviii–xxix, 5, 111–12, 112f
difficulties in measuring, 28, 37–38n3,123, 126
education levels, relationship to, xxx,42–44, 43f, 114–15, 115f, 125f, 126
gender differences in, 11, 30–32, 31t,63–65, 63f, 123, 125f
generally high levels of, 27–29household income and, 37inactivity versus. See inactivityjoblessness versus. See joblessnesslong-term, 61–63, 62–63fpercentage of youth in Sub-Saharan
Africa experiencing, 115, 116–19t,120–26, 124t, 125f
political stability and, 69rate vs. ratio, 28regional rates, 112fof rural vs. urban youth, 123–26, 125fteenagers (15–19) vs. young adults
(20–24), 35t, 36f, 37the too poor to be unemployed, 28, 125,
127, 192transition to working life, associated
with, xxviii, 15urban youth. See rural vs. urban youth
V
Valdivia, Cristina, xix, 109Vietnam, 68Vilhuber, Lars, xix, 263vocational and technical training, 44,
70–71, 88, 92
W
wage employment. See modalities ofemployment
women and girls. See gender issuesWorld Development Report 2007:
Development and the Next Generation,xxv, xxix, 67
Y
youth in African labor market, xxv–xxxi,109–47
age, statistics by. See agechallenges faced by, xxvii–xxix, 8–11
292 Index
WB62_YALM_Index 3/12/08 12:35 PM Page 292

defined as ages 12–24, xxvidemand for labor, decrease in, 50demographics of. See demographicsdisadvantages of youth vs. adults in labor
market, 128–31, 129–31fdemographics, youth vulnerability to
forces of, xxviii–xxix, 5, 11, 12f,50–51t, 50–52, 111–12, 112f,139f
macroeconomic factors, youth dispro-portionately affected by,xxviii–xxix, 11, 12f
education levels. See education andskills
entry into labor force. See transition toworking life
importance of addressing, xxvi,3–4
modalities of employment, 9–10, 55–59,55t, 57–58t, 59f
policy lessons regarding. See policy issuesskills of. See education and skillsteenagers (15–19) vs. young adults
(20–24), 35t, 36f, 37transition to work. See transition to
working life
youth programs. See national youth programs
Z
Zambiaage, time use differences by, 122fdevelopment and economic growth, lack
of, 110early entry into labor force, 16education levels, 113gender differences in, 30, 52, 120, 123HIV/AIDS in, 6b, 44household income and youth time use,
34finformal and self-employment sectors,
youth involvement in, 9rural vs. urban youth in, 32transition to working life
length of school-to-work transition,136
unemployment associated with,xxviii, 15
unemployment in, xxviii, 15, 28,115, 123
Index 293
WB62_YALM_Index 3/12/08 12:35 PM Page 293

WB62_YALM_Index 3/12/08 12:35 PM Page 294

WB62_YALM_Index 3/12/08 12:35 PM Page 295

ECO-AUDIT
Environmental Benefits Statement
The World Bank is committed to preservingendangered forests and natural resources.The Office of the Publisher has chosen to printYouth in Africa’s Labor Market on recycledpaper with 30 percent postconsumer fiber inaccordance with the recommended standardsfor paper usage set by the Green PressInitiative, a nonprofit program supporting pub-lishers in using fiber that is not sourced fromendangered forests. For more information,visit www.greenpressinitiative.org.
Saved:• 11 trees• 8 million BTUs of total
energy• 949 pounds of net
greenhouse gases• 3,938 gallons of
waste water• 506 pounds of
solid waste
WB62_YALM_Index 3/12/08 12:35 PM Page 296
"Today’s youth generation is the largest in history. Nearly half the global population isunder 25 and more than one billion are between 15 and 24. By 2015, there will be 3 billionyoung people, and 2.5 billion of them will be living in developing countries. Will thisgeneration present a potential threat to global stability or a potential resource for devel-opment? A lot depends on the action we take today to prepare them for the future. Theseyoung people need a nurturing environment that inculcates in them the right values andattitudes, equips them with appropriate and adequate knowledge and skills, and providesthem with the opportunity to play their part in society.”
—Ruth KagiaEducation Director, The World Bank
“As more young people in Africa are able to get an education, an important challenge forcountries is to ensure that youth have a smooth, productive, and safe transition fromschools to the working world. This book makes a very important contribution by articulatingthe issues around that transition and proposing solutions based on firm evidence. It is a‘must-read’ as a regional companion volume to theWorld Development Report 2007:Development and the Next Generation.”
—Emmanuel Y. JimenezDirector, World Development Report 2007, and Sector Director for Human Development,East Asia and the Pacific, The World Bank
"The opportunities are great, as many countries will have a larger, more skilled labor forceand fewer dependents. But these young people must be well prepared in order to createand find good jobs."
—François BourguignonFormer Chief Economist and Senior Vice President forDevelopment Economics, The World Bank
Youth in Africa’s Labor MarketMarito Garcia and Jean Fares, Editors
YouthinAfrica’s
LaborMarket
Garcia
andFares
SKU 16884
ISBN 978-0-8213-6884-8
D I R EC T IONS IN DEVE LOPMENT
Human Development


