1 January 20, 2021 To the Barr Foundation: We are pleased to submit the final (draft) version of the Berkshire Portrait of a Graduate. Contained in this document are a range of sections that describe why, what, and how we approached this year (plus) long effort. This journey has allowed us to grow closer as a community, to build a set of shared values and aspirations, and to imagine innovative ways to think about and deliver high school education. We express our deepest appreciation to the Barr Foundation, and our partners at the The Learning Agenda (TLA), for all the amazing support along the way. While there are many questions that remain, our year-long effort has led us to a working Portrait that we are proud of and inspired by. We look forward to sharing not only our journey, but where we arrived. Our hope is that the deep engagement and thinking that is contained within does not end on the pages of this document, but comes to life in the coming year (s). When that happens, our community, our schools, and our students will experience the benefits that are grounded in our Portrait. While the report is long, with likely more detail than needed, it will memorialize a process, context, and backdrop for those who follow and join our efforts. The document represents many hours and many minds….it is our collective vision. We greatly look forward to your feedback and future possibilities….and encourage ideas, thoughts, suggestions and questions. Again, thanks so much to Barr and TLA for this wonderful opportunity…we are so appreciative. Sincerely, The Berkshire PoG Team
Transcript
1
January 20, 2021 To the Barr Foundation: We are pleased to submit the final (draft) version of the Berkshire Portrait of a Graduate. Contained in this document are a range of sections that describe why, what, and how we approached this year (plus) long effort. This journey has allowed us to grow closer as a community, to build a set of shared values and aspirations, and to imagine innovative ways to think about and deliver high school education. We express our deepest appreciation to the Barr Foundation, and our partners at the The Learning Agenda (TLA), for all the amazing support along the way. While there are many questions that remain, our year-long effort has led us to a working Portrait that we are proud of and inspired by. We look forward to sharing not only our journey, but where we arrived. Our hope is that the deep engagement and thinking that is contained within does not end on the pages of this document, but comes to life in the coming year (s). When that happens, our community, our schools, and our students will experience the benefits that are grounded in our Portrait. While the report is long, with likely more detail than needed, it will memorialize a process, context, and backdrop for those who follow and join our efforts. The document represents many hours and many minds….it is our collective vision. We greatly look forward to your feedback and future possibilities….and encourage ideas, thoughts, suggestions and questions. Again, thanks so much to Barr and TLA for this wonderful opportunity…we are so appreciative. Sincerely, The Berkshire PoG Team
2
Table of Contents: Below the various sections of the Berkshire Portrait (and processes that led to it) are listed. Each section can be hyperlinked by clicking on the section title. Page
I. Executive Summary 6 II. Introduction & Context 10 III. Team Roles & Responsibilities 11 IV. Outcomes and Outputs 15 V. Work Domains 17 VI. Data Overview 26 VII. Findings from Community Outreach 92 VIII. Signature Experience 106 IX. Overview and Portrait Graphic 110 X. Portrait Competencies 112 XI. Action Plan 125 XII. Reflection Questions 137 XIII. Appendix I: Calendar of Key Events 143
Appendix II: High School Interview Questions 147 Appendix III: College Interview Questions 149
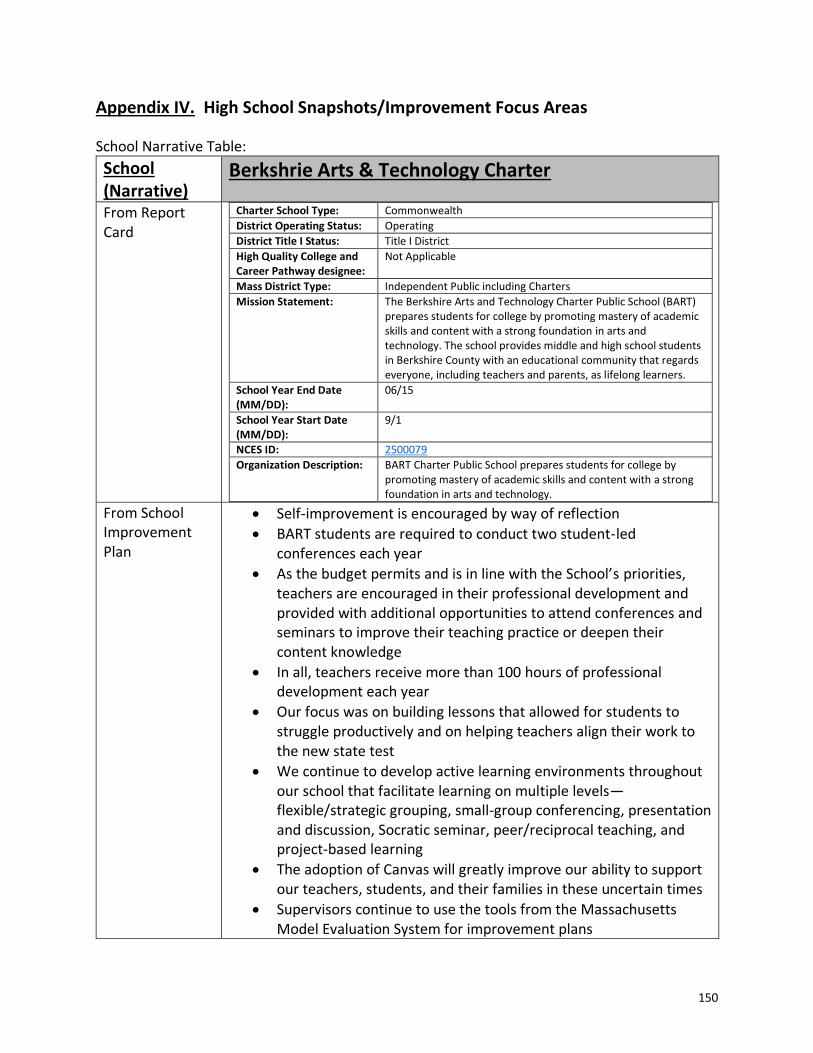
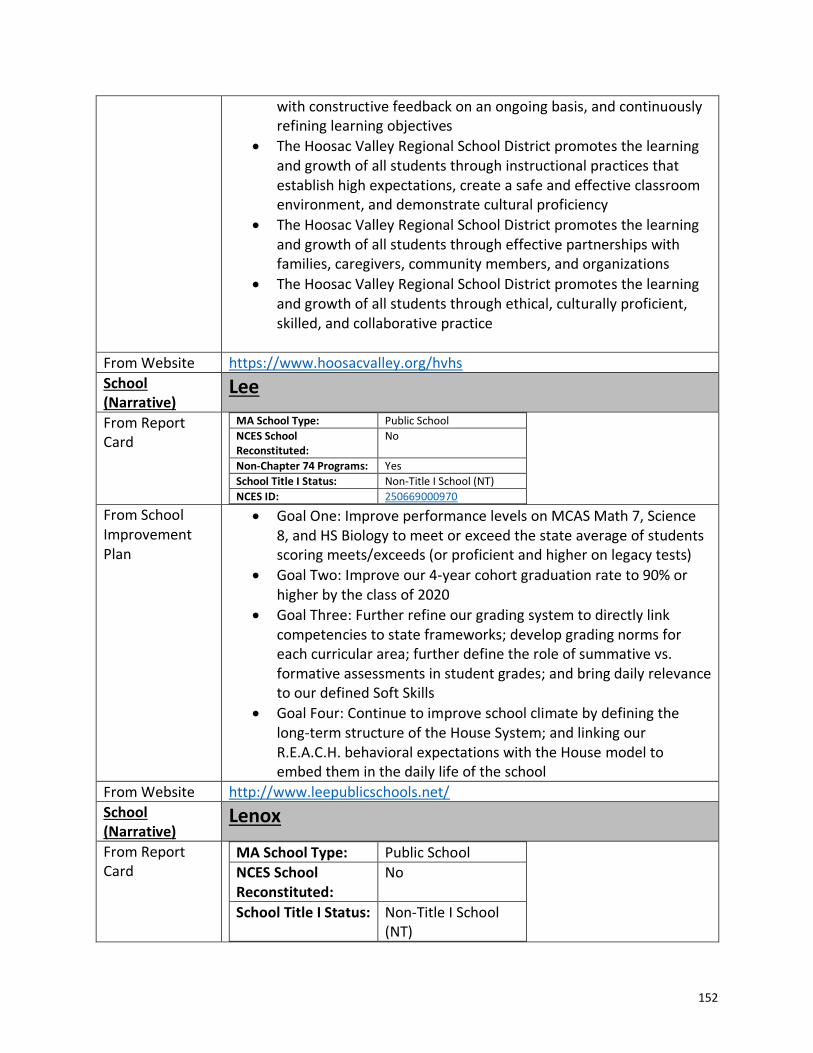
Appendix IV: High School Summaries 150
3
Listing of Tables: Table 1. Berkshire County Secondary Schools Table 2. Grade 9-12 enrollment by high school, 2000 through 2020 Table 3. Class size for ELA, Mathematics, Aggregate, by district Table 4. Advanced Placement Enrollment (# Class sections), by high school Table 5. Choice and Non-resident, by district Table 6. Demography by district, 2010 versus 2020 Table 7. Berkshire County selected student characteristics, 2010 versus 2020 Table 8: Driving times between Berkshire secondary schools, All Table 9: Comparison of High School Ratings, Overall (Great Schools, US News, Niche) Table 10: Comparison of External High School Ratings, Detail (Great Schools, US News, Niche Table 11: Accountability Classification and Percentile, by High School, 2019 Table 12. 10th Grade ELA, % Proficient or Higher, All Students, 2010-2019 Table 13. 10th Grade Mathematics, % Proficient or Higher, All Students, 2010 - 2019 Table 14. Science MCAS by School, 2019 Table 15. Science MCAS, % Proficient or Higher, All Students, 2010-2019 Table 16. Grade 10 ELA MCAS, % Proficient or Higher by Subgroup, with Gap Analysis, 2019 Table 17. Grade 10 Mathematics MCAS, % Proficient or Higher by Subgroup, Gap Analysis, 2019 Table 18. Percentage of SAT Tests per Total Number of Juniors, 2018-2019 Table 19. SAT Reading/Writing Scores, All Students, 2017-2019 Table 20. SAT Math Scores, All Students, 2017-2019 Table 21. SAT 2019, All Students versus Economically Disadvantaged Students Table 22. Advanced Placement Test Patterns, 2017-2019 Table 23. AP Participation, by School, 2017-2019 Table 24. AP Test Scores 3 or higher, by School, 2017-2019 Table 25. AP 2018-19, All Students versus Economically Disadvantaged Students Table 26. AP Courses Offered in 2019, All High Schools, By Course Title Table 27. MassCore Completion by High School, 2015-2019, versus Econ.Dis., 2019 Table 28. Advanced Course Completion, 2018-2020, All versus Economically Disadvantaged Table 29. Four-year Graduation Rates, 2015-2019 Table 30. Graduation, Extended, Dropout, 9th Grade Passing/Retention Rates Table 31. Graduation, Extended, Dropout, 9th Grade Passing/Retention Rates Table 32. CVTE Participation by sub-region, Chapter 74/non-Chapter 74, 2019-20 Table 33. Participation in Chapter 74 Programs, 2015 – 2020 Table 34. Chapter 74 Enrollment by Program, 2018-2020 Table 35. Participation in non-Chapter 74 Programs, 2015 – 2020 Table 36. non-Chapter 74 Enrollment by Program, 2018-2020 Table 37. Placement rates by CVTE Program, Sub-region, 2016 Table 38. Placement rates by non-CVTE Program, Sub-region, 2016 Table 39. Post-graduation Plans, 2015-2019, Berkshire County Table 40. Post-graduation Plans, by School and Pathway, 2019 Table 41. Students Planning for College (2 and 4 year), 2015-2019, by School Table 42. Comparison of 4yr Private versus Public College, by School, 2015-2020 Table 43. Percentage of Students who Work directly after Graduation, by School, 2015-2020 Table 44. Percentage Graduates Enrolled in Postsecondary after Graduation, 2014-2018 Table 46. Student Progression from High School Through College
4
Table 47. Student Persistence in College, 2011 versus 2016 Table 48. Percentage of students at MA public colleges enrolled in 1+ developmental courses Table 49. FAFSA Participation Rates Table 50. Additional High School Data Indicators, 2019
Listing of Figures: Figure 1. Grid of PoG Determined Priority Competencies and Indicators Figure 2. (Working) Berkshire Portrait Figure 3. PoG Team Schematic Figure 4. Working Domain Schematic
Figure 5. Map of Berkshire County Secondary Schools Figure 6. High school enrollment change, 2000 through 2020 Figure 7. High school enrollment, projected % change 2020 through 2030 Figure 8. Monument and Mt. Everett enrollment, comparison 2000 versus 2030 Figure 9. Berkshire County school demography, 2010 versus 2020 Figure 10. MCAS Proficiency versus % Economically Disadvantaged, ELA, 2019 Figure 11: Sample Advanced Coursework District Report Figure 12. Chapter 74 Programs by Trade, Size, and Location, 2019-20 Figure 13. State CVTE Placement Grid, 2016 Figure 14. CVTE Placement, Overview 2016 Graduates Figure 15. CVTE Placement, Overview 2016 Graduates, by Area Figure 16. Plans of Berkshire County Students Post-Graduation, 2015-2019 Figure 17: Annual wages based for the Class of 2015, 2015-2018 Figure 18: Class of 2011, High school to College Progression Figure 19: Community Outreach Overview Figure 20: Course Variety and Rigor Figure 21: Top Readiness Skills Figure 22: Ideas Generated about Project-Based Experiences Figure 23: Career Exploration and Immersion Ratings, Importance Figure 24: Career Exploration and Immersion Ratings, Helpfulness Figure 25: What Alumni would Change Figure 26: What High School Students would Change Figure 27: Three Greatest Strengths of Their High School Figure 28: Academic Competencies, Ranked Figure 29: Things They would Change about High School, Parents & Staff Figure 30: Feedback about Diversity Figure 31: Feedback about Inclusivity Figure 32: Feedback about Courses and Activities
5
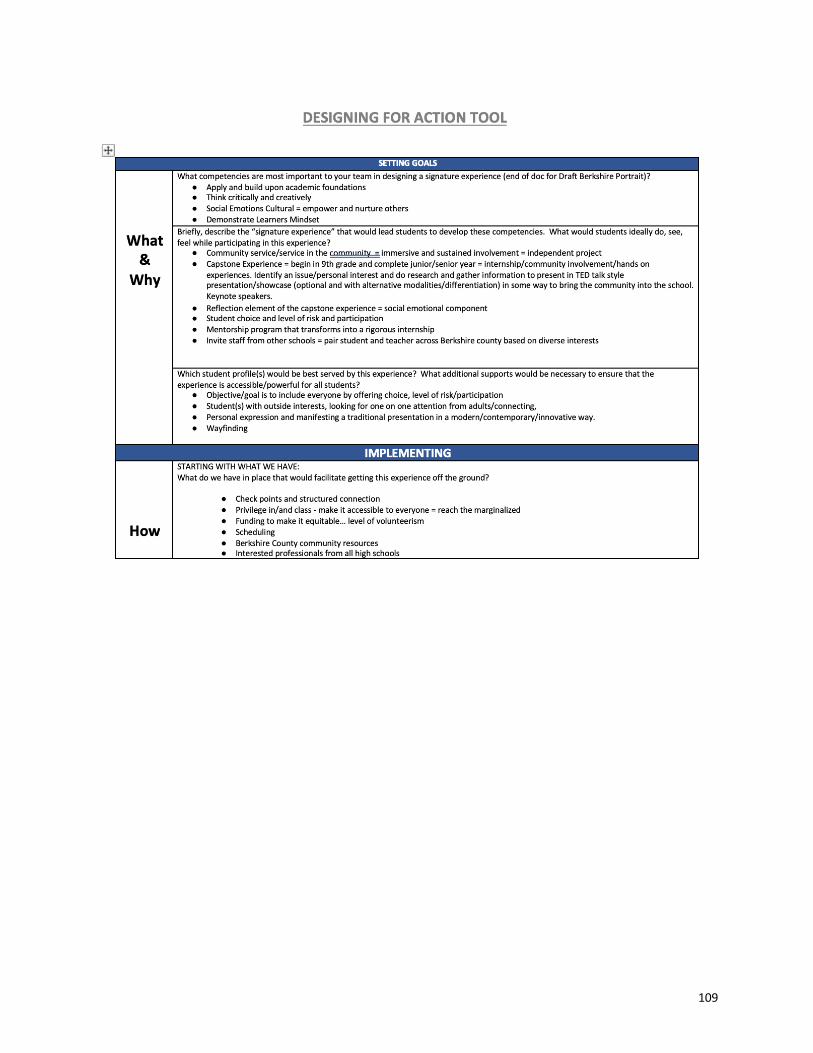
Figure 33: Broad Themes from Convening Figure 34: Designing for Action Tool Figure 35: Berkshire Portrait Grid Figure 36: Action Plan Schematic
6
I. Executive Summary
Five Berkshire County high schools (Lee, Taconic, Pittsfield, Drury, BART Charter) in partnership with Berkshire County Education Task Force (BCETF) and the Barr Foundation, used a highly collaborative and inclusive community engagement process to design a Portrait of a Graduate that:
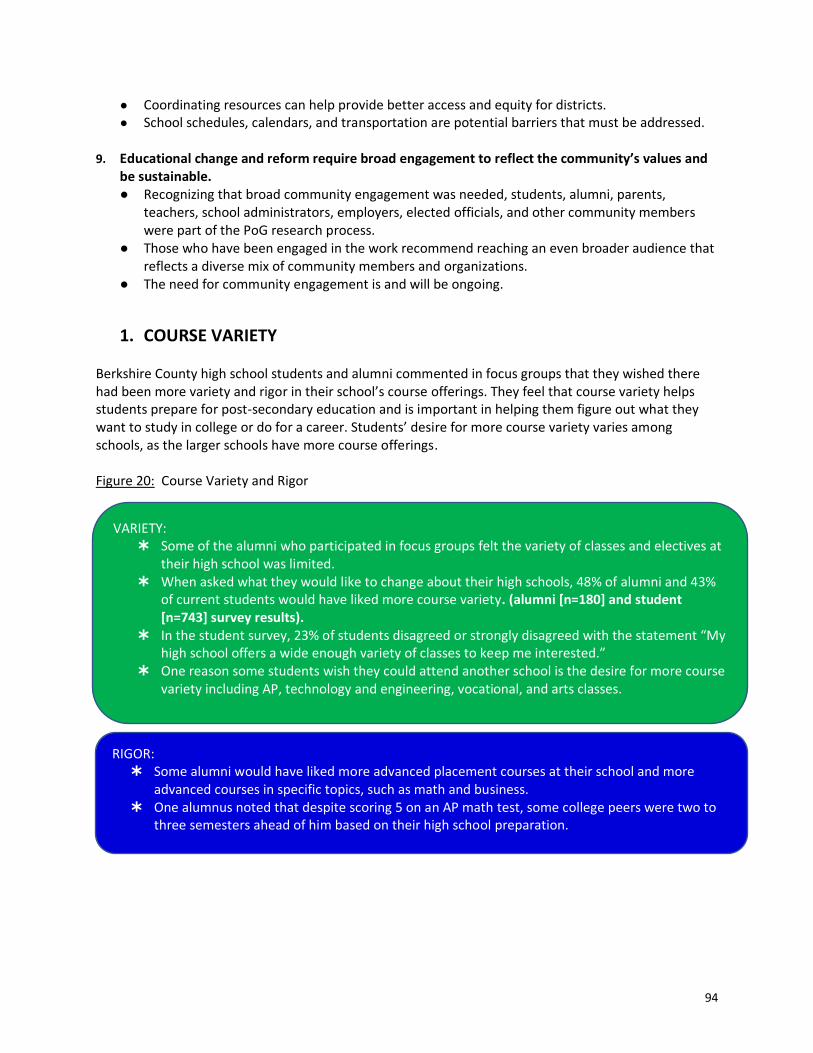
● serves as a shared vision of what’s possible for high school education; ● maps how we cultivate the conditions that ensure students are successfully prepared for
college, career and community life; and ● better positions our graduates to exit with the skills, knowledge and dispositions necessary to
thrive in a rapidly changing world. A year-long process included literature review, data analysis, peer exchange, exploration of innovative/best practices, community engagement through surveys, focus groups, site interviews, and several convenings including a design process that involved stakeholders across the five schools and the
broader community. Over 2,300 individuals from across our region participated in various
engagement/feedback processes during 2020. Nine themes emerged from the data collection efforts, with the different data sources reinforcing one another in many cases. 1. Students desire access to a variety of courses to explore their interests, challenge themselves, and
prepare for further education and career pathways. ● Some schools have fewer options for higher level, elective, vocational, and/or advanced
placements offerings. ● There is less course variety at smaller schools. ● Some students choose (or would choose) to attend different schools to get more course/activity
options.
2. The top readiness skills that high school students need to succeed in the future are responsibility, communication, critical thinking, and problem solving. ● Responsibility refers to taking personal responsibility for one’s words and actions. ● Communications skills take different forms, encompassing oral and written communications as
well as the ability to work collaboratively. ● Critical thinking and problem solving are interconnected.
3. Students develop key competencies through deep, interdisciplinary learning experiences with
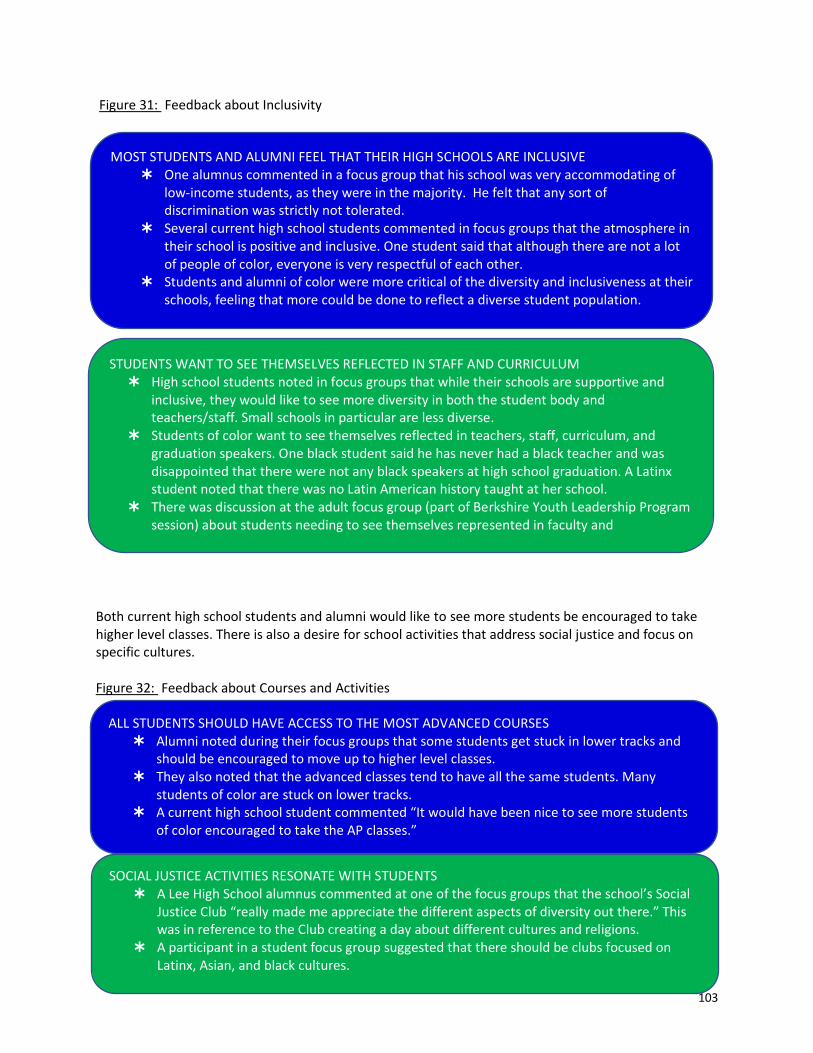
strong community connections. ● These learning experiences can take the form of capstone projects, career activities, community
service projects, or some combination of these and may extend through multiple grade levels. ● Emphasis should be on research and project-based work with connections to real-world
community issues. ● Learning experiences should be focused on students and their learning needs and provide them
with choice based on their interests. ● Students should be provided with mentors as part of these experiences.
7
4. Career activities and exposure help students determine areas of interest and should be offered frequently throughout high school rather than as one-time events. ● Internships and work (field) experiences are viewed as important career exposure for high
school students in, elevating aspirations; engaging in thinking about future possibilities; and increasing connections to the Berkshires.
● Many other career activities are also helpful, such as career fairs, guest speakers, and college visits, and should be made available frequently rather than just as a one-time event
5. Caring relationships and mentoring opportunities with teachers, staff, and adults are a critical part of a high school education. ● Among both high school students and recent alumni, “staff who care about me” was the top
choice when asked to list the three greatest strengths of their high school. ● The top suggestion among community members for addressing achievement gaps was to
provide intensive mentoring and connections with adults.
6. All students need to graduate from high school with practical life skills. ● All students need financial literacy education in topics such as understanding how to complete
financial aid forms, getting loans, saving money, and managing bank accounts. ● Other life skills that are critical are related to everyday living – such as cooking, car maintenance,
or basic household skills (such as laundry). ● All students need life skills, not just those in vocational programs.
7. Cultural competence and awareness are essential for students and staff.
● Both staffing and curriculum need to be representative of the diverse racial and cultural backgrounds of the students served.
● Cultural competency training should be provided to staff and reflected in their teaching. ● All students should be encouraged to take the most challenging courses. Currently, students of
color are underrepresented in these courses.
8. Students and staff are open-minded about collaborating across districts and communities and the benefits it could bring. ● Collaborating across districts could be beneficial in areas such as professional development,
technology, software, and curriculum planning. ● Coordinating resources will provide better access and increased equity for districts. ● School schedules, calendars, and transportation are potential barriers that must be addressed.
9. Educational change and reform require broad engagement to reflect the community’s values and
be sustainable. ● Recognizing that broad community engagement was needed, students, alumni, parents,
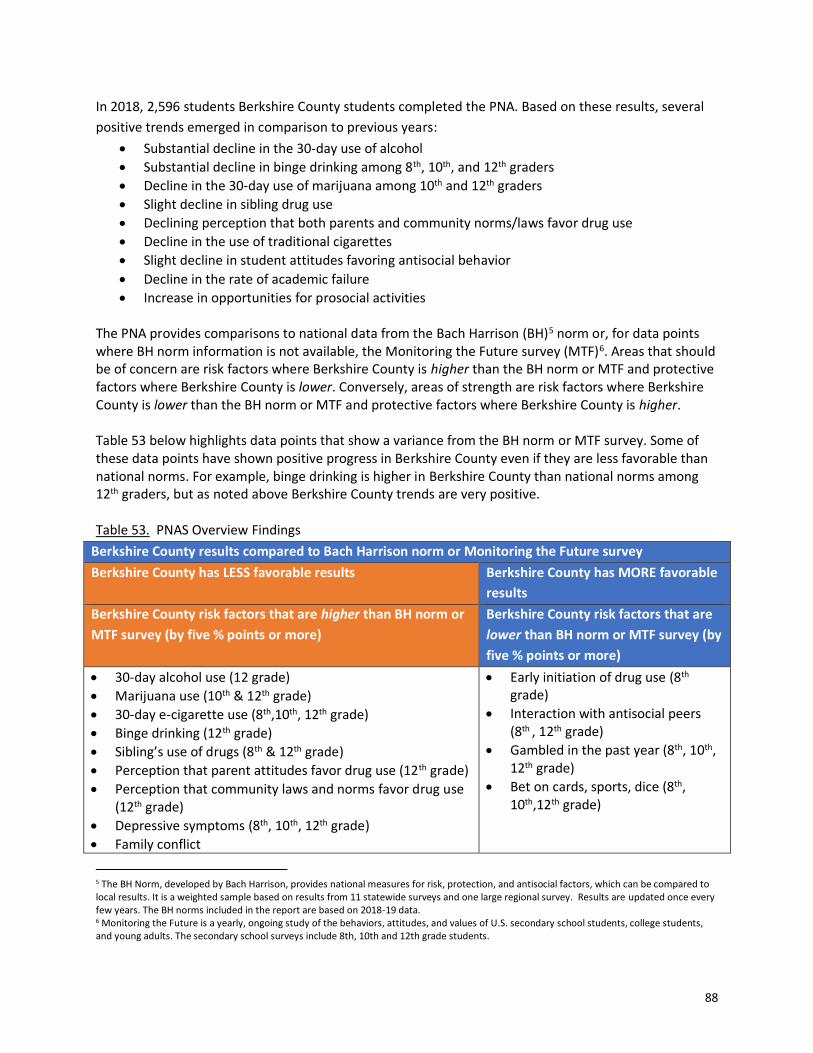
teachers, school administrators, employers, elected officials, and other community members were an integral part of the PoG research process.
● Those who have been engaged in the work recommend reaching an even broader audience that reflects a diverse mix of community members and organizations.
● The need for community engagement is and will be ongoing. This information, combined with exploration of literature and innovative/best practices, peer exchanges, and data analysis, led to the current Berkshire Portrait. It is expected this draft will be graphically enhanced and further circulated for validation and additional feedback in later January
8
through February 2021. The Portrait overview, Figure 1, is provided below, recognizing that each competency is further described in the plan, with illustrations of how each is, can, and will be reinforced through specific student experiences and activities. Figure 1. Grid of PoG Determined Priority Competencies and Indicators
A working draft of the Portrait, see Figure 2, of an initial graphic concept is provided on the next page. Finally, the portrait development process has led the PoG team to explore the design of a Signature Experience that would be developed, shared, and piloted/implemented across all five schools. This experience will likely include reinforcement of several competencies, be delivered in a project-based/applied learning manner, relate to community and/or real-world problems or applications, and actively leverage community assets. We believe this exercise will further mature cross-school partnerships and collaboration, while reinforcing commonly agreed upon competencies described in the Portrait and stimulating deeper alignment, engagement, and commitment in each school and across the broader community.
9
Figure 2. (Working) Berkshire Portrait
10
II. Introduction & Context
The Berkshire Portrait of a Graduate (PoG) grant provided a unique opportunity for cross-district collaboration within Berkshire County. The Berkshire County Educational Task Force (BCETF) and its high school partners were honored to receive $250,000 in funding from the Barr Foundation in support of this important project during the 2020 calendar year. The aim of the project was to support deep research, stakeholder engagement, and discussion leading to a collective vision of what all high school students will know and be able to do by and beyond graduation Inspired by its mission, BCETF mobilized five area high schools to collaborate on a Portrait of a Graduate project for 2020-2021: Drury High School (in North Adams), Lee Middle and High School (in Lee), Pittsfield and Taconic High Schools (in Pittsfield), and Berkshire Arts & Technology (BART) public charter school (in Adams). These five high schools are located in the northern, central, and southern sub-regions of this geographically dispersed county. BART draws students from around the County, including from Pittsfield and North Adams, and outlying areas. Collectively, these high schools serve 2,334 students from the region’s small urban centers (North Adams and Pittsfield), as well as students in the outlying small towns and largely rural areas, representing 48% of the County’s overall high school population. On average, schools involved in this project enroll higher percentages of African-American, Latinx, multi-racial, and multi-ethnic students (up to 34%) than is typical of high schools in the County. The participant schools enroll, on average, high needs students at rates exceeding 50%. As a cohort, we aspired to develop a portrait of a graduate that would be responsive to student and community needs, the realities of our region, and the diversity of our communities. We intended to do this by:
● Powerfully engaging our communities in identifying and addressing countywide challenges; ● Involving schools and communities in envisioning what’s possible for high school education, and; ● Cultivating conditions so all students can successfully prepare for college, career, and
community life.
Our aim was to: ● Prepare each graduate with the skills, knowledge, and disposition to thrive in a rapidly changing
world; and ● Promote equity of opportunity for students from economically disadvantaged backgrounds,
schools, and communities.
In order to achieve these gains and guide our process, we organized work around essential questions
that included:
1. What knowledge, skills, and dispositions will our students need to thrive in a rapidly changing,
unpredictable world?
2. How can we successfully address achievement gaps among different students?
3. How can our schools deepen our collaborative ties to better serve students?
4. How can our schools strengthen our ability to provide high-quality education for all Berkshire
County students in the face of challenges, such as shifting demographics and tight budgets?
11
III. Team Roles & Responsibilities The PoG process began with the formation of the Berkshire PoG team, and included opportunities for engagement and support across a broad range of community stakeholders. Figure 3, below, maps out the major roles associated with our project. Figure 3. PoG Team Schematic
Each of the role types is described briefly below:
Project Manager:
● The Project Manager served as a member of the leadership team, providing overall project coordination. This included: support for post-award implementation, coordinating project activities, scheduling/supporting meetings and timelines, maintaining a budget and managing finances, data collection and analysis, securing of consultants and analysts, organizing community engagement, monitoring progress on key project objectives, facilitating meetings of the working team, ongoing communication with Barr Foundation/The Learning Agenda (TLA), and crafting project documents.
H. Jake Eberwein
Core Facilitators:
● Three Core Facilitators representing geographic sub-regions (north, central, south) convened and led the working team, participated in the cohort learning community, and were the lead champions for the Berkshire Portrait project. This team shouldered a combination of managerial and leadership tasks such as: coordination with Barr/TLA and project consultants and participation in various meetings, webinars and retreats; management of site-based working and design team members; ongoing communication and coordination of effort; review of data and literature; authoring of final portrait document; ongoing work planning; goal setting and monitoring of progress; and general thought leadership for the project.
Working Team Members 2 per school
Core Facilitators (3)
Project Manager (1) Design Team Members
10 per school Consultants Engagement
Barr Team Coach Community Stakeholders
Barr Peer Resources via Networks/TLA
12
Kimberly Roberts-Morandi, North County Brendan Sheran, Central County Jane McEvoy, South County
Working team members: ● Ten working team members (two from each school) engaged in an in-depth examination of the
current conditions for public education, critical challenges and opportunities, and investigation of exemplary models of innovative school design and practice. Working team members shared responsibility for developing the project’s Portrait and action plan, served as facilitators and discussion leaders in community convenings, participated in research and site exchanges, presented to faculty in their home school, and provided ongoing (monthly) constructive feedback and ideas. Kristen Negrini English Teacher Pittsfield High Ann Mutz School Counselor Pittsfield High Marcie Simonds Cooperative Education Coordinator Taconic High Heather McNeice Business Teacher Taconic High Ginger Armstrong Graphic Arts Teacher Lee Middle/High Maria Antil Spanish Teacher Lee Middle/High Tom McCormack Math Teacher Lee Middle/High Tim Callahan Principal Drury High Stephanie Kopala Director of Curriculum and Instruction Drury High Jay White Executive Director BART Sean Keogh Principal BART
Design Team:
● Each school hosted a local, school-based design team (about 10 per site) that worked closely with the core working team to advance the project, maintain open two-way communications, and engage stakeholders in the project’s inquiry, visioning, and design activities. The school-based design teams (a) provided essential linkages between the core working team and local communities, parents, non-teaching staff; and (b) assisted the core working team in facilitating shared understanding and mobilization of community voices.
Taconic High Pittsfield High Drury Kathryn Pratt Anne Marie Mutz Allison Bergeron Meaghan Rogers Brent Bette Melanie Rancourt Heather Thompson Maggie Esko Mike Smith Kristen Jagiello Jennifer Gaudette Erica Manville Chris Crawford Hope Aguilera Krista Gmeiner Jamal Ahamad Mary Morrison Mary Leon-Sweeney Pat Gariepy Tamala Sebring Sara Luczynski Joe Maffucio Todd Eddy Judi Fairweather Heather Mcneice Mary Ott-Dahill Carl Ameen Marcie Simonds Jennifer Hashim Wendy Nelson Carly Daniels Kristen Palatt Stephanie Kopala
Judy Callahan Kim Roberts-Morandi Kristen Negrini
13
Lee BART Francie Jarowski Kate Merrigan Laura Smith Eric Trumble Mary Naventi Deborah Calderara Nicole Clark Sarah Palanjian Thomas Trabka Jess Bouchard Thomas Salinetti Sarah Klein Keri Wade Sean Keogh Gregg Brighenti Stephanie Maselli Kathryn Retzel Jay White Leslie Hickey Alexandra Colbert Maria Antil Thomas McCormack
Barr/TLA Team Coach:
● Throughout the project, Barr offered ongoing literature and human resources to the Berkshire Team. An informal “coach” was assigned and regularly participated in meetings and planning sessions, offering feedback and suggestions, sharing research and resources for the team, participating in agenda setting and data/documents review, serving as a liaison to the TLA/Barr leadership team, and, in general, offering a trusted voice/presence as a member of our Berkshire team.
Michele Phillips, with support from TLA Team
Community Stakeholders:
● The engagement process involved members from across our community that were invited into various activities throughout the PoG project. These included parents, representatives from government, students, alumni, business owners/employers, retirees, representatives from non-profits and social services – for example. These stakeholders participated in targeted presentations and information sharing, surveys, focus groups, and several convenings. Additionally, many engaged through “open” processes such as network meetings, 1:1 conversations, and small group sessions.
An attendance list was maintained and can be provided as requested.
Consultants:
● Our team was very fortunate to secure key consultants who supported various parts of our project. Mary Nash served in an instrumental role in supporting survey construction, delivery, and analysis, focus groups, and has been part of our lead team in writing various elements of this report as well as preparing and delivering presentations. Ben Klompus served as our Convening Facilitator and helped to shape and guide our team through three very engaging and rewarding days that ended up as foundational in building our final Portrait. We received cross BCETF research support from several data specialists including Sarah Carleton, Ken Rocke, and Robert Putnam. Each offered data and insights about high school patterns and trends. Finally, we were able to bring on two college interns, Olivia Carlson and Kamea Quetti-Hall. Both were interviewed as part of our alumni focus groups, and applied for and became part of our research team. Both offered intelligence, hours of excellent work, organizational support, and report
14
synthesis and data analysis. All together, these consultants were integral to the final delivery of this project.
Barr Peer Resources Network: ● The Berkshire Team was fortunate to participate in all webinar and technical assistance
meetings provided by Barr (generally) and TLA as specific to the PoG project. These included dedicated virtual (Zoom) calls with the TLA/Barr leadership team, a number of Barr sponsored webinars, and several TLA convenings. The Berkshire team was pleased to present at the June and November convenings, as well as the December Action Planning workshop. Additionally, resources shared by Barr/TLA with the Berkshire team were used to inform our planning process, and were often shared with regional stakeholders (principals and superintendents) as a useful and relevant resource. Finally, our Berkshire team considers other cohort PoG teams as important partners in our work in that we learned a great deal through peer exchanges/presentations throughout the year. We specifically call out Springfield, Blackstone, Boston Prep., and Lowell. Several team exchanges were made as part of TLA convenings and scheduled meetings.
15
IV. Outcomes and Outputs
As part of the Berkshire PoG proposal, a commitment to target outcomes and outputs was included. These outputs and outcomes, as well as commitments, form the foundation for our team’s work and are listed on the following pages:
Berkshire PoG Outputs:
● Stakeholder engagement through a range of activities throughout the grant period: Over the course of the project the core working team and school-based design teams will facilitate gathering broad community input from representative range of stakeholders through surveys, focus groups, community forums, interviews, and the like.
● Completion of an in-depth examination of gaps in graduates’ readiness for college, career, and community: Members of the working team will complete an in-depth examination of the current conditions for high school education in Berkshire County, as evidenced by meeting minutes and project documents.
● National review of existing student outcome frameworks and exemplary high school portraits of a graduate that will be used to inform and inspire what is possible in a portrait of a graduate: The core working team will complete an in-depth review of research literature and survey of exemplary models for school redesign and student outcomes frameworks, as evidenced by participant enrollment records, post-visit participant reflections and discussions, and project documents.
● Creation of a portrait of a graduate through the identification of the knowledge and skills that all local graduates will attain through their high school experience: The core working team will share a draft portrait of a graduate with participant schools and stakeholders and will solicit community and student input, as evidenced by meeting minutes, media reports, website postings, email newsletters, and other communications.
● Development of a community-owned action plan of next steps for using the portrait of a graduate to drive decisions about policy and practice: The core working team will share a draft of a roadmap with concrete action steps towards implementing the portrait of a graduate with participant schools and community stakeholders and will solicit community and student input, as evidenced by meeting minutes, media reports, website postings, email newsletters, and other communications.
Berkshire PoG Outcomes: ● Increased understanding of Berkshire high school graduates’ readiness for college, career, community
life & regarding the current conditions, challenges, gaps, and opportunities, measured by (see below): o A pre/post survey of parents and families, students, Berkshires residents, and under-represented
communities showing that 90%+ of participants report that issue is important to them o A pre/post survey of School committees, Select Boards, and Superintendents showing that 90%+
of participants report that issue is important to them o Interviews, communications, and media reports showing 90%+ elected officials/policymakers
have knowledge of issue.
● Increased and improved media coverage, o Measured by news stories and media reports with 5+ media articles favorably highlighting
Berkshire Portrait project and project activities ● Increased public will for positive change, measured by (see below):
o Tracking attendance of 100+ participants in public forums, workshops, etc. (parents and families, students, Berkshires residents, and under-represented communities)
o Surveys, focus groups, and interviews of those populations showing 70%+ participants willing to take action to support Berkshires Portrait vision
o Interviews, communications, and media reports showing 90%+ influencers (School committees, Select Boards, and Superintendents) willing to take action to support Berkshires Portrait vision
16
o Interviews, communications, and media reports showing 90%+ elected officials/policymakers publicly support Berkshire Portrait project
● Mobilization of public voices in support of a community-driven portrait of a high school graduate, indicated by 3+ new community advocacy efforts to support Berkshires Portrait vision, through two-way communications between core working group and key stakeholders (parents and families, students, Berkshires residents, and under-represented communities)
In working towards these Outputs and Outcomes, the Berkshire PoG Cohort committed to: ● Engage in learning community activities through full participation in all opportunities offered by the
Portrait of a Graduate learning community facilitator, including convenings, webinars, and other in-person and virtual technical assistance and events.
● Complete the following key activities by the end of the grant period (including): o An in-depth examination of gaps in graduates’ readiness for college, career, and community. o A national review of existing student outcome frameworks and exemplary high school portraits
of a graduate. o Identification of the knowledge and skills that all local graduates will attain through their high
school experience (the portrait of a graduate). o Development of an action plan of next steps for using the portrait of a graduate to drive
decisions about practice and policy to create a responsive high school model. o Demonstrate that the portrait and action plan have been endorsed by the internal and external
community.
17
V. Work Domains The Berkshire PoG Cohort followed a semi-structured work planning process as guided by the Barr Foundation and their project consultant, The Learning Agenda (TLA). The project began with general team organization and orientation, and progressed through the creation of the Portrait, with a targeted completion by late January 2021, and ongoing community engagement through March 2021. An Action Plan has been developed and is provided as part of our future aspirations and next steps.
Figure 4. Working Domain Schematic
The work domains/phases (as outlined above) included key milestones and documentation, briefly described below. It should be noted that recognizing the need to contain the length of this report, links to documents of key interest are provided. Documents not linked can be accessed by request through the Berkshire PoG team. It should be noted that while the COVID-19 pandemic created significant barriers to work planning, our Berkshire PoG team adjusted the plan and shifted (with full enthusiasm) into a virtual/remote system. In many ways, this offered unique opportunities to meet, exchange, and learn without the geographic/travel time constraints.
Team Organization: This first stage included the team formation, identification of roles and responsibilities, recruiting, calendar and work planning, participation in orientation sessions and meetings, development of preliminary project materials for promotion and engagement, paperwork/contracts/budgets, and securing supporting resources (such as consultants and research team):
Accomplished: ● Formation of leadership team ● Recruiting and securing of Working and Design Team members (following district-specific
human resources processes) ● 1-2 leadership team meetings per week, plus ongoing email and phone correspondence ● Monthly working team meetings ● Meeting agendas, evidenced by notes (in some cases in email form) by entire working group and
sub-regional team
Team Organization: Representation, tasks,
timeline, workplan
18
● Communication/engagement (presentations) with working team, design team, school/district leadership teams, school faculty, and district school boards
● Calendar development and work planning (revisited throughout project) ● Securing of consultants (analysts, evaluation, facilitation) ● Development of a shared resource space (a shared Google library of resources, documents,
worksheets, work plans, presentations, etc.) ● Participation in Barr and TLA sponsored webinars and virtual gatherings ● Project Overview created for distribution
● Development of web page
● Social media prompts (discussion questions)
Products: ● Grant application documents ● Job descriptions ● Contact List/Roles for Berkshire PoG Team ● Project description for distribution (long and shorter versions) ● Powerpoint for January TLA/Barr convening ● Meeting template ● Budget documents, and vendor contracts ● District/school agreements ● Work plan, calendar, timeline, and task list ● Website (Available at https://www.berkshireeducationtaskforce.org/pog) ● Shared Google drive of resources (Available by request) ● Meeting agendas, notes (in some cases in email form) by entire working group and sub-regional
team Data Analysis: Data analysis was tackled in concert with the broader BCETF regional project and involved a close look at the Berkshire high schools, with a focus on the five PoG schools. A comprehensive indicator set was developed, and further curated/prioritized by teams, and an initial data set was developed and shared, including broad indicator domains such as demographics, achievement, readiness, and post-secondary outcomes. The four broad PoG essential questions (shared above) were expanded to further guide group data priorities and ongoing conversation/discussions. While not all were specifically answered, we focused our work by asking:
● What is the local context of each PoG high school (basic data profile)? Identify similarities/differences/time patterns.
● What have we learned about our unique context, community? Differences & similarities. ● What assets and experiences do our students bring with them? What challenges and obstacles create
barriers? ● How do we define that our current students are successful, within the Grades 9-12 experience, and
beyond graduation? ● How are we defining postsecondary success for our students? ● Who is currently succeeding by this current definition? Who is not? How do we know? ● Are our students engaged? Unpacked: What are the characteristics of the courses and learning
experiences where students are having the most success or reporting the most engagement, college/career preparation and relevance to their future goals?
● What are the goals our students are working toward in the future, personally and professionally? What are their outcomes in reaching these goals? How do we support future planning, goal setting, college/career readiness?
● Examining competencies (academic, social, civic, readiness) where do our students excel, where are they less successful?
● What might be the most critical data stories we can tell to engage stakeholders? ● How might our definition of postsecondary success and progress monitoring evolve based on new
findings? ● What experiences that don't occur presently (gaps) might be addressed in future school/regional
enhancements & improvements?
● How can we learn from variations among our regional schools in building upon local successes, and closing local gaps?
Additionally, a site interview protocol, see Appendix II (High School) and Appendix III (College), was developed and used with the five schools to identify those data indicators not readily available through publicly accessed data.
Accomplished: ● Development of comprehensive data and indicator list ● Initial data collection by research team ● Bi-weekly data team meetings ● Priority setting by each sub-regional team ● Synthesis of highest priority indicators across the three sub-regional teams ● Completion of data collection by research team (as available) ● Development of site-based interview protocols ● Site-based interviews (high schools and one college) ● Organization and themed coding of site visit information ● Analysis of trends, strengths, gaps, opportunities, and outstanding questions ● Sharing of selected data points with working team members ● Preparation of data slide deck for Community Convening ● Data findings shared with each school-based team ● Several data presentations to PoG and BCETF stakeholders
Products: ● Site Visit Protocols (this was developed but never fully used given the inability to physically visit
schools due to COVID). It was adopted for use in outreach and internal school exchanges ● Priority Data/Indicators (Full list), with indicators curated for a) high schools, b) perception
questions, and c) a full set of district and school indicators ● Additional data indicators - by sub-region team, used to identify priorities ● Responses to priority site questions for high schools and colleges, as well as data gathered via
the site interviews ● Slide deck for Community Convening ● Synthesis of data findings in several reports and presentations ● BCETF full analysis (sections are in the process of being completed and published by topic area)
20
Stakeholder Engagement: A primary emphasis of our project, the stakeholder engagement domain included strategies to include a wide range of stakeholders through a variety of access points such as presentations, focus groups, social media, surveys, meetings, community convenings (design conference) and many incidental 1:1 connections. Over 2,300 individuals participated in this community engagement effort. Specific activities included:
Accomplished: ● Development of stakeholder mapping process (identification of lists of sectors, organizations,
and individuals) ● Prioritization of stakeholder lists (organizations and individuals) by lead team ● Use of webpage and social media presence to engage stakeholders ● Ongoing social media prompts, participant responses ● Presentations to school boards, faculty groups, PoG teams, BCETF committees, and several
community groups (various presentations were created) ● Development of four survey tools (Community Survey, Parent/Staff Survey, Alumni Survey,
Grades 9-12 Student Survey) ● Promotion, circulation, of survey and ongoing data collection/monitoring ● Survey analysis and final report/themes ● Focus group protocol and question sets developed ● Recruitment and delivery of 11 focus groups that included a blended leadership group of
students, adult volunteers involved with the leadership group, alumni from each of the three sub-regions, and students from each of the sub-regions
● Data collection, synthesis and final Focus Group report ● Organization for a three-day community convening with support of the leadership team and an
event facilitator. This included establishing meeting goals, timelines, presentation and supporting materials, breakout spaces and facilitation, invitations and recruiting of participants.
● Delivery of the three-day convening as follows: o Day 1 (August 22): Open Community – Build community interest/engagement, use data
to describe the current context, generate aspirational graduate competencies by examining exemplar and innovative practices/approaches.
o Day 2 (August 23): Lead/Working/Design teams – Use data collected on Day #1 to refine aspirational graduate aims, to evaluate existing assets and gaps in the current school systems, and to map out next steps and the beginning formation of a draft portrait/graduate aims.
o Day 3 (November 3): Open Community – Synthesize and share observations and trends from data (surveys and focus groups) and from Days 1 & 2, react to the draft competencies and offer feedback, consider the beginning steps of envisioning a Signature Experience with a lean towards moving towards action.
● Ongoing 1:1 and small group presentations throughout the duration of this project in building awareness, and gathering feedback from a range of community stakeholders.
Products: ● Powerpoint for faculty meetings (to introduce project) ● Stakeholder Mapping Tool (used to identify categories, organizations, and individuals across the
community). ● Social media posts and discussion questions ● Focus group invitation, protocol, and presentation
21
● Focus group question sets (M. Nash, in concert with leadership team), designed for current students, alumni, and limited adults.
● Four surveys. These included: Community Survey, Parent/Staff Survey, Alumni Survey, Grades 9-12 Student Survey
● Agendas for three convening days, included several note catcher and input tools ● August 20/21 Convening Presentation and supporting documents, notes, and synthesis ● November 3 Convening Presentation and supporting documents, notes, and synthesis ● Full Survey Report Results (M. Nash) ● Focus Group Final Report (M. Nash) ● Summary Presentations (M. Nash, O. Carlson). Several were prepared for BCETF subcommittee,
full committee, and Working Team meetings. An example is the PoG Survey and Focus Group Summary Themes
Benchmarking The intent of the benchmarking phase was to draw from research and best practices to inform our Portrait. This work involved: exchanges across our regional schools in learning about exemplar practices, gaps, and aspirations; a scan of literature related to competencies and the skills/knowledge identified as important among researchers and organizations; and learning from schools (nationally) applying innovative approaches, practices and organizational models in delivering a high school experience. It should be noted, our original goal to visit other high schools (regionally and nationally) was not realized due to the COVID-pandemic travel restrictions.
Accomplished: ● Developed a literature review list of potential sources pertaining to contemporary skills and
competencies from a range of sources. ● Conducted a literature review (lead/working team) of selected sources, including a summary of
each source, key points, outstanding questions, and potential applications to our portrait. ● Generated a list of schools/programs of interest and assigned team members to review two
schools, summarizing how school is organized and operates, noting key practices, and indicating whether additional research (including connections with leadership/faculty) and/or a physical visit would be of benefit.
● Generated a synthesis (through collaborative team process) of emerging themes from the literature and the school review processes. Literature was considered within four domains, including: authentic assessment and engagement; prioritizing and navigating competency domains; resources and offerings; and social network perspective. Schools were evaluated within five criteria, including: innovative practice; social emotional; academic; extracurricular; and community.
● Developed a site visit protocol, applying lessons from the Holyoke site visit protocol, the NSRF school walk protocol, and the ESE Charter School Site visit protocol, and a series of reviewed protocols. Note: This was originally intended for physical site exchanges but later modified to be conducted via Zoom.
● Developed a School Description Template to be used by Berkshire teams, organized into 1) core areas, 2) innovative features/programs/practices, and 3) several prompts.
● Each Berkshire PoG Team completed the School Description Template and then shared with the
entire network virtually. Questions were asked, key features highlighted, gaps/opportunities noted, and findings synthesized into ongoing data set.
● The Berkshire team regularly participated in TLA and Barr Foundation webinars and network meetings, each offering opportunities to learn about exemplar practices, research, and ways of
thinking about competencies and high school organization. We heavily borrowed from peers at Springfield and Lowell, and from national research conducted by Transcend, NGLC MyWays, Springpoint, and Battelle
Products: ● School Description Template ● School Descriptions Completed (by each of the five high schools) ● Review of national schools (Interesting and Exemplars), by team ● Literature and High School Review – main document of a variety of articles, websites, and case
studies related to competencies, innovative practice, etc. ● Literature Review: Emerging Themes – a synthesis along four criteria (assessment/engagement,
competencies, resources/offerings, social network) ● Generated a list of schools/programs of interest and assigned team members to reviewing two
schools, summarizing how school is organized and operates, noting key practices, and indicating whether additional research (including connections with leadership/faculty) and/or a physical visit would be of benefit.
● Generated synthesis (through collaborative team process) of emerging themes emerging from the literature and the school review processes. Literature was considered within four domains, including: authentic assessment and engagement; Prioritizing and Navigating Competency Domains; Resources and Offerings; and Social Network Perspective. Schools were evaluated within five criteria, including: Innovative Practice; Social Emotional; Academic; Extracurricular; and Community.
● Site Visit Protocols (this was developed but never fully used given the inability to physically visit schools due to COVID). It was adopted for use in outreach and internal school exchanges.
● Evidence of participation in all Barr/TLA peer exchanges, networking events, and informational webinars.
Draft Portrait: The Draft Portrait started to emerge in the second half of the calendar year as ideas, themes, and information from our stakeholders emerged. Themes were curated by the leadership/working teams based on the data, benchmarking, and engagement phases and shared with groups for feedback, critique, editing, and validation. Several versions of the Portrait were developed and further informed by Barr/TLA peer exchanges and resources such as Transcend, Battelle, MyWays, and Springpoint. A graphic went through various configurations, with high school students and faculty lending support to the final design. Competencies and indicators (as well as the graphic) were vetted in the November 3 Convening and ongoing leadership/working team meetings. The Final Berkshire Portrait Plan was submitted to Barr/TLA at the end of January 2021.
Accomplished: ● Identification of key competencies through literature reviews, examination of innovative high
school models, exchanges across peer networks, review of regional data, intelligence from surveys, focus groups, and convenings.
● Use of Convenings to develop Portrait themes (competencies) as follows: o Day #1: Participants were asked to respond to key prompts related to the purpose of
high school education, how we create relevant and robust learning experiences, and how we ensure students are prepared for college, career and community. Moreover, they were challenges to reflect on their own experiences, and respond to exciting and promising models – including priority competencies:
23
o Day #2: Competencies were further unpacked and prioritized among Design/Working teams, with a focus on “what matters” in the competency areas of academic, social emotional, multicultural, and 21st century skills. Priorities and gap analysis further strengthened the foundation for the portrait, using a future protocol to imagine outcomes and possibilities.
o Day #3: Sharing of initial Portrait and competencies with opportunities to critique, question, and validate this early draft. Supporting activities were discussed, with high support offered through polling and breakout group sessions. An initial design activity challenged participants to convert competencies to actions through a first-cut Signature Experience.
● Synthesis by research team of findings from retreats, surveys, focus groups, and data sets – cross walked against emerging competencies.
● Leadership/Research Team retreats, three were held. These were used to capture all intelligence and shape out various drafts of the Berkshire Portrait. An outline and approach (writing roles and responsibilities) was developed by the lead/research team. Several drafts were created and included early versions of a Portrait graphic.
● Versions were shared with the Working Team at each monthly meeting, and by Core Facilitators through site and sub-regional team meetings.
● Participation in Barr/TLA organized events that supported Portrait development such as the November 9/10 convening, several meetings with Barr/TLA leads, and the Action Planning workshop (December 14).
● A final Portrait graphic was developed in concert with a faculty member and set of high school students who used early drafts, the final competencies, and various exemplars to build out the final version.
● Submission of Portrait to Barr/TLA in late-January ● Circulation and presentation of Portrait in January – March 2021.
Products: ● Competency charts (used to identify and prioritize key competencies) ● Competency feedback note catchers from meetings and the August and November convenings,
that utilized a variety of tools such as: o Nearpod note collector (key takeaways, additional questions raised) o Open ended participant questions (prompts and priorities) o Polling (How much draft Portrait resonated with the participant) o Small group breakout sessions, shared documents o Collaborate Board o Moving to Action, Resource o Design Challenge note catcher
● Evaluations (by participants) of the three convening days ● Synthesis of the August and November convening themes and notes (O. Carlson, M. Nash) ● Variations of Portrait mock-ups, including several presentations to BCETF, Working Team
members, participants at the November 3 convening, and the TLA/Barr peer networks ● Portrait Outline including draft graphics ● Participation in and presentation at the November 9/10 Barr/TLA gathering and the December
14 Action Planning convening.
24
Action Planning: It would be fair to describe our current project status as entering the Action Planning stage. As we have progressed through the development of our Portrait, we have maintained a strong commitment (bias) towards action as a promise to our community. While the Action Plan is described in detail in our Portrait as a set of team reflections, tangible actions, and proposed next steps – we will seek an ongoing partnership with the Barr Foundation to bring our Portrait to life and into practice. As such, our development process has included considerations of activities (current and to be developed) that support and reinforce our target competencies, as well as a Signature Experience that would be developed, shared, and piloted/implemented across all five schools. This experience will likely include reinforcement of several competencies, be delivered in a project-based/applied learning approach, and relate to community and/or real-world problems and/or applications. We believe this exercise will further mature cross-school relationships, partnerships and collaboration, while offering a unique opportunity to reinforce commonly agreed upon competencies. Our Action Planning Goals (as they stand currently) are:
● Community Outreach, ongoing and expanded ● Alignment at School Level, raise awareness, commitment and integration ● Asset Mapping, of existing resources in the school and the community ● Signature Experience Pilot, across the five schools ● Measurement, develop tools to measure competencies and progress
Accomplished: ● Identification of current practices and activities within our schools and among innovative high
schools that reinforce target competencies ● Initial consideration of a Signature Experience at the Lead/Working Team Levels ● Signature Experience design activity as part of the November 3 Convening - this set a solid
foundation for possibilities and common interests/priorities ● Participation in Action Planning Barr/TLA convening with pre-work that include document
review, development of a concise set of next steps, goals, and team reflections ● Incorporation of peer feedback from the Action Planning convening into the proposed Action
Steps ● Inclusion of described Action Planning Requirements as part of submitted Portrait, with
completed team reflection questions
Products: ● Feedback from the November 3 convening including:
o Designing for Action Tool Feedback (7 breakout groups) that share initial thinking about Signature Experience
o Synthesis Report (Summary Themes) of Feedback from Participants (M. Nash) o Presentation for Action Planning Workshop, December including a draft portrait,
response to a subset of prompts, and outlined next steps o Final PoG Portrait report including Action Steps and Team Reflections
A summarized overview of activities (calendar style) can be found in Appendix I.
25
VI. Data Summary Throughout the development of the Portrait, we were very fortunate to have worked concurrently with the BCETF Research Team. This team, connected by the Project Manager, partnered to identify indicators, build and deliver tools, collect, organize and analyze data. Currently, BCETF is completing a full Educational Indicators Landscape document. Anticipated publication data is early February. Much of the data has been collected, some selected and included in this section. This is not a complete data set, but a solid foundation that outlines the conditions of our region, schools, and students. Access to the reports are available at: https://www.berkshireeducationtaskforce.org/data. Of interest is the About the Berkshires evaluation of a range of community-level variables that (for the sake of space) will not be included in this report. A spreadsheet that includes the various indicators our team considered, sources, questions, and priorities can be accessed by linking to here. What follows are selected indicators and corresponding data. The Berkshire region, secondary schools.
By sub-region, the current secondary schools (17) include: Table 1. Berkshire County Secondary Schools North Central South BART (6-12) Wahconah (9-12) Monument Mtn. (9-12) Drury (7-12) Nessacus Middle (6-8) W.E.B. DuBois (5-8) Mt. Greylock (7-12) Pittsfield High (9-12) Mt. Everett (7-12) McCann (9-12) Taconic (9-12) Lee (7-12) Hoosac Valley (8-12) Reid (6-8) Lenox (6-12) Hoosac Valley MS (4-7) Herberg (6-8)
Marked in red are the PoG high schools. A map of the Berkshires, with placed secondary schools can be found on Figure 5.
Figure 5. Map of Berkshire County Secondary Schools
27
Berkshire enrollment, a focus on high schools. The enrollment in Berkshire schools has been and will continue to decline over the coming decade:
• 15,348. In 2020, students enrolled in Berkshire County public schools with PK & SP.
• 14,748. In 2020, students enrolled in Berkshire County public schools without PK & SP.
28% Current 21% Decline since Enrollment Further Decline by
2000 2020 2030
Below, is historical data on our regional high schools, alphabetized by high school name. It should be noted that enrollment is based on a traditional 9-12 grade span, recognizing that some schools contain additional grades (6, 7, or 8). Most schools across the region have experienced enrollment loss. The exceptions include BART, which did not exist in 2000, and McCann, which has grown and/or maintained enrollment over the last two decades. While the reasons for variations, including school choice and tuition, are not detailed below, enrollment losses have occurred across all Berkshire high schools. An example is Lenox, that has remained stable since 2000 (-0.4% loss), but largely due to an influx of choice students. The greatest losses, since 2000, have been at Hoosac Valley (-56%), Drury (-53%), and Mt. Greylock (-40%). The reductions since 2010 demonstrate similar patterns and offer additional insights on how rapidly student loss is occurring. For many schools, much of the population loss has been realized since 2010 including Drury, Hoosac, Lee, Monument, & Pittsfield – for example. Table 2. Grade 9-12 enrollment by high school, 2000 through 2020 Grades 9-12 Enrollment % Change since High School 2000 2010 2020 2000 2010 BART 0 83 168 NA +102% Drury 632 500 298 -53% -40% Hoosac 559 436 246 -56% -44% Lee 341 339 240 -30% -29% Lenox 262 269 261 -0.4% -3% McCann 451 500 507 +12% +1.4% MMRHS 644 595 501 -22% -16% Mt Everett 291 261 211 -28% -19% Mt Greylock 554 406 330 -40% -19% PHS* 782 972 744 -22.5%* -21.9% Taconic* 786 946 830 Pittsfield Vocational 360 NA NA NA NA Wahconah 745 628 500 -33% -20% Berkshire County 6,407 5,935 4,836 -25% -19% State 265,174 290,080 290,201 +9% 0 *In 2000, Pittsfield had a third high school (on paper), the Pittsfield vocational school. This is added to the 2000 Pittsfield totals to calculate total change. Percent change (on the PHS line) represents a combination of PHS, Taconic, and Pittsfield Vocational.
28
This data is displayed below in graphic form on Figure 6, sorted by highest enrollment declines since 2000.
Figure 6. High school enrollment change, 2000 through 2020
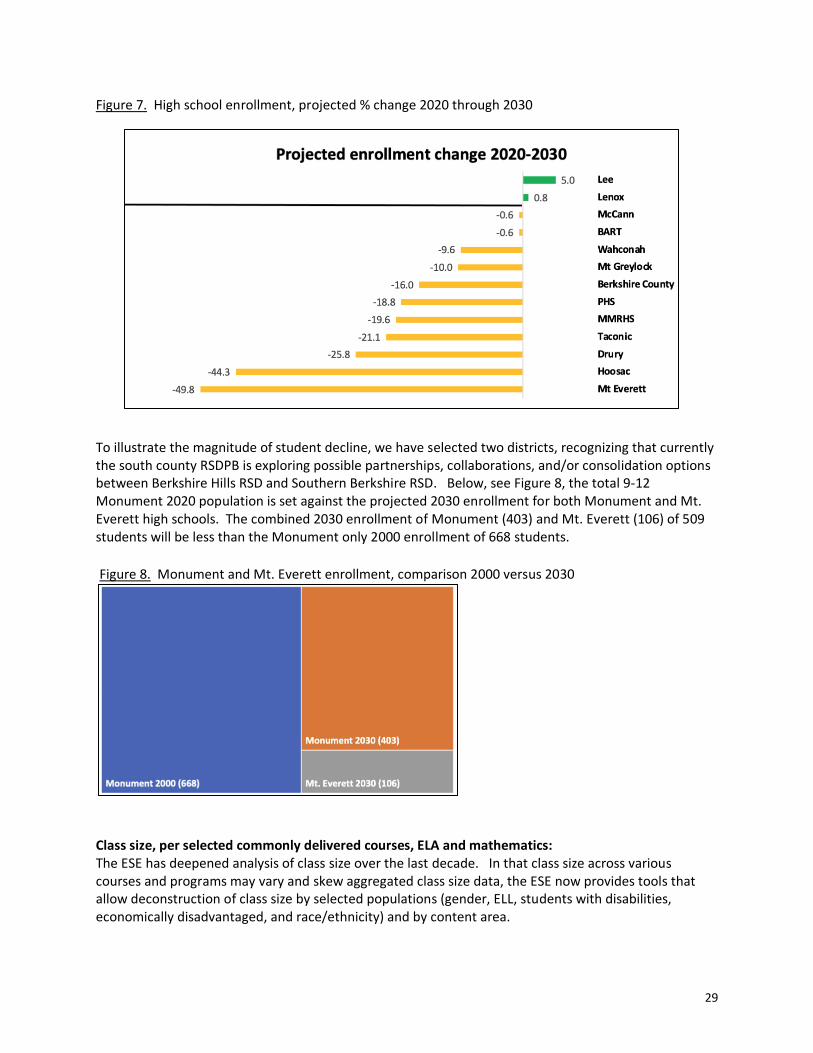
High School, Projected Enrollment: High schools were specifically examined earlier in this section, and to further illustrate the decline, Figure 7 below displays the change in high school enrollment that is expected to occur by 2030. Mt. Everett is projected to lose almost half its current population over the next 10 years, and Hoosac will lose 44%. Drury will lose about one-quarter, and Taconic, Monument, and Pittsfield High, about one-fifth each. Greylock and Wahconah will lose about 10% of their Grades 9-12 students. BART, McCann and Lenox will remain stable, while Lee will have a short-lived spike, as larger cohorts of elementary and middle school students track through the high school. This data can be combined with 2000-2020 losses, resulting in the prediction that between 2000 and 2030 Hoosac Valley will have lost 75% of its Grades 9-21 students, Drury (65%), Mt. Everett (-64%), Mt. Greylock (-46%), and Monument (-39%).
29
Figure 7. High school enrollment, projected % change 2020 through 2030
To illustrate the magnitude of student decline, we have selected two districts, recognizing that currently the south county RSDPB is exploring possible partnerships, collaborations, and/or consolidation options between Berkshire Hills RSD and Southern Berkshire RSD. Below, see Figure 8, the total 9-12 Monument 2020 population is set against the projected 2030 enrollment for both Monument and Mt. Everett high schools. The combined 2030 enrollment of Monument (403) and Mt. Everett (106) of 509 students will be less than the Monument only 2000 enrollment of 668 students.
Figure 8. Monument and Mt. Everett enrollment, comparison 2000 versus 2030 Class size, per selected commonly delivered courses, ELA and mathematics: The ESE has deepened analysis of class size over the last decade. In that class size across various courses and programs may vary and skew aggregated class size data, the ESE now provides tools that allow deconstruction of class size by selected populations (gender, ELL, students with disabilities, economically disadvantaged, and race/ethnicity) and by content area.
30
A comprehensive report of class size could be extrapolated by district, school, and a variety of selected categories, and we will limit our analysis to all students in two content areas, ELA and mathematics, see Table 3. These have been selected because all students across all grades participate in these content areas. We suggest these data can serve as another reasonable measure of class size variability. Using the Massachusetts ELA average of 17.0 as a benchmark, six districts reported larger class size (Berkshire Hills, Richmond, Central Berkshire, BART, North Adams, and Northern Berkshire RVT). In mathematics, Richmond and Central Berkshire exceed the Massachusetts average of 17.9, with Berkshire Hills, BART, and North Adams just under this average. Smallest average class sizes go to Lee, Florida, Savoy, Farmington River, Pittsfield, and Southern Berkshire in ELA. In math, smallest class sizes were reported in Lee, Florida, Savoy, Farmington River, and Southern Berkshire. The state also aggregates a student-to-teacher ratio overall for each school. This is an accounting of how many students attend school for every one teacher. This aggregated variable, as with most class size variables, must be considered at face value recognizing that students and teachers are grouped and assigned in a variety of ways across the schools and, in some cases, coded on state reports differently. Still, this analysis offers some additional insights. Overall, the lowest student to teacher ratio belongs to several of the smallest districts including Hancock, Savoy, Richmond, Farmington River, Florida and Southern Berkshire RSD. This continues a somewhat consistent trend of more adults per child in smaller schools. The largest class size also belongs to a small school, Clarksburg, with Hoosac Valley RSD, Central Berkshire, and Northern Berkshire RVT also among larger class size districts. In total, the Berkshires generally have smaller aggregate teacher-to-student ratios than Massachusetts (12.6). While this does raise questions about whether districts are maximizing student grouping (class size) across the county, it does also serve as a point-of-pride when we share benefits about Berkshire public schools. Table 3. Class size for ELA, Mathematics, Aggregate, by district Average class size for: Aggregated District ELA Mathematics All classes/subjects Berkshire Hills RSD 18.3 17.3 10.4 Farmington River 13.2 13.3 8.6 Lee 10.6 13.3 10.0 Lenox 15.6 15.4 9.8 Richmond 17.9 18.5 8.5 Southern Berkshire RSD 13.9 13.5 8.8 Central Berkshire RSD 18.2 18.7 12.8 Pittsfield 13.6 14.7 10.7 Berkshire Arts & Technology 18.3 17.3 10.1 Clarksburg 14.4 14.4 13.8 Florida 10.2 8.5 8.8 Hancock 5.8 5.8 17.4 Hoosac Valley Regional RSD 15.8 16.1 12.8
31
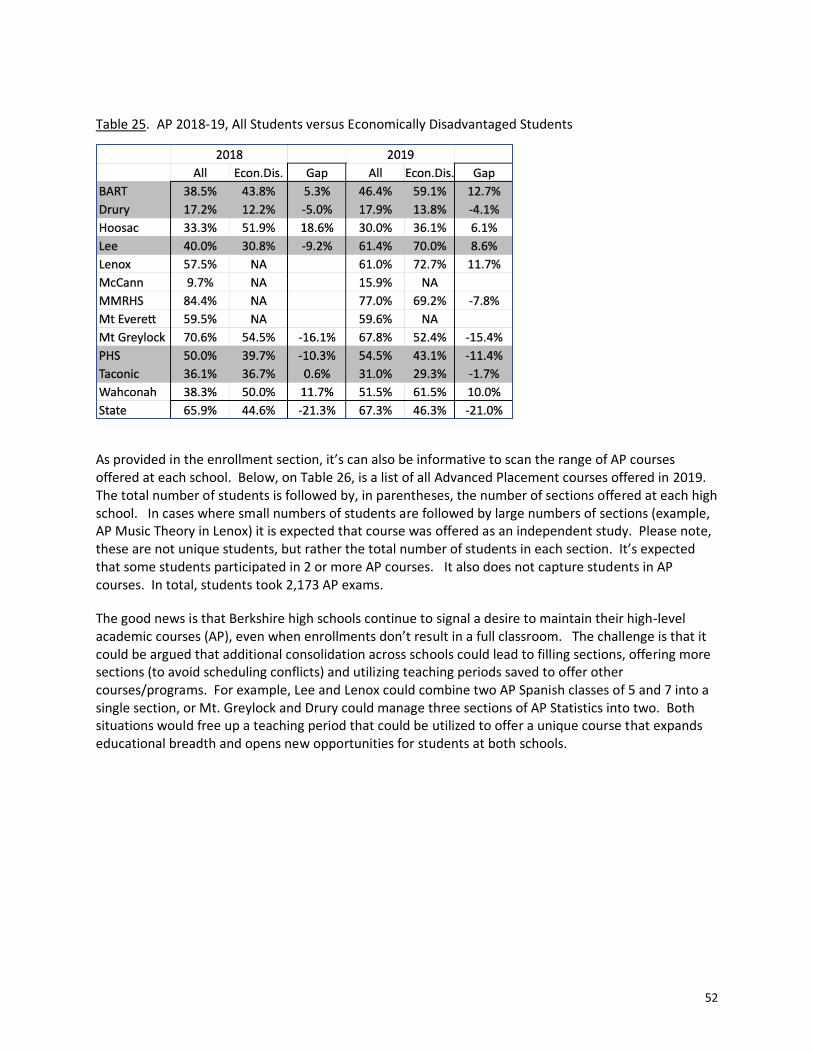
Mt. Greylock 16.4 15.2 11.0 North Adams 17.1 17.4 10.5 Northern Berkshire RVT 18.7 16.5 12.0 Savoy 8.4 8.9 8.9 Massachusetts 17.0 17.9 12.6 Class size, enrollment in Advanced Placement (AP) courses: While AP courses will be explored in additional detail in the educational indicators section, enrollments in AP courses are offered as a proxy for elective courses class size at the high school level. Below, Table 4, is a list of all Advanced Placement courses offered in 2020. The total number of students is followed by, in parentheses, the number of sections offered at each high school. In cases where small numbers of students are followed by large numbers of sections (example, AP Music Theory in Lenox) it is expected that course was offered as an independent study. The aim of this grid is to determine to what degree high schools are making the decision to offer low enrolled AP courses. Clearly, there is evidence where single sections (AP Calculus at Drury with six students and AP Physics with four students in Lenox) are scheduled. In other cases, two sections of a course (AP English with 21 students in 2 sections, and AP Statistics with 18 students in two sections at Mt. Greylock) are scheduled with 10 or fewer students. This signals a desire for schools to maintain their high-level academic courses, even when enrollments don’t result in a full classroom. It could be argued that additional consolidation across schools could lead to filling sections, offering more sections (to avoid scheduling conflicts) and utilizing teaching periods saved to offer other courses/programs. For example, Lee and Lenox could combine two AP Spanish classes of 5 and 7 into a single section, or Mt. Greylock and Drury could manage three sections of AP Statistics into two. Both situations would free up a teaching period that could be utilized to offer a unique course that expands educational breadth and opens new opportunities for students at both schools.
32
Table 4. Advanced Placement Enrollment (# Class sections), by high school School Choice: Finally, choice (free movement between districts) offers a deeper understanding of patterns and trends. It should be noted that choice is allowable via state regulation as long as districts participate and establish enrollment targets by school committee vote. Choice students/families, while able to attend school outside of the town of residence, have to provide their own transportation to/from school. It has been argued this creates equity issues of who does and doesn’t have access to the choice program. Several studies have been conducted about choice, and reasons for family/student participation in choice can be based on school/district size, perception of quality and breadth of curriculum, geographic convenience, and perceptions of school safety, for example. Below, Table 5, is a listing of the % of choice-in students that comprise a district’s total enrollment. Additionally, % non-resident is noted and includes tuition students who arrive in a district from a town that does not operate its own school (entirely or by grade span). Choice continues to serve as a primary enrollment driver for several districts such as Lenox (39%), Richmond (36%), Clarksburg (34%) and Florida (27%). Districts with low choice-in numbers include
33
Pittsfield (2%), North Adams (4%) and Hoosac Valley (3%). When tuition is added to choice, total non-resident students rises among several districts including Richmond (44%), Florida (42%), and Savoy (50%). The movement of students has significant fiscal implications that will be discussed later in this report. Table 5. Choice and Non-resident, by district
Choice as percentage (%) of total enrollment (2018) %Choice %Non-Resident Berkshire Hills RSD 20% 26% Farmington River 17% 22% Lee 20% 28% Lenox 39% 40% Richmond 36% 44% Southern Berkshire RSD 13% 15% Central Berkshire RSD 14% 15% Pittsfield 2% 2% Berkshire Arts & Technology - 100% Clarksburg 34% 35% Florida 27% 42% Hoosac Valley Regional RSD 3% 4% Mt. Greylock 7% 13% North Adams 4% 8% Northern Berkshire RVT 0% 15% Savoy 45% 50%
School demography, race and ethnicity: School Demography is relatively consistent with regional trends as outlined in the About Berkshire County section. Overall, see Figure 9, the county remains predominantly White, although there has been a decline from 86% to 78% White between 2010 and 2020. This is captured, mostly, in a rising Hispanic population and more students of other races/ethnicity (6% in 2020). Figure 9. Berkshire County school demography, 2010 versus 2020
34
By district, there are greater fluctuations in demographic profiles. Below, Table 6, changes within four ethnic/racial subgroups are compared by district and between 2010 and 2020. The most diverse district in 2020 is Pittsfield, at 62% White, down from 76% in 2010. While most districts have seen a decline in the % of White students, BART, Berkshire Hills, Lenox, and Savory saw double digit decline between 2010 and 2020. Pittsfield and BART hold the highest percentages of African American/Black students just over 10% of their student body. Pittsfield has the highest % of Asian students (8%). The population most on the rise, consistent with general population demographic shifts, are Hispanic students. Pittsfield (16%), Berkshire Hills (11%), Lee (10%), and BART (10%) all have experienced increases in this demographic category since 2010. While the Berkshires are slowly becoming more diverse, as follows general population trends, the region remains much less diverse than all of Massachusetts where less than 70% are White, more than 20% are Hispanic, with African American/Black and Asian students just under 10%. Table 6. Demography by district, 2010 versus 2020
Beyond race and ethnicity, enrollment can also be analyzed by economic need, students with disabilities, and numbers of English Language Learners, see Table 7. The metric for Low-Income1 and Economically Disadvantaged2 changed between 2010 and 2020, thus it is not a perfect apples-to-apples comparison. Still, both offer a relative standard to benchmark against. Across the board, general economic needs among student populations is on the rise. North Adams (62%) and Pittsfield (54%) both meet/exceed the state average, while Hoosac Valley (51%) and Savoy (50%) also report high percentages of students who are economically disadvantaged. Lenox (11%), Mt. Greylock (12%) and Hancock (11%) have among the lowest percentages of students who are economically disadvantaged. Special education ratios across the Berkshires are varied, and likely rise/fall based on unique student needs, the identification of students for services, response capability of district, and district size. Ten districts (Berkshire Hills, Farmington River, Pittsfield, BART, Clarksburg, Florida, Hancock, Hoosac Valley, North Adams and Savoy) all meet/exceed the state average/Berkshire (19%) of students who are identified with disabilities, while Lenox (10%), Central Berkshire (14%) and Mt. Greylock (15%) report the fewest students with disabilities. Pittsfield (5%), Berkshire Hills (4%) and Lee (4%) report the highest numbers of students receiving English Language Learner services/supports. It should be noted that the ESE does report students for whom English is not a first language and this number is higher among districts, recognizing students who may have exited formal services. Overall, the Berkshires (3%) has relatively modest ELL populations as compared to the state (11%). Table 7. Berkshire County selected student characteristics, 2010 versus 2020
Low Inc. Special English High Econ Dis. Education Learners Needs
1 Indicates the percent of enrollment who meet ANY ONE of the following definitions of Low-income: The student is eligible for free or reduced price lunch; or The student receives Transitional Aid to Families benefits; or The student is eligible for food stamps 2 Calculated based on a student's participation in one or more of the following state-administered programs: the Supplemental Nutrition Assistance Program (SNAP); the Transitional Assistance for Families with Dependent Children (TAFDC); the Department of Children and Families' (DCF) foster care program; and MassHealth (Medicaid).
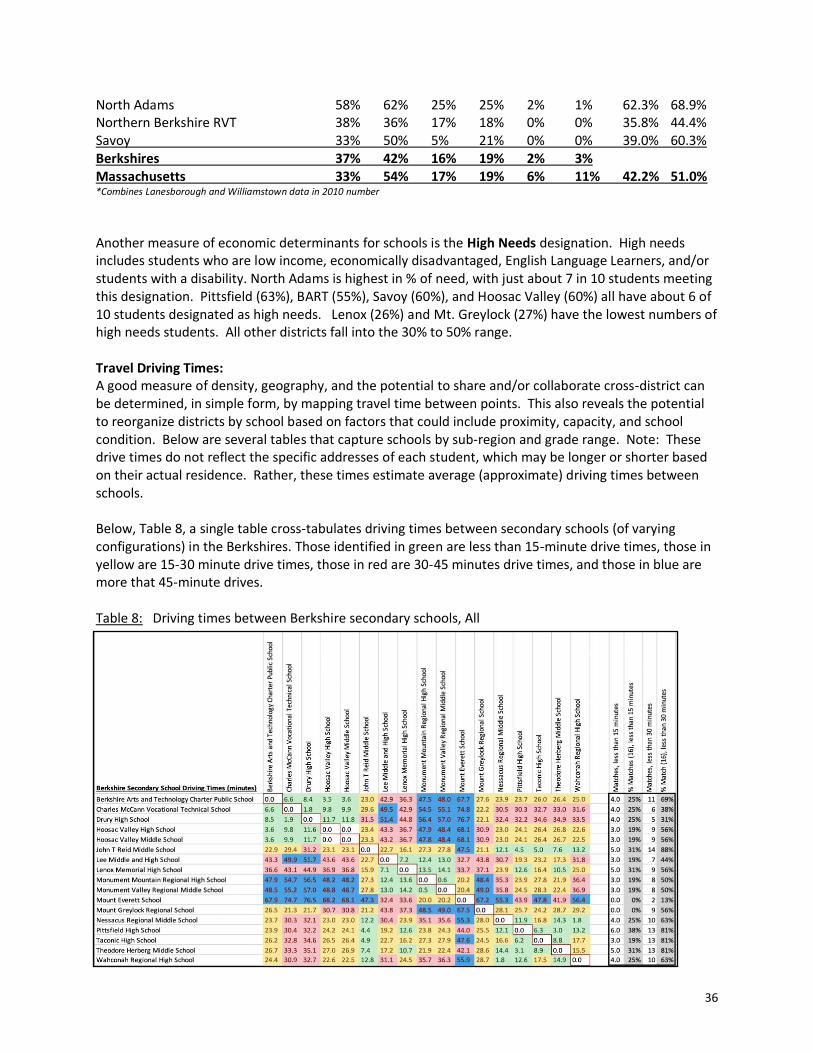
Another measure of economic determinants for schools is the High Needs designation. High needs includes students who are low income, economically disadvantaged, English Language Learners, and/or students with a disability. North Adams is highest in % of need, with just about 7 in 10 students meeting this designation. Pittsfield (63%), BART (55%), Savoy (60%), and Hoosac Valley (60%) all have about 6 of 10 students designated as high needs. Lenox (26%) and Mt. Greylock (27%) have the lowest numbers of high needs students. All other districts fall into the 30% to 50% range. Travel Driving Times: A good measure of density, geography, and the potential to share and/or collaborate cross-district can be determined, in simple form, by mapping travel time between points. This also reveals the potential to reorganize districts by school based on factors that could include proximity, capacity, and school condition. Below are several tables that capture schools by sub-region and grade range. Note: These drive times do not reflect the specific addresses of each student, which may be longer or shorter based on their actual residence. Rather, these times estimate average (approximate) driving times between schools. Below, Table 8, a single table cross-tabulates driving times between secondary schools (of varying configurations) in the Berkshires. Those identified in green are less than 15-minute drive times, those in yellow are 15-30 minute drive times, those in red are 30-45 minutes drive times, and those in blue are more that 45-minute drives. Table 8: Driving times between Berkshire secondary schools, All
37
While in some regions of the US school commutes can be an hour more, it could be reasonably determined that green (15 minutes or less) and yellow (15 – 30 minutes) estimated drive times offer opportunities for realistic partnerships across Berkshire secondary schools. 15-Minute driving matches: Among secondary schools, there are varying opportunities for 15-minute connections. Two schools (Mount Everett & Mount Greylock) have no matches. The balance of schools have 3-5 matches, representing 20 – 30% of secondary schools. 30-Minute driving matches: When extended to 30 minutes or less, all schools including Mount Everett (2), have matches. Matches vary from 5/31% (Drury) to over 80% for the Pittsfield secondary schools. This suggests that students in Pittsfield can travel to 81% of secondary schools in Berkshire County and, conversely, 81% of secondary students across the Berkshires can travel to Pittsfield in 30 minutes or less. While geography (driving distances and times) presents real barriers within the Berkshires, there are many opportunities for consolidations, partnerships, and shared resources across geographically proximate districts that allow for physical, in-person experiences. These could include, where driving distances are reasonable:
● Student access to courses, programs, and co-curriculars across buildings/campuses ● Shared center-based programs that address specialized student needs (special education, ELL,
vocational, etc.) ● Sharing of staff across multiple buildings/campuses ● In-person professional development ● Consolidation of grade level classrooms across school building ● Shared back-office and facilities staff and service where physical access is required ● Specialized programs that allow students to spend part of the day at their home school, and part
of the day at another facility where they participate in unique programming or have access to specialized services
This analysis does not take into account the recent remote learning environment that has been accelerated through the COVID-19 pandemic. A hybrid approach of offering some coursework virtually using technology, as is happening now, and in-person, as could occur through the reasonably documented drive times, may be a promising practice for cross-district collaboration and the expansion of academic, support services, and enrichment opportunities for students across the region.
Building/Facilities: A full review of school buildings in the Berkshires can be found at: https://www.berkshireeducationtaskforce.org/data This report offers an historical, current, and future look at Berkshire schools, including the physical condition of the building and its capacity. Two high schools (Monument and Pittsfield) were identified as schools in significant need, while a number of new high school projects have been launched in the last 5 years. Overall, the findings included, that across the Berkshires:
● The MSBA rates ten schools as level 3 or 4, signaling a need for capital improvements to these facilities in the near future
● Twenty-eight schools are currently rated as under-utilized by the MSBA
● By 2030, Berkshire schools will be at around 54% capacity. Of 45 operational buildings, around 25 will be at 50% or lesser utilization as projected by 2030
These trends may offer opportunities to consider the full and strategic use of facilities across the Berkshires, recognizing the complexities of student flow, geography, grade spans, and community culture. Given these considerations, there is high potential to contain capital and operational costs of our facilities, strategically invest in our facilities to ensure they are of the highest contemporary standard, while using excess capacity to expand programs and opportunities (such as vocational, special education, and early childhood). Berkshire High Schools: Great Schools, US News, Niche Below on Table 9, we used a comparison of three external rating systems, Great Schools, US News, and Niche. Both US News MA rankings and Overall Score is provided. Green cells signal the “top” performing school, with red signaling lower ranking/rated schools. The consistently highest rated/ranked schools are Lenox, Mt. Greylock, and BART. All three earned top ratings in the Great Schools and US News categories, with Lenox and Mt. Greylock also receiving a top Niche rating. Monument is the only school to receive an A by Niche, and received a 6 from Great Schools, yet received a lower rating from US News. Lee, Wahconah and Mt. Everett also received on the higher end of the Great School ratings. Drury was rated lowest among area high schools across all ratings systems. Hoosac was rated lower by both Great Schools and Niche, while Taconic was rated lowest by Great Schools and lower by US News. Finally, Pittsfield High has a lower rating by Great Schools. Table 9: Comparison of External High School Ratings, Overall (Great Schools, US News, Niche)
Schools Great School Overall Score*
US News (MA) Rank
US News Overall Score
Niche Overall Grade
Berkshire Arts and Technology 6 16 96.84 B-
Drury High 4 257 50.51 C+
Hoosac Valley High 4 136 80.73 C+ Lee MS/HS 7 155 76.58 B
Lenox Memorial High 8 32 94.91 A-
McCann Technical RVT 4 B-
Monument Mt Reg'l High 6 182 72.55 A
Mt Greylock Reg'l High 7 61 91.71 A-
Mt Everett Regional 6 89 87.67 B Pittsfield High 4 161 76.16 B
Taconic High 3 224 63.43 B
Wahconah Reg'l High 7 183 72.16 B *10 is highest quality score, 1 is lowest quality score
A more detailed analysis, see Table 10, reveals a bit more detail about the regional high schools, with several curated additional indicators added. These include college readiness/preparation, student progress, test scores/academics, and diversity. Some outliers include:
39
• Pittsfield High and Drury, both with lower ratings but higher student progress scores (improvement among their student body) while Mt. Greylock with higher ratings but lower student progress scores.
• College readiness deemed highest at Lenox (10) and 6 or higher for BART, Lee, Monument, Mt. Greylock, Mt. Everett, and Wahconah. However, under the US News methodology, Mt. Everett and Wahconah had lower college readiness ratings as compared to their Great Schools score.
• Three school earned A’s in diversity including BART, Pittsfield High, and Taconic. • McCann is a bit of an outlier given their focus on CVTE pathways, thus not all data is
reported and/or comparable.
Table 10: Comparison of External High School Ratings, Detail (Great Schools, US News, Niche)
Berkshire High Schools, DESE Accountability: When examining accountability at the school level, an additional indicator is added in, Accountability Percentile. This is a normative variable compares schools (within three similar grade configurations) by ranking them on a scale of 1 (low) to 100 (high). This is used to identify the lowest performing schools (which then may result in DESE intervention and planning processes). Below, high school data is displayed in Table 11. Accountability percentiles are not completely comparable given that middle/high schools (for example, 7-12) and pure high schools (9-12) are not in the same normative group. Still, this data offers limited insights. Five high schools displayed significant progress (green) towards goals including BART, Lee, Lenox, McCann, Mt. Greylock, and Mt. Everett. Drury and Taconic were both classified as in need of focused/targeted support (grey) for being in the lowest 10% of schools and low subgroup performance. Taconic was also the only school to report limited or no progress (red) towards goals. Pittsfield High also ranked lower, at the 26th percentile.
40
Table 11: Accountability Classification and Percentile, by High School, 2019 Schools Accountability Classification Progress
Towards Targets
Accountability Percentile
Berkshire Arts and Technology
Substantial progress toward targets 54% 74
Drury High Moderate progress toward targets In need of focused/targeted support Among the lowest performing 10% of schools Low subgroup performance: White
40% 7
Hoosac Valley High Moderate progress toward targets 48% 19
Lee MS/HS Substantial progress toward targets 52% 51
Lenox Memorial High Substantial progress toward targets 73% 92 McCann Technical RVT Substantial progress toward targets 52% 48
Monument Mt Reg'l High Moderate progress toward targets 42% 41
Mt Greylock Reg'l High Substantial progress toward targets 67% 69
Pittsfield High Moderate progress toward targets 41% 26
Taconic High Limited or no progress towards goals In need of focused/targeted support Among the lowest performing 10% of schools Low subgroup performance: White
13% 10
Wahconah Reg'l High Moderate progress toward targets 36% 47
High School Indicators: Five Berkshire County high schools (Lee, Taconic, Pittsfield, Drury, BART Charter, in partnership with Berkshire County Education Task Force (BCETF) and the Barr Foundation, used a highly collaborative and inclusive community engagement process to design a Portrait of a Graduate that:
• serves as a shared vision of what’s possible for high school education • maps how we cultivate the conditions that ensure students are successfully prepared for
college, career and community life • better positions our graduates to exit with the skills, knowledge and dispositions necessary to
thrive in a rapidly changing world.
A year-long process included literature review, data analysis, peer exchange, exploration of innovative/best practices, community engagement through surveys, focus groups, site interviews, and several convenings including a design process that involved stakeholders across the five schools and the broader community. Over 2,300 individuals from across our region participated in various engagement/feedback processes during 2020. A full report that documents our efforts, includes a range of data sources, includes our Portrait, and outlines next steps/action plan, can be found at https://www.berkshireeducationtaskforce.org/data. As suggested, part of our effort explored available data in understanding the conditions of our high schools and identifying both gaps and opportunities. While not exhaustive, the results of this work is provided below:
High School, MCAS Performance, ELA. The 2010-2018 10th grade ELA MCAS, see Table 12, data cannot be directly compared to the 2019 data because of the change in the design of the assessment. The 2010-2019 data provide three different points for comparison: 2010-2018 data show the relative success schools were having in preparing 10 grade students to pass the MCAS; 2019 data show the efficacy of curriculum and instruction in relation to the new standards; comparing 2010-2018 performances to 2019 may be used to determine rigor of the school’s curriculum and instruction over the entire time period. On the 2010-2018 ELA MCAS, an average of 95-98% of students at BART, Lenox, Mt. Everett, and Mt.
Greylock performed at or above Proficient; 90-94% of students at MMRHS, Wahconah, McCann, and Lee
performed at or above Proficient; 85-89% of students Hoosac and Taconic performed at or above
Proficient; 81% of students Drury and PHS performed at or above Proficient. BART, Lenox, Mt. Everett,
Mt. Greylock, MMRHS, Wahconah, McCann, Lee, and Hoosac performed above the state average of
88%, while Taconic, Drury, and PHS performed below the state average of 88%.
On the 2019 Next Generation (Alignment to Standards), most schools experienced (and mirrored) a
general state decline of around 30%, with noted exceptions in Lenox, Mt. Everett, and Mt. Greylock.
Schools meeting/exceeding the state average of 61% Proficient or Higher included: BART, Hoosac, Lee,
Lenox, Monument, Mt. Everett, and Mt. Greylock. McCann (51%) and Taconic (26%) were well below
the state average. These results may call into question how aligned a school’s curriculum may be with
the standards.
Table 12. 10th Grade ELA, % Proficient or Higher, All Students, 2010-2019
*Note: PoG schools are shaded
High School, MCAS Performance, mathematics. The 2010-2018 10th grade Mathematics MCAS data, see Table 13, cannot be directly compared to the 2019 data because of the change in the design of the assessment. The 2010-2019 data provide three different points for comparison: 2010-2018 data show the relative success schools were having in preparing 10 grade students to pass the MCAS; 2019 data show the efficacy of curriculum and instruction in relation to the new standards; comparing 2010-2018 performances to 2019 may be used to determine rigor of the school’s curriculum and instruction over the entire time period.
42
On the 2010-2018 Mathematics MCAS, and average of 86-89% of students at BART, Lenox, Mt. Everett,
and Mt. Greylock performed at or above Proficient; 72-76% of students at McCann, Hoosac and Taconic
performed at or above Proficient; and 64-68% of students Drury and PHS performed at or above
Proficient. BART, Lenox, Mt. Everett, Mt. Greylock, MMRHS, Wahconah, , and Lee performed above the
state average of 78%, while Drury, Hoosac, McCann, PHS, and Taconic performed below the state
average of 78%.
On the 2019 Next Generation (Alignment to Standards), Hoosac, Lee, Lenox, MMRHS, Mt. Everett, Mt.
Greylock, and Wahconah generally mirrored the state decrease of 19%. In contrast, BART, Drury,
McCann, PHS, and Taconic experienced far greater decreases than the state average. Mt. Greylock
(70%) and Lenox (71%) had the highest percentages of students scoring proficient or higher with Taconic
(25%), Drury (26%), McCann (38%), and Pittsfield High (43%) among the lowest.
Table 13. 10th Grade Mathematics, % Proficient or Higher, All Students, 2010 - 2019
*Note: PoG schools are shaded
High School, MCAS Performance, science. As noted earlier, in order for students to earn (pandemic exceptions aside) a Competency Determination (CD) required to receive a diploma, students must earn a passing score on the MCAS tests in English Language Arts (ELA) and Mathematics, and one of the Science and Technology/Engineering (STE) tests (Biology, Chemistry, Introductory Physics, and Technology/Engineering). Most schools offer students various pathways towards preparation for a science MCAS, however tend to lean towards a particular test. For example, at Pittsfield High among 127 ninth graders who took a science exam, 63% took Biology and 37% took Introductory Physics. In tenth grade, among 24 students taking a science MCAS, 79% took Biology, 4% Chemistry, and 17% Introductory Physics. List of how schools approach required science testing is displayed below, based on 2019 test, on Table 14.
43
Table 14. Science MCAS by School, 2019
*Note: PoG schools are shaded
This section will not unpack scores by science content subtest, but rather includes an aggregation of science proficiency across all science testing subjects. The 2010-2019 10th grade science MCAS remains comparable because the state tests have not fully transitioned to assess the 2016 standards. Thus, we have averaged performance from 2010-2019. Overall, scores have seen fluctuations over the last 10 years. Seven of twelve high schools (BART, Lenox, McCann, Monument, Mt. Everett, Mt. Greylock, and Wahconah), had higher percentages of students scoring Proficient or Higher than the state (71%). In contrast, Drury, Hoosac, Lee, Pittsfield High, and Taconic fell below the state Proficiency average. As shown on Table 15, Wahconah (85%) Lenox (84%), Mt. Everett (83%), and BART (81%) lead in the percentages of students Proficient or Higher when averaged over the last ten years, while Pittsfield (58%), Hoosac (60%), Drury (61%) and Taconic (63%) were among the lowest. While this data could be further unpacked by subtest, this offers some insights into science MCAS trends and patterns. Table 15. Science MCAS, % Proficient or Higher, All Students, 2010-2019
*Note: PoG schools are shaded
44
High School, MCAS Performance, by Subgroup. As mentioned earlier, the achievement gap refers to the disparity in academic performance and attainment between different groups of students (these include white and minority students, and students from higher and lower income households). As was provided in the earlier MCAS analysis, subgroup analysis by cohort is challenging given the Berkshires contain limited cohort (n) sizes. While most all high schools have reportable economically disadvantaged and high needs students, only Pittsfield High and Taconic have reportable cohort sizes for African-American and Hispanic students, for example. With that as context, below, Tables 16 and 17 provide an overview, by high school, of students by selected subgroups, and contrasted against the aggregated scores. Subgroups included are Students With Disabilities (SWD), Economically Disadvantaged, High Needs, African-American, and Hispanic. The percentage Proficient or Higher is noted, with a Gap score representing the difference between the student subgroup and the aggregated score. Many schools do not have reportable cohort sizes, as noted by NA. Overall, all subgroups in ELA across all schools lag behind their aggregated peers. Across the county (and state), students with disabilities have some of the highest Proficiency gaps. Note, the proficiency gap is a function of the schools’ aggregated scores which, if lower, would depress the gap. For example, Taconic has lower gaps (in some cases) but this is likely a function of low aggregate scores. By Subgroup:
• Students with Disabilities: o BART, McCann, Mt. Greylock outperform state levels of proficiency o Wahconah, Hoosac, Taconic, Pittsfield High and Monument underperform the state
• Economically Disabled: o BART, Drury, Lenox, McCann, Monument, Mt. Everett, Pittsfield High and Wahconah all outperform
the state o Hoosac, Lee, Mt. Greylock, and Taconic underperform the state
• High Needs o BART, Drury, Hoosac, Lenox, McCann, Monument, Mt. Everett, Pittsfield high all outperform the state o Lee, Mt. Greylock, Taconic and Wahconah all underperform the state
• African American and Hispanic Students o Only reportable at Pittsfield High and Taconic o Pittsfield High outperforms the state while Taconic significantly underperforms
Table 16. Grade 10 ELA MCAS, % Proficient or Higher by Subgroup, with Gap Analysis, 2019 *SWD = Students with Disabilities
45
Overall, see Table 17, all subgroups in Mathematics across all schools lag behind their aggregated peers. Again, across the county (and state), students with disabilities have some of the highest Proficiency gaps. By Subgroup:
• Students with Disabilities: o Only Monument outperformed the state, with several close to the state average o BART, Drury, Hoosac, McCann, Mt. Greylock, Taconic, Pittsfield High and Wahconah
underperform the state
• Economically Disabled: o BART, Hoosac, Lee, Lenox, Monument, Mt. Everett, Mt. Greylock, and Wahconah all
outperform the state o Drury, McCann, Pittsfield High, and Taconic underperform the state
• High Needs o BART, Hoosac, Lee, Lenox, Monument, Mt. Everett, Mt. Greylock, and Wahconah,
perform at or above the state average o Drury, McCann, Pittsfield High and Taconic all underperform the state
• African American and Hispanic Students o Only reportable at Pittsfield High and Taconic o Pittsfield High underperforms the state while Taconic significantly underperforms
Table 17. Grade 10 Mathematics MCAS, % Proficient or Higher by Subgroup, with Gap Analysis, 2019
*SWD = Students with Disabilities *Note: PoG schools are shaded
Below, Figure 10, displays the percentage of economically disadvantaged students performing at or above the proficient level on the 2019 MCAS. The performances are put into the context of the percentage of economically disadvantaged students enrolled in grades 9-12 at the school. This juxtaposition of enrollment data and MCAS performance prompt consideration about the effect of economic disadvantage (holistically) on student achievement. While not a perfect pattern, it appears that economically disadvantaged students perform better when enrolled in high schools with lower percentages of economically disadvantaged students.
• In ELA, a -0.56 correlation indicates a moderately negative relationship between MCAS ELA
proficiency and economic disadvantage. Generally, as economic disadvantage increases, ELA
proficiency decreases (see Figure 14)
46
• In Mathematics, a -0.78 correlation indicates a strong negative relationship between MCAS
Mathematics proficiency and economic disadvantage. As economic disadvantage increases,
math proficiency decreases (see Figure 11)
Figure 10. MCAS Proficiency versus % Economically Disadvantaged, ELA, 2019 Figure 11. MCAS Proficiency versus % Economically Disadvantaged, Mathematics, 2019 This completes the MCAS analysis and there are interesting and mixed trends across the high schools. It could be argued that those schools with higher levels of wealth (lower numbers of economically disadvantaged students) have higher levels of students achieving MCAS proficiency levels. However, here are pockets of exceptionalism where schools outperform their demography or have greater success in a particular testing area or with a specific subgroup. In contrast, there are schools that underperform and struggle. Both trends offer unique opportunities to learn from each other, to scale effective practice, and to capitalize on success. Similarly, it presents serious policy considerations in terms of concentrating pockets of low-income in particular schools, rather than more heterogeneously mixing students by income. This analysis is not intended to tell the full story, but to present general trends that will need deeper study and exploration. Also, MCAS is certainly not the only measure and should be considered as one, but not the only (or most important) outcome. Additional outcomes are examined below.
r = -0.56
r = -0.78
47
SAT Scores: SAT scores, administered by the College Board, can often serve as gatekeepers to college entry and offer some insight into the quality of preparation (although arguably an aptitude measure). SAT should be examined by both % of participation and performance, recognizing that a district could have inflated SAT average scores because they only test a subset of (higher performing) students. Conversely, other districts, who have a practice of testing all students may have depressed averages. Table 18 is an estimate of SAT participation rates. The ESE reports the total number of SAT participants for each school, but does not distinguish by grade level. While students can take the SATs throughout their high school career, most take the exam in their junior and/or again in senior year. Our methodology simply looked at the number of tests proportional to the total size of the 11th grade school enrollment. Participation rates are likely inflated because students in other grades take the exam, however, this offers some ability to estimate consistently across schools. BART, Mt. Greylock, and Wahconah had greater than 100% participation, indicating that students outside of 11th grade took the SAT. Similarly, Hoosac, Lenox, and Monument were all at around 100%. The lowest participation rates (using this methodology) were McCann (41%), Mt. Everett (50%), Lee (67%) and Taconic (67%). It would be expected that both McCann and Taconic would have lower participation levels given the prevalence of Career Vocational-Technical Education (CVTE) programs. Table 18. Percentage of SAT Tests per Total Number of Juniors, 2018-2019
*Note: PoG schools are shaded
The 2017-19 SAT was chosen because of a change in state reporting. Starting with 2017, the report provided SAT results for tests taken during the selected year to reflect College and Career Readiness Benchmarks. The SAT Evidence-Based Reading and Writing benchmark is the score associated with a 75% chance of earning at least a C in first-semester, credit-bearing, college-level courses in history, literature, social science, or writing. The SAT Math benchmark is the SAT Math section score associated with a 75% chance of earning at least a C in first-semester, credit-bearing, college-level courses in algebra, statistics, precalculus, or calculus. A college ready benchmark signals a threshold needed to (theoretically) be academically prepared for postsecondary study.
There are several general findings, displayed on Tables 19 & 20: 1. All Berkshire County high schools consistently performed above the Reading/Writing SAT
College benchmark.
2. BART, Lee, Lenox, MMRHS, Mt. Everett, Mt. Greylock, and Wahconah consistently performed above the Math SAT College benchmark.
3. Against the 2019 national average of 528 in Reading/Writing: BART, Hoosac, Lee, Lenox,
Monument, Mt. Everett, Mt. Greylock, Pittsfield High, and Wahconah all outperformed.
4. Against the 2019 national average of 523 in math: BART, Lee, Lenox, Monument, Mt. Everett,
Mt. Greylock, Pittsfield, and Wahconah all outperformed.
5. The highest three performing schools in Reading/Writing in 2019 were: Mt. Greylock (613), Mt.
Everett (606), and Lenox (594).
6. The highest three performing schools in Math in 2019 were: Mt. Greylock (598), Mt. Everett
(579), and Lenox (578).
Table 19. SAT Reading/Writing Scores, All Students, 2017-2019
Table 20. SAT Math Scores, All Students, 2017-2019
49
Finally, we can examine SAT performance as a function of subgroups. Given the low (not reportable) subgroup categories, we’ve limited our analysis to a comparison of all students versus those reporting as economically disadvantaged. As is displayed on Table 21, in all schools, except McCann, students who are economically disadvantaged underperform their aggregate peers. In some cases, the gap is modest such as BART (-6, -7), Drury (Math, -2), and Hoosac (-11 in Reading/Writing). In other cases, the gaps is more dramatic (Lenox, -77 in Reading/Writing; Pittsfield -50 in both tests). Interestingly, at McCann, students who are economically disadvantaged, outperform their aggregate peers. Overall, this follows general MCAS underperformance by students who are economically disadvantaged.
Table 21. SAT 2019, All Students versus Economically Disadvantaged Students
Advanced Placement Participation (AP): AP courses are designed to students the experience of an intro-level college class while still in high school. AP courses are managed by the College board, with a standardized curriculum and end-of-course highly controlled exam. Students passing AP courses with a threshold score can receive college credits and/or place out of college requirements. AP classes were created in the mid-1950s as a response to the widening gap between secondary school (high school) and college.
Overall, access to AP courses can be an indicator both of diversity/breadth of programming, and readiness for college. AP outcomes can be evaluated based on: a) percentages of students in a school taking AP courses, b) percentages of students taking the AP exam, and c) the percentages of students earning a 3 or higher (0-5 scale) on the exam. Scores of 3+ typically qualify the student for college credit. Table 22 indicates how many AP exams were administered at each school by total tests taken and by total number of students taking tests. In some cases, such as Drury where, in 2019, 161 students took 262 tests, it would follow that some students take more than one exam in a given year in that they are
50
participating in than one AP course. Pittsfield High (389), Mt. Greylock (304) and Drury (262) led with the highest numbers of exams administered in 2019. Table 22. Advanced Placement Test Patterns, 2017-2019
A key indicator is the percentage of students participating in AP courses as a function of the total student body. Table 23 displays participation rates with Drury (53%) and Mt. Greylock (44%) posting the highest rates. McCann (6%), Lee (11%), Monument (14%), and Mt. Everett (15%), and Taconic (19%) had lower rates of participation.
Table 23. AP Participation, by School, 2017-2019
Again, the AP pass rate is defined as a score of three or higher on an AP exam, and signals to higher education that the student is qualified for college-level work. In most cases, the student receives college course credit with a score of 3+.
51
Among Berkshire schools, only two, Monument (77%) and Mt. Greylock (68%) exceeded the state average of 67% AP scores of 3+ in 2019. Schools above 50% 3+ scores included: BART, Lee, Lenox, Mt. Everett, Pittsfield High, and Wahconah. Among the lowest levels of 3+ scores were Drury (18%), McCann (16%), Hoosac (30%) and Taconic (31%). It’s important to exercise caution with these numbers in that a deeper analysis course-by-course would likely reveal deeper patterns in success rates. That teachers have received course training and align courses to the AP exam is critical in exam success. Also, schools that encourage high levels of participation (Drury serves as an example) may have lower test scores in that they encourage open enrollment and participation with no course entry requirements. Other schools may screen or limit access to AP courses to only high performing students, thus inflating over test passing rates. Regardless, this data offers, Table 24, some interesting insights. Table 24. AP Test Scores 3 or higher, by School, 2017-2019
We again examine, Table 25, economically disadvantaged students as compared to their aggregate peers. Below, the percentage of all students who score a 3+ on AP exams over two years (2018 & 2019) is compared to those who are economically disadvantaged. Eight of twelve high schools had reportable cohorts. Findings as follows:
• All Berkshire schools outperformed state averages, where the gap between aggregate and economically disadvantaged students has been about 21 points.
• BART, Hoosac and Wahconah students who are economically disadvantaged outperformed their aggregate peers in both 2018 and 2019.
• Lee, and Lenox students who are economically disadvantaged outperformed their aggregate peers in 2019.
• Mt. Greylock (about -15 points) and Pittsfield High (about 11 points) had the largest gaps.
52
Table 25. AP 2018-19, All Students versus Economically Disadvantaged Students
As provided in the enrollment section, it’s can also be informative to scan the range of AP courses offered at each school. Below, on Table 26, is a list of all Advanced Placement courses offered in 2019. The total number of students is followed by, in parentheses, the number of sections offered at each high school. In cases where small numbers of students are followed by large numbers of sections (example, AP Music Theory in Lenox) it is expected that course was offered as an independent study. Please note, these are not unique students, but rather the total number of students in each section. It’s expected that some students participated in 2 or more AP courses. It also does not capture students in AP courses. In total, students took 2,173 AP exams.
The good news is that Berkshire high schools continue to signal a desire to maintain their high-level academic courses (AP), even when enrollments don’t result in a full classroom. The challenge is that it could be argued that additional consolidation across schools could lead to filling sections, offering more sections (to avoid scheduling conflicts) and utilizing teaching periods saved to offer other courses/programs. For example, Lee and Lenox could combine two AP Spanish classes of 5 and 7 into a single section, or Mt. Greylock and Drury could manage three sections of AP Statistics into two. Both situations would free up a teaching period that could be utilized to offer a unique course that expands educational breadth and opens new opportunities for students at both schools.
53
Table 26. AP Courses Offered in 2019, All High Schools, By Course Title
Mass Core: The Massachusetts High School Program of Studies (MassCore) is intended to help the state's high school graduates arrive at college or the workplace well prepared and reduce the number of students taking remedial courses in college. MassCore recommends a comprehensive set of subject area courses and units as well as other learning opportunities to complete before graduating from high school. The recommended program of studies includes:
• four years of English, four years of Math, • three years of a lab-based Science, three years of history, • two years of the same foreign language, • one year of an arts program, and • five additional "core" courses such as business education, health, and/or technology.
MassCore also includes additional learning opportunities including AP classes, dual enrollment, a senior project, online courses for high school or college credit, and service or work-based learning.
Caution should be exercised with Mass Core given some of the data is likely skewed by unique district offerings and/or requirements. Graduation requires are, ultimately, set by local school committees. For example, if a student fails to take an art class, he/she would not meet MassCore. Also, while some districts require four years of math, historically, many required only three. Below, Table 27, MassCore completion is provided 2015-2019. Schools with consistently high levels of completion have been McCann, Monument, Lenox, Drury, and Pittsfield High. In contract, Mt. Everett, Hoosac, and Lee have had lower levels of MassCore completion. This does not suggest that these schools are not completing an appropriate and rigorous curriculum, rather that they may have unique graduation requirements and/or code courses in a manner that depresses the rates of completion. A simple comparison of students designated as economically disadvantaged versus their aggregate peers in 2019 is offered in the right hand columns. Levels of MassCore completion is higher among economically disadvantaged students at Monument, Taconic, and Wahconah by a couple of percentage points. Performance is equal at McCann. There are slight drop-offs in MassCore completion among economically disadvantaged students at BART, Drury, Hoosac, Lee, Lenox, and Pittsfield High. The most significant gap is at Mt. Greylock (about 32 points). Overall, six of twelve high school exceed the state MassCore completion rates of 72.1% in 2019.
Table 27. MassCore Completion by High School, 2015-2019, versus Econ.Dis., 2019
Advanced Course Completion: District and school accountability determinations include a measure of advanced coursework completion. This indicator is reported as the percentage of all students enrolled in 11th and 12th grade that achieve a passing score in at least one advanced course, including but not limited to Advanced Placement (AP), International Baccalaureate (IB), Project Lead the Way (PLTW), dual enrollment for post-secondary credit, Chapter 74-approved vocational/technical secondary cooperative education programs and Articulation Agreement courses, and other DESE-selected rigorous courses. This indicator is included in the results for any district, school, or subgroup enrolling students in grades 11 and 12.
55
A sample report, Figure 11, is pasted below as a reference for how the Advanced Course Completion rate can be further analyzed by category and subject area: Figure 11: Sample Advanced Coursework District Report
A simple analysis of Advanced Course Completion for two years is shared in Table 28. Summary:
• BART and McCann lead the county with the highest numbers, noting that McCann students would qualify by participation in a CVTE program.
• Drury, Lee, Lenox, Monument, Mt. Greylock and Wahconah all exceed the state levels of participation (68.8%) in Advanced courses, in 2019.
• Mt. Everett, Pittsfield, and fall below the state average.
• Very slight gaps exist at BART and McCann between all and economically disadvantaged students.
• In all high schools a gap exists in Advanced course participation between all students and economically disadvantaged students. This gap varies from a modest -0.3 at McCann to -27.6 at Mt. Greylock. Eight schools have a smaller gap as compared to the state average (BART, Drury, Lee, McCann, Monument, Mt. Everett, Pittsfield High, and Taconic). Four schools had gaps greater than the state average (Hoosac, Lenox, Mt. Greylock, and Wahconah).
56
Table 28. Advanced Course Completion, 2018-2020, All versus Economically Disadvantaged
2018-19 2019-20
All Econ.Dis. All Econ. Dis. Gap
BART 95.1 95.5 90.5 86.4 -4.1
Drury 75.5 68.4 74.4 65.9 -8.5
Hoosac 62.1 44.8 61.3 41.5 -19.8
Lee 64.2 54.8 75.2 62.1 -13.1
Lenox 70.0 52.0 71.8 45.2 -26.6
McCann 58.8 54.5 99.1 98.8 -0.3
MMRHS 57.9 35.0 71.1 62.9 -8.2
Mt Everett 53.2 33.3 54.2 37.5 -16.7
Mt Greylock 84.7 64.0 77.6 50.0 -27.6
PHS 58.5 38.5 63.9 48.4 -15.5
Taconic 54.6 45.4 59.5 45.9 -13.6
Wahconah 70.1 50.0 68.8 44.1 -24.7
State 65.1 48.5 65.7 48.9 -16.8
High School Graduation Rates: High school graduation is often considered a gold standard among K12 metrics, equivalent to the importance we place on, for example, Grade 3 reading. The good news, graduation rates nationally are on the rise, with renewed efforts to reinforce policies, practices, and structures that ensure messaging and actions leading to successful high school completion. Graduation rates can be sliced several ways, such as:
• Four & Five year rates (the number of students who graduate in either 4 or 5 years)
• Four & Five year Adjusted rates (the numbers of students who enter in grade 9 and graduate in 4 or 5 years).
There are subtle differences between these measures in that schools may be penalized by a high degree of transience (movement of students in/out of the district), and may be given advantage by continuing to work with students who don’t finish in 4 years, but persist and finish in 5 or 6 years. To begin (see Table 29) we have selected the four-year graduation rate, from 2015 through 2019 to examine if any significant patterns and trends exist. First, ten of twelve Berkshire high schools exceed the state’s 88% four-year graduation rate. Only two schools, Drury and Pittsfield High fall below that standard. Most schools have seen steady performance over the time period, and in the case of BART, Hoosac, and Pittsfield High, rising graduation rates.
57
Table 29. Four-year Graduation Rates, 2015-2019
Table 30 includes several final indicators that link to graduation rates and offer slightly different ways to think about patterns/trends.
1. 5 Year Adjusted Rate, 2018: This rate includes how many students enter in 9th grade and graduate at least five years later. As was the case with the 4 year rate, schools range from a high of 100% (BART and Lenox) to a low of 85% (Drury). Still, all schools demonstrate an ongoing willingness and effort to work with their students to earn a high school diploma.
2. Extended includes a five-year cohort rate plus the percentage of students remaining in school beyond year 5. Again, schools have relatively high marks from a high of 96.7% (McCann) to a low of around 80% (Drury). Again, Berkshire schools demonstrate a desire to engage students well beyond the traditional four year high school career.
3. Dropout rate: The percentage of students lost during a given school year. Two schools reported 0% dropout (BART and Lenox) while another eight reported at or lower than the state rate of 1.8%. Only two schools, Drury (4.9%) and Taconic (2.8%) exceeded the state rate. Drury’s dropout rate would also explain the lower graduation outcomes.
4. 9th Grade Passing. Failing courses in 9th grade can signal a red flag for potential dropout. Lenox (100%) and Mt. Greylock (97.6%) posted high 9th grade passing rates. Additionally, Lee, McCann, Monument, Mt. Everett, Pittsfield High, and Wahconah all had passing rates above the 83.7% state passing rate. Only Drury (66.3%), Hoosac (67.7%), BART (82%), and Taconic (83.3%) had below state average passing rates.
5. 9th Grade Retention. This signals the percentage of students who were retained in Grade 9, based (typically) on course failures and low credit counts. Normally, policies at each school govern promotion and grade level classification. BART, Lenox, Mt. Everett and Mt. Greylock had no Grade 9 retentions. In contrast, Lee retained 13.2% of its 9th graders, Pittsfield High (6.6%) and Taconic (5.6%). Drury, Hoosac, McCann, Monument, and Wahconah all fell below the state retention rate of 4.5%
Finally, we’ll conduct a very short analysis, see Table 31, of graduation sub-groups over the last two years. The numbers displayed below compare each of the subgroups (White, Economically Disadvantaged, and Students with Disabilities – SWD) to their aggregate peers. Percentage points differences are noted by positive numbers (higher than aggregate) or negative numbers (lower than aggregate). In some cases, numbers are not reported due to small cohort sizes. Findings:
• White students, generally, do better than their aggregate peers with a few exceptions such as BART (2019) and Mt. Everett (2018).
• Economically Disadvantaged students graduate at rates lower than their aggregate peers with a large gap range. For example, in 2019, BART, Hoosac, Lee, Mt. Everett, Taconic and Wahconah all had 3 point gaps or less. In contrast, Mt. Greylock (-18_ and Pittsfield (-10 gap) have larger differences. It appears these numbers change year-to-year likely a function of small graduating cohorts. For example, while Lee had a -1 gap in 2019, it had a -22 gap in 2018.
• Students with Disabilities have the widest gaps upwards of close to 30 points. Districts with a 20 point or higher gap in 2019 included Hoosac, Lee, Pittsfield, and Wahconah. In 2018, that list includd BART, Monument, Mt. Greylock, Pittsfield and Wahconah. The smallest gaps belong to McCann, Lenox, and Mt. Everett.
Career/Vocational Technical Education. Introduction: Across the nation, students participate in Career/Vocational Technical Education (CTE) as a means to develop industry knowledge and skills that lead to job readiness and employment. In high schools, CTE includes: family and consumer sciences education (i.e., courses that prepare students for roles outside the paid labor market) and general labor market preparation (i.e., courses that teach general employment skills such as word processing and introductory technology skills); and occupational education, which teaches skills required in specific occupations or occupational clusters. According to NCES, about 70% of students nationally participate in some form of non-occupational CTE, of these only 9% earn 3 or more credits. About 85% participate in some form of occupational education, with 36% earning 3 or more credits. That said, the total number of CTE credits earned has declined between 1990-2009, while the number of academic courses has risen. Generally, students are classified based on whether they "concentrate" in CTE. A CTE concentrator is a student who earned at least 3 credits within defined occupational areas. A non-concentrator is a student who earned any number of CTE credits, but without earning at least 3 credits in a specific occupational area. CTE concentrators are different from non-concentrators because they concentrate their CTE credits and they earn a relatively high number of CTE credits. In 2009, about 36% of students earned 3 or more credits, while about 15% earned 5 or more credits. Nationally, 3.7% of high schools identify as career/technical schools, while 83% report offering career/technical education courses. In Massachusetts, CVTE (Career Vocational and Technical Education) can be (generally) described as a mixture of Chapter 74 and non-Chapter 74 programs, defined as follows:
60
• Career/vocational technical education is the term used to denote Chapter 74-approved vocational technical education programs and non-Chapter 74 career and technical education programs.
• Chapter 74-approved vocational technical education programs are programs that meet the definition of vocational technical education contained in Massachusetts General Law Chapter 74, and are approved by the Department of Elementary and Secondary Education pursuant to Chapter 74 and the Vocational Technical Education Regulations. Note that all Chapter 74-approved vocational technical education programs meet the federal Perkins Act definition of career and technical education.
• Non-Chapter 74 career and technical education programs are programs that meet the federal Perkins Act definition of career and technical education but are not Chapter 74-approved vocational technical education programs.
It could be suggested that Chapter 74 corresponds with the NCES definition of “concentrated,” while non-Chapter 74 corresponds to the national “non-concentrator” label. Massachusetts has actually had a rise from 42,000 in school year 2005 (14 percent of statewide enrollment) to 48,000 in school year 2016 (17 percent). This 17% provides a comparison point against which to evaluate adequacy of access and participation. It should be noted that in October of 2015, there were 3,200 students on CVTE waitlists statewide, suggesting a need for expanded programming.
Finally, CVTE education is delivered in two ways, through regular comprehensive high schools (locally Taconic and Monument offer examples) and through regional CVTE high schools (McCann is the single regional example). It has been argued that vocational programs run at regional schools are often more robust than those embedded within traditional/comprehensive high schools. Students benefit from an exploratory period in the beginning of ninth grade, where they evaluate their interests and select a program of study. The schools also feature small class sizes of 15 or fewer students in shop periods, which allows work in a tight-knit setting that promotes positive mentor and peer relationships.
Overall CVTE Participation: Recognizing a national standard of about 17% of students in CVTE (concentrator) programs - overall, in 2019-20, Chapter 74 enrollment north county was robust (25%), in central county moderate (11%), and in south county very low (3%)3. South county compensates with non-Chapter 74 programs, which consist of only a single class. See Table 32 below. Table 32. CVTE Participation by sub-region, Chapter 74/non-Chapter 74, 2019-20
Region Chapter 74* non-Chapter 74 Total % Participation North 397 (25.5%) 0 (0%) 397 (25.5%) Central 222 (10.6%) 82 (3.9%) 304 (14.6%) South 34 (2.8%) 204 (16.7%) 238 (19.5%) Berkshire Total 653 (13.4%) 286 (5.9%) 939 (19.3%) *Note: Exploratory enrollments (=260) were not included
3 For the sake of this exercise, high school enrollment (9-12) was calculated by region as follows: north (Hoosac, BART, Greylock, Drury, & McCann), central (Taconic, Pittsfield High, & Wahconah), and south (Lee, Lenox, Monument, & Mt. Everett). There would likely be some migration between region that would influence (albeit slightly) these figures.
61
Overall enrollment over time in Chapter 74 Programs over the last five years by sub-region (Pittsfield is Central, Berkshire Hills is South, Northern Berkshire is North), is displayed in Table 33. As can be seen, the numbers of student enrollment in CVTE dropped in 2017-18, but has since remained relatively steady. However, in recent years, Pittsfield (Central) CVTE counts have dropped, and McCann (North) have risen. Table 33. Participation in Chapter 74 Programs, 2015 – 2020 In order to more precisely know what’s happening, this data is unpacked further. Below Figure 12 and Table 34 shows participation by Chapter 74 trade area, with corresponding participant levels. These help to begin to identify patterns and trends in matching program completers with local employment demand.
62
Figure 12. Chapter 74 Programs by Trade, Size, and Location, 2019-20 By CVTE area, two years have been selected for inclusion, 2019-20 and 2018-19. Table 40 below displays Chapter 74 programs at each of the host districts, with the number of students enrolled in each shop. Highly enrolled shops include: Automotive Technology, Culinary Arts, Machine Tool, Metal Fabrication, and Carpentry. Lower enrolled programs include Horticulture and Early Education and Care (which was recently launched in Pittsfield). It should be noted that there are a number of students who travel outside of Berkshire County to schools (such as Smith Vocational) to participate in programs that are not offered in Berkshire County or are closer to the home district. These numbers are not included in this analysis.
63
Table 34. Chapter 74 Enrollment by Program, 2018-2020 Non-Chapter 74: Non-Chapter 74 programs were offered in several schools across the Berkshires. While not as structured and intense as a full Chapter 74 program, they may include a single course that allows students to explore CVTE related content. Lee and Berkshire Hills have historically high enrollment in non-Chapter 74 programs, and Pittsfield, Central Berkshire and Southern Berkshire all consistently offer non-Chapter 74 courses. As is displayed on Table 35, we noticed that the 2019-20 data is dramatically lower, driven by the absence of North Adams, that reported non-Chapter 74 data in the four previous years. This trend would need to be explored further to explain why this drop-off occurred. Otherwise, there are around 400+ students each year that participate in non-Chapter 74 programs across the Berkshires.
64
Table 35. Participation in non-Chapter 74 Programs, 2015 – 2020
65
By program and school, non-Chapter 74 programs are two years have been selected for inclusion, 2019-20 and 2018-19. Table 36 below displays non-Chapter 74 programs at each of the host districts, with the number of students enrolled in each program/course. Highly enrolled programs include: Business Technology, Information Support Services, Engineering Technology, and Carpentry. Lower enrolled programs include Culinary Arts and Environmental Science. Table 36. non-Chapter 74 Enrollment by Program, 2018-2020
It should be noted, that when combining all data (Chapter 74 and non-Chapter 74) by gender the result is:
FEMALE 39% of all CVTE enrollment4 MALE 61% of all CVTE enrollment
All totaled, the concentration of Chapter 74 participation is highest in north, lowest in south. In contrast, participation in non-Chapter 74 is highest in the south, lowest in central. Overall, central has the lowest percentage of students participating in some form of vocational-technical education. That said, the intensity (dosage) of non-Chapter 74 programs must be clearly unpacked and further understood recognizing students counted as non-Chapter 74 may only a single period CVTE class. Thus, intensity and dosage must be carefully examined to determine the level of experience and what general or certifiable skills students emerge with.
CVTE Placement: Districts with CVTE programs conduct a Follow-up Survey to better understand graduates’ outcomes in the 12-16 months after high school graduation. According to the Follow-up Survey of 2016 graduates, see Figure 13, 96.4% are in ‘positive placements’ (or, in postsecondary education, including apprenticeship and technical training; in the military; or employed in any field) among survey respondents (80% response rate). For the subset who are graduates of Chapter 74-approved programs, 85.0% are in ‘positive placement’ (or, in postsecondary education, including apprenticeship and technical training; in the military; or employed in a related field) among survey respondents. Figure 13. State CVTE Placement Grid, 2016
In Berkshire County, we calculated positive placements for Berkshire CVTE graduates. Our methodology examined trends in survey respondents (a 62% response rate) and then applied the proportional shop placement outcomes to the entire graduating cohort, by shop. While this method is limited (in that non-respondents may have had higher or lower positive placement rates), it offers broad insights. As displayed on Figure 14 below, the Berkshires, among 2016 CVTE graduates (222 total) 73% had positive placements, slightly lower than the 85% state rate. Still, it demonstrates solid placements of CVTE graduates into related work, ongoing education/training, and military. Figure 14. CVTE Placement, Overview 2016 Graduates
67
By shop, placement rates vary, see Figure 15. Across all Berkshire programs, placement rates have been aggregated by program. For example, all three regions host automotive programs, the total number of all three programs is demonstrated below in Figure XX. Culinary Arts and Automotive hold the highest total number of positive placements. Culinary Arts (82%), Carpentry (81%), Info Support (77%), and Business Tech (77%) all the highest percentage of graduates with positive placement. Lower placement rates included Horticulture (36%) and Automotive (59%). Figure 15. CVTE Placement, Overview 2016 Graduates, by Area Table 37 below further displays placement rates by program and by sub-region. There are variations across sub-regions by program such as Automotive (16 point difference), Carpentry (14 point difference), Culinary Arts (11 point difference), and Machine Technology 30 point difference). Table 37. Placement rates by CVTE Program, Sub-region, 2016
68
Finally, non-Chapter 74 placement, see Table 38 below, is reported by program and sub-region based on Perkins indicators. These expand positive placements by including any employment placements (related or not). As such, total rates are quite high. This signals that participation in any CVTE programming (as concentrator or non-concentrator) can lead to positive post-high school placement outcomes. Table 38. Placement rates by non-CVTE Program, Sub-region, 2016 Plans of High School Graduates: As outlined in the CVTE summary, students have post-graduation outcomes that help to understand the impact of school in preparing students for continuing education (college) and career. In this section, we will explore these trends in additional detail. Overall, see Figure 16, students in the Berkshires predominantly attend college (2 or 4 year) after they graduate from high school. This has remained relatively steady, with a slightly higher prevalence of four year colleges, and lower rates of two-year college attendance. Overall, rates of work after graduation are on the rise, with military a very small percentage of post-graduation plans for Berkshire students. Figure 16. Plans of Berkshire County Students Post-Graduation, 2015-2019
69
This data can be disaggregated a bit more and is provided in Table 39 below. Four-year college rates are about split between public and private, while most 2-year college attendance is public (assuming many attend Berkshire Community College). Again, we have seen an increase in students heading straight to work after graduation. Table 39. Post-graduation Plans, 2015-2019, Berkshire County Selecting the most recent reported year, 2019, below are the various post-graduation pathways. “Other” is not included and would make up the difference to achieve 100% across rows. Seven of twelve high schools, see Table 40, exceed the state rate (80%) of students attending some form of college (4 and 2 year) including: BART, Lenox, Monument, Mt. Everett, Mt. Greylock, and Wahconah. Mt. Greylock, in 2019, posted the highest college going rate at 93%. McCann would normally have lower college going rates as they produce many CVTE graduates who go into the fie. Schools with lower rates of college going include: Drury (63%), Hoosac (69%), and Taconic (71%), which also has a large number of CVTE graduates. In contrast, McCann has the highest work-going rate of 47.2%, with Drury (25%), Hoosac (21%), Lee (21%), Taconic (18%), and Wahconah (11%) all exceeding the state’s working going rate of about 9%. Several schools have over 5% of students heading to other post-secondary school options (such as trade schools) including: BART, Drury, Hoosac, Lee, and Mt. Everett. The county does not have a considerably high number of graduates entering the military after graduation with Pittsfield High (8%) and Taconic (3.5%) as the highest senders. Several schools send higher number of students to 2-year colleges including: Taconic (37.6%), Pittsfield (32.2%), Mt. Everett (39.5%), Wahconah (29.7%), and Lee (19.6%). This may be a function of proximity to a two-year college (such as BCC) or socio-economic/cost factors. While many districts are split on private and public 4-year colleges, Mt. Greylock (61.9%) and Monument (42.1%) send consistently more to private colleges. Others above the state average of 28.5% private 4-yr colleges include: BART, Hoosac, Lenox, Monument, and Mt. Greylock.
70
Table 40. Post-graduation Plans, by School and Pathway, 2019 Digging deeper into college going rates, Table 41, displays the percentage of graduates in each high school who attend college (either two or four year combined) after high school over the last five years. Again, eleven of twelve high school exceed the state rate (80%) in 2019 including: BART, Lenox, Monument, Mt. Everett, Mt. Greylock, and Wahconah. Mt. Greylock, in 2019, posted the highest college going rate at 93%. Over time, graduation rates have risen in some cases (BART, Pittsfield High, Taconic, Mt. Everett), remained flat in other cases (Drury, Lenox, and Mt. Greylock), and dropped – somewhat inconsistently – in some schools (Hoosac, Lee, McCann, Monument, Wahconah). Table 41. Students Planning for College (2 and 4 year), 2015-2019, by School
71
Table 42 includes trends on college going trends for students selecting 4 year private versus public options.
• Schools that have increased rates of attendance at 4 year private colleges 2015 through 2019 include: BART, Hoosac, Lee, McCann, Mt. Greylock, Taconic and Wahconah
• Schools that have increased rates of attendance at 4 year public colleges 2015 through 2019 include: BART, Drury, Lenox Mt. Everett, Pittsfield High, and Taconic
In some cases, rates have increased for both private and public as, generally, college going rates have increased, for example BART and Taconic. Table 42. Comparison of 4yr Private versus Public College, by School, 2015-2020 While we started some early analysis of subgroups, at the time of this publication, it is not completed. It may be worth examining cohorts such as High Needs, Economically Disadvantaged, African American and Hispanic students, where cohort sizes allow. Finally, we’ll return to an analysis of work to examine patterns of students who head to work directly after graduating. Patterns for work were examined for 2019 in Table 43. Below, Table 49 displays work going patterns 2015-2019. Increases in work-going patterns are noticeable comparing 2015 to 2019 in: Drury (+5), Hoosac (+15), Lee (+17), McCann (+11), Taconic (+10), and Wahconah (+7). Other schools may have experienced flat or modest change. One school, however, did see a significant drop in work-going patterns in 2019, Mt. Everett (-10). This may be an slight outlier in their data given in previous years work-going patterns were consistently higher. Overall, the trends towards work suggests ongoing needs of students in our schools to exploring living wage work pathways, be exposed to work habits and preparation, and be engaged in work readiness, exploratory, and immersion opportunities.
72
Table 43. Percentage of Students who Work directly after Graduation, by School, 2015-2020 The importance of living wage pathways for students is very important to consider when mapping out a high school post-graduation plan. Students without a trade or skill often struggle in entry level and low wage jobs that lack opportunity for advancement (with a career pathway) and economic earning power. Our team did very broad look to determine how our students perform years after they graduate from high school. Unfortunately, the data set and research on this are still in (somewhat) developmental stages, are somewhat incomplete, and have typically small cohort sizes. Still, the state is collecting workforce data and our aim is to gain future access to the full Berkshire data set (we had limited access) and dig further into this issue. Below, in Figure 17, a simple illustration of the importance of workforce training is illustrated. Two districts including Lee (cohort size of about 12) and Pittsfield (cohort size of about 100) were examined. As can be seen, the graph marks out the total wages of students each year following their 2015 graduation. While wages grow (as would be expected) they still fall short of the threshold for a basic living wage (about $28,000). This can be contrasted against the wages of an electrician, with a salary that would start well over $30,000 and progress into the mid-60s, and higher as a business owner. Of some key Berkshire County CVTE areas, wages according to regional labor market data:
Field Entry Annual Salary Mean Annual Salary Carpentry $40,526 $55,988 Culinary $39,288 $56,067 Health Assisting $25,933 $30,461 Metal Fabrication $37,133 $70,291 Information Services $68,996 $222,259 Automotive Tech $30,344 $39,491 Office Tech $29,376 $40,074 Drafting $32,946 $45,939 Cosmetology $26,427 $39,243
73
The point here is that leaving high school without a plan, and/or a career pathway will likely result in less than living wage earning capacity and low options for career advancement. Figure 17: Annual wages based for the Class of 2015, 2015-2018 College indicators. Recognizing the high numbers of Berkshire students who attend college, we probed a bit further into college performance indicators. As demonstrated in the About Berkshires section, educational attainment leads to increased earning power and overall higher household income. Thus, college and post-secondary training serve as important indicators as understanding how our students do when they leave high school and head to college. College data is collected by the state and the national clearinghouse. This data helps us to understand various aspects of the college experience. The data often lags, given it will take a few years (4-6) for students to, for example, graduate from college. Below, Figure 18, data from the Berkshire graduating class of 2011 is shared to understand the full pathway (trends) from 9th grade to a college degree. We start with 100% of students in 9th grade. Of those, 86% graduate from high school within five years. Of the starting cohort, 60% enroll in college after high school graduation. This group is reduced to 51% who persistently enroll in college, and to 42% who ultimately graduate within six years. So, of 100 starting 9th graders, about 46% of Berkshire graduates earn a college degree 11 years after entering high school. This completion rate is slightly lower (by about 4 points) when compared to the state average.
74
Figure 18: Class of 2011, High school to College Progression While we reported college going rates on earlier tables, the actual enrollment of students in college is tracked. This number can be slightly lower in that some students may make the decision to opt out (or delay) prior to fall enrollment. Below, Table 44 displays the percentages of students who graduate from a given high school and then actually enroll in the fall following their graduation, 2014-2018. These have been sorted by % in 2018 from high to low. These follow, for the most part, college going rates by school with some reduction in the overall percentage of those who enroll in the fall, versus those who may have intended to. The 2014-2018 data presented below were culled from the DART database. BART, Mt. Greylock, Lenox and Wahconah all outperform the state average of 70%, and both Monument and Pittsfield High outperform the Berkshire average of 64%. McCann is expectedly lower given the numbers of CVTE graduates. Drury, Lee, McCann, Mt Everett, PHS, and Taconic had consistently at or below state average enrollment rates. Table 44. Percentage Graduates Enrolled in Postsecondary after Graduation, 2014-2018
While a Berkshire progression from freshman year to college was provided on Figure 18, data for each school based on the 2011 cohort is below. This is one cohort, so findings should be tempered. In some cases, dramatic data changes (such as Mt. Greylock’s 6yr rate) raise questions to be further explored, as seen on Table 46. Overall, Mt. Everett (68%), Wahconah (53%), Lenox (52%) and Monument (46%) have the highest percentages of students progressing from high school to a college degree. In contrast, Drury (22%), Taconic (25%), and McCann (26%) have among the lowest. Table 46. Student Progression from High School Through College To further confirm, or challenge, this single cohort data set, 2016 data was explored on Table 47. While these students have not yet graduated from college, we can evaluate their college persistence. This compares the 2016 graduating cohort to the 2011 cohort to see if patterns/trends are consistent, or changing. Several schools demonstrate increasing levels of college persistence including Lenox, Wahconah, Mt. Everett, McCann, Hoosac, Taconic, and Drury. In contrast, several have seen lower persistence rates including BART, Mt. Greylock, Monument, and Pittsfield High. While this data is interesting it is not causal and it would be useful for schools to explore why students are or are not persisting and completing their college studies. Issues related to persistence include a range such as financial pressures, academic struggles, social challenges, family responsibilities, etc.
76
Table 47. Student Persistence in College, 2011 versus 2016 It should be noted that this data can also be disaggregated by subgroups, and we have limited data in hand. However, due to very small cohort sizes, we are not including in this section. Because academic preparation is an element that high schools have some influence over, colleges also report the numbers of students who require development courses (meaning they do not meet the entry academic standards for the college) prior to access to credit bearing college courses. In an interview with the BCC VP of Academic Affairs, math was noted as one of the bigger hurdles coming into college. He asserted that students who are placed in either developmental math and writing are less likely to persist and finish. The 2014-2017 data, culled from the DART database on Table 48, provide insights into enrollment in development (remedial) courses in Massachusetts public colleges. Please note, this data does not include students who attend private colleges or colleges outside of Massachusetts, thus the data set has limitations. Still, if offer some insights. Rates of student enrollment in one or more developmental courses in Massachusetts public colleges differed across Berkshire County high schools from 2014 to 2017.
• The state has seen a consistent slight decline in rates of student enrollment in developmental courses at the college level between 2014 and 2017.
• BART has had no students enroll in developmental courses in 2014, 2015 or 2017. • Lenox has seen an increase in rates of developmental course enrollments. • Drury, Lee, McCann, and PHS have seen consistent decreases in rates. • Mt. Greylock has a wide range of rates with the lowest at 8% and highest at 45%. • Apart from BART, Wahconah and Drury have the lowest average rates in Berkshire County. • Berkshire county schools generally have lower rates of graduate enrollment in remedial courses
at Massachusetts public colleges than the state.
77
Table 48. Percentage of students at MA public colleges enrolled in one or more developmental courses While we had access to limited data, and hope to gain access to more, we did look at limited college data by various subcategories such as race, economics, and gender. While the data was not exhaustive over the entire county, we found some very preliminary findings:
• Females are attending college in slightly higher percentages (a function of total graduating class) than males. This difference is 5-15%.
• Students are persisting at private colleges at higher rate than at public colleges, from 10-20% difference.
• Recognizing small cohort sizes, Black and Hispanic students are going to college at about a 10% lower rate than their White peers.
FAFSA Rates: Again, we had access to limited data in the Edwin report system, but hope extend research with all high schools as a natural progression of this research effort. Among indicators we gained limited access to was the FAFSA. FAFSA (or Free Application for Federal Student Aid) is important because completing this form is the only way students can receive state and federal financial aid. Completing the FAFSA is the single most important step students take to get financial aid. At the risk of calling out a few schools, Table 49 has FAFSA data from Lee, Taconic and Pittsfield High. The good news, FAFSA rates are on the rise over the last three years. This signals a concerted effort among school staff to support students/families as they complete this important part of the college going process.
78
Table 49. FAFSA Participation Rates Additional High School Indicators: To have additional data points on our high schools, Table 50 was compiled with several variables. These are offered as context and for additional consideration. Total number of Teachers:
• Total numbers of teachers varies across high school and is linked, in great part, to the total enrollment or unique programs (such as CVTE) that demand lower class sizes. A study of enrollment was conducted by BCETF and can be accessed at this link.
Art Course Taking:
• The ESE reports the percentage of students taking arts courses by grade. Below, these data are aggregated for each school to determine to what degree students have access to and are participating in the arts. BART (82%) and Mt. Everett (80%) report the highest participation rates while Taconic (21%) and McCann (0%) post the lowest. Other schools range from 50 to 70%.
Mobility:
• Mobility (often called Churn) refers to the percentages of students who may come and go in a school year. This transience can be disruptive to the student’s learning progress, and creates an additional level of transitional support required at the school level. Typically, transience is associated with higher poverty level schools. In the Berkshires, Drury (10.6%), Pittsfield High (10.4%) and Hoosac (10%) have the highest level of churn. The lowest rates of churn exist at Lenox (2.1%) and Wahconah (3.5%).
Attrition:
• Attrition is the percentage of students by grade who progress from the end of one school year to the beginning of the next. This may be due to lack of academic performance, transfer out, or dropout. Two grades are provided in Table 9.
• Grade 9: Attrition rates are highest at Hoosac (11.7%), Pittsfield (10.2%), Mt. Everett (9.4%), Monument (9.2%), and Mt. Greylock (8.9%). Rates are lowest at Lenox (0%), McCann (2.3%) and BART (3.6%). Other schools have rates between 4 and 7%.
• Grade 10: Hoosac (17.3%) and BART (12.2%) have noticeably higher Grade 10 attrition rates. Drury (9.2%) and McCann (8%) also have higher rates. Low 10th grade attrition is found at Mt. Everett (2.0%), Mt. Greylock (2.4%) and Lee (4.5%).
Suspension:
• Students can be In-School-Suspended (ISS) or Out-of-School-Suspended (OSS). The rates reflect the percentage of suspensions as a function of students and days.
• ISS: Taconic (6.3%) has the highest ISS rate, suggesting they use ISS as a regular tool in their school. Several schools are in the 3% range including Monument, Mt. Greylock, and Wahconah. Low ISS rates including Drury (0%), McCann (0%), McCann (0%), Pittsfield (1%), Lee (1.4%), Lenox (1.7%) and BART (1.8%). Some schools may have limited ISS resources, which may impact their ability to support ISS or not.
• OSS: Whle Drury had 0% ISS, they have the highest percentage of out-of-school suspensions (13.5%). Taconic (10.4%) and Pittsfield (8.2%) are among schools with higher rates. Lower OSS rates belong to Mt. Everett (0%), Mt. Greylock (0.4%), Lenox (0.9), and Lee (2.7%).
• Four or More Days Missed due to Discipline: There are various ranges, and we chose two as a simple way to measure the impact of suspensions. Drury (7.9%) and Taconic (6.2%) had the highest percentage of students missing 4 or more days due to suspension. In contrast, Mt. Everett (0%), Lenox (0.4%), Mt. Greylock (0.9%), Monument (1.9%) and Hoosac (2.2%) have the fewest students missing 4 or more days due to suspension.
• Mt. Everett is logged as no suspensions at all, which is worthy of further study. Hoosac, with somewhat higher rates of suspension, does not appear to suspect for extended periods of time. Overall, Drury and Taconic have generally higher suspension patterns.
Attendance:
• Most schools have worked very hard to meet attendance goals and standards, with 92% or higher as a solid mark. We examined attendance rate and students who have been absent 10+ days. Both are linked to accountability metrics.
• Attendance rates: Only Pittsfield High (89.8%) and Taconic (91.2%) fall below the 92% threshold. The best attendance rates belong to Lenox (96.3%) and Mt. Greylock (95.3%). The remaining schools fall into the 92-94% range, all solid attendance levels.
• Students absent 10+ days. As was the case with attendance rate, Pittsfield (51.7%) and Taconic (50.3%) have the highest rates of students absent 10+ days. The lowest rates belong to Lenox (10.9%), Wahconah (30.5%), and Mt. Greylock (32.3%). Other schools fall into the 30s to 40s range.
All this data collectively offers additional insights that may be useful to planning teams and schools themselves. While practices vary across schools, so do resources. In some cases the ability to manage attendance, to deliver arts courses, and to provide ISS may be different than in others. That said, there also may be approaches or practices among the twelve high schools that can be learned from in improving the positive outcomes (arts taking courses and attendance) and decreasing the negative outcomes (attrition and suspension).
80
Table 50. Additional High School Data Indicators, 2019
Wahconah 43.2 45.7 3.5 4.7% 5.1% 3.7 4.3 2.4 94.7 30.5 *The five PoG high schools in bold
As part of our research process, we did some initial analysis of course offerings at the high school. While courses are not perfectly lined up, it offered some initial perspective about the range of programming offered in each school. The early analysis of Advanced Placement data supports this work. This analysis was limited to the PoG high schools. What we found if briefly described below: Course variety: This focused mainly on existence of world languages in the school and electives (courses outside of the core curriculum) In some cases, these courses are offered multi-level to ensure they have adequate enrollment:
• BART: Limited electives, offer Spanish
• Drury: Narrow range of electives, offer Spanish
• Lee: Broader selection of electives, offer Spanish and French
• PHS: Broad selection of electives, offer Latin, Spanish, French, Italian
• Taconic: Broad selection of electives, offer Spanish, French Italian
81
Advanced Placement Courses (detailed in an earlier section)
• BART: 7 courses (69 tests)
• Drury: 14 courses (262 tests)
• Lee: 10 courses (44 tests)
• PHS: 24 courses (389 tests)
• Taconic: 16 courses (203 tests)
Dual Enrollment: Courses offered for college credit at a college (dual) or during the school day (concurrent)
• BART: Required. Courses taken through BCC, MCLA, Williams, St. Michaels
• Drury: Optional, both dual and concurrent through MCLA, BCC, Williams
• Lee: Optional, both dual and concurrent through BCC
• PHS: Optional, both dual and concurrent through MCLA, BCC, Williams
• Taconic: Optional, both dual and concurrent through MCLA, BCC, Williams Online High School Courses such as Virtual High School and other vendors
• BART: Limited
• Drury: Extensive, mimic courses offered in school with some extension courses
• Lee: Extensive, mimic courses offered in school with some extension courses
• PHS: Extensive, mimic courses offered in school with some extension courses
• Taconic: Extensive, mimic courses offered in school with some extension courses A deeper study of these and the remaining high schools could yield opportunities to share courses, expand access, more efficiently use resources, and improve the range of options available to Berkshire students through collaboration and partnership. High School Site Interviews: As part of this project, we reached out to many of our Berkshire High Schools to explore and capture some data that may not have been as readily available via public sources. We used a condensed protocol to run through a series of questions with each school’s leadership team, around 45 minutes in length. High school interviews included Lenox, Wahconah, Hoosac, Mt. Everett, BART, Drury, Lee, Pittsfield and Taconic. Missing are Monument, McCann, and Mt.Greylock. The following questions were asked: Advanced questions:
• How many students (and how often) participate (as number or %) in athletics, clubs or other co-curricular activities, and/or travel experiences during the school year?
• What is the school schedule? (block, static, # periods, rotating)
• How many students participate in community activities, civics groups, service?
Interview Questions Improvement Planning
• What are 2-3 priorities in your current School Improvement Plan? (2nd tier - who is involved in preparing, shaping, delivering and monitoring the SIP?)
• In what ways does your school's PD plan align to the School Improvement Plan?(who establishes and sets your school's PD plan?)
82
Support Services
• Describe 2-3 most effective ways your school counselors are utilized in your school? (Describe roles, responsibilities, case loads)
• How are your special education services organized and delivered?
• Describe 2-3 most effective ways that your students (high school) receive college and career readiness experiences?
• Describe 2-3 most effective ways that your school programs for the social-emotional needs of students?
Curriculum & Assessment
• Does your school use benchmark or common assessments to assess student progress, in what subjects?
• How closely aligned is your curriculum to the Mass Frameworks in the four majors areas: ELA, mathematics, science, social studies (1 - not much, 5 - highly)?
• How are classroom teachers involved in curriculum development and implementation?
• Does your school have a system for reviewing data in order to provide ongoing intervention, inform classroom instruction, and guide longer-term school improvement strategies?
Out-of-school Time
• Does your school offer summer programming? (summer school, credit recovery, tutoring, enrichment)
• How often do your students engage in off-campus experiences that is connected to their academic courses (field trips, projects in the community, links to the region's history/resources)? We ask you estimate this at (0-1 times per year, around 5 times per year, more than 10 times per year)
• Does the district provide bus service beyond the school day? Instruction:
• How often do teachers receive feedback on their instruction?
• Does the school have a shared understanding of good instruction (instructional system/guide/culture)? If so, briefly describe.
• Does the school have a system for tiered and/or remedial instruction for students who fail to meet learning/skills targets?
• Does the school have instructional coaches? Students:
• Does the school emphasize/encourage student participation in community activities, civics groups, service? Provide 1-2 examples.
• Do your students graduate with a clear post-secondary plan? Are you using a particular tool or form?
• Are students in your schools linked to a trusted adult advisor? Briefly describe, including estimated contact time.
• How often do students sign up for classes that do not, ultimately, fit into their schedule? Family/Community:
• How does the school engage parents in supporting each student's academic and social-emotional development?
83
Additional questions:
• Are there particular resources your school could use to more effectively support staff and students?
• How would you describe the state of technology in your school?
• How does your school support diversity and equity efforts among staff and students?
• How often do you (as a leadership team) or your staff collaborate with other regional high schools?
Below are a list of themes we extracted from this data. Some are reflected our synthesized PoG findings, others will be considerations for BCETF and future planning purposes.
Common Themes
1. Schools are looking for ways to help their students’ socioemotional health
• Need more staff (counselors, mental health experts) as caseloads are too big.
• Drury partners with Brien program, but could refer 30+ more students who are at risk (School to Connect program).
• Schools have designated teams for behavioral issues and are trying use more tiered intervention plans and restorative justice practices.
2. The majority of graduating students have a post-secondary plan
• All schools track this using either the tool, Xello or Naviance.
• One of BART’s graduation requirements is to be accepted into a college and to visit a college campus.
• Schools are more focused on college pathways and would like to do more to support those who wish to immediately enter the workforce.
• Taconic’s career pathways partner with community members that work in the industry.
3. Various programs are offered during out of school time
• Summer programs are primarily used for credit recovery rather than enrichment.
• Enrichment takes place after school with the majority of students participating in clubs and/or sports after school.
• Wahconah, Hoosac, BART, and Drury have a late bus while other surveyed schools do not. This could hinder some students’ participation in sports and clubs.
• BART issues BRTA passes to support transportation to college courses and internship sites.
4. All schools would like to collaborate with other schools more
• Currently, schools collaborate via the principal’s roundtable and AP teacher groups.
• Drury and Hoosac work together on the civics project.
• BART works with other regional schools.
• Some schools share co-op athletic teams.
84
Distinguishing Practices
5. Schools vary in how much students participate in activities off-campus
• Mount Everett and BART have students out in the community 3-5 times a year while other schools have fewer school outings (1x a year).
• Taconic’s vocational students are expected to be in the field every other week during senior year as part of the co-op program.
• Lenox tries to have a community service project each month, which helps students to get involved off-campus.
6. Schools offer a variety of college and career readiness opportunities
• All schools utilize guidance counselors, career fairs, internships, AP and dual enrollment classes to some extent.
• BART students visit college campuses every year.
• Wahconah has a career exploration unit in 11th grade English classes.
• Many schools pay for the PSAT, Lenox pays for the ACT.
• Lenox has teachers support the college application process in the classroom.
7. Some teachers receive more feedback on instruction than others
• Wahconah’s new instructional coach is available to meet with teachers individually about their
lessons.
• Teachers receive feedback 3x a month at BART, formally from the principal, and informally from team leaders.
• Other schools would like to see feedback to happen more often. Challenges/Gaps
8. Few schools have a formal advisory program
• But the vast majority of students report they have a trusted adult in the building.
• Many schools are utilizing a homeroom model. Mount Everett has tutorial groups of 8-12 students and Lee has a house system.
• Drury has a short daily advisory, but not all teachers use the time to build relationships.
• BART has circle 2x a week which is used for advisory and other programming.
9. Many schools struggle to consistently engage and communicate with parents
• Drury, BART, PHS, and Taconic all noted this as a large obstacle in school operations.
• Wahconah and Lee send out a weekly newsletter to families.
• At BART, students run their own parent-teacher conferences.
• Drury struggles to maintain accurate contact information for families and hopes to streamline communication.
85
10. Schools are looking to bolster their diversity and equity efforts
• Looking to strengthen diversity PD programming, to support students of color, and to better attract and retain staff of color.
• Schools are looking to bring translators into schools as well for ELL (specifically Spanish speaking students at Mt. Everett).
• Taconic eliminated lower level classes so that more students of color would take college prep level or higher courses.
• Lenox, Wahconah, and Hoosac use the World of Difference program.
11. There are some instances of students signing up for classes that do not fit in their schedule
• Mt. Everett, Lee, and BART see more conflicts than other schools due to their small size.
• These problems are more pronounced for all schools for junior and senior students in advanced classes and for unique elective courses.
• Schools try to fill gaps by offering courses through Virtual High School and other online platforms (BYU at Hoosac).
12. If they could have more resources, schools would like...
• Lenox, Lee - a curriculum coordinator
• Wahconah, Drury - more mental health resources
• Hoosac - more funding
• Mount Everett - adjustment and guidance counselors, late bus
• BART, Lee, Taconic - instructional coaches Value Propositions
13. There is opportunity for schools in Berkshire County to work together and share resources
• Teachers and staff are eager to connect across districts with others in their discipline, but currently there are few chances for this type of collaboration.
• Most schools surveyed expressed interest in having a curriculum coordinator and instructional coaches, these positions could be split across schools to reduce costs.
• Not all schools have a late bus, bolstering transportation services could provide more access to students to participate in activities after school and at other districts.
• Schools facing limitations due to size can increase student choice and options by offering advanced/specialized courses at other high schools.
Brief profiles for each high school are provided in Appendix IV. These include broad school improvement goals.
86
Prevention Needs Assessment. Our team sought additional data related to student experience and perspective. While many schools are just starting to use Panorama, and the ESE has administered the VOCAL survey, we used the the Prevention Needs Assessment (PNA). This is a nationally normed standardized survey developed by Bach Harrison Associates. The survey is administered to 8th, 10th and 12th grade students in Berkshire County public schools every two years. In the past, the Berkshire Youth Development Project (BYDP), comprised of Northern Berkshire Community Coalition, Berkshire United Way, and the Railroad Street Youth Project, coordinated survey administration. With the coalition no longer intact and the pandemic making it too difficult to administer in 2020, the PNA was last administered in November-December 2018. Another entity will issue the PNA in the future. The PNA is structured around looking at risk and protective factors. Risk factors are characteristics of the school, community, family, and individual/peer group domains that are known to predict a higher incidence of substance use, delinquency, dropping out of school, teen pregnancy, violent behavior, and depression and anxiety. Protective factors are those that have a positive influence on students, reducing the likelihood that they will engage in problem behaviors. The risk factors included in the PNA and the potential problem behaviors associated with each risk factor are listed on Table 51.
Table 51. Risk Factors for Adolescents
87
Protective factors exert a positive influence against negative risk, thereby reducing the likelihood that students will engage in negative behavior. Protective factors include:
• Social bonding to family, school, community and peers • Health beliefs and clear standards for behavior • Individual characteristics
A comprehensive list is offered below on Table 52. Table 52. Protective Factors for Adolescents
88
In 2018, 2,596 students Berkshire County students completed the PNA. Based on these results, several
positive trends emerged in comparison to previous years:
• Substantial decline in the 30-day use of alcohol
• Substantial decline in binge drinking among 8th, 10th, and 12th graders
• Decline in the 30-day use of marijuana among 10th and 12th graders
• Slight decline in sibling drug use
• Declining perception that both parents and community norms/laws favor drug use
• Decline in the use of traditional cigarettes
• Slight decline in student attitudes favoring antisocial behavior
• Decline in the rate of academic failure
• Increase in opportunities for prosocial activities The PNA provides comparisons to national data from the Bach Harrison (BH)5 norm or, for data points where BH norm information is not available, the Monitoring the Future survey (MTF)6. Areas that should be of concern are risk factors where Berkshire County is higher than the BH norm or MTF and protective factors where Berkshire County is lower. Conversely, areas of strength are risk factors where Berkshire County is lower than the BH norm or MTF and protective factors where Berkshire County is higher. Table 53 below highlights data points that show a variance from the BH norm or MTF survey. Some of these data points have shown positive progress in Berkshire County even if they are less favorable than national norms. For example, binge drinking is higher in Berkshire County than national norms among 12th graders, but as noted above Berkshire County trends are very positive. Table 53. PNAS Overview Findings
Berkshire County results compared to Bach Harrison norm or Monitoring the Future survey
Berkshire County has LESS favorable results Berkshire County has MORE favorable
results
Berkshire County risk factors that are higher than BH norm or
MTF survey (by five % points or more)
Berkshire County risk factors that are
lower than BH norm or MTF survey (by
five % points or more)
• 30-day alcohol use (12 grade)
• Marijuana use (10th & 12th grade)
• 30-day e-cigarette use (8th,10th, 12th grade)
• Binge drinking (12th grade)
• Sibling’s use of drugs (8th & 12th grade)
• Perception that parent attitudes favor drug use (12th grade)
• Perception that community laws and norms favor drug use (12th grade)
• Depressive symptoms (8th, 10th, 12th grade)
• Family conflict
• Early initiation of drug use (8th grade)
• Interaction with antisocial peers (8th , 12th grade)
• Gambled in the past year (8th, 10th, 12th grade)
• Bet on cards, sports, dice (8th, 10th,12th grade)
5 The BH Norm, developed by Bach Harrison, provides national measures for risk, protection, and antisocial factors, which can be compared to local results. It is a weighted sample based on results from 11 statewide surveys and one large regional survey. Results are updated once every few years. The BH norms included in the report are based on 2018-19 data. 6 Monitoring the Future is a yearly, ongoing study of the behaviors, attitudes, and values of U.S. secondary school students, college students, and young adults. The secondary school surveys include 8th, 10th and 12th grade students.
89
• Low commitment to school (8th grade)
Protective factors that are lower than BH norm or MTF survey
(by five % points or more)
Protective factors that are higher than
BH norm or MTF survey (by five %
points or more)
• Rewards for prosocial involvement in the school and community domains (8th, 10th, 12 grade)
• Rewards for prosocial involvement in the family domain (8th grade)
• Interacting with prosocial peers (8th, 10th grade)
• Belief in the moral order (8th grade)
• Prosocial involvement in peer/individual domain (12th grade)
Protective factors seem to be variable across the survey period. Overall, students continue to perceive their schools as high points for prosocial opportunities and rewards, followed by family. Community rates remain lowest. Religiosity remains stable but low, while interaction with prosocial peers remains at about 40%. This data, Table 54, suggests schools as key places to build from. Table 54. PNAS Protective Factor Trends, 2015-2019
Protective Factors (%) Factor 2015 2017 2019 BH Norm Community Rewards for Prosocial 30.8 33.4 31.3 41.2 Family Attachment 55.5 59.8 60.2 60.1 Family Opportunity for Prosocial 57.5 60.2 61.6 61.6 School Rewards for Prosocial 57.6 61.7 59.9 74.2 School Opportunity for Prosocial 57.4 64.6 64.2 67.6 Belief in Moral Order 62.1 67.2 59.5 63.8 Religiosity 25.9 22.7 22.4 40.1 Interaction with Prosocial Peers 37.0 41.2 36.9 48.5
Selected risk factors are displayed below on Table 55 (the survey collected more than 20). Overall, these suggest positive trends from 2013 to 2017, in most cases. One exception is depressive symptoms which rose, while still below the county average. This number is of great concern to local educators who often speak of increasing issues related to trauma and social-emotional learning. Another challenge area are norms related to drug use, suggesting this as more often than not, use is acceptable behavior at the community level. This is further reflected in individual favorable attitudes towards drug use. Family conflict remains a key issue, and did rise over the survey period – further supported by high levels of poor family management.
90
Table 55. PNAS Risk Factor Trends, 2015-2019
Risk Factors (%) Factor 2015 2017 2019 BH Norm Laws and norms favor drug use 52.6 50.6 44.2 37.8 Availability of drugs 38.3 33.6 29.9 28.8 Poor family management 41.8 33.1 31.9 34.4 Family conflict 40.8 41.3 43.6 35.9 Friends use of drugs 39.1 35.4 30.3 27.4 Interaction with antisocial peers 22.2 20.6 18.8 23.8 Depressive symptoms 40.6 42.0 49.8 40.8 Attitudes favorable to drug use 44.8 44.7 40.1 36.2
The PNA allows the sponsoring organizations to include extra questions that are of local interest and not covered in the standardized test. Among these questions in the 2018 survey, several data points are worth noting:
• More than one-third of students reported experiencing some type of bullying.
• Over 20% of students report being teased, bullied, or made uncomfortable by teachers/staff
• Among students who have been bullied, 59% reported the incident, an increase from 55% in 2015 when it was first measured.
• Two-thirds of students do not feel that adults in the community notice when they are doing a good job and let them know about it.
With data going back to 2006, see Table 56, the PNA provides an opportunity to analyze data over time. The following charts show some of the trends regarding substance use, binge drinking, and cigarette use. Over time, alcohol use and binge drinking has been declining among 8th, 10th, and 12th graders. Use of marijuana has remained more consistent. Table 56. Substance Use Trends, 2006 - 2019
30-day substance use trends
Binge drinking trends
While cigarette use, see Table 57, has declined since 2013, use of e-cigarettes (commonly referred to as vaping) is increasing.
91
Table 57. Cigarette Use Trends, 2006 - 2019
The PNA survey has a large data set that is further broken by grade and specific question. Other areas, such as bullying, sexual activity, and mental health are more deeply analyzed. This data presented, then, offers a glimpse into broad patterns that may be an area of further research and consideration.
12% 8% 7% 3% 5%0% 0%17% 25% 19%
0% 0%
38% 38%
0%
50%
100%
2013 2015 2017 2019 MTF 2018cigarettes e-cigarettes energy drinks
30-day cigarette use is declining while e-cigarette use is increasingMore than 1/2 of students had energy drinks in the past 30 days
92
VII. Findings from Community Outreach The Portrait of a Graduate project team conducted an extensive community outreach process April through November 2020. Targeted groups were asked for their input regarding skills, attributes, and experiences that high school students need to be prepared for life after graduation. The outreach included surveys, focus groups, a three-day educator/community convening in August and November, 2020, and interviews with school administrators. Figure 19: Community Outreach Overview Nine themes emerged from the data collection efforts, with the different data sources reinforcing one another in many cases. These are summarized below, and detailed descriptions follow. 1. Students desire access to a variety of courses to explore their interests, challenge themselves, and
prepare for further education and career pathways. ● Some schools have fewer options for higher level, elective, vocational, and/or advanced
placements offerings. ● There is less course variety at smaller schools. ● Some students choose (or would) to attend different schools to get more course/activity
options.
2. The top readiness skills that high school students need to succeed in the future are responsibility, communication, critical thinking, and problem solving.
SURVEYS 11th and 12th graders Alumni who graduated from Berkshire County high schools in past five years K-12 school staff and parents of high school students Community members: employed, stay-at-home parents, retired, elected officials
FOCUS GROUPS 11th and 12th graders from Drury, Lee, Pittsfield, Taconic High Schools 11th graders participating in countywide Berkshire Youth Leadership Program Adults who are affiliated with Berkshire Youth Leadership Program Alumni who graduated from Berkshire County high schools in past five years
THREE DAY CONVENING
Held August 20-21, followup session on November 3 Educators and community members attended virtually
SCHOOL INTERVIEWS
Portrait of a Graduate consultants conducted interviews of teams of principals, guidance counselors, other administrators to learn more about the school’s policies, practices, academics, and activities.
Participants: BART, Drury, Hoosac Valley, Lee Lenox, Mt. Everett, Pittsfield, Wahconah
93
● Responsibility refers to taking personal responsibility for one’s words and actions. ● Communications skills take different forms, encompassing oral and written communications as
well as the ability to work collaboratively. ● Critical thinking and problem solving are interconnected.
3. Students develop key competencies through deep, interdisciplinary learning experiences with
strong community connections. ● These learning experiences can take the form of capstone projects, career activities, community
service projects, or some combination of these and may extend through multiple grade levels.
● Emphasis should be on research and project-based work with connections to real-world community issues.
● Learning experiences should be focused on students and their learning needs and provide them with choice based on their interests.
● Students should be provided with mentors as part of these experiences.
4. Career activities and exposure help students determine areas of interest and should be offered frequently throughout high school rather than as one-time events. ● Internships and work (field) experiences are viewed as important career exposure experiences
for high school students in: elevating aspirations; engaging in thinking about future possibilities; and increasing connections to the Berkshires.
● Many other career activities are also helpful, such as career fairs, guest speakers, and college visits, and should be made available frequently rather than just as one-time event
5. Caring relationships and mentoring opportunities with teachers, staff, and adults are a critical part of a high school education. ● Among both high school students and recent alumni, “staff who care about me” was the top
choice when asked to list the three greatest strengths of their high school. ● The top suggestion among community members for addressing achievement gaps was to
provide intensive mentoring and connections with adults.
6. All students need to graduate from high school with practical life skills. ● All students need financial literacy education in topics such as understanding how to complete
financial aid forms, getting loans, saving money, and managing bank accounts. ● Other life skills that are critical are related to everyday living – such as cooking, car maintenance,
or basic household skills (such as laundry). ● Life skills should be taught to all students, not just those in vocational programs.
7. Cultural competence and awareness are essential for students and staff.
● Both staffing and curriculum should reflect the diverse racial and cultural backgrounds of the students served.
● Cultural competence training would be beneficial for staff. ● All students should be encouraged to challenge themselves. Currently, students of color are
underrepresented in the most challenging courses.
8. Students and staff are open-minded about collaborating across districts and communities and the benefits it could bring. ● Collaborating across districts is needed in areas such as professional development, technology,
software, and curriculum planning.
94
● Coordinating resources can help provide better access and equity for districts. ● School schedules, calendars, and transportation are potential barriers that must be addressed.
9. Educational change and reform require broad engagement to reflect the community’s values and
be sustainable. ● Recognizing that broad community engagement was needed, students, alumni, parents,
teachers, school administrators, employers, elected officials, and other community members were part of the PoG research process.
● Those who have been engaged in the work recommend reaching an even broader audience that reflects a diverse mix of community members and organizations.
● The need for community engagement is and will be ongoing.
1. COURSE VARIETY Berkshire County high school students and alumni commented in focus groups that they wished there had been more variety and rigor in their school’s course offerings. They feel that course variety helps students prepare for post-secondary education and is important in helping them figure out what they want to study in college or do for a career. Students’ desire for more course variety varies among schools, as the larger schools have more course offerings. Figure 20: Course Variety and Rigor
VARIETY: Some of the alumni who participated in focus groups felt the variety of classes and electives at
their high school was limited. When asked what they would like to change about their high schools, 48% of alumni and 43%
of current students would have liked more course variety. (alumni [n=180] and student [n=743] survey results).
In the student survey, 23% of students disagreed or strongly disagreed with the statement “My high school offers a wide enough variety of classes to keep me interested.”
One reason some students wish they could attend another school is the desire for more course variety including AP, technology and engineering, vocational, and arts classes.
RIGOR: Some alumni would have liked more advanced placement courses at their school and more
advanced courses in specific topics, such as math and business. One alumnus noted that despite scoring 5 on an AP math test, some college peers were two to
three semesters ahead of him based on their high school preparation.
95
2. READINESS SKILLS
Among all groups surveyed – including high school students, alumni, school staff, parents, and community members -- the top readiness skills they feel high school graduates need most to succeed in the future are responsibility, communication, problem-solving, and critical thinking. Figure 21: Top Readiness Skills
The need for strong communication skills was reinforced and further defined in the community survey. When employed community members were asked what skills/attributes are most lacking in colleagues they work with or hire, the top response was written and oral communication skills (cited by 21% of respondents, n=213). Community members also indicated in the survey that providing soft skills in oral and written communication, critical thinking, and problem solving was needed to ensure that students are prepared for their future beyond high school. Students and alumni elaborated in focus groups on the types of readiness skills they consider to be most important. They identified communication skills, time management, leadership skills, work ethic, and the ability to collaborate and work in teams as top readiness skills needed for high school graduates. At the final day of the educator/community convening, participants created ideas for signature projects that would help develop key competencies. At least half of ten breakout teams chose to address the following competencies, which are the same ones identified as most important in the surveys:
● Critical and creative thinking – 6 teams ● Personal responsibility - 6 teams
● Communications – 5 teams
2%
2%
3%
11%
11%
11%
11%
15%
16%
20%
21%
27%
30%
30%
42%
47%
service orientation
entrepreneurial
other
creativity
cultural awareness
self-directed
collaboration/coordination
leadership
goal-focused
resiliency/perseverance
adaptability
judgment/decision making
critical thinking
problem solving
communication
responsibility
Three readiness skills high school graduates need most to succeed in the future (n=1,645 students, alumni, staff, parents, community members)
Key themes from the first two days of the educator/community convening were the importance of collaborating across disciplines, allowing more student choice, and providing more opportunities for hands-on project-based learning. Participants agreed there should be more interdisciplinary projects with teachers working across subject areas and schools should create more opportunities for teachers to work together. These themes were further explored during Day 3 of the convening. The culmination of the work from the three days was to propose ideas for signature experiences that would enable students to develop key competencies from the PoG competency framework. To begin the brainstorming process, participants on Day 3 were asked to post sticky notes identifying powerful learning experiences that could help high school students develop key competencies. While their responses fell into nine categories, the ideas mentioned most frequently were related to interdisciplinary and capstone experiences. They fleshed out their ideas in more detail in ten breakout groups, most of which proposed some type of interdisciplinary experience in which students could explore an area of interest and work on a real-world problem in the community. There was considerable overlap among the signature experiences proposed. These key themes and suggestions emerged from the breakout groups: Figure 22: Ideas Generated about Project-Based Experiences
address real-world problems
embrace the various ways
students learn
capstone experience with
community involvement
students dig deeper into
content, work through
challenges
student choice – provide menu of learning options
mentors
research, presentations
community service or awareness
projects
project-based hands-on
experiences
cross different academic subjects
97
Further detail on the team plans that were developed is provided here.
4. CAREER ACTIVITIES AND EXPOSURE
In the community survey, respondents rated the importance of career exploration and immersion activities in guiding high school students about career options. Two-thirds of the community respondents were employees or senior leaders of Berkshire County businesses and organizations. While every activity was viewed to be either somewhat or very important by 90% or more of community members, the activities with the most “very important” ratings were internships and vocational/ technical classes. Figure 23: Career Exploration and Immersion Ratings, Importance
When 11th and 12th grade students were asked on surveys to rate the helpfulness of the same career exploration and immersion activities in guiding them about their career options, internships were again at the top of the list. However, half of students responded “not applicable” for internships and between one-third and one-half responded “not applicable” to the other career activities. This shows that there is potential for these types of activities to reach more students. Students’ perceived importance of vocational/technical classes was not as high as it was for community members, most likely because these classes are offered only in some high schools and not all students take them.
37%
40%
45%
59%
62%
63%
66%
66%
76%
78%
52%
50%
52%
37%
33%
34%
31%
29%
22%
21%
10%
9%
3%
3%
5%
3%
3%
5%
1%
1%
career interest inventories/surveys
career fairs
career speakers at school
visits to local employers
job shadowing (spending a day at a workplace)
youth leadership programs
career exploration classes
mock/practice interviews
vocational/technical classes
internships
Very important Somewhat important Not important
Importance of career exploration and immersion actvities in guiding high school students about future career options (n=319 community members)
Figure 24: Career Exploration and Immersion Ratings, Helpfulness
Both current students and graduates of Berkshire County high schools recognize the importance of career-related activities. When alumni and students were asked in surveys to choose three things about high school they wish they could have changed, having more career-related activities was at the top of the list for 50% of alumni and 51% of students. Figure 25: What Alumni would Change
16%
18%
18%
18%
20%
23%
24%
25%
28%
29%
28%
26%
24%
39%
37%
36%
33%
25%
20%
17%
7%
7%
7%
13%
10%
8%
7%
5%
4%
4%
49%
50%
51%
30%
33%
33%
37%
45%
48%
49%
vocational/technical classes
mock interviews
visits to local employers
career interest…
career speakers
career fair(s)
youth leadership program(s)
career exploration classes
job shadowing
internship(s)
Very helpful Somewhat helpful Not helpful Not applicable
Helpfulness of career exploration and immersion actvities in guiding high school students about future career options (n=319 community members)
2%
6%
8%
8%
10%
17%
18%
21%
24%
25%
28%
48%
50%
larger class size
extra help with school work
wouldn't want to change anything
smaller class size
more welcoming school environment
more advanced placement classes
more challenging classes
more project based learning
more diverse student population
more diversity among teachers and staff
more attention from guidance counselor
more variety of classes
more career-related activities
Alumni survey, three things they wish they could change, n=180
99
Figure 26: What High School Students would Change
The importance of career activities was reinforced by both students and alumni in focus group discussions and also at the educator/community convening:
• High school juniors participating in Berkshire Youth Leadership Program (BYLP) focus groups noted that more help is needed in identifying career options, including having more internship opportunities. They suggested that larger groups of students could benefit from career activities offered through BYLP, which include visits to varied worksites, panels and guest speakers representing local employers, and mock interviews.
• Alumni noted that career experiences are helpful and should be available more frequently. They feel that career fairs, college visits, dual enrollment, and pathway programs were all beneficial. The alumni suggested that more help in understanding career choices and options should be provided through advising, guest speakers, mentoring, and alumni networks.
• There was discussion at the convening about how students should have access to varied career experiences. One participant wrote “Ten years from now, it would be amazing if our schools have career readiness (internships and exploration opportunities) as a graduation requirement.”
5. CARING RELATIONSHIPS AND MENTORING OPPORTUNITIES
An ongoing theme throughout the research and public engagement process was the importance of caring relationships with adults. High school students, alumni, school staff, and parents all recognize that relationships with teachers, staff, and other adults in mentoring roles are an important component of the learning experience. When asked to choose what they consider to be the top three strengths of their high school, staff who care about students was at the top of the list.
4%7%
11%14%14%15%15%
18%18%18%
21%43%
51%
larger class sizesmore challenging classes
more advanced placement classesextra help with school work
more diverse student populationwouldn't want to change anything
more diversity among teachers and staffsmaller class sizes
more attention from guidance counselormore project based learning
more welcoming school environmentmore variety of classes
more career-related activities
High school student survey, three things they wish they could change, n=734
100
Figure 27: Three Greatest Strengths of Their High School
Additionally, community members, school staff, and parents understand the importance of providing all students with mentoring and connections to adults. When asked what they feel are the most effective strategies high schools should be implementing to address achievement gaps among students, providing intensive mentoring and connections with adults was at the top of the list (community survey, staff/parent survey, n=700). Alumni elaborated during focus groups on how they benefited from the support of teachers and mentors. They felt teachers were focused on their success and wanted them to do well and explore their interests. One alumnus suggested that alumni networks should be established to create a bridge between high school students and graduates of the high school. The alumni could serve in mentoring and coaching roles and could speak to groups of students in schools. Another alumnus noted that as a result of having a strong network of support in high school, he understands how to seek out mentors now that he is in college. School administrators were asked during the school interviews whether students are linked to a trusted adult advisor. While most schools don’t have a formal structure, schools reported that students connect with trusted advisors through homerooms, advisory periods, and through extracurricular activities.
6. PRACTICAL LIFE SKILLS
Data from the surveys, focus groups, and educator/community convenings indicated that all students need to have practical life skills to be prepared for life beyond high school. In the surveys, nearly two -thirds of students, alumni, school staff/parents, and community members chose practical life skills as one of the top three academic competencies that high school graduates need most to succeed in the future. Practical life skills were selected by far more respondents than any of the other more traditional academic skills listed in the question, such as literacy, technical skills, writing, and mathematics.
5%
8%
14%
16%
18%
20%
25%
26%
27%
28%
39%
56%
other
community service opportunities
engaging instruction
career focused programs
courses that inspired me/students
dual enrollment
help from guidance/adjustment counselors
clubs and activities
challenging classes
extra help with classwork
athletics
staff who care about students
Three greatest strengths of their high school (student, alumni, staff/parent surveys, n=1440)
101
Figure 28: Academic Competencies, Ranked
The importance of life skills was reinforced by community members, students, and alumni. When asked on surveys what more high schools could do to ensure that students are prepared for their future beyond high school, community members stressed the importance of life skills such as financial literacy, understanding financial aid forms, cooking, home repairs, and how to vote. This was further reinforced in student and alumni focus groups, where it was suggested that cooking, budgeting, finances, and self-care are important skills for all students to have. Additional support for the importance of life skills was provided in the school staff/parent survey. When asked what three things they would like to change about their high school, more than two-thirds selected more life skills classes for ALL students. This was by far the top response to this question. Figure 29: Things They would Change about High School, Parents & Staff
2%
4%
7%
8%
8%
9%
16%
20%
26%
29%
30%
36%
37%
64%
Other
history
media literacy
foreign language
science
content knowledge
global knowledge
mathematics
writing
technology
learning strategies
career and/or technical skills
literacy (reading)
practical life skills
Three ACADEMIC COMPETENCIES high school graduates need most to succeed in the futuren=1637 students, alumni, staff, parents, and community members
3%
6%
8%
10%
13%
22%
23%
24%
28%
30%
32%
68%
Wouldn't want to change anything
More Advanced Placement classes
More challenging classes
More welcoming school environment
Fewer students per guidance counselor
More diversity among teachers and staff
More project-based learning
More course variety
Smaller class sizes
More career-related activities
Greater opportunity for career and voc/tech pathways
More life skills classes for ALL students
Three things would you like to change about the high school?n=383 staff and parents
102
During Day 3 of the educator/community convening, the theme of life skills was mentioned in different contexts. As teams designed their signature learning experiences, several of them included life skills among the competencies for students to develop. Participants also noted that PoG’s draft competency framework does a nice job of combining real life skills and traditional academic competencies.
7. DIVERSITY, EQUITY, INCLUSION, AND CULTURAL COMPETENCE
The area of diversity, equity, inclusion, and cultural competence are viewed as a critical part of the learning experience. Several themes regarding diversity and cultural competence emerged through focus group and survey results. While many students feel that their schools are inclusive, they wish that the student body was more diverse, especially in the smaller schools. Students and alumni of color, in particular, expressed a desire to have staff and curriculum reflect students of different racial and ethnic backgrounds. The need for both students and staff to become culturally competent was stressed. Figure 30: Feedback about Diversity While overall, students and alumni believe their high schools are inclusive of different groups, students and alumni of color feel that more could be done to see themselves reflected in their teachers, staff, and course curriculum.
STUDENTS WANT THEIR SCHOOLS TO BE MORE DIVERSE Among students who wish they could attend another school, the lack of diversity was one
reason cited in surveys. One student noted “It’s hard being someone who’s not white in a community with a great amount of white people.”
When asked to choose three things about school they wish they could have changed, more diversity among teachers and staff was selected by 25% of alumni and 15% of students.
BOTH STAFF AND STUDENTS NEED TO BE CULTURALLY COMPETENT A participant in an alumni focus group commented that Berkshire County students need
to develop cultural competency. She felt that graduates who go to different parts of the country for college need to understand different ways of life.
An adult focus group participant suggested mandating cultural competency for school staff.
Four respondents to the community survey suggested offering racial justice education in response to what schools could do to ensure students are prepared for their future.
This suggestion was reinforced at the educator/community convening, where participants discussed the need for staff to be trained in cultural competence so that they could work with students in developing this skill. A teacher stated “students need to be able to interact with people at different levels and from different places.”
103
Figure 31: Feedback about Inclusivity
Both current high school students and alumni would like to see more students be encouraged to take higher level classes. There is also a desire for school activities that address social justice and focus on specific cultures. Figure 32: Feedback about Courses and Activities
MOST STUDENTS AND ALUMNI FEEL THAT THEIR HIGH SCHOOLS ARE INCLUSIVE One alumnus commented in a focus group that his school was very accommodating of
low-income students, as they were in the majority. He felt that any sort of discrimination was strictly not tolerated.
Several current high school students commented in focus groups that the atmosphere in their school is positive and inclusive. One student said that although there are not a lot of people of color, everyone is very respectful of each other.
Students and alumni of color were more critical of the diversity and inclusiveness at their schools, feeling that more could be done to reflect a diverse student population.
STUDENTS WANT TO SEE THEMSELVES REFLECTED IN STAFF AND CURRICULUM High school students noted in focus groups that while their schools are supportive and
inclusive, they would like to see more diversity in both the student body and teachers/staff. Small schools in particular are less diverse.
Students of color want to see themselves reflected in teachers, staff, curriculum, and graduation speakers. One black student said he has never had a black teacher and was disappointed that there were not any black speakers at high school graduation. A Latinx student noted that there was no Latin American history taught at her school.
There was discussion at the adult focus group (part of Berkshire Youth Leadership Program session) about students needing to see themselves represented in faculty and administrators.
ALL STUDENTS SHOULD HAVE ACCESS TO THE MOST ADVANCED COURSES Alumni noted during their focus groups that some students get stuck in lower tracks and
should be encouraged to move up to higher level classes. They also noted that the advanced classes tend to have all the same students. Many
students of color are stuck on lower tracks. A current high school student commented “It would have been nice to see more students
of color encouraged to take the AP classes.”
SOCIAL JUSTICE ACTIVITIES RESONATE WITH STUDENTS A Lee High School alumnus commented at one of the focus groups that the school’s Social
Justice Club “really made me appreciate the different aspects of diversity out there.” This was in reference to the Club creating a day about different cultures and religions.
A participant in a student focus group suggested that there should be clubs focused on Latinx, Asian, and black cultures.
104
8. COLLABORATION ACROSS DISTRICTS AND COMMUNITIES In the high school student focus groups, participants were asked whether they would be interested in participating in a class, program, elective, or club at another nearby high school. Students responded favorably to this possibility for a variety of reasons. One felt that it would eliminate having students enroll in a different school for just one component they can’t get at their own high school, such as a specific course, sport, or activity. Collaborating with other schools and districts could allow students to take a language that their school doesn’t offer, or participate in orchestra or other arts programs that their school may not offer. It was noted that transportation should be provided if students are going to travel to other schools. In the school interviews, all participants expressed a desire to collaborate more with other schools. Current collaborations that exist are cooperative athletic teams, AP teacher groups, a Principals’ Roundtable, and the Superintendents’ Roundtable. Several new collaborative possibilities emerged from the interviews:
● Teachers and staff are eager to connect across districts with others in their discipline, but currently there are few chances for this type of collaboration.
● Most schools expressed interest in having a curriculum coordinator and instructional coaches. These positions could be split across schools to reduce costs.
● Another opportunity to foster collaboration could be having districts expand transportation options. Bolstering transportation services could allow more students to participate in activities after school and at other districts.
● Schools facing limitations due to size can increase student choice and options by offering advanced/specialized courses at other high schools.
One of the key themes that emerged from the educator/community convenings was that there needs to be more partnering between schools and local communities. In the discussions about signature learning experiences, these ideas emerged regarding community exposure for students: Figure 33: Broad Themes from Convening
Have students create something
that benefits a community
organization
Collaborate with higher education partners
Look at community or
real-world problems and try to find solutions Involve the community
through internships and mentoring
105
9. EDUCATIONAL CHANGE AND REFORM
Recognizing that broad community engagement is needed to reflect the community’s values, the Berkshire Portrait of a Graduate project has engaged the viewpoints of students, alumni, parents, teachers, school administrators, employers, elected officials, and other community members. If the work is to be sustained, these key stakeholders need to be invested in the process. At the educator/community convenings, participants noted that student voice should play a significant role in the PoG work moving forward. They feel it is important to continue to get students’ input and keep their best interests in mind. They also suggested circling back to some of the same groups involved in the community outreach to make sure that the competency framework and proposed signature experiences accurately reflect their needs and expectations. Feedback from the convenings emphasized the need to bring in an even greater variety of voices. It was suggested that organizations such as Community Access to the Arts, BRIDGE, and Elizabeth Freeman Center as well as policy makers and local authors should be part of the process. The continued buy-in of school committees, administrators, teachers, community members, and parents is also needed. There is a positive feeling about moving forward with the Portrait of a Graduate work. At the end of the final day of the educator/community convening, there was recognition that more work needs to be done and that it will take a lot of planning and time. Comments were that “change is coming,” “it can be done,” “we have the right people,” and “we are on the right path.” Participants described how they were feeling about the future of Berkshire County’s schools in positive terms:
● Hopeful, excited, and inspired were the top responses. ● Other responses were optimistic, motivated, proud, energized, reinvigorated, engaged,
encouraged, committed, and concerned.
106
VIII. Signature Experience At the educator/community convenings in August and November 2020, stakeholders were asked to help shape the idea of a Signature Experience that could be introduced at multiple schools on a pilot basis. The purpose of the experience would be to help students gain the competencies that are most needed to prepare them for the future education and career. At the final day of the convening, participants brainstormed about powerful learning experiences that could enable students to develop the necessary competencies identified in Berkshire County’s Portrait of a Graduate. The themes that were suggested fell into seven broad categories, with some overlap: 1. Interdisciplinary/capstone projects were suggested as a way for students to immerse themselves in
work across subject areas, in contrast to the traditional school day in which they switch from subject to subject. It was suggested that students design their own projects in areas that interest them and work with organizations in the Berkshires to solve problems, address community issues, and introduce innovative approaches. The project could be year-long or could be a research sequence spanning across multiple years in high school, culminating with a capstone experience and final presentation senior year. Participants felt that this type of project could give students a voice in their community and provide them with a sense of place and empowerment.
2. Career exposure was suggested as an area of focus to expose students to a variety of career paths
and job opportunities. Consistent with what we heard in the community research, internships and field experiences were stressed as important career activities. Participants felt that all students, not just those in vocational programs, should complete internships to gain experience with Berkshire County organizations. Other suggested career exposure activities were job shadowing, workshops, and guest speakers in the schools.
3. The notion of Hands-on/Real-world experiences was stressed. Participants suggested that students
be able to choose from a variety of options as a graduate requirement, such as service projects, internships, jobs, or an independent study. Students would work on these projects to address real world experiences.
4. Interaction with the community was stressed as an important component of any signature
experience. Students could establish partnerships with community organizations or businesses and work with them to solve problems and find solutions.
5. Skill-building was mentioned as an important component of a signature experience. Students need
to develop skills and habits of success in areas such as goal setting, time management, organization, and self-management. Following the model of professional development for teachers, countywide professional development for students was suggested as a way to build their skills.
6. Financial education was identified as one of the most critical readiness skills that students need to
have. Participants at the convening suggested that a concentrated effort on financial literacy is needed, and that banks, institutions, and schools could come together to develop this experience. Ideas that emerged were a yearlong budgeting assignment, financial literacy as a unit in a course, and having every student receive it in a specific grade. The importance of financial literacy was also consistently stressed in surveys and focus groups. Balancing a checkbook, filling out FAFSA forms,
107
applying for a loan, paying taxes, and saving for college were all components of financial education that were identified as being needed for all students.
7. The importance of having staff and community mentors for students was discussed at the convening as a way to support students and draw out their strengths. They felt that mentoring would be an important part of a signature experience. This reinforced findings from focus groups and surveys about the importance of mentors. Having an alumni network available that could serve as mentors was suggested during an alumni focus group. A participant noted that learning how to identify mentors in high school helped him do the same when he got to college. In the community survey, mentoring was the most frequently mentioned strategy for high schools to address achievement gaps among students.
Following the brainstorming exercise at the convening about signature learning experiences, ten breakout teams each fleshed out one or more ideas in further detail. A full list of ideas generated by each team was captured (a sample provided at the end of this section). Each team identified the main competencies that their idea would address and then developed ideas for signature experiences. Most of the ideas were aimed at all students, in some cases as a graduation requirement. One team proposed specifically targeting students who are becoming disengaged in school. The signature experience ideas that were discussed by the teams focused mostly on community-based or capstone projects that incorporate community connections and build a variety of competencies. Consistent with the initial seven themes that emerged during the brainstorming sessions, the team’s ideas incorporated the following components:
● Project-based work ● Research and presentations ● Multiple grade levels ● Mentors ● Student choice regarding topic and type of activity ● Community involvement ● Hands-on experiences ● Solving real-world problems
The plans developed by the ten teams offer a starting point for implementing the signature learning experiences as the Portrait of a Graduate work continues. In addition to shaping what the experience will look like, the teams identified important next steps: FITTING IT INTO THE SCHOOL DAY
● Implementation of a signature learning experience will need to consider the different schedules and course requirements.
● The signature experience should not be treated as an extra activity for certain students, but rather embedded in the school schedule for all students.
PLANNING AND LOGISTICS
● Adequate time should be allotted for professional development and training for all involved. ● Time must be set aside for collaborative planning time both among teachers and between
teachers, students, and the community. ● Identify the grade level(s) for the experience. ● Provide links to the school curriculum
RESOURCES ● Transportation will be needed to facilitate student interaction with the community. ● Schools need equal amounts of funding for the signature experiences to make them equitable.
BUY-IN
● Buy-in is needed from school administrators, teachers, parents, the Superintendents Roundtable and school committees.
● Students need to be given an active voice in how the experience is structured. ● Schools should consider identifying “project champions” who provide organization and
momentum and encourage others to buy in. The expectation is that by providing students with a signature experience in high school, they will develop the competencies they need to be successful in the future. Through this work, students will develop and practice skills in oral and written communications, critical thinking, goal setting, and problem solving. They will learn how to practice personal responsibility, demonstrate a strong work ethic, and become more community-minded. By giving students a choice in shaping their own signature learning experiences, they will have an opportunity to pursue areas that interest them and learn about possible education and career paths for their future. A sample Designing for Action Tool is provided below: Figure 34: Designing for Action Tool
109
110
IX. Berkshire Portrait, Overview and Graphic The grid below, Figure 35, represents the key competencies, indicators, and “I” statements the teams arrived at following the process outlined in earlier sections. Figure 35: Berkshire Portrait Grid
This text was converted to working draft of an initial graphic concept that is provided on the next page. A variety of options and models were explored, including ideas from other Portraits. This graphic was produced with the support of teacher Heather McNiece and her students who developed several prototypes that were, ultimately, edited and adopted. The PoG team will continue to refine this graphic based on stakeholder engagement and input, but are quite excited about this working draft.
111
Figure 36: Berkshire Portrait
112
X. Portrait Competencies Below, the six competencies, and associated indicators are explored in further detail. Our aim was to provide working definitions, examples of practices, and how we might envision these competencies applied in our schools.
1. Academic Foundations
I will develop the academic foundations to thrive in future educational pursuits, career, and life.
● Master and apply core content knowledge. ● Develop and apply new skills. ● Use technology to learn and to work.
Whether attending college, pursuing a career path, or engaging with life in the 21st century students require the academic foundations for success. This competency takes into account the nature of education as a personal journey and how we apply the fundamental skills necessary to thrive in our future pursuits, whatever they may be. While a coursework-based view of academic readiness, The Commonwealth of Massachusetts outlines academic foundations for career and college in the Mass Core Framework. We believe that engaging experiences developed and delivered within the breadth of a student’s coursework will lead to the academic foundations necessary for future success and ultimately individual well-being. The more coursework and experiences can be tailored to a student’s interests and passions the greater likelihood content and skills will transfer from school to their lives. Students will master and apply core content knowledge in academic, work, and other contexts. Our hope is that students take the knowledge and skills developed from their coursework and apply them in future situations. For example, a student currently experiences vertically aligned reading and writing instruction grounded in the K-12 English Language Arts and Literacy Standards. Whether an individual is furthering their education or in the workforce, reading a variety of texts and understanding the information is almost certain to be a necessary skill. While the curriculum frameworks are a foundation of what skills or content is taught, our goal is to create experiences that will lead to demonstrations of knowledge and skills in new and applicable ways. Untapped opportunities exist for aligning experiences, cross-curricular projects, and other collaborations in our region. Designing concrete activities that engage students across our partnering schools is an aspiration for us to achieve in the implementation phase of this project.
Students will develop and apply new skills. Living in an evolving local and global community requires us to be adaptable and develop our abilities to meet the needs of the moment. This means both developing a disposition and mindset that learning new things is essential, but also that the skills we acquire are applied in different settings or contexts. For example, students may acquire the skills using the scientific method for lab projects in science courses or analyze a research study in a psychology class. Understanding these processes and methods allows learners to make meaning in new situations, as well as apply the skills to design their own experiments and research. Developing and applying new skills does not solely reside in traditional academic pathways. The robust CTE (Career Vocational Technical) program at Taconic High School in Pittsfield offers our region’s largest arrangement of career training tracks. As students hone their skills in these areas, they embark on
internship and cooperative education experiences that are an extension of the school-based work to outside the walls of the classroom. Our task as educators and a community of high schools in the Berkshires is to prepare students to participate fully in our ever-evolving world. We must help them develop and apply what they learn to new contexts after high school whether that be college, career, or life.
Students will be able to use technology to learn and work. While the use of technology in schools has grown significantly, the Covid-19 pandemic has accelerated the adoption of new platforms and digital tools to facilitate learning and work. Never has it been more imperative for schools to impart a range of technology skills and apply them to the various aspects of our lives. An intentional use and application of technology tools and platforms that support student growth in their next steps is more critical than ever. This year the Berkshire Remote Learning Initiative (BRLI) has focused on building a countywide network to help deliver digital course content and foster collaboration using a learning management system. Nearly all high school students in our community have been using Canvas to engage with coursework and to submit assignments in the 2020-2021 school year. Using a learning management system exposes students to the structures and processes they will experience in college or in workforce training scenarios. This also provides further resources for our teachers to organize their curriculum and collaborate. The use of technology to create and learn should be embedded across our high school curriculum. Future opportunities to align our work in partner schools around technology platforms, coursework, and projects are exciting possibilities.
Measuring the Academic Foundations competency and indicators will require further thought, research, and planning. It is likely that we are able to apply a broad measure such as completion rates of students fulfilling the expectations of the Mass Core Framework. An additional measure and aspiration of our team and the Berkshire Community is that all students have access to and complete at least one advanced or college level course while in high school. At present, this data is collected and available from the Massachusetts Department of Elementary and Secondary Education. In addition, the development of student learning plans that connect coursework to their future pursuits would create alignment between students’ K-12 education and their next steps. Lastly, capstone experiences that integrate student knowledge and skills in multiple areas would be a valuable culmination of a student’s coursework and interests as they move into further phases of their educational journey in college, the workforce, or life. We look forward to the work ahead to ensure that all students have a meaningful school experience that lays the academic foundation for their future.
I will communicate effectively and with purpose to different audiences in a variety of settings.
● Write and speak clearly. ● Listen to understand and reflect. ● Evaluate, create, and share information responsibly. ● Collaborate in a variety of ways.
Ever present and important in our interactions with individuals and our community is the skill of communication. Our students impart and decipher meaning in an increasingly digitized world. We speak, write, and listen to others in a range of different situations. The ability to communicate is a nuanced skill and, when we do so, we are imparting or exchanging information. Whether a student is presenting a detailed research assignment or expressing gratitude in a social media post to friends or family students must have authentic experiences to develop their communication skills necessary to thrive in our evolving society. Students will write and speak clearly. By preparing and delivering effective products or presentations, students should engage in a variety of tasks that help them develop skills in this area. All students should have the experience of using and enhancing their skills of spoken and written language in their courses and in different situations. Depending on the setting, these demonstrations may intend to persuade, inform, or entertain. The ability to write and speak is not limited to a particular subject or setting and should be embedded across all aspects of a school experience. Currently, Pittsfield High School offers the AP Capstone Program in which students develop college research writing and presentation skills in a two-course sequence. Scholars enroll in Seminar and Research where they construct academic papers as well as present their findings and arguments. Presentations are video recorded with students fielding oral defense questions in both practice situations and formal submission to The College Board. The ability of students to engage in more self-directed projects was a sought after experience for our community as we worked through the design phase of our Portrait. Opportunities exist for further exploration and development in the implementation phase to bring experiences like this to scale in more schools and to all students. Students will listen to understand and reflect. An important quality of a good communicator is the ability to decipher meaning. It is important to listen to information presented and to understand the intentions and purpose of a presenter. By actively listening and reflecting on what is said, written, or shared we affirm another person’s work and intentions. We are able to reflect and respond more appropriately to the information as well. This likely increases the ability of the other person or group to respond in kind. In the classroom, peer feedback can play a significant role in supporting student progress and development toward course expectations. Many of our schools have integrated restorative practices and discussion groups to address school discipline issues. This supports the individuals involved by developing their communication skills and helps to heal the community. Both in academic and social settings, students need more practice speaking and listening to each other in intentionally designed experiences that help foster this skill.
Students will evaluate, create, and share information responsibility. In a society that increasingly relies on digital platforms to receive news it is essential that students develop skills to evaluate information presented to them. As creators of content in a rapidly evolving digital world, what we share with our networks gives others a lens into our interests and values. More than ever, students
115
in high school have the opportunity to connect socially and share information. Like adults, they have an obligation to think through the implications of sharing or distributing material. Evaluating the authenticity of sources and the relevant facts or information supporting an argument is essential. Whether students share a news story or reference something they have heard, distributing information comes with a responsibility to ensure accuracy. Lastly, students are creators of content and material. An evaluation of one’s work and sharing to larger audiences for a desired effect to persuade, inform, or entertain is essential. A possible area for collaboration among our participating schools is to develop a shared media literacy experience for students.
Students will collaborate in a variety of ways. One must work well in the first three indicators
in order to collaborate effectively. Listening to others and speaking clearly with intention helps to be a part of a team, family, or community. In high school, we expect students to experience working with groups of diverse peers to solve problems or towards common goals. These collaborations may be in person or using digital tools. It is imperative that youth see educators and members of their own community modeling effective collaboration, and to understand that working together is central to a well-functioning community, whether it is a school or our government. As we look to further our collaboration as a group of schools in the Berkshires, we have opportunities to encourage students to work with each other in their respective schools but also in experiences between schools toward common goals or criteria. As we move toward the implementation phase of this project, an opportunity that cannot be overlooked is a collaboration of students in different schools.
All students should have a wealth of opportunity to practice their communication skills in a
variety of settings. From students on more traditional academic pathways to CTE students, opportunities exist for writing, reflecting, and analyzing information. Special education students must have experiences using these skills supporting their unique developmental needs. In addition, English Language Learners have significant opportunities to build their capacity for written and spoken language through diverse experiences. Possibilities exist for cross content collaboration that highlight student generated content. Measurement in this area could take multiple forms and may involve the creation of common criteria to assess students in the indicators of this competency. Additional work, research, and reflection is necessary to fully develop this competency and the collaborations to ensure a powerful impact for all students.
116
3. Citizenship
I will empower others, serve my community, and better the world.
● Treat others with kindness and dignity
● Practice civic awareness and engagement
● Work to build greater equity and justice
● Explore and respect other cultures, traditions, and values
While Citizenship might be one of the hardest competencies to define and to measure, it might also be the most valuable. It is, after all, the intended end goal of most of our efforts: to produce good human beings and inquisitive and involved members of society. This is the competency that takes into account the broader scope of being human, something that transcends benefit to the individual exclusively. It suggests education as means to develop an interest in the greater good of others, not just the individual, not just the self. In the pursuit of this competency, we look to how we might foster the development of citizens who value others and who invest meaningfully and passionately in their communities, their governments, and the world.
In our minds, the first indication that our students are good citizens is that they treat others
with kindness and dignity. Our students will not live in a world of isolation, but in a very social world. Our hope is that our graduates not only possess the tools to cope within this complex sphere, but to thrive within it. To this end, we intend to take measures to ensure that our graduates are polite, respectful, compassionate, empathetic, charitable, and considerate. At present, we have activities and programs in place that help young people develop these dispositions. For example, Lee Middle and High school students participate in a school-wide House program, in which students are divided into four vertical cohorts throughout their middle and high school careers. Students participate in a wide variety of activities designed to build a sense of community and belonging as part of the House program, including student-developed and run community service projects, bonding and networking activities, and communal problem-solving and support ventures, like mentoring.
Civic awareness and engagement is another key indicator that our graduates will enjoy towards
a full sense of citizenship. To be prepared to participate in this aspect, students must learn how their government functions at all levels, local, state, and federal. Indeed, many people vote only in presidential elections, but citizens’ voices in other elections, such as congressional, senatorial, state, and local elections, is often lacking. We hope that our graduates will be moved to join the discourse, to help shape the direction of their community, their state, and their nation as savvy constituents, informed voters, and perhaps even public officials. To this end, all Berkshire districts provide a Civics course and many provide an American Government course. In addition to these offerings, Lee Middle and High School also provides an elective called “Democracy” in which students learn how state and local governments function, keep up with and engage in informal discourse about current events, participate in formal debate about current controversies, and work collaboratively to envision solutions to challenging socio-political issues.
In addition to being politically aware, Berkshire graduates should also advocate for the equal
rights and fair treatment of others. We believe that “all [people] are created equal” and are thus entitled to fair and equitable treatment and opportunities in their “pursuit of life, liberty, and happiness.” This is not only critical to American democracy, but to the welfare of citizens around the
117
globe. Indeed, it is not the “American way” to sit idly as others are oppressed, but rather to work to protect human rights and liberty on a global scale. We are committed to the idea that our graduates will be prepared to recognize inequity and injustice in a wide range of contexts, from isolated incidents to systemic failures, and to take action to bring about positive change. Furthermore, our students will recognize and seek to avoid or deter implicit and explicit bias, in both the environments they encounter and within themselves. At present, Pittsfield High School offers Peace Jam as an extracurricular activity. Peace Jam is an international club whose actions are inspired by Nobel Peace Laureates to foster young leaders who are committed to positive change within themselves, their communities, and the world. In recent years, Peace Jam has worked on projects concerning child marriage within the United States and human trafficking worldwide. This group presents their work annually at a New England conference.
Berkshire County, on the whole, does not have a lot of diversity, which is why we are committed
to providing our students with the tools, experiences, and dispositions to embrace the diversity that we do have and to thrive in a diverse world. We believe that the best ideas and solutions come only when multiple perspectives are considered, when an array of voices are heard, and when the wealth of varied experiences come into play. To this end, we seek to provide our students with opportunities to explore various cultures, traditions, and values through an objective and open-minded lens and with inquisitive minds. At present Lee Middle and High School offers a Social Justice Club to students in grades 7-12. This group, which usually has a rather large enrollment, organizes several school-wide events each year, including at least one designed to expose students to new cultures and experiences. In past years, the Social Justice Club has organized a Celebration of Religious Diversity, an Equality Fair that focused on the fight for justice among a variety of marginalized groups, and most recently, a Diversity Fair, in which all students enjoyed the opportunity to explore other cultures from around the world. All of these events are student organized and student run, and they include a heavy dose of interactive, hands-on learning.
By focusing on Citizenship as a primary competency in our Portrait of a Graduate plan, we hope
to give each student, each soon-to-be adult, voice and a sense of higher purpose, the means and the will to make the world his or her own in a significant way. In this sense, learning on this scale can happen in both a broad context for entire student populations and on the individual level. Exploration of the political sphere, the context and problems surrounding equity, and other cultures can certainly take place though day-to-day coursework, extracurricular opportunities, initiatives, and events in each of our districts. However, it is reaching the heart and mind of each student as an individual that matters. We have generally found that students are engaged when their work is relevant to them, when it pertains to things that matter to them. By individualizing our students’ journeys toward citizenship, we might inspire and give voice and purpose to those who are less engaged, marginalized, or otherwise challenged in school and in American society. To approach this goal with purpose ourselves, we will actively seek ways to draw in every student. We will meet students where they are.
For this reason, a provision for student choice and student voice is crucial to the success of this endeavor. To this end, individuals or groups of students might choose a community service project to complete or a political issue to advocate for. Students might write editorials about issues they are passionate about or meet a requirement to attend a political event of their choice, such as a town meeting or a school committee meeting.
Furthermore, these activities must be modifiable and adaptable as needed to provide a high quality, high impact experience for every learner. For example, a highly motivated student might take on an internship in a local candidate’s campaign, initiate a community service or fundraiser, or visit another country or culture firsthand, while a capable, but perhaps less motivated student might
118
demonstrate knowledge of the distinctions between different American political parties, voice an informed opinion about a current issue of debate, participate in community service or activism, or attend a multicultural event. An English language learner might learn how the United States government functions, develop a vocabulary that enables him or her to follow political developments in the news, share his or her culture with others, and experience other cultures firsthand.
119
4. Critical Thinking
I will think deeply and creatively in order to solve difficult and complex problems.
● Take intellectual and creative risks
● Develop original ideas, methods, and interpretations
● Manage and organize new ventures
● Identify and analyze patterns and their deeper meanings and implications
The ability to think creatively and critically combined with the will and the courage to question, to explore, to experiment, to discover, to innovate, to devise practical and novel solutions, and to blaze new paths will serve Berkshire graduates well in the near future and in the world to come. By prioritizing this competency, we acknowledge its immediate value in the lives of young learners as well as its promising implications for the future. We elevate critical thinking for its two-fold benefit--its inherent value to the process of learning and the short- and long-term products of a sound education. Critical thinking is vital to the learning process. It broadens and deepens content knowledge, embraces the value of failure as comparable to that of success, and nurtures budding lifelong learners, organizers, leaders, and pioneers. It is also inherent to achieving positive results: the ability to discern truth from hyperbole, objectivity from bias, to recognize trends and patterns, to make informed decisions, to discover feasible solutions, to emerge vibrantly from adversity and times of challenge, to propel the world toward new and innovative advancements and approaches, and to live and act as an informed and thoughtful citizen. To these ends, we will embed critical and creative thinking and problem solving, strategically and with intention, into our curricula and experiential learning activities.
We hope to embolden our students with the fearlessness to take intellectual and creative risks. As the old saying goes, without risk, there is little reward. In our minds, however, risk-taking does not always mean that a venture will succeed. It is the boldness, the audacity to face an intellectual or creative challenge head-on that interests us--the willingness to think and to question beyond conventional wisdom. To be sure, at times, this will result in tremendous success, but at others, it may result in meaningful failure; that is an experience made worthwhile by the lessons it provides. Furthermore, in order to take risks, to test new methods, one must engage fully and deeply with content--one must own that content in a very personal way.
Our indicators for Critical Thinking are deeply interwoven. It is from risk taking that our third
and fourth indicators rise. To be sure, one cannot develop original ideas, methods, and interpretations or manage and organize new ventures without a certain level of inherent risk. We are asking our students not only to attach deep meaning to what they learn in our schools, but also to apply that knowledge in innovative ways and in a variety of situations. At present, we provide our students with multiple opportunities to practice developing innovative ideas and manage new ventures. For example, students in science classes at Lee Middle and High School engage in several competitions throughout their high school careers, such as building and racing balloon-powered race cars and devising methods to drop eggs from the rooftop without so much as a crack in the shell. In eleventh grade English, students are challenged to break traditional writing conventions and to explore more advanced and creative writing strategies in personal essays and to master the techniques of formal oration in front of an audience of their peers. In social studies, students routinely engage in formal and informal debates. Just two years ago, a student designed and successfully created a course called Democracy. During the following year, his first year of college, he worked on the campaign for a congressional candidate. Last
120
year, another student initiated an Environmental Club in which students work on protecting the environment at a local level. Next year, her first in college, she plans to major in environmental science.
The ability to identify and analyze patterns and their deeper meanings and implications is vital
to deep learning at all levels of education and also to life--professional, communal, and personal--beyond school. We use these skills all of the time, whether to decide who to vote for in the upcoming election or which new car will best serve our needs. In the workplace, as well, we employ these skills regularly. Whether we are analyzing the implications of a quarterly report for our company, seeking ways to improve home sales in a down market, planning an innovative engineering feat, interpreting and adjusting our lessons based on recent assessments, or planning the best treatment for our patients, uncovering and analyzing the meaning and consequences of the pattern is directly tied to positive results. Currently, our students engage in the identification and analysis of patterns and trends regularly in their studies of literature, science, history, mathematics, and quite often the arts. When tracking results in a science lab and analyzing them against a hypothesis, one seeks and analyzes patterns. When one studies the success or failure of a politician or endeavor from history and examines the implications on events over time, one seeks and analyzes patterns. This skill is deeply embedded in our current curriculum. Our purpose in highlighting pattern analysis as a priority indicator for the Critical Thinking competency is to push it even further into the forefront of what we do.
As with our Citizenship indicators, our Critical Thinking indicators must be designed carefully so
that the experiences we provide are both engaging to all students and adaptable enough to provide an appropriate level of challenge to all learners. As a cohort, we have discussed the potential of introducing capstone projects that gradually develop over grade levels and culminate in a major final project in twelfth grade. This type of project, or something similar, would be an ideal way to engage our students in independent risk taking, project planning and organization, critical and creative thinking, and problem solving. Our intent is to individualize this series of learning experiences so that students find them inherently motivating, again through the inclusion of student choice and voice, and appropriate to the needs of each learner.
121
5. Demonstrate a learner’s mindset
I will actively pursue lifelong learning so that I can embrace opportunities and adapt to changing circumstances.
• Resilient
• Resourceful
• Curious and open-minded
• Reflective
The selection of “demonstrating a learner’s mindset” as a key competency is a reflection of the county-wide commitment to lifelong learning. Berkshire County community members, our students, are fortunate to reside in an educationally and culturally-rich, geographically stunning environment: one that supports the concept of always questioning, always engaging, and always contributing. While our students begin their formal education as very young people, it is our desire to support the development of learners who embody a sense of dedication to tasks that are challenging and require creative approaches and risk taking, and to teach our learners to think deeply about their needs, words, and actions. Through this competency, we will support inquiry-based learning in ways that mandate deep thinking and perseverance.
Students will be resilient. The expectation around having a learner’s mindset begins with developing a student’s sense of resiliency. This is not an academic content skill, but rather, a commitment to being committed. It means educators and employers providing opportunity for productive struggle, for error and correction, and for individuals to know the benefit of “staying in the game” even when things are difficult. When answers are not readily available, it requires thinking differently and perhaps inviting others in as collaborators to the solution. Examples already occurring in Berkshire County schools, as well as nationally, are found in the myriad of service learning/community service projects students engage in each year. At its most efficient, students identify and explore community-based issues and then work to creatively solve the problem(s) in ways that are as self-sustaining as possible. Most often, our learners have academic skills and expected learning outcomes tied to their community-based experiences with the teachers acting as coaches: providing skills practice while affording the students the chance to explore and learn on their own.
Research shows, time and again, the benefit of standards-aligned project-based learning and therefore many of our schools have adopted the expectation of a student-designed project requirement for graduation. An additional example is the leadership Berkshire County high schools showed in integrating the Massachusetts History, Social Science and Civics frameworks, in particular, the Civics project required in grade eight and at some time during the grade 9-12 span. In the completion of the civics project, students will experience success and challenge. While their project may be strong and highly beneficial, they will learn the challenge of navigating the levels of government at the local, state, or federal level, and that change requires a process that is often lengthy. And, despite the benefit of a particular project, students will learn that not all projects will result in change. The government may be slow or reluctant at first to adopt or adapt to the proposed change - students will have to learn to persevere even in the face of resistance. This will certainly build resilience!
In addition to being dedicated learners, the students in Berkshire County will be resourceful. This requires knowing what resources to draw from, understanding how people connect, and then developing a sense of how to leverage the human and tangible assets in order to address both personal and professional needs. Some schools in the county promote internships for high school students, while others focus on service to the school. It is our belief that all students should be afforded the opportunity to participate in meaningful internships – ones that create avenues for interpersonal connections and potentially for future employment. Berkshire Arts and Technology’s (BART) formalized internship program matches seniors with regional employers and identifies the desired learning experiences. Students must create a portfolio that captures their learning and document application of their new competencies. In addition to academic skills, students develop and practice the “soft skills” needed to be successful. Students can also experience the very real needs of solving problems where solutions are not readily evident. This building of their resourcefulness will better position them for college experiences or life in the “real world.”
Students will be curious and open-minded. Being resourceful requires asking questions and being open to the multiple answers that may present. To this end, we noted that students must be encouraged and taught to be curious and open-minded. While curiosity may seem a difficult concept to teach, it was identified by the multiple stakeholder groups to be essential to the success of our future learners. Curiosity is inherent in some situations, as people all have areas of interest; however, the challenge comes in building curiosity around topics that may feel foreign or be of less interest. Berkshire County students must have ample opportunity to engage in the arts (in all of its forms), in clubs and groups, in athletics, and in community-based extra-curricular activities that foster a sense of curiosity.
Knowing that all individuals face challenges of many types throughout life, we believe it is of the utmost importance to encourage and develop students’ sense of open-mindedness. We live in a global world where we are confronted by images, writing, claims, etc., that do not align to an area of comfortable thinking for us and, as such, we have to remain open to new learning. Students are not to be channeled into particular groups or like-thinking; rather, they should be afforded multiple opportunities to explore the unknown and be presented with things that are different. Supporting learning with others, being exposed to multiple cultures and points of view, working in environments that are unfamiliar is needed in order to develop their sense of curiosity and open-mindedness. While we consider our students to be connected to the world, it is usually via electronic media and, to the degree that their formal education can do it, they need to be exposed to discomfort across multiple modes.
Students will be reflective. One does not learn without careful and purposeful reflection. To truly own a skill and to be able to leverage it in support of newer or ongoing learning requires thinking about what it took to develop the skill and how one can further practice it. Lifelong learners are engaged in cycles of questioning, problem-solving, and reflecting and we believe that to be essential for our students. To teach reflection, educators, families, and even the community at large can model such approaches and provide time and assessment schema in which students can insert their learning.
123
Berkshire County students have a unique opportunity to learn in an environment that is visually stimulating, geographically invigorating, and academically challenging. Educators are charged with delivering academic content in support of standards that are rigorous; however, it is essential that our learners also develop a sense of perseverance and know the power of being resourceful. We must enhance the existing community partnerships, develop new ones, and provide chances for our learners to examine what learning is like outside of school walls. And, most importantly, we must allow our students the time and space necessary to reflect on learning and identified needs, for without an understanding of their successes and challenges, they cannot achieve the level of independence sought through our Portrait of a Graduate work.
The potential scenarios for measuring success for this indicator will be defined during Phase II of the Portrait of a Graduate project. We anticipate evidence of success including a through line of activities created at each school, to provide a continuum that can be aligned to a school-specific rubric. Advancement along the rubric can be examined with respect to % complete, % of student independence, creativity and skills needed, and time required to complete, and the ability to identify available resources county-wide for living needs. While districts will have flexibility to create the specifics of their rubrics, the Portrait of a Graduate work will identify the key measurement topics that will be evident for each high school.
124
6. Personal Responsibility
I will demonstrate personal responsibility through my words and actions.
• Goal setter
• Act with intention
• Strong work ethic
• Time manager
The need for individuals to practice personal responsibility and to understand the reasons why personal responsibility is essential may never have been as clear to students as modern-day events have demonstrated. Expectations and standards within the civics/social sciences/history frameworks speak to the building of a sense of responsibility from kindergarten forward with each year gaining in scope and sophistication. Through exposure to social media, news outlets, and lived experiences, we are bombarded with messaging that requires digestion, reflection, and then careful response. Fact-checking, truth-seeking, and honest conveyance of what is observed and learned must be ideals that are instilled in future generations and this is embodied in personal responsibility.
Students will be goal-setters. The launch point for personal responsibility is to embrace goal setting. Determining goals and then identifying the path to reaching them (or not!) is something that educators are familiar with. Educators and community members must be supports, or coaches as previously stated, in order that our students learn to experience accomplishment as well as navigate the situation when goals are either not met or no longer reachable.
Students at Drury High School have opportunities to engage in goal setting via several pathways. For students who experience challenges in attendance or maintaining credits for grade-level status, there is a program with aggressive intervention to close gaps and enhance skills. This program includes personal responsibility markers aligned to timelines that keep students on track for grade level promotion and graduation coupled with engagement in service to/for others. Another program places students into leadership opportunities and mentoring, peer mediation, and school-based decision-making roles. There is also embedded personal development and goal-setting experiences integrated into a StoryPathing course taught to juniors by a guidance counselor. StoryPathing is an approach developed by Dr. Dennis Rebelo, who has partnered with Drury High School for a multi-year commitment to student growth through personal reflection and responsibility. Additionally, student representatives serve on local School Committees, participate in peer mediation and mentoring programs, serve on local volunteer agency boards, and hold various part time positions in the workforce.
125
Students will act with intention. Demonstrating personal responsibility requires acting with intentionality. One must consider actions and their potential reactions/responses, which takes practice. Educators and adults have a responsibility to create opportunity for our younger members to practice and gain skills to a level of independence. Students in Berkshire County are afforded the chance to take college courses at Berkshire Community College, Massachusetts College of Liberal Arts, or Williams College. Choosing to engage in college courses and to pursue the most challenging level possible at the high school level is indicative of intentionality. The participating schools in the Berkshire Portrait of a Graduate collaborative all have students who are taking college courses. The goal will be to increase the percentage of students who take at least one college course during their high school career. Additionally, acting with intentionality is demonstrated through student-led/determined academic programming, student projects that require innovative design and prototyping, and student actions that demonstrate purposeful understanding and grasping of the desired outcomes. To further the concept of intentionality, the Portrait of a Graduate work seeks to increase options for student decision making with respect to academics, social/emotional/behavioral programming, and civic engagement. Again, skills cannot be owned unless practiced and educators are coaches, helping to perfect the learners’ abilities.
Students will develop a strong work ethic. Creating successful students and preparing them to be successful citizens beyond high school means creating individuals with a strong work ethic. Students refine this through the combination of the aforementioned competencies, yet not without planning and creating opportunities for work ethic to be practiced and demonstrated. Work ethic is identified as a commitment to quality, adherence to expectations, dedication to personal best, and the ability to see a task through to completion. Developing a work ethic comes from practice and the schools of Berkshire County will continue to define the rubrics against which students reflect progress and are evaluated. This affords a structure for students to grow within and to develop their skills and define their personal best – their work ethic. Students currently practice this skill through a variety of project-based learning activities, internships, student-led clubs and programs, and in their commitment to the curriculum: the formal and informal learning opportunities that are woven into the Berkshire County high schools.
Students will learn to be successful time managers. All stakeholder groups identified time management as a critical skill for students to develop in order to navigate their future schooling and employment. Time management was defined beyond the professional lens as well, identifying the need to create space for personal enjoyment. Students across all schools have been managing time to varying degrees through academic requirements, athletics, band, theater, family, friends, and recreational activities. Carving out time for all of the demands they will face as they grow into their post-graduate lives is something that must be taught and practiced. To this end, stakeholders defined the need for time management to be supported beyond formal curriculum and to be modeled by the community both inside and outside of the school walls. High expectations regarding deadlines are key to developing the skills. Students also will be supported in their creation of personal time that allows for family and recreational activities that enhance one’s life. The need for space to “regenerate” supports the aforementioned need for creative thinking and problem solving. It works toward establishing our students as productive, imaginative thinkers and inspired members of society.
126
Measuring this competency will require the identification of weighted factors such as school attendance, work completion rates, accountability for personal actions, AP course completion, student growth indicators, the completion of financial courses and the completion of the Massachusetts civics project requirements. This weighting will occur during Phase II of the Portrait of a Graduate project and will be created by a group of stakeholders representing the academic (faculty and students), business/industry, arts, and student groups.
XI. Action Plan Our efforts this year have increased our resolve to move the Portrait ideas forward. We seek to actualize and operationalize ideas we’ve captured on paper...in our schools and for our students. While this year afforded extensive opportunities to explore innovative approaches, engage with our community, and develop aspirational competencies for our graduates - our team (and many of our stakeholders) maintain a bias towards action. A plan is just that, and we hope to bring our plan to life, into practice. Moreover, we have made that promise to our stakeholders, that this is more than just a visioning process and it will yield in tangible ways. We recognize that our plan is still a prototype, and that revision and refinement will be ongoing. Competencies and indicators need additional definition and clarification. And while we feel very satisfied with the level of community engagement and participation, this year was a starting point and we expect to advance the intensity of community participation along a progressive continuum that moves from informing, to involving, to empowering. Our hope for the coming year is to maintain our momentum by increasing opportunities to engage with and refine our Portrait...for people to get their hands a little dirty, and for our Portrait to get cycled through the wash a few times. We feel this will allow us to build increased consensus towards the Portrait’s aims via discussion, debate, application, trial...and error. We want the Portrait to move beyond the pair of dress shoes that are pulled out of the closet once or twice a year, and feel more like that favorite pair of sneakers - natural, comfortable, a part of who we are. Priorities, overview: With this as our (metaphorical) backdrop, we will focus on three key projects as part of our Phase II work that will build upon each other including asset mapping, alignment within our partner schools, and a pilot Signature Experience. Asset mapping will help us to better understand and catalogue existing resources, practices, and partners that can be leveraged in building Portrait opportunities. School alignment will allow each site to unpack the parts of the Portrait against existing improvement efforts, strategies, policies, and cultures. Both will lead towards a pilot Signature Experience that is developed across schools to form activities that are jointly developed and delivered as a means to learn, revise, and build excitement through practiced success. In order for this to occur, our community must become our partner, in a structural way. Thus, we will continue ongoing community outreach/engagement/partnership and develop evaluation and measures simultaneously. The simple graphic below illustrates these priorities.
Figure 36: Action Plan Schematic
128
Core Priorities, described: Below, the three core priorities intended in Phase II are described.
1. Additional Asset Mapping: Throughout 2020 we were able to engage in research including school exchanges and intersections with many community partners. Throughout, we were reminded that there are many interesting and impactful activities occurring both in our individual schools and across many community organizations and agencies. The challenge, in a region with shrinking resources and no regional advocacy entity (a county education office or collaborative) is that much of this work happens in isolation and is not consistently shared. While there have been efforts to build region-wide communication structures (such as the Compact for Education and the Berkshire United Way Positive Youth Development Council), they have not been sustained. We propose, as a Phase II project, to conduct comprehensive in-depth research and analysis on strengths and gaps in actualizing the Berkshire Portrait of a Graduate for all high school students in Berkshire County, including a full understanding of community resources, initiatives, and shared opportunities. In doing so, we will better assess current efforts and activities, pockets of excellence, resources, parallel initiatives, and potential ways to leverage community and cross-school resources in a more efficient and consistent manner. Through this mapping process, we believe we’ll be able to consider more easily how to build on these assets to address the aims of our Portrait. Moreover, we believe that this asset map will help to promote community involvement, ownership, and empowerment, so that they become integrated partners - recognizing the unique efforts, talents and capacity we have in our region. It is expected that this asset map will include information, for example, programs (school-wide and one-off) in our high schools that dovetail with our proposed competencies, current efforts of regional and state organizations, cross-sector initiatives that have and are currently ongoing, and capacities and abilities of community members. We must also consider the impact and identification of the political, human resource, social, and economic barriers that have obstructed similar change efforts in the past. We anticipate we will develop processes (reviews, surveys and interviews) to collect, tools to catalogue and organize, and expertise and staffing to deliver, manage, and analyze. Resources needed: Administrative management and oversight, researchers to collect/compile/analyze data collected, PoG leadership team (Core Facilitators and Site team members) to serve as the review and vetting team, committed time from community leadership and agencies, resources for convenings, resources needed to develop and maintain a mapping database (website or equivalent tools) are the resources needed to continue the work. Owned by: We see the PoG Leadership team and project manager as owning the development of the asset maps that are widely shared and treated by school-based teams.
2. Alignment within the school and community: We entered the PoG project recognizing the unique advantages and challenges associated with a multi-school (5) effort. While our Portrait was designed to advance cross-school collaboration through the development of a shared vision, we also recognized (at the onset) that each of our five schools existed as distinct entities, with unique school cultures, structures, and pressures. They also exist in unique communities, and any success will require full integration of each community into its school. When we
129
launched this project, we expected that our Portrait would result in common ingredients that would be part of each school’s recipe, however we also asserted that schools would customize this recipe by adding unique spices and varying proportions of the shared ingredients. The good news - it turns out – is that our final Portrait resulted in a more highly universal set of common aspirations (competencies and indicators) than we expected a year ago, serving as a compelling foundation for the work of our schools and communities. In addition, we were very pleased to have a strong level of school personnel participation in the development of the Portrait, including school leaders, site team members, design team members, and wide participation in open meetings and convenings. These participants are a strong set of advocates who can carry this project back to each school and the broader community. That said, we offer that additional work must occur within each community and at each school. As such, we are including alignment at the school level as a critical priority in Phase II. We expect this work will involve a number of important activities that include:
● Awareness. Opportunities to share the PoG development process, competencies, and
aims. Sharing the lexicon of our Portrait will be important to elevating understanding and commitment.
● Empowerment. Opportunities for local stakeholders to manipulate the Portrait in highlighting likes and dislikes, elements that resonate (or don’t), while refining definitions of competencies and indicators.
● Integration. The Portrait will need to be cross-walked and critiqued against existing improvement, strategic, and external plans (accreditation and state), and local priorities. The goal is that competencies (the Portrait) are not viewed as add-on, but as part of how the school approaches systems, experiences, and outcomes.
● Local agency. While our Portrait is a regionally held set of aspirations, there are likely elements that will resonate and better align with school-level priorities than others. We expect schools will develop unique perspectives and strategies that can be shared and applied across the region.
● Force field analysis. School and community teams could dive into the political, social, and economic opportunities and barriers that exist.
We anticipate that full network convenings (all five teams) will guide this effort and establish common understanding and shared expectations, while affording ample break-out time so that each team can plan for and launch their local context and alignment work. This work will be led by local site leads (and design) with facilitation support. This will be followed by a series (throughout the 2021-22) of school-community based workshops and gatherings. We expect that as site-based teams tackle this work, they’ll evaluate the degree to which the Portrait is integrated, and/or provides a framework for more holistic school reform. Questions may include:
● What is our vision for the Portrait in our school? ● How will we grow into it and use it to advance school improvement, change, reform? ● What should our school be doing more of? ● What should our school stop doing? ● What are the roadblocks that we’ll likely face? How do we address them?
130
● How does our Community embrace the Portrait with a sense of shared ownership?
Our intention is that the Portrait serves as a basis for professional learning in our schools and across our network. The net result will be integration and implementation of community-based plans that crosswalk the Portrait competencies with historical and future improvement/strategic plans; lead to deeper buy-in, common understanding, and shared ownership across local stakeholders; result in a full commitment to the Portrait; and, establish priority/action steps that each school-community will develop to reinforce Portrait aims and competencies. Resources needed: Site leads at each school. PoG leadership team (Core Facilitators, Project Manager, and Design Team members). Resources that support team planning and work time, faculty/staff meetings and professional training events, print materials, exchanges with other schools, and (potentially) outside facilitators to support the school-based teams. Finally, it may be that teams want additional data in digging deeper into student patterns/trends. Owned by: We anticipate that Alignment will be owned by Site Leads in concert with school-based Site and Design teams, school leadership and community leaders/stakeholders. Efforts will be supported and monitored by the Core Facilitators and Project Manager.
3. Signature experience pilot: As suggested and briefly outlined in an earlier section, the Berkshire
PoG team envisions the pilot Signature Experience effort as an important element of our work in Phase II. The potential for this idea was raised early (during our summer community convening) and interest has grown as we considered ways to operationalize ideas, to build connections across our schools, and to test drive opportunities to reinforce and exercise the various Portrait competencies. Ultimately, our commitment to this idea was cemented as we learned more via various network webinars highlighting case studies such as Blackstone Charter (portfolio and external learning) and Springpoint (Transformative Learning Experiences), engaged our stakeholders in thinking deeply about a Signature Experience during our November convening, and considered strategic ways to advance our project in Phase II. We believe that the Signature Experience is an important next step for us for several reasons:
● Bias towards action. Our team (and to some degree our community) has expressed an impatience for ongoing (somewhat perpetual) planning processes. Many would like to see a tangible effect of our work, without compromising long-term deep integration. The Signature Experience could serve as an early win to demonstrate the transition from idea to action.
● Collaborative spirit. We have gained great momentum this year and (as will be outlined in our reflection questions) feel this is one of our most significant outcomes of 2020. We’d like to maintain this momentum and believe that a cross-school learning community (set of teams) could continue (and grow) these bonds by tackling a common project. By bringing teams together to explore the development of the project and pilot, to implement on a realistic scale, to integrate with community partners, to develop systems and measures, and to engage in a reflective state of continuous improvement - we will strengthen our relationships and trust through common/shared purposes, maturing the conditions that increase a collective willingness to scale and advance future collaborative efforts.
131
● Pressure test. We realize that our Portrait is a set of ideals that still needs to be field and pressure tested. There is additional work needed to unpack the competencies and indicators and define/describe them, to consider ways that they are or can be reinforced through experiences for our students, to explore ways to deliver across the districts, and to formulate (see below) methods to measure and evaluate progress.
As was outlined in the Signature Experience (VIII) section, we have already started the process of identifying potential ideas. There are a number of themes prioritized that, as one participant summed up, “we want this to be an awesome experience for our students.” Thus, we anticipate these will be interdisciplinary, require critical/problem solving, be based on a real world community problem, expose students to regional assets and potential future trajectories, link students with invested adults, and reinforce and build skills. In the next 18 months, we imagine a team of educators from each school working to develop this project in concert with peer schools, external expertise (Barr, TLA, partner schools), and community partners. We imagine a spring/summer set of exercises that allows schools to:
○ Learn more about project/problem and context-based education ○ Dig into the practices and literature on mentoring ○ Apply asset maps, leveraging key community partners ○ Develop a pilot effort that will involve one cohort of students at each school, to
participate during the second half of the 21-22 school year ○ Learn from (visit) exemplar schools to witness and/or hear more about these unique
delivery models (Note: We have a connection with William Smith High School forming to discuss how they are approaching senior expeditions - among other practices)
○ Coordinate resources, with backbone administrative and management support ○ Engage in monthly reflection and ongoing continuous improvement ○ Partner with consultants to consider the development and piloting of measurement
tools and processes ○ Share results (evangelize) with faculty and the community through presentations,
media releases, and celebrations
The result of this work, we expect, will be a greater understanding and commitment to the Portrait, further refinement of Portrait elements, identification of key activities that support competencies and indicators, strong connections across our schools….all leading to the potential to increase capacity and scale the Signature Experience based on what we’ve learned. While we see this targeted at a grade-level cohort, we imagine, long-term, a set of scaffolded experiences beginning in earlier grades and carrying through the high school, as aspirational. Resources needed: Administrative management and oversight, PoG leadership team (Core
Facilitators, Site team) and Signature Experience project teams at each school and across each community. Resources will support team planning and work time, cross-school-community gatherings and training events, materials, potential (physical) exchanges with other schools, outside consultants who can offer guidance and facilitation, data and evaluation support. Transportation and coordination.
132
Owned by: Cross-school planning team and the school leadership team, with support of Core Facilitators and the Project Manager. Additionally, we anticipate that additional faculty from each school (such as Site, Design, and others) will be engaging in the feedback and pilot process.
The remaining two projects are best described as integrated, complementary, and ongoing (as described earlier) in support of the priority projects. We see these as happening simultaneously with the Asset Mapping, School Alignment, and Signature Experience priorities. They are briefly described below.
4. Community outreach and change effort partners: As foundational to our project, community
outreach and engagement will be embedded into our Phase II plans and ongoing. The Portrait cannot be realized without the active involvement, commitment, and partnership with our Community. While we had wide participation across many schools, organizations, and role types, there is still a great deal of community participation that is needed to build awareness and a solid foundation about our Portrait, solicit ongoing insights and feedback, and link arms with community members as we advance activities, experiences, and expectations that reinforce the competencies and indicators. We envision engagement in several ways such as:
○ Additional underrepresented voices. We intend to reach out to additional stakeholder groups, such as school dropouts, disenfranchised and less engaged students, ELL parent groups, who were less active in the Phase I work. We are committed to capturing and including their perspectives as we advance the Portrait.
○ Community sharing: Early efforts to share across our community through presentations, press, video, written summaries, and distribution of the Portrait will occur through formal mechanisms such as school committee meetings, faculty meetings, and network meetings, as well as drop-in sessions delivered via Zoom/virtual webinar style presentation and question/answer sharing sessions. A tool will be developed to collect participant feedback pertaining to the Portrait elements, as well as ideas for activities and experiences that support competencies and indicators.
○ Convenings. As has been the case, we anticipate including community stakeholders and partners in meetings. We anticipate representation in the process of asset mapping, alignment at the school level, as well as training and facilitated sessions.
○ Members of Signature Experience: In that we expect the Signature Experience will have significant community intersections, stakeholders and community partners will be invited into the planning, development, and pilot process to shape this project, participate in project delivery (as is possible), evaluate progress, and consider ways to scale. For example, we see employers, our colleges, and agencies such as the Berkshire Workforce Board, the United Way, and various community coalitions, among others, as critical to this project.
We anticipate that the net result, and our commitment, is that outreach and engagement will be ongoing and will include a cycle of continuous intelligence and regular opportunities to share information and elevate awareness and for stakeholders to participate in various meetings and feedback mechanisms and to become an empowered part of our project through a seat (and voice) at the table. The success of this project will be built largely upon the buy-in and commitment made and sustained, thus mechanisms for engagement will be key to achieving that aim.
133
Resources needed: Administrative management and oversight, coordinators to maintain connections to community stakeholders, PoG leadership team (Core Facilitators, Site and Design team members), resources for convenings, resources needed to develop community accessible resources (website, video, presentations, print materials). Owned by: We see the PoG Leadership team, primarily the Core Facilitators and Project Manager, as owning this project, with close partnership with project administrative staff and school-based liaisons (Site and Design team) members.
5. Measurement: Throughout our project, we have recognized the challenges associated with the definition, and thus measurement, of various competencies. To define competencies such as citizenship and resiliency has been a difficult part of our Portrait development process. While we might know it when we see it...can we measure it and evaluate whether our students are progressing and responding to the various experiences and interventions we offer? We assert that measurement will be important in several ways:
○ It will help to refine and build a common understanding of what the competencies mean and how they (ideally) manifest in students.
○ It will allow us to determine to what degree students are, or are not, making progress towards the target goals and can serve to inform whether various activities, curriculum, instructional approaches, and experiences are effective.
○ It will serve as a means to report project progress to our community, as a demonstration of (if all goes according to plan) success. Through success, ongoing commitment can be strengthened and scaled.
○ It will evaluated the strength of our community partnerships, and to what degree they embody the PoG aims.
It is our intention, thus, to work on measurements as a complementary and simultaneous
project in Phase II. We believe this work will occur in concert with school-based alignment efforts and the Signature Experience pilot. Both will require that common definitions, rubrics, and evaluation tools/processes are developed. Moreover, we see measurement at the community levels as understanding resources, priorities, and experiences that are delivered, in partnership, with our community. This is critically important given that it will help us to refine what we are looking for, what we hope to see in our students, and what progress points (along the developmental continuum) would reflect target growth. While we have limited evaluation expertise on our core team, we envision that the measurement work will likely require external consultant support (content, coaching, facilitation, development of tools and processes). We do not expect that experts will drop-in solutions, but rather work with our teams to focus on target competencies and co-develop measures that represent local perspectives and priorities. We envision the developmental process will address questions such as:
○ What does the particular competency mean (to us)? ○ If a student has “mastered” a competency, what does that look like? ○ How might we pre-assess where students are currently, including assets they may bring
with them? ○ What are possible developmental milestones that can be used to mark progress from a
beginning stage through mastery?
134
○ What tools will help us to monitor and track progress, to empower student agency, and to communicate with various stakeholders?
○ How can we offer professional development and training to support use and application of tools?
○ How is our community a partner, and in what ways are they sharing and owning PoG aspirations such as field experiences, internships, community-service learning, etc.
Resources needed: Consultancy expertise to support and lead the development of evaluation/measurement knowledge, processes and tools. PoG leadership team, school-based teams, Signature Experience teams. Owned by: PoG Leadership team with support of consultant, with input and pilot at the school level through site-personnel and Signature Experience leads.
Timeline: We expect to develop a more refined timeline and work plan in our Phase II proposal, if invited. Below is a brief outline of how various activities might be tackled over the next 18 months: January: Completed Plan, submitted to Barr February: Invitation by Barr into Phase II, Preparation for Proposal Ongoing sharing of the Berkshire Portrait across user groups March: Submission of Proposal Grant Awarded Drop-in community sessions to share and gain additional feedback on the Portrait Phase I is officially closed April: Phase II Grant Launch
Organization of Lead team and Administrative structure Refinement of work plan Recruiting of Signature Experience cohort team Recruitment of school-based teams in preparation to lead alignment work
May: Securing of project staff, consultants and facilitators Convening of School Based teams (Site and Design), by Site leads Additional interactive & open (community) working sessions on Portrait
Summer 21: Summer convenings (Network Convening #1) A: School based teams focus on alignment work B: Signature experience cohort Asset mapping started by PoG Lead Team and staff Site-based plan development for 21-22 school year (tasks, responsibilities, deliverables) Sept-Dec 21: School-based teams conduct facilitated school alignment work Asset maps are completed and vetted Workshops and consulting on measurement and evaluation tools
135
Signature Experience Team produces draft of pilot effort Trips and exchanges with exemplar schools and models Study of models and approaches (such as Springpoint TLE) Winter convening (Network Convening #2) Jan. - June 22: School Alignment Documents completed with improvement plan
Integration and documented work plan that reinforces competencies and indicators Signature Experience Pilot launched with a cohort at each site Draft measures and evaluation tools are completed, shared, and piloted Summer convening (Network Convening #3) Evaluation of asset maps, school-plans, Signature Experience
Summer 22: Planning for Phase III, further integration and scaling of Portrait Reflection Prompts: The last section of this Action Plan responds to a variety of prompts and feedback shared during the action planning workshop. We suspect Phase II is not without challenge, yet we intend to creatively consider ways to offset and work through each. Several are outlined below:
● Leadership buy-in. We have been fortunate to have three of our five principals actively involved in the PoG Phase I work. Phase II will need added inclusion of the two additional principals and members of their leadership teams. Principals hold significant sway over school focus areas pertaining to school improvement and strategic efforts, as well as how professional and common planning time is used. Their investment and commitment to this project is of high importance.
● Policies, Systems, Practices: Our five high schools operate under different governance systems, calendars, daily schedules, and local policies. Moreover, they may have unique expectations/pressures (for example, Taconic is working currently with the ESE Assistance team) that complicate the addition of new projects and initiatives. The alignment effort will be critical to affording schools the necessary time needed to integrate and customize the Portrait based on their unique school context, pressures, and conditions.
● Fitting it into the school day. We have heard from participants that schools are squeezed with full schedules based on graduation requirements, and limited resources - which vary across school site. Our team suggests that the Signature Experience (or Portrait for that matter) not be treated as an extra activity, but as embedded into the schedule (and experience) for all students. Coordinating this across schools will be an ongoing challenge.
● Time. Time is always a constraint, and will be needed for professional development, training, and collaboration - both inside the school and within the community. Carving out time in creative ways that ensure PoG teams can invest in and thoughtfully approach this work is necessary.
● High Stakes. Many participants shared concerns about accountability demands and balancing these against innovative and progressive (different) ways of approaching the high school experience. Demonstrating that new approaches can accelerate student outcomes (engagement), while aligning Portrait competencies with curriculum standards will be an important element of our work.
● Resources. Schools will need funding and resources to ensure the Signature Experience, for example, can occur. Management of students in community-based projects and transportation
136
can serve as implementation barriers. Our efforts will need to address and reduce or eliminate these obstacles.
● Buy-in. A common theme is the importance of broad community investment in the Portrait - across all role types from school board, to staff, to students. Using champions (site leads) and providing voice to students will be important strategies to lean into this challenge and elevate broad commitment. Consensus building is part of our Phase II work as foundational and ongoing.
● Taking on too much. We have, at times, been overly ambitious in our efforts and we will need to temper the pacing and intensity of this work. Take bite sizes steps, we’ve been reminded. While maintaining a focus on the project aims, we hope to use existing assets (building on what we have), increase awareness of the Portrait, focus on a subset (not all) competencies, and use the Signature Experience to launch the process on a reasonable (smaller) scale.
● Incremental change or full redesign? We have been asked if the intended Portrait will be transformational or more of an incremental process? We imagine this will vary at each school site, depending on their readiness for change, their perspective of how closely the Portrait aligns with work already in motion, and to what degree other pressures will constrain or accelerate their need for whole-school redesign/reform.
● Longevity. Like our peer groups who offered this feedback, we also consistently think about the longevity and staying power of this PoG effort. Too many school reform efforts have come and gone during our tenures. However, we see the unique benefit of a regional approach and the formation of a cohesive network, supported by an organizational structure that helps to keep it all glued together. We believe that our successes, and proof-of-concept, will only strengthen and widen possibilities as our region faces ongoing enrollment and resource pressures. Still, the need to have a supported network and the necessary resources to support it will be key to long-term sustainability. What is critical is that the Portrait is jointly owned by both school and community. Whether incremental or redesign, this is about community level change and if this vision is not shared broadly, it will likely not sustain.
We expect to offer additional detail and work plans to our Phase II proposal, if invited, and truly look forward to a continued partnership with Barr as we move our Portrait from paper to practice. We are, of course, glad to offer any additional information as requested.
137
XII. Reflection Questions As we close out our Berkshire PoG Portrait report, we are pleased to respond to the reflection prompts. These thoughts represent both individual and collective perspectives, and a year-long journey that has been thought provoking, challenging (at times), and inspirational throughout. We have learned a great deal, grown closer as a team and community, and navigated a historical year that has placed (and continues to) immense pressures on communities, schools, and families. Across the nation and our community, the COVID-19 pandemic led to rapidly shifting conditions and a highly speculative and uncertain future, such that it was hard to think about or creatively imagine the innovative, transformative and collaborative ideals (foundations of this project) in the midst of a crisis. Rather, March 2020 (and the months that have followed) demanded full attention be placed on acute needs and stressors. Yet, what we are most proud of is that we did not fold, we did not pause, and we did not compromise. Rather, we used this moment to come closer together, to model and exercise the qualities that we wish for in our graduates, and to connect in new and unique ways. We viewed our work as synchronized with ongoing recovery efforts and, ultimately, contributing to the longer-term resiliency of our community and our students. As was captured by one in a team meeting, “While it’s unsettling at the moment with limited guidance, we have a chance to build a plan that will crystallize as new realities emerge…..thus, COVID can be our accelerator.” With this as our backdrop, we offer the following responses:
1. What are we proud of, and what progress (outputs and outcomes) was made? We navigated COVID, and delivered! First, we are proud to have arrived today (one year later) with a fully developed Berkshire Portrait, informed by: extensive community input and engagement; benchmarked against national innovative practices, models, and cohort peers; and, reflective of common interests and aspirations across five unique high schools. As mentioned, all this in light of immense distractions, emotional drain, and the volume of day-to-day management crises that pulled many towards triage and a demand to meet the basic needs of others. During this time schools shut down - opened up - shut down (repeat), we learned to deliver remote education (developing a county-wide consortium to assist in this effort), managed DESE expectations against local opinions/perspectives from parents and school boards, adjusted schedules/food/transportation, added a laundry list of health protocols, and - above all else - rallied to support the academic and emotional needs of each student and employee. Thus, we are proud to have produced a high-quality process, product, and set of next steps, throughout all. We broke through collaboration barriers! We believe that we have broken through school and town-line barriers in mobilizing a group of educators, students, alumni and parents across five high schools (representing three county sub-regions) in a meaningful way for the first time. We believe this accomplishment serves as precedent (and is thus critically important) in a region that is facing significant challenges of declining enrollments and shrinking resources, and the challenge of ensuring equitable opportunities for students across our region. This project has brought these historically isolated groups together and demonstrated that coming together, working together, imagining together - is a powerful act that does not threaten or diminish any one school (or town), but rather raises all.
138
We served as a source of inspiration and momentum, in a time of uncertainty! We are proud to have served as a mechanism for inspiration in a time of intense challenges (socially, politically, economically) for our community and our educators. We consistently heard from our team members and participants that this project has empowered them by offering opportunities (a moment) to think, to learn, to share, to listen and to speak. In doing so, many reflected that they felt both valued and inspired (joyful) in being given an opportunity to have a voice and take a lead in shaping the future of our high schools. While the pressures of daily routine realities were compounded by the added tensions of turbulent times, the opportunity to come together and think deeply was noted and appreciated by our team and the many participants who engaged throughout. We empowered and valued diverse voices! Our Portrait reflects a wide range of stakeholder voices and lived experiences….likely more than we had imagined back in January 2020. Each meeting, interview, written and spoken comment offered something new, something unique, and something important. In fact, just when we imagined we had heard-it-all and exhausted potential themes, something new would be shared that surprised us and shaped our thinking and this plan. Arriving at the (somewhat obvious) finding that experiences shape aspirations, required a group of 16-18 year olds to hammer home that point among a group of career educators. And this was the case as we heard from fellow teachers, community leaders, employers, and parents….each contributing a meaningful part of our vision. We maintained a learner’s mindset stance throughout! As much as we relied on our stakeholders to shape our plan, our work also incorporated lessons learned from many external partners and resources. As summarized in the Work Domains section and Outline of Key Events Appendix, we felt fortunate to attend all (or almost) Barr and The Learning Agenda (TLA) webinars, to connect with our TLA Coach, to present and exchange with Barr PoG cohort peers. This included the (somewhat overwhelming) amount of resources provided by Barr and TLA from which we borrowed including: CES MCIEA, Transcend, NGLC MyWays, Springpoint, and Batelle resources. These proved influential, informative, and inspirational in drawing from and applying towards the development of our Portrait. Moreover, we used literature reviews and exploration of best practices, across our region and across our nation, to identify exemplars and pockets of exceptional practice that we learned from and applied in our project. We have, in fact, a newly formed connection with William Smith High School to further dive into and learn about their work in transformative learning experiences. Finally, we applied data curated in concert with the Berkshire County Education Task Force (BCETF) to better understand patterns, trends, strengths and gaps in our schools. We modeled a process, and delivered a plan that is aspirational and attainable! All these combined efforts required that we engage and think about possibilities, while maintaining a positive and forward-thinking attitude. As such, we had to act collaboratively, make compromises along the way (such as shelving in-person exchanges/visits that had been planned), communicate in various formats and to various audiences, think critically and creatively, work hard, use our experiences and skills, and maintain our roles as members/citizens who act as something greater than themselves, and who serve on behalf of a community. In doing so, we not only arrived at our Portrait, but we modeled those competencies, skills, and dispositions we seek in our students. We are proud that we walked-the-talk, reinforced our ability to work across schools, and matured relationships and content foundations that will serve our work in Phase II...where we truly seek to bring elements of our Portrait to life.
139
2. What advice we would give to others, what shifts have occurred in our team, what did we learn, what surprised us, and how will we use what we learned going forward?
Have a solid organizational/management structure. One factor we all agreed upon is the need to have a strong project facilitation structure. Whether by chance, or intentional, our choice of project manager, core facilitators, team members, and various consultants (researchers and facilitators) resulted in a highly functional and committed set of individuals who were well known and trusted in the region, and able to manage both big thinking and detail work. As described in our section on Team Roles, having a project manager to coordinate meetings, maintain notes and documents, follow-up, manage details (such as budgets and contracts) was very beneficial. That we had someone with assigned time dedicated to our PoG team ensured we maintained momentum, regularly connected with our members, remained tightly organized, and consistently attended to the project’s aims/timelines. The Core Facilitators guaranteed that school-based relationship capital was applied to mobilize interest and participation in the project, to translate ideas within each unique school/community culture, and to provide general thought leadership across the project. Finally, we hand-selected consultants who were not only known in the region, but were committed to the project as invested residents (parents in some cases). These roles were instrumental in delivering high-quality tools and experiences, thus we suggest future teams think about the utility of skilled facilitators to manage key aspects of the project (such as convening, surveys, & focus groups). Create smaller, working teams within the larger organizational structure. We were fortunate to use a layered team structure (outlined earlier in the report) that ensured we had overall project coordination, opportunities to dig into elements of the project at each unique school site, and time to tackle specific tasks associated with the work plan. For example, planning and data working subcommittees were able to efficiently focus on targeted activities and events, without getting lost, overwhelmed, or distracted with the totality of the project. We’d suggest future teams examine their full organizational model, carve our roles and responsibilities, and build fluid subgroups as strategically needed. Get as many voices to the table as possible, they may surprise you. We spent a good deal of time identifying key sectors, organizations, leaders (formal and informal), initiatives, businesses/non-profits across our region in shaping our engagement plan. This led us to ask probing questions about representation, diversity, unheard voices, and unique perspectives. The lesson learned - you’ll be surprised by who will emerge when you deeply consider your community assets, and - more importantly - you’ll be surprised (and likely informed) by what they have to offer. While we entered with some trepidation about how we’d get access to alumni, it just so happened that many returned home during quarantine and this captive audience became an opportunity to survey, focus, and interview. What we learned was insightful and truly impacted our final Portrait and the experiences that will follow. As a bonus, we secured two alumni interns who became an important part of our team throughout the summer of 2020. Spiral the feedback and engagement. We were pleased to have built in opportunities to regularly revisit data, research, and findings with our teams on a consistent (monthly) basis. This process grew out of early presentations to Working Team and BCETF members, and was extended through monthly updates and the three convenings. While we may not have intended this when developing our work plan in Jan 2020, we found it became a very powerful part of our process. Consistent check-ins allowed each stakeholder group and a range of
140
individuals to digest a high volume of material in reasonable bites, to weigh in as the Portrait emerged, and to appreciate and be part of the progressive project development. We valued their ongoing input (and time), and this made for a better final product. And….people will be engaged. It was hard to imagine we’d experience the level of enthusiasm in the Portrait development process and final product. In our last convening, 100% of participants offered that the Portrait resonated entirely or mostly and many followed up with our team asking (enthusiastically) how they could remain involved. This level of commitment to a new vision was somewhat surprising. As a team that manages, participates, and delivers professional development...it can often be a mixed bag of enthusiasm and cynicism. Yet, there seemed to be genuine interest in reimagining our high schools as: driven by experiences of students who identified gaps; experiences from teachers who reported that students were less-than engaged and constrained by a traditional model; or via community members who cited the importance of soft skills, rather than academic know-how as priority. While community members are often perceived as outsiders to the schooling machine, they genuinely care about our schools and are open to ways to help. All participants projected seriousness about putting a dent in (how some described) the stuck existence and operational model of our high schools. Our learned advice then - expect your community will be fully engaged, don’t be overly surprised, and leverage this opportunity to learn and lean in. We intend to use our enthusiasm for the Berkshire PoG in Phase II to move from Portrait to practice, more fully align with our community assets, and maintain the momentum that has been evident throughout. Build from within, celebrate and call-out what you already have. As we explored ways to learn from innovative schools and about exemplar practices through school review, literature, and a variety of resources - we also came to recognize that there are pockets of excellence in all of our schools. We took the time to exchange practices in each of our schools and were both surprised and inspired by innovative and impactful efforts revealed. Thus, by acknowledging and celebrating what we are already doing, the question shifted from how we completely remodel (blow up the system), to how we learn from, scale, and build capacity across schools that already have great (often limited) things going on. We will use what we’ve learned outside of our schools to strengthen the good work already happening (rather than treating this as a reflection of glaring deficiencies), building from the ground up, and cultivating future excitement and investment.
3. What is our vision by the end of 5 years, how will the next 18 months support that vision, and how have we prioritized actions both near and longer term?
And...by 2026? Our vision for the Berkshire Portrait is that within five years it will be integrated into the five high schools and, we hope, additional high schools across the Berkshires. This will mean our schools, our faculty/staff, our parents, our students, and our community are aware of, invested in, and committed to the development of competencies, and associated activities, that strengthen outcomes towards these aspirations. We expect that within five years, the integration/reinforcement of competencies will occur across classrooms and community settings as a commonly accepted responsibility. Teaching and reinforcement will happen continuously, with training and peer exchanges used to refine content, approach, delivery, and activities with school personnel and in concert with community partners. Competencies, as we share across our community, will be the foundation upon which all of our work is grounded.
141
In order to measure success, by 2026 we will have worked with experts and cross-district teams to develop measures and tools that help us to better define competencies, assess the impact of various activities and interventions, and evaluate the progress of our students. We expect that the student will be at the center of this process with full agency towards self-reflection, building upon strengths, working to close gaps, and continuously revisiting both current state (where they are) and future aspirations (where they want to be) as an individual and member of a broader community. To make all this happen, the collaborative cross-district spirit that has been sparked in 2020 will be fully in place by 2026. A formal network that has normalized this spirit (collaborative or educational service agency) will exist in concert with parallel BCETF efforts that seek to facilitate cross-school and cross-district collaboration, partnerships, and shared services that lead to expanded experiences and opportunities for students and faculty, in an equitable manner, across the Berkshires. We anticipate this collaborative will be used to develop shared approaches (such as PoG, the arts Brainworks consortium, and the Berkshire Remote Learning Initiative - all advanced in 2020) that build administrative and back-office efficiencies, leverage technology to expand academic and educational resources, explore issues of curriculum and content, and better align with community partners in strengthening our region. We imagine this PoG project is the start of something that has immense regional possibilities. Ultimately, our hope is to have a shared set of common purposes and aims, sprinkled with a sense of urgency. The result? Strengthened outcomes for each student/graduate, including tighter connections to their community; fluid sharing and exchanges across our schools; high schools that are viewed as innovative, cohesive, and effective institutions; community partners and organizations that aligned in mission and partnership; and a broader community that holds, with confidence and as a top point of pride (thereby ensuring an ongoing population and economy), its schools. The next 18 months? We certainly seek to be invited into Phase II, in order to move our Portrait to practice. With our team, and through several community engagement activities, we have developed a broad set of potential goals/tasks that would define Phase II including: Ongoing community outreach and engagement, additional asset mapping, the development of a pilot signature experience, alignment of the Portrait at the school level, and the development of measurement tools. These are described in the Action Steps section. We chose these projects as priorities, as follows:
● School alignment. While we feel that a great deal of stakeholder representation was reflected in our Portrait, we believe that additional intensity at each school is needed to share the results, to build a common understanding and commitment towards this work, and to integrate the Portrait into other improvement efforts (School Improvement Plans, Strategic Plans, Accreditation Plans, Department of Education Response Plans). We expect to cross-walk our competencies against these efforts in order to ensure competencies (our Portrait) are not add-ons, but woven into how the school and its community thinks about systems, experiences, and outcomes.
● Assets. While we had limited time to exchange and catalogue assets, we believe a more comprehensive study, both inside the school and across the community, is needed. In doing so, we will better assess current efforts and activities, pockets of excellence, resources, parallel initiatives, and potential ways to leverage community and cross-school resources in a more efficient and consistent manner. The aim is complementary, not competitive investment and effort.
142
● Signature Experience. This project was identified, early in our process, for several reasons: First many of our stakeholders communicated limited patience for planning, and high interest in and lean towards action. Second, we believe that this project could be an excellent way to pilot our described competencies in better understanding what they mean, how we reinforce them through experiences for students, how we deliver across districts, and ways to measure progress. Finally, we see this experience as the common thread that maintains our collaborative network. By five (or more) teams sharing in the pilot development, we will continue to maintain a sense of common/shared purpose, advance the conditions for cross-school facilitated conversations in order to dig deeper, and grow closer.
● Measures. Many of the competencies fall into somewhat harder-to-assess categories, thus we believe the need to demonstrate the efficacy of these competencies, as well as experiences that reinforce these competencies, will be critical to maintaining momentum and ongoing commitment towards our PoG aspirations.
● Community Outreach. As suggested, outreach and engagement must be ongoing and go beyond simply showing up to a convening. We truly seek shared, equal partnerships. This will include a cycle of continuous intelligence and regular opportunities for meaningful and valued participation. The success of this project will be greatly built upon the buy-in and commitment made and sustained, thus mechanisms for engagement will be key to achieving that aim.
We’d suggest that our 18-month priorities are likely both near-term but also ongoing as the Signature experience is scaled and used to build from, measurements are refined with training provided to support staff and community, asset maps are curated and regularly updated, and outreach/ engagement/partnership continues as part of our core principles. As the project grows and matures, we suspect new opportunities will emerge to build additional cross-district teams, offer expanded opportunities to share and refine practices, and build/scale additional features that reinforce Portrait elements and aspirations. While we have exceeded our page count, we will close by thanking the Barr Foundation and TLA for their consistent and unwavering support. We believe that our Portrait (we’ll call it a prototype) will help us to advance and support those ideals and aspirations —and promote new opportunities that capitalize upon our strengths and deepen connections across our community. For that, we have appreciated the privilege to partner with you all.
143
Appendix I. Outline of Key Project Events (by month)
While not exhaustive, a summary of key work tasks and events is provided below. The Berkshire PoG
team maintained a calendar, task list, and work plan that was revisited on a monthly basis. Key tasks
included:
Sept. – Dec. 2019: Preparation for grant, submission, press, organization for January convening,
district agreements, logistics, budgets, contracts, contact lists, etc.
Sept. 25: Call with TLA on Resource Review project
Sept. 30: Barr Webinar: Primary Person Series Part Two: Scaling Best Practices
October, 2020: Ongoing debrief from summer conference and preparation for November
convening. Drafting of first portrait (with graphics) and development of (draft)
key competencies.
Oct 6: CF/Lead Team Retreat (#1)
Oct 14: Berkshires PoG and TLA Check-in
Oct 22: Presentation to OLLI
November, 2020: Preparation for November design convening and event. Post-event analysis of
findings, synthesis of key ideas and critiques of draft portrait, refinement of
draft portrait, participation in Barr/TLA planning sessions, plan outline settled
and writing (detailed descriptions of competencies and indicators) in full swing.
Nov 3: Design Convening, Day #3
Nov 9 & 10: Barr/TLA Network Convening, we participated and presented
Nov 24: CF/Lead Team Retreat (#2)
December, 2020: Further inclusion of convening findings and synthesis of key themes (M. Nash).
Further drafting of Portrait using resources and intelligence collected. Drafts of
portrait graphic – feedback from the team. Action Planning and Phase II
intelligence, Design at Margins organization, refinement of competencies and
indicators.
Dec 14: Action Planning Gathering (TLA/Barr)
Dec 16: CF/Lead Team Retreat (#3)
January, 2020 Completion of Portrait including document construction, editing, graphics, and
review by team.
January 7/14: Final Team meetings
January 20: Submission of Berkshire PoG Portrait to Barr
Other Activities of Note:
Various: Calls with consultants, TLA, Barr, network contacts (such as CCE)
Weekly: CF/Leadership Team Check-Ins
Monthly: Working Team Meetings
BCETF Full Committee meetings (updates pertaining to PoG were provided at
each meeting)
146
Additional meetings have been planned for January through March that target:
● Completion of the Berkshire Portrait, including graphic design and editing
● Sharing, circulation and presentation of plan
● Preparation (through Action Planning) for Phase II – Portrait to Practice
● Application (if invited) into Phase II
147
Appendix II. High School Interview Questions The following questions were used as part of high school site visits. Leadership teams from each high school were invited into these interviews, designed for 45-60 minutes, via Zoom. A facilitator and recorder from the BCETF/PoG team managed each session. The following questions were asked: Advance Data (In advance of the meeting):
The questions below reflect data we'd like to collect for each school, otherwise not readily available. We ask that teams, as this data is available, share this during or shortly after the interview.
o How many students (and how often) participate (as number or %) in athletics, clubs or other co-curricular activities, and/or travel experiences during the school year?
o What is the school schedule? (block, static, # periods, rotating) o How many students participate in community activities, civics groups, service?
Interview Questions
Improvement Planning o What are 2-3 priorities in your current School Improvement Plan? (2nd tier - who is
involved in preparing, shaping, delivering and monitoring the SIP?) o In what ways does your school's PD plan align to the School Improvement Plan?(who
establishes and sets your school's PD plan?)
Support Services o Describe 2-3 most effective ways your school counselors are utilized in your school?
(Describe roles, responsibilities, case loads) o How are your special education services organized and delivered? o Describe 2-3 most effective ways that your students (high school) receive college and
career readiness experiences? o Describe 2-3 most effective ways that your school programs for the social-emotional
needs of students?
Curriculum & Assessment o Does your school use benchmark or common assessments to assess student progress, in
what subjects? o How closely aligned is your curriculum to the Mass Frameworks in the four majors
areas: ELA, mathematics, science, social studies (1 - not much, 5 - highly)? o How are classroom teachers involved in curriculum development and implementation? o Does your school have a system for reviewing data in order to provide ongoing
intervention, inform classroom instruction, and guide longer-term school improvement strategies?
Out-of-school Time
o Does your school offer summer programming? (summer school, credit recovery, tutoring, enrichment)
o How often do your students engage in off-campus experiences that is connected to their academic courses (field trips, projects in the community, links to the region's
148
history/resources)? We ask you estimate this at (0-1 times per year, around 5 times per year, more than 10 times per year)
o Does the district provide bus service beyond the school day?
Instruction: o How often do teachers receive feedback on their instruction? o Does the school have a shared understanding of good instruction (instructional
system/guide/culture)? If so, briefly describe. o Does the school have a system for tiered and/or remedial instruction for students who
fail to meet learning/skills targets? o Does the school have instructional coaches?
Students:
o Does the school emphasize/encourage student participation in community activities, civics groups, service? Provide 1-2 examples.
o Do your students graduate with a clear post-secondary plan? Are you using a particular tool or form?
o Are students in your schools linked to a trusted adult advisor? Briefly describe, including estimated contact time.
o How often do students sign up for classes that do not, ultimately, fit into their schedule?
Family/Community: o How does the school engage parents in supporting each student's academic and social-
emotional development?
Additional questions: o Are there particular resources your school could use to more effectively support staff
and students? o How would you describe the state of technology in your school? o How does your school support diversity and equity efforts among staff and students? o How often do you (as a leadership team) or your staff collaborate with other regional
high schools?
149
Appendix III. College Interview Questions The following open-ended protocol/questions was designed to occur with leadership teams from the local colleges. Only one interview (BCC) occurred.
• What does your data suggest about college success as linked to particular student profiles/characteristics (resident/non-resident, commuter/non-commuter, Berkshire graduate/outside-Berkshire resident)
• What are the gaps in skills/readiness that you see as barriers to college completion/engagement/retention?
• Do you have a wish-list/recommendations for sending schools? • Does your academic support staff have data on who needs the most remediation/intervention
and for what skills/coursework? • What are the most common/least common majors? Why do you think they are
popular/unpopular? What does you faculty think? • Do you measure or survey which alumni are most "successful" or "satisfied"? What does that
mean to the alum, the college, their long-term economic viability, and happiness? • What should county high schools be thinking about for college preparation?
150
Appendix IV. High School Snapshots/Improvement Focus Areas
School Narrative Table:
School (Narrative)
Berkshrie Arts & Technology Charter
From Report Card
Charter School Type: Commonwealth
District Operating Status: Operating
District Title I Status: Title I District
High Quality College and Career Pathway designee:
Not Applicable
Mass District Type: Independent Public including Charters
Mission Statement: The Berkshire Arts and Technology Charter Public School (BART) prepares students for college by promoting mastery of academic skills and content with a strong foundation in arts and technology. The school provides middle and high school students in Berkshire County with an educational community that regards everyone, including teachers and parents, as lifelong learners.
School Year End Date (MM/DD):
06/15
School Year Start Date (MM/DD):
9/1
NCES ID: 2500079 Organization Description: BART Charter Public School prepares students for college by
promoting mastery of academic skills and content with a strong foundation in arts and technology.
From School Improvement Plan
• Self-improvement is encouraged by way of reflection
• BART students are required to conduct two student-led conferences each year
• As the budget permits and is in line with the School’s priorities, teachers are encouraged in their professional development and provided with additional opportunities to attend conferences and seminars to improve their teaching practice or deepen their content knowledge
• In all, teachers receive more than 100 hours of professional development each year
• Our focus was on building lessons that allowed for students to struggle productively and on helping teachers align their work to the new state test
• We continue to develop active learning environments throughout our school that facilitate learning on multiple levels—flexible/strategic grouping, small-group conferencing, presentation and discussion, Socratic seminar, peer/reciprocal teaching, and project-based learning
• The adoption of Canvas will greatly improve our ability to support our teachers, students, and their families in these uncertain times
• Supervisors continue to use the tools from the Massachusetts Model Evaluation System for improvement plans
From Website https://www.bartcharter.org/ School (Narrative)
Drury
From Report Card
MA School Type: Public School
NCES School Reconstituted:
No
Non-Chapter 74 Programs: Yes
School Title I Status: Non-Title I School (NT) NCES ID: 250867001387
From School Improvement Plan
• The first structural change was the grade-level reconfiguration of the district and the addition of the 7th grade to the school, creating a 7/8 team and a rebranded “middle school” approach in the form of the Drury 7/8 Academy
• The second structural change was the streamlining of the Instructional Leadership Team (ILT) from fifteen members to six members, with a revision of the team leader role to reflect a focus on leading collaborative time, instructional improvement, and data-driven decision making
• The third structural change was the addition of a rotating schedule with one 90-minute block per day, and this schedule evolved into a full 4x4 block schedule for the 2019-2020 school year
• The school leadership, in collaboration with the entire faculty, developed an Instructional Guide for use in all classes to establish consistency of expectations, pacing, and instructional strategies
• All teachers have been trained in the Harvard Data Wise cycle and the use of data has been incorporated into collaborative sessions in each department, where teacher teams began to analyze student data and use their conclusions to inform their daily lesson plans
• Prioritized improvements in school culture and climate, providing professional development in behavioral strategies
From Website https://dhs.napsk12.org/
School (Narrative)
Hoosac Valley Regional High School
From Report Card
MA School Type: Public School
NCES School Reconstituted:
No
School Title I Status: Non-Title I School (NT)
NCES ID: 250178000021
From School Improvement Plan
• The Hoosac Valley Regional School District promotes the learning and growth of all students by providing high-quality and coherent instruction, designing and administering authentic and meaningful student assessments, analyzing student performance and growth data, using this data to improve instruction, providing students
with constructive feedback on an ongoing basis, and continuously refining learning objectives
• The Hoosac Valley Regional School District promotes the learning and growth of all students through instructional practices that establish high expectations, create a safe and effective classroom environment, and demonstrate cultural proficiency
• The Hoosac Valley Regional School District promotes the learning and growth of all students through effective partnerships with families, caregivers, community members, and organizations
• The Hoosac Valley Regional School District promotes the learning and growth of all students through ethical, culturally proficient, skilled, and collaborative practice
From Website https://www.hoosacvalley.org/hvhs
School (Narrative)
Lee
From Report Card
MA School Type: Public School
NCES School Reconstituted:
No
Non-Chapter 74 Programs: Yes
School Title I Status: Non-Title I School (NT)
NCES ID: 250669000970
From School Improvement Plan
• Goal One: Improve performance levels on MCAS Math 7, Science 8, and HS Biology to meet or exceed the state average of students scoring meets/exceeds (or proficient and higher on legacy tests)
• Goal Two: Improve our 4-year cohort graduation rate to 90% or higher by the class of 2020
• Goal Three: Further refine our grading system to directly link competencies to state frameworks; develop grading norms for each curricular area; further define the role of summative vs. formative assessments in student grades; and bring daily relevance to our defined Soft Skills
• Goal Four: Continue to improve school climate by defining the long-term structure of the House System; and linking our R.E.A.C.H. behavioral expectations with the House model to embed them in the daily life of the school
From Website http://www.leepublicschools.net/
School (Narrative)
Lenox
From Report Card
MA School Type: Public School NCES School Reconstituted:
• LMMHS teachers will collaborate with administration on the implementation of TeachPoint, the computer-based evaluation database to guide instructional practice and to manage observations, teacher and staff evaluation documents, and deadlines in order to foster collaboration, manage growth and performance, and strengthen teacher and staff development
• LMMHS Administration and Leadership team will collaborate with students, faculty, and parents/guardians with a review of the LMMHS graduation requirements to redirect a better alignment with the state recommended MassCore and Federal Accountability requirements while developing a process to support students, faculty and parents to become more competent in providing career experience and a focus on pursuit of excellence
• The LMMHS Community will increase collaboration and pride by providing meaningful out-reach and recognition experiences through the focus on renewing the Athletic Hall of Fame and updating the banners in the gym
From Website https://www.lenoxps.org/lmmhs/
School (Narrative)
McCann Technical High School
From Report Card
Chapter 74 Programs: Yes
MA School Type: Public School
NCES School Reconstituted:
No
School Title I Status: Title I School (SW)
NCES ID: 250895002282 Organization Description: Charles H. McCann Technical School has been providing quality
technical training and an excellent academic education to students from our seven member communities for more than thirty-five years. We have an outstanding reputation throughout the Commonwealth, strong partnerships with numerous area employers, and a dedicated and caring faculty. Our dedication to your future is reflected in our state-of-the-art equipment, our well-maintained grounds and facilities, and our commitment to quality education and individual attention provided by a talented and diversified professional staff. With our students, parents, teachers, and professionals from local businesses and industry working towards one goal, McCann Technical School might be the right choice to prepare you for success in the new millennium.
From School Improvement Plan
• The mission of McCann Technical School is to graduate technically skilled, academically prepared, and socially responsible individuals ready to meet the challenges of the 21st century.
• To increase the use of data to help shape and drive school improvement efforts including performance on high-stakes tests.
• To implement new teacher evaluation methods.
• To improve school and community relations.
• To increase technological literacy and improve the use of technology in classrooms and shops.
• Goal 1: Develop a new school website and increase social media footprint
• Goal 2: Begin Social-Emotional Learning (SEL) program to help improve student behavior/performance
• Goal 3: Implement a newsletter to send to staff providing regular updates on news from around the building and student achievements
• Goal 4: Implement enhanced school safety measures
• Goal 5: Increase school spirit through increasing the availability of McCann apparel
• GOAL 6: Participate in a community service project
From Website https://www.mccanntech.org/
School (Narrative)
Monument Mountain Regional High School
From Report Card
Chapter 74 Programs: Yes
High Quality College and Career Pathway type:
Innovation Pathway
MA School Type: Public School
NCES School Reconstituted:
No
Non-Chapter 74 Programs: Yes
School Title I Status: Non-Title I School (NT)
NCES ID: 250253000154
From School Improvement Plan
• Goal One: Answer the question: What does Monument Mountain high school graduate need to know and do to receive a MMRHS diploma? Use this to develop school wide proficiencies and assess current alignment of curriculum and assessment to these newly developed proficiencies
• Rationale: Improve equity of outcomes for each Monument graduate, there must be a clearly articulated vision for a guaranteed core experience for each student with multiple opportunities to demonstrate mastery of the academics, skills and mindsets necessary for success
• Goal Two: Develop teacher leadership and strong professional learning culture that will support ongoing reflection and improved instructional practices leading to improvement of student outcomes
• Rationale: Strong professional culture enables teachers to regularly share their practice, in order to give and receive feedback
that is based on a shared understanding of effective teaching, learning goals, and student needs in order to improve student learning and outcomes for all students
• Goal Three: Through improved communication and outreach, develop community engagement with school initiatives to improve outcomes for each student
• Rationale: Understanding and data-gathering must be a collaborative, shared process that honors the voices of those most impacted by the school itself: the students and the community. Conversations with students and community members can push school teams to design models that are responsive to a diverse student body. Student portraits are, in a way, a compact between the school and the community, indicative of a thrilling partnership
• Vision: Providing a rigorous educational environment that prepares and inspires all student to be resilient, curious, and ethical global citizens
• Goal One: Ensure that students have a variety of pathways to graduation that are based on student passions and interests
• Goal Two: Ensure that every student has the skills necessary to navigate their day from a social-emotional standpoint
• Goal Three: Ensure that the district provides all middle school students access to a demanding and rigorous academic program
From Website https://sbrsd.org/mount-everett
School (Narrative)
Mt. Greylock Regional High School
From Report Card
MA School Type: Public School
NCES School Reconstituted:
No
School Title I Status: Non-Title I School (NT)
NCES ID: 250816001273
From School Improvement Plan
• GOAL 1: SOCIAL AND EMOTIONAL LEARNING: OBJECTIVE: Using SEL Curriculum and Instruction, develop district wide practices and policies to support students in developing the tools to navigate the
Five Core Competencies of SEL. Self-management, Self-awareness, Social-awareness, Relationship skills and Responsible decision-making
• GOAL 2: Curriculum, Instruction and Technology: Develop and vertically and horizontally align curriculum to the new and revised state standards PreK-12: OBJECTIVE: Develop and align curriculum to meet the Massachusetts Standards while refining instruction and assessment to integrate digital technology
• GOAL 3: Regional Alignment: OBJECTIVE: To complete all necessary items as outlined in the 2017 transition plan for DESE to be a comprehensive region Prek-12
From Website https://www.wlschools.org/page.cfm?p=513
School (Narrative)
Pittsfield High School
From Report Card
MA School Type: Public School
NCES School Reconstituted:
No
Non-Chapter 74 Programs: Yes
School Title I Status: Non-Title I School (NT)
NCES ID: 250963001526 Organization Description: Pittsfield High School, in
central Pittsfield, offers an extensive college preparatory, business and technical-vocational program to 966 students. With programs in the Fine and Performing Arts, Business & Management Studies, Science & Engineering Academy, and general Liberal Arts, PHS also offers access to the third-largest AP program in the state.
From School Improvement Plan
• Standard I: Curriculum, Planning, and Assessment. The teacher promotes the learning and growth of all students by providing high- quality and coherent instruction, designing and administering authentic and meaningful student assessments, analyzing student performance and growth data, using this data to improve instruction, providing students with constructive feedback on an ongoing basis, and continuously refining learning objectives.
• Standard II: Teaching All Students. The teacher promotes the learning and growth of all students through instructional practices that establish high expectations, create a safe and effective classroom environment, and demonstrate cultural proficiency.
• Standard III: Family and Community Engagement. The teacher promotes the learning and growth of all students through effective partnerships with families, caregivers, community members, and organizations.
• Standard IV: Professional Culture. The teacher promotes the learning and growth of all students through ethical, culturally proficient, skilled, and collaborative practice.
From Website http://pittsfieldhigh.pittsfield.net/
School (Narrative)
Taconic High School
From Report Card
Chapter 74 Programs:
Yes
MA School Type: Public School
NCES School Reconstituted:
No
School Title I Status: Non-Title I School (NT)
NCES ID: 250963001534 Organization Description:
Taconic High School, in west Pittsfield, offers an extensive college preparatory, business, and technical-vocational program to 845 students. With programs in Math, Science and Technology, Allied Health, Architecture and Engineering, Finance, and Information Technology, Taconic also offers access to the third-largest AP program in the state.
From School Improvement Plan
• Collective, distributed leadership structures and practices are apparent throughout the school building in the form of an active, well-represented instructional leadership team and grade-level and vertical teams. Administrators and teachers are jointly
committed to and have assumed shared ownership and collective responsibility for improving student achievement.
• School leadership has identified a clear instructional focus and shared expectations for instructional best practices that address clearly identified, student-specific instructional needs.
• Teachers use and analyze a variety of student-specific data to assess the effectiveness of their instructional strategies and practices and modify instruction to meet their students’ needs as identified.
• Administrators and teachers use a variety of ongoing assessments (formative, benchmark, and summative) to frequently and continually assess instructional effectiveness and to identify students’ individual academic needs (e.g., content or standard-specific academic needs) in order to provide student-specific interventions, enrichment, and supports.
• Administrators and teachers have clearly established and actively reinforce a set of behavioral expectations and practices that supports students’ learning and efforts to increase student achievement.
• A climate of respectful collegial communication, relationships, and leadership has been established by leadership, teacher leaders, and teachers, thus allowing for a positive, productive, and collective effort to increase family engagement and student achievement throughout the school.
From Website http://taconic.pittsfield.net/ School (Narrative)
Wahconah Regional High School
From Report Card
MA School Type: Public School
NCES School Reconstituted:
No
Non-Chapter 74 Programs: Yes
School Title I Status: Title I School (SW) NCES ID: 250339000467
From School Improvement Plan
• Goal One: To engage teaching staff in reflective practices in order to close achievement gaps on high stakes assessments
• The focus areas of this goal are instructional coaching, instructional rounds, AP teacher support from Mass Insight, AP teacher support from College Board
• Goal Two: To meet or exceed all learning targets for student achievement on the 2020 MCA
• The focus areas of this goal are the next gen bio assessment, student practice for MCAS, benchmarking in MCAS class, learning walkthroughs in MCAS classes
• Goal Three: To implement positive behavior and social/emotional supports for students and staff
• The action on this goal is SEL ACTION PLAN: Equity/Diversity, World of Difference, SPIRIT, PBIS/Restorative Practices regarding Vaping, SAFETY: Stop the Bleed Training
From Website http://cbrsdwahconah.ss10.sharpschool.com/