23
Jonathan Weiss Senior Executive Vice President May 10, 2018 © 2018 Wells Fargo & Company. All rights reserved. Wealth & Investment Management

Jonathan Weiss
Senior Executive Vice President
May 10, 2018
© 2018 Wells Fargo & Company. All rights reserved.
Wealth & Investment
Management
Wealth & Investment Management 1 Wells Fargo 2018 Investor Day
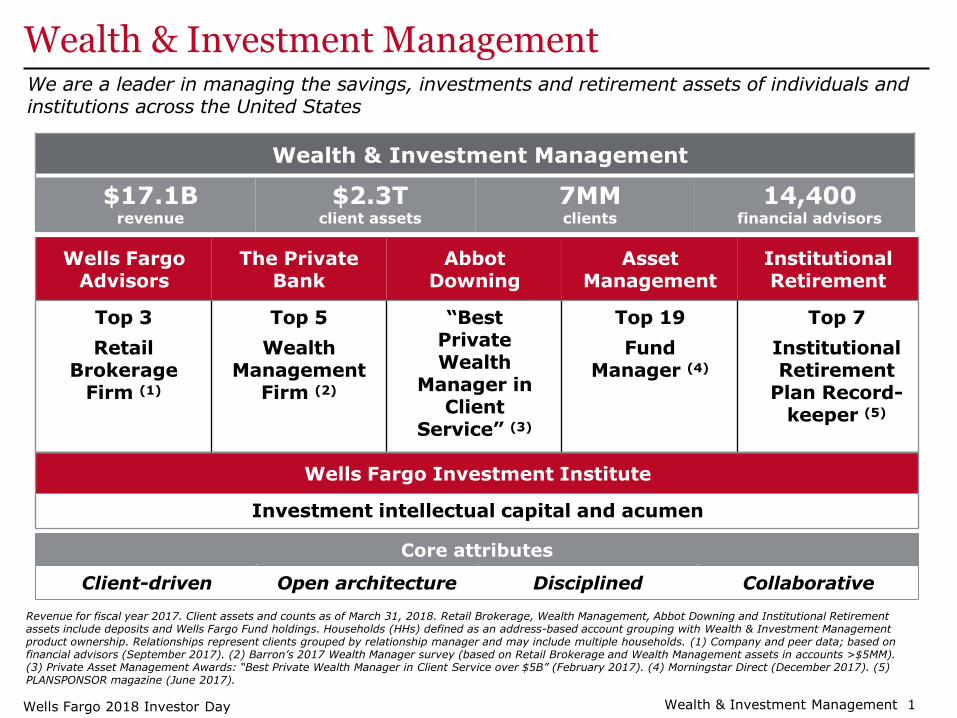
Wealth & Investment Management We are a leader in managing the savings, investments and retirement assets of individuals and institutions across the United States
Revenue for fiscal year 2017. Client assets and counts as of March 31, 2018. Retail Brokerage, Wealth Management, Abbot Downing and Institutional Retirement assets include deposits and Wells Fargo Fund holdings. Households (HHs) defined as an address-based account grouping with Wealth & Investment Management product ownership. Relationships represent clients grouped by relationship manager and may include multiple households. (1) Company and peer data; based on financial advisors (September 2017). (2) Barron’s 2017 Wealth Manager survey (based on Retail Brokerage and Wealth Management assets in accounts >$5MM). (3) Private Asset Management Awards: “Best Private Wealth Manager in Client Service over $5B” (February 2017). (4) Morningstar Direct (December 2017). (5) PLANSPONSOR magazine (June 2017).
Wells Fargo Advisors
The Private Bank
Abbot Downing
Asset Management
Institutional Retirement
Top 3
Retail Brokerage
Firm (1)
Top 5
Wealth Management
Firm (2)
“Best Private Wealth
Manager in Client
Service” (3)
Top 19
Fund Manager (4)
Top 7
Institutional Retirement
Plan Record-keeper (5)
Wells Fargo Investment Institute
Investment intellectual capital and acumen
Core attributes
Client-driven Open architecture Disciplined Collaborative
Wealth & Investment Management
$17.1B revenue
$2.3T
client assets
7MM
clients
14,400
financial advisors
Wealth & Investment Management 2 Wells Fargo 2018 Investor Day
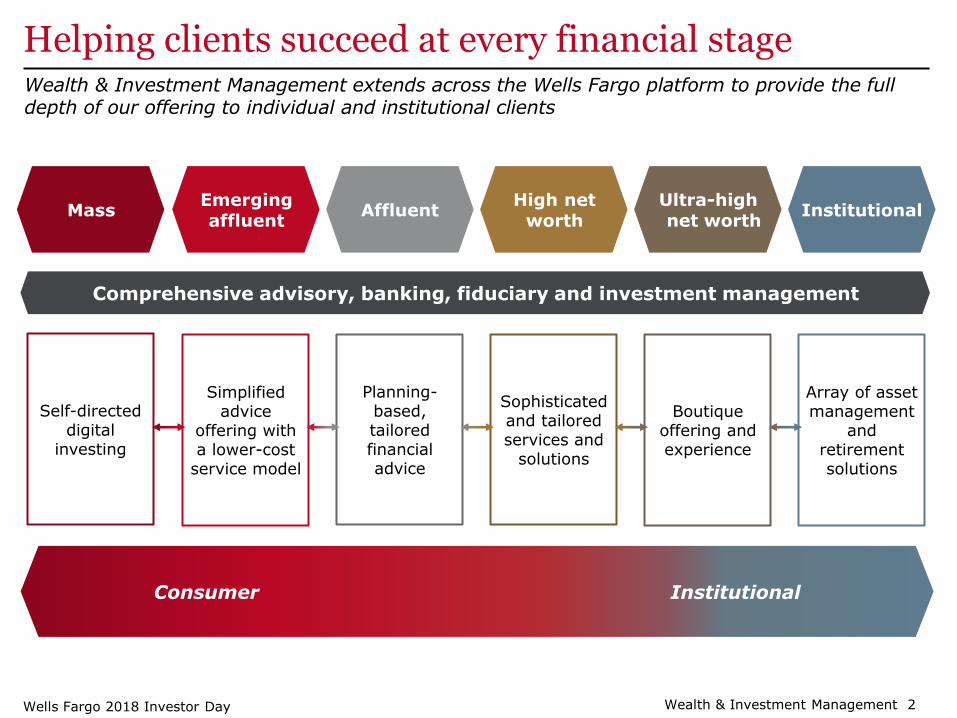
Helping clients succeed at every financial stage
Comprehensive advisory, banking, fiduciary and investment management
Wealth & Investment Management extends across the Wells Fargo platform to provide the full depth of our offering to individual and institutional clients
Emerging affluent
Simplified advice
offering with a lower-cost
service model
Affluent
Planning-based, tailored financial advice
High net worth
Sophisticated and tailored services and
solutions
Ultra-high net worth
Boutique offering and experience
Institutional
Array of asset management
and retirement solutions
Consumer Institutional
Mass
Self-directed digital
investing
Wealth & Investment Management 3 Wells Fargo 2018 Investor Day
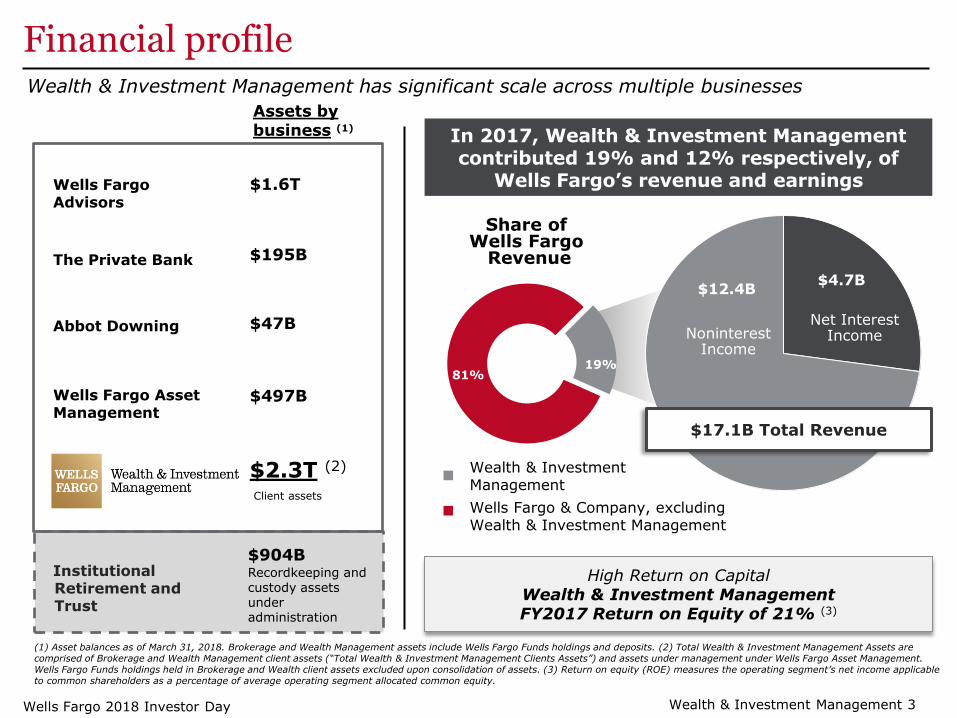
$4.7B $12.4B
81% 19%
Assets by business (1)
Wells Fargo Advisors
$1.6T
The Private Bank
$195B
Abbot Downing
$47B
Wells Fargo Asset Management
$497B
$2.3T (2)
Client assets
Institutional Retirement and Trust
$904B
Recordkeeping and custody assets under administration
Financial profile
Share of Wells Fargo
Revenue
Noninterest Income
Net Interest Income
$17.1B Total Revenue
In 2017, Wealth & Investment Management contributed 19% and 12% respectively, of
Wells Fargo’s revenue and earnings
(1) Asset balances as of March 31, 2018. Brokerage and Wealth Management assets include Wells Fargo Funds holdings and deposits. (2) Total Wealth & Investment Management Assets are comprised of Brokerage and Wealth Management client assets (“Total Wealth & Investment Management Clients Assets”) and assets under management under Wells Fargo Asset Management. Wells Fargo Funds holdings held in Brokerage and Wealth client assets excluded upon consolidation of assets. (3) Return on equity (ROE) measures the operating segment’s net income applicable to common shareholders as a percentage of average operating segment allocated common equity.
Wealth & Investment Management has significant scale across multiple businesses
Wells Fargo & Company, excluding Wealth & Investment Management
Wealth & Investment Management
High Return on Capital Wealth & Investment Management FY2017 Return on Equity of 21% (3)
Wealth & Investment Management 4 Wells Fargo 2018 Investor Day
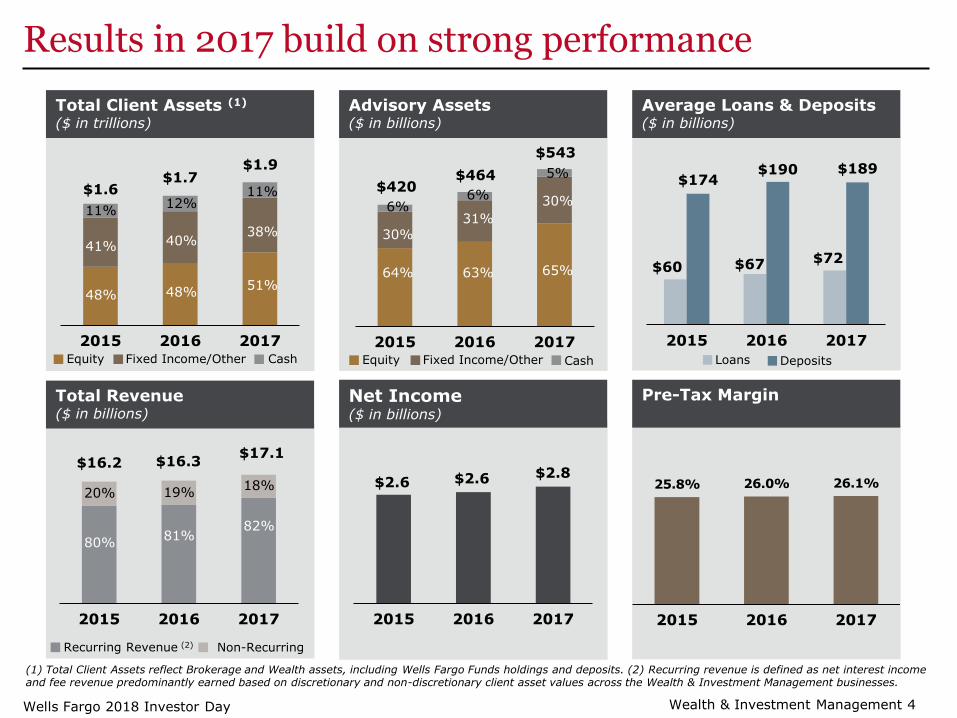
Results in 2017 build on strong performance
$60 $67 $72
$174 $190 $189
2015 2016 2017
Deposits Loans
2015 2016 2017
25.8% 26.0% 26.1%
2015 2016 2017
2015 2016 2017
2015 2016 2017
$16.2 $16.3 $17.1
Non-Recurring Recurring Revenue (2)
(1) Total Client Assets reflect Brokerage and Wealth assets, including Wells Fargo Funds holdings and deposits. (2) Recurring revenue is defined as net interest income and fee revenue predominantly earned based on discretionary and non-discretionary client asset values across the Wealth & Investment Management businesses.
Equity
$1.6 $1.7
$1.9
48% 48% 51%
41% 40% 38%
11% 12%
11%
$2.6 $2.6 $2.8
2015 2016 2017
Fixed Income/Other Cash
$420 $464
$543
64% 63% 65%
30% 31%
30% 6% 6%
5%
Equity Fixed Income/Other Cash
80% 81%
82%
20% 19% 18%
Average Loans & Deposits ($ in billions)
Advisory Assets ($ in billions)
Total Client Assets (1)
($ in trillions)
Total Revenue
($ in billions)
Pre-Tax Margin Net Income
($ in billions)

Wealth & Investment Management 5 Wells Fargo 2018 Investor Day
Other Direct Expenses FA Commissions
Other Indirect Expenses
Operating efficiently
2015 2016 2017
$1.6 $1.7 $1.9
$3.5 $3.4 $3.6
$6.9 $7.0 $7.1
($ in billions)
$12.0 $12.1 $12.6 Strong track
record of expense discipline
Commission expense consistent with sales revenue growth
Indirect expenses include Enterprise Regulatory and Compliance spend
Expense discipline is a key component of how we achieve financial targets and fund investments in the business

Capturing Strategic
Opportunities

Wealth & Investment Management 7 Wells Fargo 2018 Investor Day
Addressing a changing landscape Wealth & Investment Management is adopting strategies to meet the varied and changing expectations of our clients and to drive profitable growth
Demographics
Technology
Competition
Regulation
Drivers Client expectations Strategies
Professional, tailored advice when, where and how the client wants it
Segment differentiation
Expanded delivery and distribution
Workforce evolution
Simple, intuitive and innovative experiences
Online investing capabilities + expert advice
Simplified integrated digital experiences
Efficiency through automation and shared platforms
World-class service and value that reflects a deep knowledge of client goals and aspirations
Investment thought leadership
Scale and reach in distribution
Data and insights capabilities
Transparency, security and trust
Alignment of client needs and services
Real-time information and client service
Risk standards, processes and governance

Wealth & Investment Management 8 Wells Fargo 2018 Investor Day
An integrated offering tailored to the client Goals-based planning is the first step in achieving client goals and performance outcomes
Assess
Document
Discover
Financial position
Family dynamics
Attitudes
Values
Life events
Understand client goals
Develop and implement a plan to drive to desired outcomes
Engage investment, wealth and banking professionals based on client’s needs
Provide best-in-class service
Banking
Brokerage
Lending
Wealth
Management
Retirement
Investments
Fiduciary
Services
Commercial Banking
M&A
Equity Capital Markets
Community Banking
Cards
Mortgage
Auto
Behaviors
Goals
Financial needs
Review Advise
Wealth & Investment Management 9 Wells Fargo 2018 Investor Day
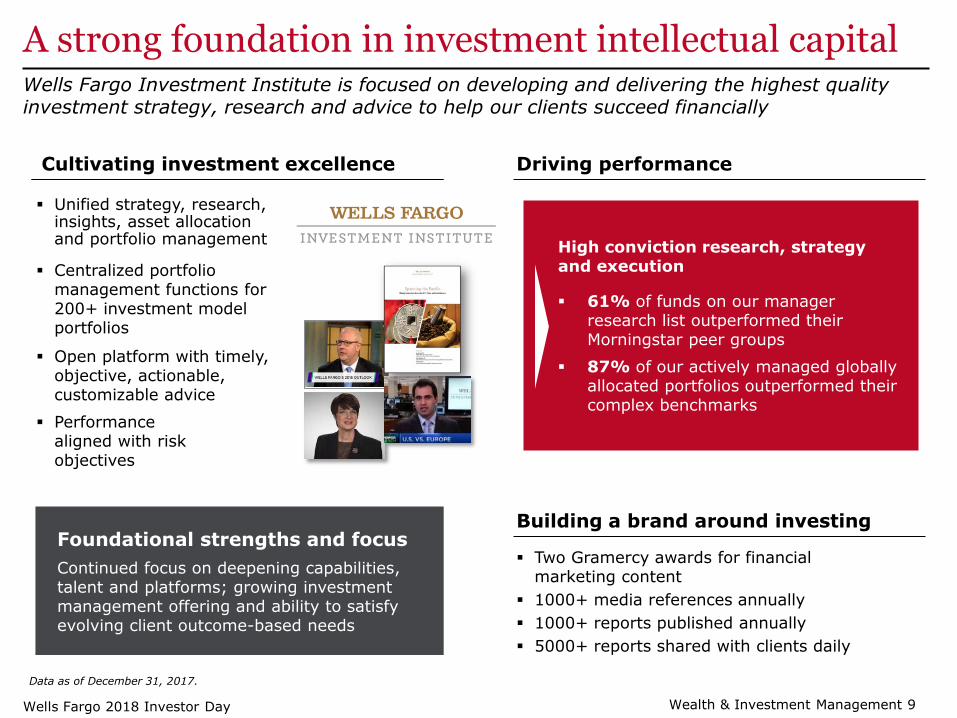
Unified strategy, research, insights, asset allocation and portfolio management
Centralized portfolio management functions for 200+ investment model portfolios
Performance aligned with risk objectives
Open platform with timely, objective, actionable, customizable advice
Building a brand around investing
Two Gramercy awards for financial marketing content
1000+ media references annually
1000+ reports published annually
5000+ reports shared with clients daily
Foundational strengths and focus
Continued focus on deepening capabilities, talent and platforms; growing investment management offering and ability to satisfy evolving client outcome-based needs
A strong foundation in investment intellectual capital Wells Fargo Investment Institute is focused on developing and delivering the highest quality investment strategy, research and advice to help our clients succeed financially
Data as of December 31, 2017.
Cultivating investment excellence Driving performance
High conviction research, strategy and execution
61% of funds on our manager research list outperformed their Morningstar peer groups
87% of our actively managed globally allocated portfolios outperformed their complex benchmarks

Wealth & Investment Management 10 Wells Fargo 2018 Investor Day
Loyalty: Better client service and advice leads to more loyal clients
Plan: Planning leads to more confident clients
Perform: Better returns for well- allocated portfolios aligned to investment objectives and risk tolerances (2)
Advancing our brokerage model… We continue to focus on advice and planning capabilities to deliver better outcomes and experiences for all of our clients
Business focus Outcomes
Delivering on client standards
Best practices around advice and service for clients that result in better outcomes and higher levels of satisfaction and loyalty
Envision®
Plan-to-Pie®
Enhancing digital capabilities: planning, advice, documentation and client reviews
Focus on professional investment advice and discretionary solutions from the Wells Fargo Investment Institute
Client standards
(1) 2017 Client Listening Program. (2) The definition of well-allocated is a measure of how closely a client’s actual asset allocation aligns with his/her strategic asset allocation; being well-allocated increases the probability of a client achieving his/her investment goals. (3) Outperformance is the difference between the 1 year return of the well-allocated accounts net of fees, versus the 1 year return of the not well-allocated accounts net of fees, measured as of December 2017.
Building on core foundational capabilities
of clients with a plan feel they have the guidance necessary to succeed financially (1)
of clients report being loyal to Wells Fargo Advisors (1)
88%
91%
Affluent High net worth
Emerging affluent
Mass
+230 bps (3)
Well-Allocated Not Well-Allocated

Wealth & Investment Management 11 Wells Fargo 2018 Investor Day
…and our delivery channels
New business models New advisor programs
Our long-term “robo” strategy to deliver scalable digital investment + human advice
Launched Intuitive Investor® in 4Q17
62% Gen X, Y or Z
Attracting the clients we are designing for (1)
74% New to Wells Fargo Advisors 80%
Existing Community Bank customers
Customers with Wells Fargo for 7+ years
+15% CAGR
2018 (forecast)
2015
Increasing next generation talent (2)
Next generation Financial Advisors are female
More diversity among our next generation advisors (3)
Next generation Financial Advisors are ethnically diverse
Associate Financial Advisors
Serving affluent and high net worth
clients, where a junior Financial Advisor
is mentored in a best practices team
Financial Relationship Advisors
Serving emerging affluent clients by a
salary / bonus advisor with a more
prescriptive service and advice offering
Digital Financial Relationship Advisors
Serving mass market clients with
Intuitive Investor® with access to phone-
based advice
We are focused on attracting next generation investors and adding new, next generation talent to our existing force of financial advisors
Average age of a next generation Financial Advisor
32
Data as of March 2018. (1) Wealth & Investment Management Analytics. (2) Wells Fargo Advisors Finance. (3) Wells Fargo Advisors Next Generation Talent Programs.
72% 48% 36%
Emerging affluent
Affluent Mass
Wealth & Investment Management 12 Wells Fargo 2018 Investor Day
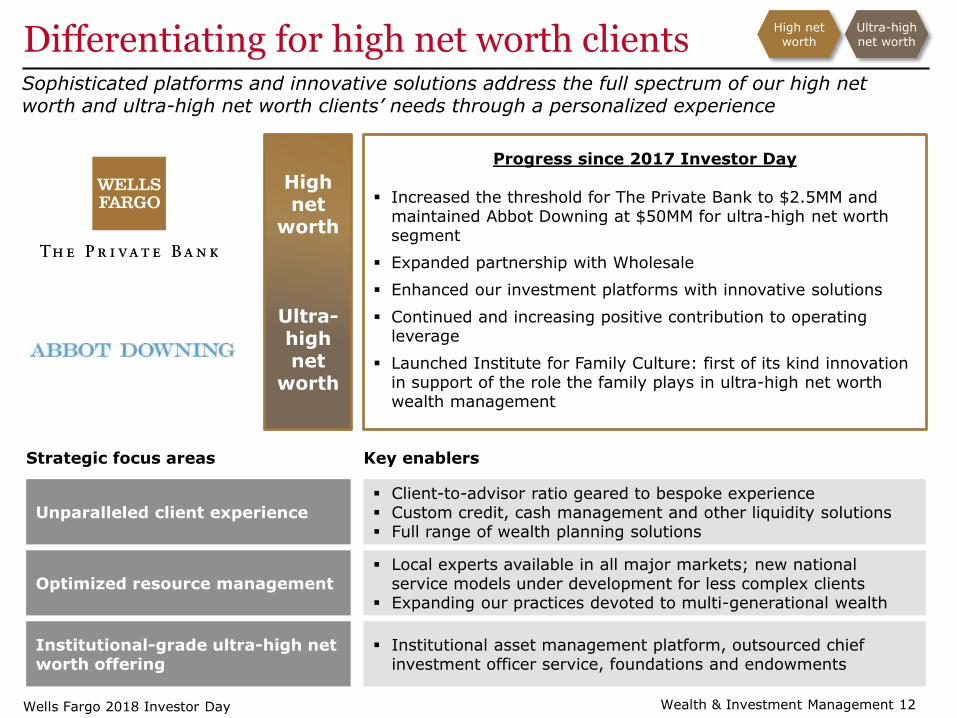
Strategic focus areas Key enablers
Unparalleled client experience
Optimized resource management
Client-to-advisor ratio geared to bespoke experience Custom credit, cash management and other liquidity solutions Full range of wealth planning solutions
Local experts available in all major markets; new national service models under development for less complex clients
Expanding our practices devoted to multi-generational wealth
High net
worth
Ultra-high net
worth
Progress since 2017 Investor Day
Increased the threshold for The Private Bank to $2.5MM and maintained Abbot Downing at $50MM for ultra-high net worth segment
Expanded partnership with Wholesale
Enhanced our investment platforms with innovative solutions
Continued and increasing positive contribution to operating leverage
Launched Institute for Family Culture: first of its kind innovation in support of the role the family plays in ultra-high net worth wealth management
Institutional-grade ultra-high net worth offering
Institutional asset management platform, outsourced chief investment officer service, foundations and endowments
Differentiating for high net worth clients Sophisticated platforms and innovative solutions address the full spectrum of our high net worth and ultra-high net worth clients’ needs through a personalized experience
High net worth
Ultra-high net worth
Wealth & Investment Management 13 Wells Fargo 2018 Investor Day
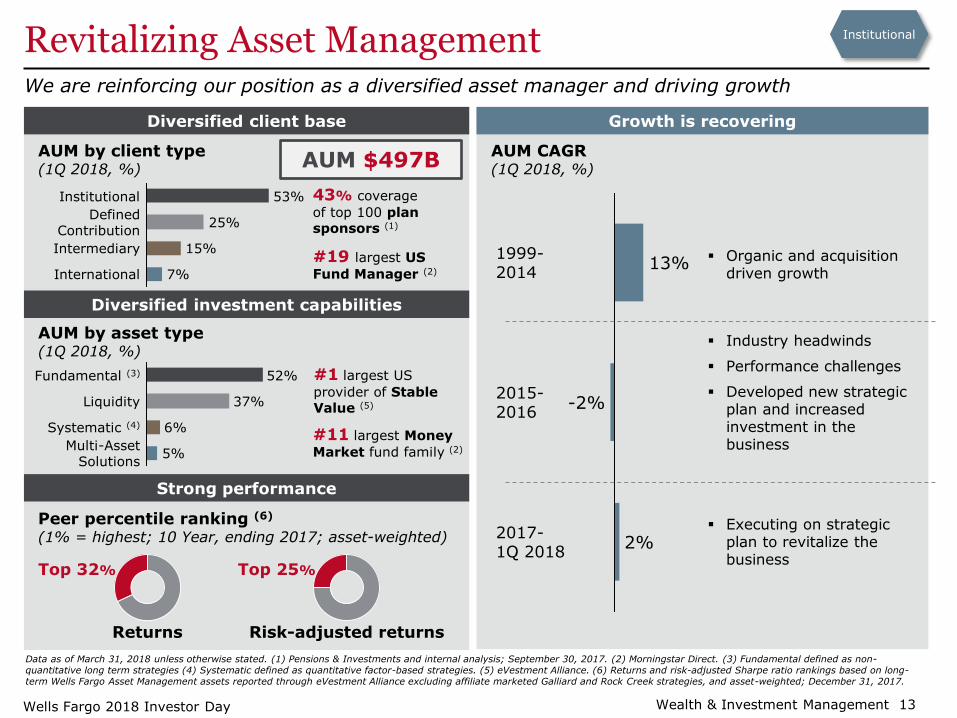
Revitalizing Asset Management We are reinforcing our position as a diversified asset manager and driving growth
Diversified client base
Diversified investment capabilities
Growth is recovering
AUM by asset type (1Q 2018, %)
-2%
1999- 2014
13%
2017- 1Q 2018
2%
2015- 2016
Organic and acquisition driven growth
Industry headwinds
Performance challenges
Developed new strategic plan and increased investment in the business
Executing on strategic plan to revitalize the business
Data as of March 31, 2018 unless otherwise stated. (1) Pensions & Investments and internal analysis; September 30, 2017. (2) Morningstar Direct. (3) Fundamental defined as non-quantitative long term strategies (4) Systematic defined as quantitative factor-based strategies. (5) eVestment Alliance. (6) Returns and risk-adjusted Sharpe ratio rankings based on long-term Wells Fargo Asset Management assets reported through eVestment Alliance excluding affiliate marketed Galliard and Rock Creek strategies, and asset-weighted; December 31, 2017.
Institutional
AUM CAGR (1Q 2018, %)
Top 25% Top 32%
Returns Risk-adjusted returns
Strong performance
#11 largest Money
Market fund family (2)
#1 largest US
provider of Stable Value (5)
6%
Fundamental (3) 52%
Multi-Asset Solutions
5%
Systematic (4)
Liquidity 37%
Peer percentile ranking (6) (1% = highest; 10 Year, ending 2017; asset-weighted)
43% coverage
of top 100 plan sponsors (1)
#19 largest US
Fund Manager (2)
AUM $497B
Defined Contribution
Intermediary 15%
International 7%
53% Institutional
25%
AUM by client type (1Q 2018, %)

Wealth & Investment Management 14 Wells Fargo 2018 Investor Day
Client service & delivery
Investment capabilities
Client outcomes & performance
Performance, capabilities and service We are investing significantly in the business
Areas of long-term focus Progress since 2017 Investor Day
3Y 5Y 10Y
Reorganized distribution channels
Hired 10+ new sales professionals
Collaborate across Wells Fargo
lines of business
Align distribution more
effectively with client needs
Enhanced client experience
Develop additional investment
capabilities in:
- Multi-Asset Solutions
- Systematic
- Alternatives & Private Markets
Launched 12 new product strategies
Created largest industry factor-based
target date series
Hired 40+ new professionals
Centralized Fixed Income research
Began utilizing quantitative and
machine learning analytics
Refreshed 50%+ of our multi-asset
lineup
Continually improve on the consistency and strength of client outcomes
(1) Risk-adjusted Sharpe ratio rankings based on long-term Wells Fargo Asset Management assets reported through eVestment Alliance excluding affiliate marketed Galliard and Rock Creek strategies, and asset-weighted; December 31, 2017.
Institutional
Peer risk-adjusted percentile ranking (1)
(1% = highest, ending 2017; asset-weighted)
Top 38% Top 35% Top 25%

Wealth & Investment Management 15 Wells Fargo 2018 Investor Day
730 740 790 895 904
2014 2015 2016 2017 1Q
2018
Meeting clients’ retirement needs We are broadening our institutional retirement offerings, advice solutions and digital services to create lifelong Wells Fargo relationships
Participant and asset growth
(1) PLANSPONSOR magazine (June 2017, June 2016, May 2016). (2) Wells Fargo Institutional Retirement and Trust’s 2017 Driving Plan Health report.
Thought leadership and innovation
Partnerships and distribution
Target My Retirement brings personalized, cutting-edge investment strategies at a competitive price
Proprietary research enabled a 42% increase in Wells Fargo's Plan Health Index over the last 5 years (2)
Employing Local Market Approach
Exploring additional innovations with Wells Fargo Asset Management
Increasing Wholesale Bank coverage
Institutional Retirement
Defined Contribution Recordkeeper (1)
Defined Benefit Provider (1)
Executive Benefit Provider (1)
#7
#9
#5
Mission Help America’s diverse workforce prepare for a better retirement
Vision Be the trusted advisor to improve financial health from the first day of work through retirement
Recordkeeping and custody assets ($B)
3.8 4.0 4.1 4.2 4.3
2014 2015 2016 2017 1Q
2018
Year-end plan participant counts (MM)
Institutional
Wealth & Investment Management 16 Wells Fargo 2018 Investor Day
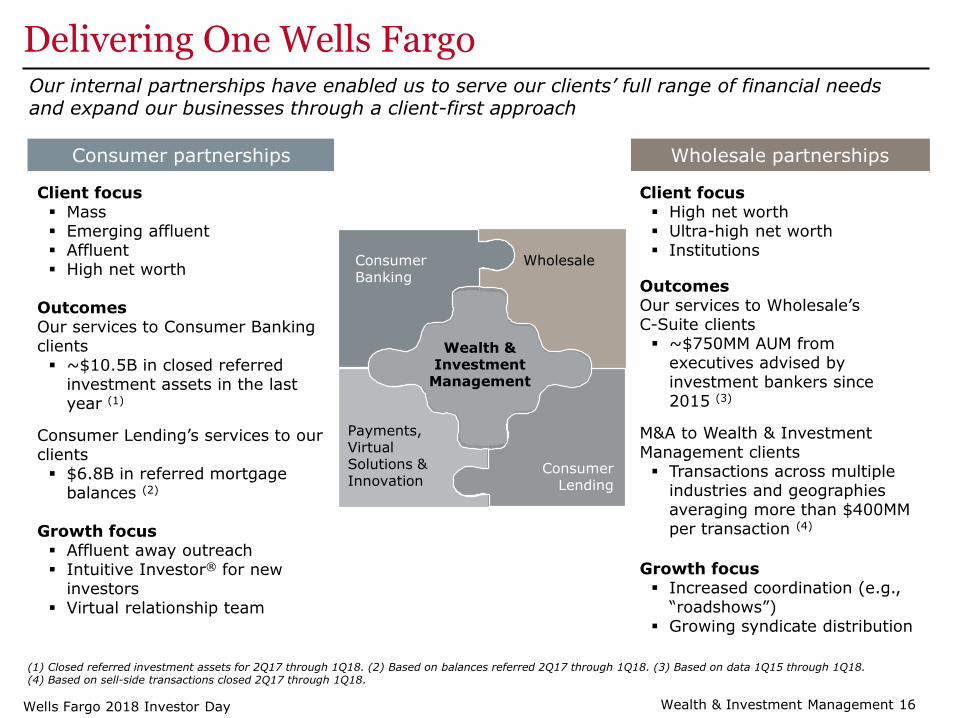
Our internal partnerships have enabled us to serve our clients’ full range of financial needs and expand our businesses through a client-first approach
(1) Closed referred investment assets for 2Q17 through 1Q18. (2) Based on balances referred 2Q17 through 1Q18. (3) Based on data 1Q15 through 1Q18. (4) Based on sell-side transactions closed 2Q17 through 1Q18.
Consumer partnerships Wholesale partnerships
Client focus Mass Emerging affluent Affluent High net worth
Outcomes Our services to Consumer Banking clients ~$10.5B in closed referred
investment assets in the last year (1)
Consumer Lending’s services to our clients $6.8B in referred mortgage
balances (2)
Growth focus Affluent away outreach Intuitive Investor® for new
investors Virtual relationship team
Client focus High net worth Ultra-high net worth Institutions
Outcomes Our services to Wholesale’s C-Suite clients ~$750MM AUM from
executives advised by investment bankers since 2015 (3)
M&A to Wealth & Investment Management clients Transactions across multiple
industries and geographies averaging more than $400MM per transaction (4)
Growth focus Increased coordination (e.g.,
“roadshows”) Growing syndicate distribution
Wealth & Investment
Management
Consumer Banking
Payments, Virtual Solutions & Innovation
Consumer Lending
Wholesale
Delivering One Wells Fargo

Wealth & Investment Management 17 Wells Fargo 2018 Investor Day
Investing in the future We are leveraging digital to enrich client relationships, focus our team members on highest value activities, and improve the efficiency/efficacy of our foundational systems and processes
Envision “what if” scenario planning
for clients
Mobile text messaging for clients
Secure cloud-based document
sharing
Personalized experience based on Predictive Insights
Enhancing our digital “baseline”
Expanded digital money management
Reimagined delivery of Asset Management solutions
Building new experiences
Modernized cross-platform capabilities, platforms and processes
Dashboard for 401(k) plan participants
Positioning for efficiency
and growth

Wealth & Investment Management 19 Wells Fargo 2018 Investor Day
Driving transformation and cost savings
Reimagining our business and reshaping delivery
Optimizing businesses based on client segmentation - $400MM
Driving operational efficiencies through Business Process Management and robotics, offshoring expansion and client self service - $60MM
Creating centralized “utilities” to be leveraged across the business while reducing reliance on third parties (e.g., project management, other operations) - $120MM
Other opportunities - $20MM
Example: Optimizing businesses based on client segmentation - $400MM
Driving better coordination and client service across our businesses through improved operating alignment:
- Optimizing field management structure, operations and infrastructure
- Enhancing our service to client segments
- Improving field risk supervision and business development processes
- Enhancing segment-led value propositions
- Better leveraging support partners
Targeting run rate savings of ~$600 million by 2020

Wealth & Investment Management 20 Wells Fargo 2018 Investor Day
Continued progress towards long-term targets
26%
5% Revenue Growth
Pretax Margin
82% Recurring
Revenue (1)
30%
4-6%
80%+
2017 Results
Long-Term Targets
21% Return on Equity (2) 25%+
(1) Recurring revenue is defined as net interest income and fee revenue predominantly earned based on discretionary and non-discretionary client asset values across the Wealth & Investment Management businesses.(2) Return on equity (ROE) measures the operating segment’s net income applicable to common shareholders as a percentage of average operating segment allocated common equity.

Biography

Wealth & Investment Management 22 Wells Fargo 2018 Investor Day
Jonathan Weiss Senior Executive Vice President
Wealth & Investment Management
Jon started his career with Wells Fargo in 2005. Beginning in 2014, he served as president and head of Wells Fargo Securities (WFS). From 2008 to 2014, he was co-head of the Wells Fargo Securities Investment Banking & Capital Markets division.
Before joining Wells Fargo, Jon spent 25 years at J.P. Morgan (and its predecessors) in various roles — including head of JPM’s global financial sponsor business and head of investment banking in Asia Pacific for Chase, where he was based in Hong Kong. Jon’s early career at Chemical Bank included roles in the retail industries and loan syndications and acquisition finance groups, and he was assistant representative in Chemical Bank’s Mexico City office.
Jon earned his B.A. in Romance Languages from Princeton University. He serves on the national advisory board of Youth, I.N.C., a nonprofit based in New York City, and on the boards of One Goal‒New York and the Lawrenceville School in Lawrenceville, New Jersey. He also serves as a trustee of the National Humanities Center in Durham, North Carolina. He is based in New York City.


