42
© 2009 Weatherford. All rights reserved. Weatherford International Ltd. Howard Weil 37th Annual Energy Conference March 24, 2009

© 2009 Weatherford. All rights reserved.
Weatherford International Ltd.
Howard Weil 37th Annual Energy Conference
March 24, 2009
© 2009 Weatherford. All rights reserved. 2Full year 2008
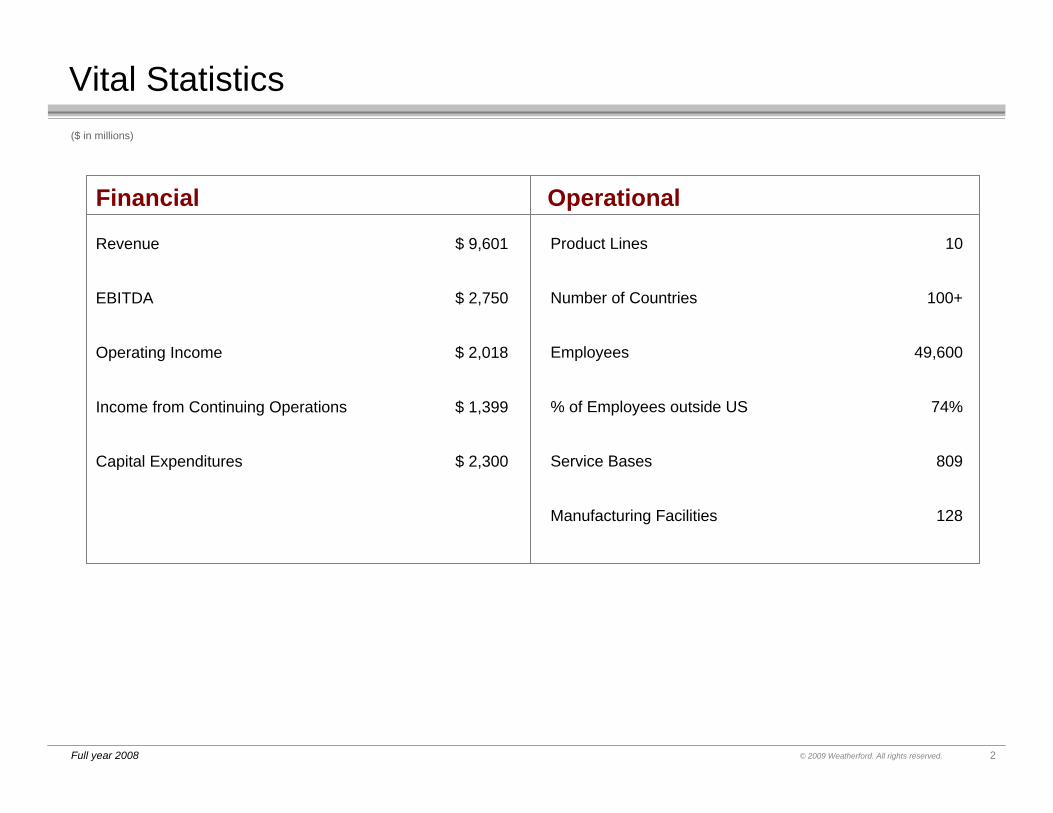
Revenue $ 9,601
EBITDA $ 2,750
Operating Income $ 2,018
Income from Continuing Operations $ 1,399
Capital Expenditures $ 2,300
Vital Statistics
Financial Operational
Product Lines 10
Number of Countries 100+
Employees 49,600
% of Employees outside US 74%
Service Bases 809
Manufacturing Facilities 128
($ in millions)
© 2009 Weatherford. All rights reserved. 3
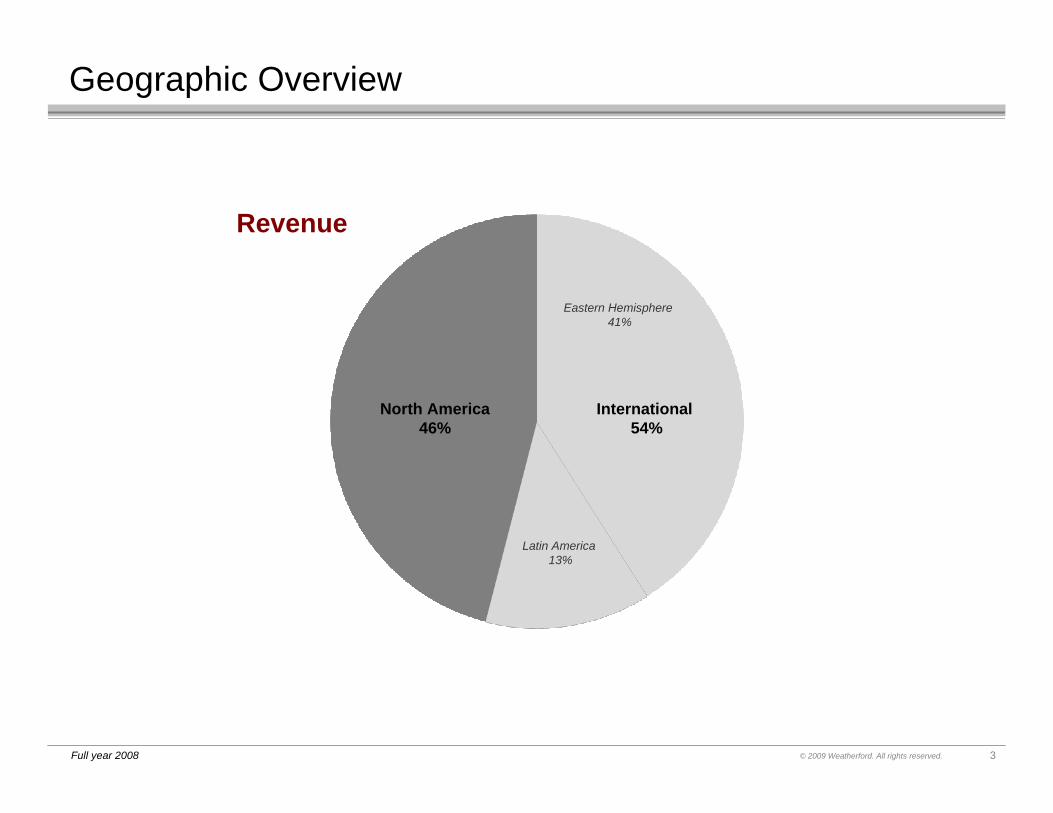
Revenue
International 54%
North America46%
Geographic Overview
Eastern Hemisphere 41%
Latin America 13%
Full year 2008

© 2009 Weatherford. All rights reserved. 4
Drilling Services
Directional Drilling
MWD
LWD
Rotary Steerable
Underbalanced
Managed Pressure
Coiled Tubing Drilling
Drilling with Casing
Wireline
Open Hole Wireline
Geoscience
Surface Logging
Core Evaluation
Cased Hole Wireline
Slickline
Well Construction
Tubular Running
Cementation
Liner Hangers
Inflatables
Expandable Solids
Re-entry & Fishing
Casing Exit
Fishing
Thru-Tubing
Drilling Tools
Drilling Products
Rentals
Integrated Drilling
Contract Drilling
Integrated Management
Completion
Completion Tools
Sand Screens
Expandable Screens
Intelligent Completion
Fiber Optic Sensing
Field Optimization
Stimulation & Chemicals
Fracturing Services
Production Chemicals
Coiled Tubing
Pipeline & Specialty Services
Pre-commissioning
Inspection
Artificial Lift
Progressing Cavity
Reciprocating
Gas Lift
Hydraulic
Electric Submersible
Lift Optimization
Ten Service Lines – Breadth

© 2009 Weatherford. All rights reserved. 5Based on revenues for full year 2008
1. Artificial Lift 17%
2. Drilling Services 16%
3. Well Construction 15%
4. Drilling Tools 11%
5. Completion 10%
6. Wireline 8%
7. Re-Entry & Fishing 7%
8. Stimulation & Chemicals 7%
9. Integrated Drilling 6%
10. Pipeline & Specialty Services 3%
Ten Service Lines – Relative Size

© 2009 Weatherford. All rights reserved. 6
• Trailing Eight Quarters:
– 42% revenue growth 72% from international markets
– 30% EBIT growth all from international markets
($ in millions, except EPS)
Historical Operating Results
Q1 07 Q2 07 Q3 07 Q4 07 Q1 08 Q2 08 Q3 08 Q4 08
Total Revenue 1,852 1,816 1,972 2,192 2,196 2,229 2,541 2,635
North America 1,006 883 995 1,053 1,090 1,012 1,180 1,178
Middle East/North Africa/Asia 395 435 456 538 522 556 638 676
Europe/West Africa/CIS 245 291 308 345 348 390 409 392
Latin America 206 207 213 256 236 271 314 389
Net Operating Income 420 341 423 471 490 433 548 547
North America 300 192 264 257 292 224 313 296
Middle East/North Africa/Asia 83 97 104 132 121 131 146 163
Europe/West Africa/CIS 56 70 78 90 93 99 102 89
Latin America 49 46 45 63 60 58 70 89
Research & Development (41) (41) (43) (44) (43) (44) (52) (54)
Corporate (27) (23) (25) (27) (33) (35) (31) (36)
Income from Continuing Operations 286 235 298 345 351 300 384 364
Diluted EPS from Continuing Operations 0.41 0.34 0.43 0.49 0.50 0.43 0.55 0.53

© 2009 Weatherford. All rights reserved. 7
Net Debt / Capitalization
~ 40%
Repurchased 35.3 million
SharesSince
March 2006
($ in millions)
Balance Sheet
Dec 07 Mar 08 Jun 08 Sep 08 Dec 08
Assets
Cash 171 626 268 337 234
Accounts Receivable 1,962 2,105 2,111 2,426 2,443
Inventories 1,608 1,768 1,909 2,022 2,088
Other Current Assets 731 602 639 722 700
Total Current Assets 4,472 5,101 4,927 5,507 5,465
Fixed Assets 4,154 4,583 4,980 5,515 5,924
Goodwill 3,358 3,455 3,511 3,813 3,534
Other Assets 1,207 1,345 1,379 1,364 1,509
Total Assets 13,191 14,484 14,797 16,199 16,432
Liabilities & Shareholders' Equity
Short-Term Debt 774 193 50 1,074 1,256
Other Current Liabilities 1,428 1,468 1,399 1,566 1,723
Long-Term Debt 3,066 4,564 4,540 4,544 4,564
Other Long-Term Liabilities 516 568 639 632 573
Shareholders' Equity 7,407 7,691 8,169 8,383 8,316
Total Liabilities/Shareholders' Equity 13,191 14,484 14,797 16,199 16,432

© 2009 Weatherford. All rights reserved. 8Based on revenues for full year 2008
Cash $ 234
Short-Term Debt, including Current Portion of Long-Term Debt $ 6
Long-Term Debt $ 5,814
Shareholder’s Equity $ 8,316
Net Debt/Net Capitalization 40.2%
Capital Structure($ in millions, as of December 31, pro forma for January bond offering)
• Nearest dated maturity is $350 million due November 2011
• Average weighted maturity is over 13 years with ~ 30% in ~ 30 years
• Average weighted interest rate is 6.9%
© 2009 Weatherford. All rights reserved. 9Based on revenues for full year 2008
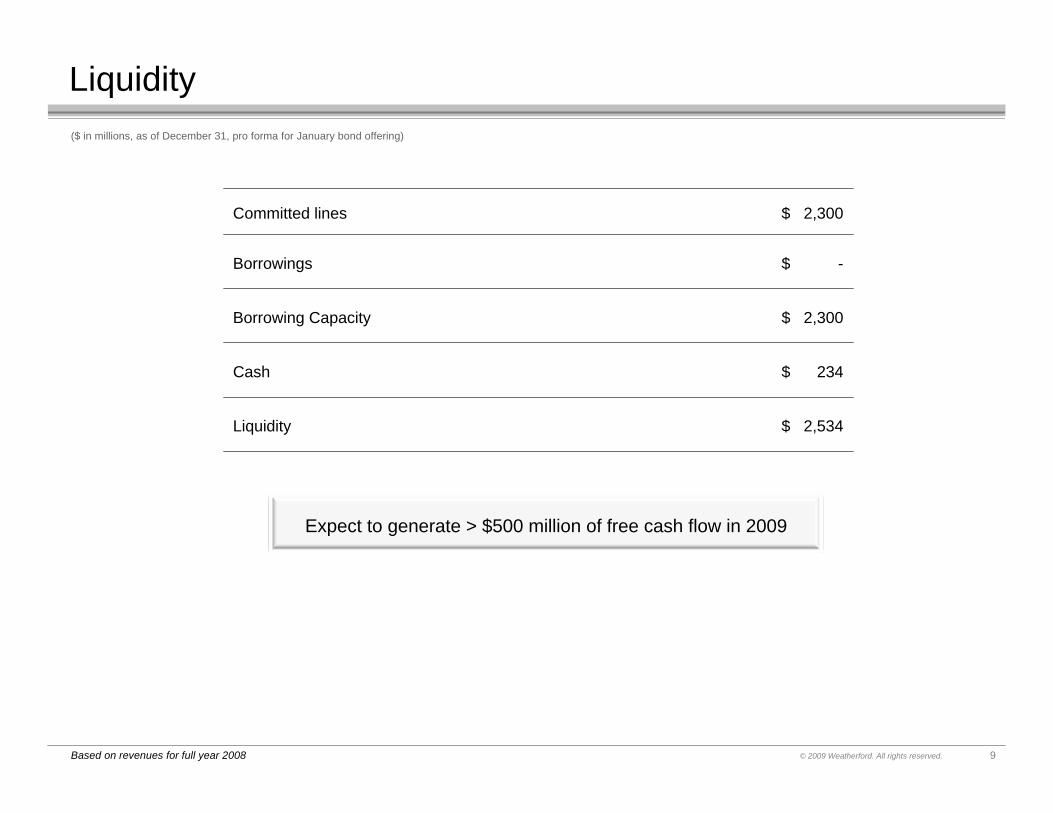
Committed lines $ 2,300
Borrowings $ -
Borrowing Capacity $ 2,300
Cash $ 234
Liquidity $ 2,534
Liquidity($ in millions, as of December 31, pro forma for January bond offering)
Expect to generate > $500 million of free cash flow in 2009

© 2009 Weatherford. All rights reserved. 10
Historical View

© 2009 Weatherford. All rights reserved. 11
Industry Expansion – Customer Spending
Source: Barclays Capital
0
50,000
100,000
150,000
200,000
250,000
300,000
350,000
1985 1986 1987 1988 1989 1990 1991 1992 1993 1994 1995 1996 1997 1998 1999 2000 2001 2002 2003 2004 2005 2006 2007 2008
North America International
1999 – 2008: International 12.9% CAGR2003 – 2008: International 13.3% CAGR1999 – 2008: International 12.9% CAGR2003 – 2008: International 13.3% CAGR
1999 – 2008: Overall 10.5% CAGR
2003 – 2008: Overall 11.2% CAGR
($ in
mill
ions
)

© 2009 Weatherford. All rights reserved. 12
Industry Expansion – Rig Count
Rig
Cou
nt Global 10% CAGR
1999 – 2008: International 8% CAGR2003 – 2008: International 9% CAGR1999 – 2008: International 8% CAGR2003 – 2008: International 9% CAGR
Global 10% CAGR
WFT International Rig CountWFT NAM Rig Count

© 2009 Weatherford. All rights reserved. 13
Weatherford Performance – Revenue
26% CAGR
30% CAGR
($ in
mill
ions
)
1999 – 2008: International 31% CAGR2003 – 2008: International 32% CAGR1999 – 2008: International 31% CAGR2003 – 2008: International 32% CAGR
WFT International RevenueWFT NAM Revenue

© 2009 Weatherford. All rights reserved. 14
Weatherford Performance – Revenue per Rig
Rev
enue
/Rig
($)
14% CAGR
19% C
AGR
1999 – 2008: International 21% CAGR2003 – 2008: International 22% CAGR1999 – 2008: International 21% CAGR2003 – 2008: International 22% CAGR
WFT NAM Revenue / Rig (millions)WFT International Revenue / Rig (millions)WFT Revenue / Rig (millions)

© 2009 Weatherford. All rights reserved. 15
Weatherford Performance – EBITDA
31% CAGR
38% CAGR
($ in
mill
ions
)
WFT EBITDA

© 2009 Weatherford. All rights reserved. 16
Weatherford Performance – EBIT
45% CAGR
48% CAGR
($ in
mill
ions
)
WFT EBIT
© 2009 Weatherford. All rights reserved.
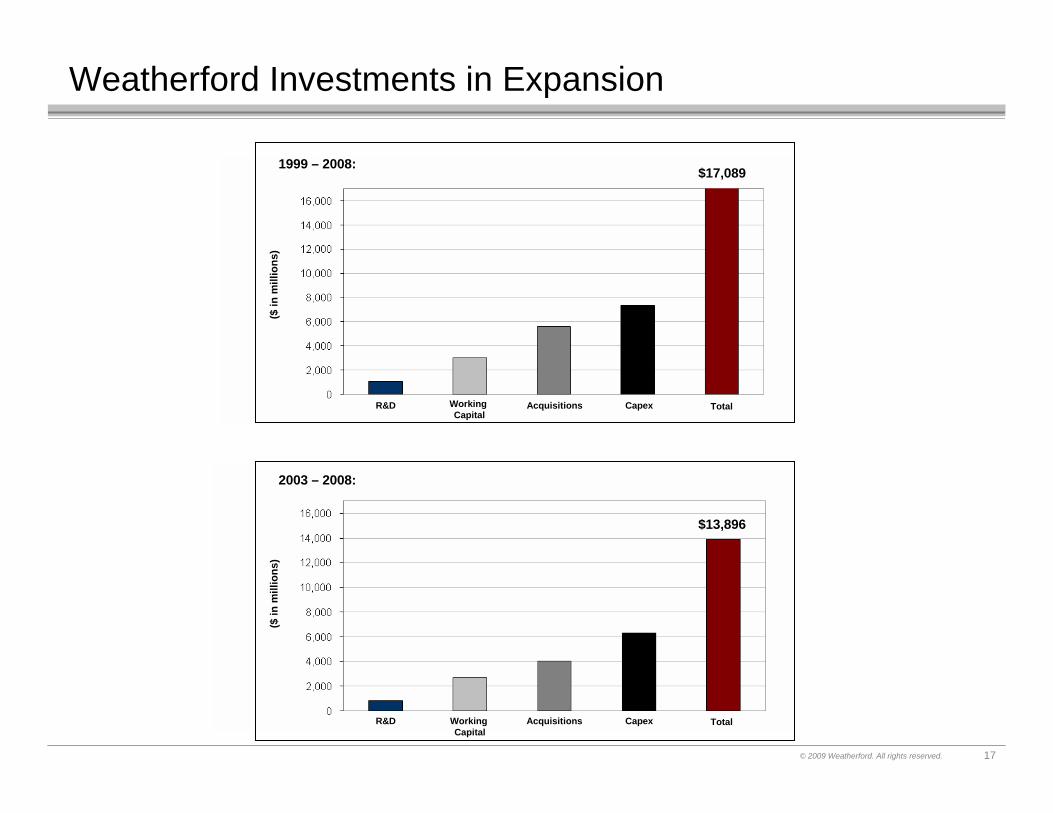
Weatherford Investments in Expansion
17
1999 – 2008:
R&D Working Capital
Acquisitions Capex Total
2003 – 2008:
R&D Working Capital
Acquisitions Capex Total
($ in
mill
ions
)($
in m
illio
ns)
$17,089
$13,896

© 2009 Weatherford. All rights reserved. 18
Drilling Services
Directional Drilling
MWD
LWD
Rotary Steerable
Underbalanced
Managed Pressure
Coiled Tubing Drilling
Drilling with Casing
Wireline
Open Hole Wireline
Geoscience
Surface Logging
Core Evaluation
Cased Hole Wireline
Slickline
Well Construction
Tubular Running
Cementation
Liner Hangers
Inflatables
Expandable Solids
Re-entry & Fishing
Casing Exit
Fishing
Thru-Tubing
Drilling Tools
Drilling Products
Rentals
Integrated Drilling
Contract Drilling
Integrated Management
Completion
Completion Tools
Sand Screens
Expandable Screens
Intelligent Completion
Fiber Optic Sensing
Field Optimization
Stimulation & Chemicals
Fracturing Services
Production Chemicals
Coiled Tubing
Pipeline & Specialty Services
Pre-commissioning
Inspection
Artificial Lift
Progressing Cavity
Reciprocating
Gas Lift
Hydraulic
Electric Submersible
Lift Optimization
Ten Service Lines – Breadth

© 2009 Weatherford. All rights reserved. 19
North America50664
34%
Service LocationsManufacturing Facilitiesof Employees
Latin America108
718%
Service LocationsManufacturing Facilitiesof Employees
Asia5932
9%
Service LocationsManufacturing Facilitiesof Employees
Middle East/ North Africa554
20%
Service LocationsManufacturing Facilitiesof Employees
Europe / W Africa81 21
19%
Service LocationsManufacturing Facilitiesof Employees
International303 Service Locations64 Manufacturing Facilities
International303 Service Locations64 Manufacturing Facilities
Weatherford locationsRegional officesCorporate headquarters
Infrastructure
Additions 2008-200917 Service Locations3 R&D Facilities5 Training Facilities
Additions 2008-200917 Service Locations3 R&D Facilities5 Training Facilities

© 2009 Weatherford. All rights reserved. 20
Depth – Technology Additions
• Across all Product and Service Lines
• Examples shown from:
– MWD/LWD
– RSS
– Directional Motors
– Open-hole Wireline
– Cased-hole Wireline
• Examples focus on:
– Adding more sensing capabilities on “new” directional & wireline platforms
– Pushing the performance envelope
© 2009 Weatherford. All rights reserved. 21
MWD/LWD – Technology Developments
• 4 ¾” MFR-Ultra 80” – Q4 2007 (MENAP)
– Deep reading resistivity in geosteering applications
– 165°C
– 30,000 psi
• Azimuthal (“Focused”) MFR – Q4 2008 (US)
– Azimuthal resistivity used in geosteering applications
– 165°C
– 30,000 psi
• Resistivity Imaging Sensor – Q2 2009 (MENAP)
– Unique to Weatherford
– Electric imaging tool providing 3-D image of borehole
– Designed to work in water and oil based muds
– Competition’s tools only work in water based mud
• 6 ¾” SAGR – Q1 2008 (MENAP)
– Spectral, Azimuthal, Gamma Ray
– Unique to Weatherford
– Reads chemical content of shale formation
– Provides rock description
© 2009 Weatherford. All rights reserved. 22
MWD/LWD – Technology Developments
• New Generation Ranging Method – Q3 2009 (NAM)
– SAGD applications (steer well parallel to existing well)
– New generation ranging tool
– Key in heavy oil
– Improved accuracy
• Intelli-Pipe Interface – Q2 2008 (LAO)
– Continuous real-time communications
• GABIS II – At Bit Sensors – Q3 2008 (NAM)
– Gamma and inclination measurements below the mud motor (speed of sight)
– Key in unconventional resources (CBM)
• TVM – 3-axis vibration sensor – Q1 2008 (MENA / EWACIS)
– Drilling efficiency measurement
– Provides measurements ranging from 0 – 200 g’s and downhole RPM

© 2009 Weatherford. All rights reserved. 23
MWD/LWD – Technology Developments
• Pe (AZD) Evaluation – Q4 2007 (MENAP)
– Photo-electric measurement in density tool
– Log evaluation measurement
• Sonic – Q4 2008 (US / EH)
– Improved data correlation and measurement quality
• Formation Pressure Tester – Q2 2009

© 2009 Weatherford. All rights reserved. 24
• Automated Drilling Mode (“cruise control”) – Q3 2008
– Automatic maintenance of inclination and azimuth
• Integrated ERT motor power section – Q3 2008
– Runs rotary steerable with power section
• Vertical Drilling System – Q4 2007
– Standalone point the bit system (No MWD required) – Q1 2008
– Standalone push the bit system (No MWD required) – Q4 2008
• New (industry first) HPHT RSS System – (US / EH)
– 175°C and 30,000 psi
– Highest pressure and temperature ratings in industry
• Next generation rotary steerable system – 2009
RSS – Technology Developments

© 2009 Weatherford. All rights reserved. 25
RSS – Technology Developments
• Dual Pulser – Q3 2008 (US / MENAP)
– Can run two pulses in BHA; can run RSS & LWD pulsing; removes problem of hard wired motor
– To allow incorporation of a mud motor in the RSS BHA with full control
▪ Improved reliability vs. wired motor, EM short hop or acoustic
▪ Increased data rates
• Torque Mitigator – Q4 2008 (US / EH)
– Provides the ability to operate under extreme drilling conditions where stick slip is an issue
• EM HEL RSS underbalanced application – 2007 (Global)
– Unique to WFT

© 2009 Weatherford. All rights reserved. 26
Motor Technology Developments
• Mechanical Vertical Drilling Tool – Q4 2009 (NAM)
– Eliminates need for RSS
• Continuous Coil Tubing Orientator System – Q1 2009 (NAM)
– Provides a means of continuously orienting the bend in the motor to steer the well in 3 dimensions
• 11 ¼” Performance Motors – Q1 2008
– Significantly improved drilling performance
• 4 Degree Bent Housing Motor – Field Proven, Best in Class
– For short-radius directional work
• ERT Power Sections – Field Proven, Best in Class
– Improved rate of penetration

© 2009 Weatherford. All rights reserved. 27
• Compact Micro Imager – Q2 2008 (2.4” pads in Q1 2009)
– Real Time and Memory
– Acquires excellent formation images to be obtained in broad range of boreholes
• Oil Based Mud Imager – Q3 2008
– Real Time only
– Allows excellent formation images to be obtained in OBM wellbores
• Ultrasonic Micro Imager – Q2 2008
– Real Time only
– Provides another method for acquiring formation images
– Reduces drilling risk by providing geomechanical, wellbore stability and stress analysis
Open-Hole – Technology Developments
© 2009 Weatherford. All rights reserved. 28
• Array Induction – Advanced Formation Density – Q2 2009
– Real Time only
– Resistivity / Density / Neutron Platform for basic log evaluation
– Multiple depth of investigation, improved resolution with deeper reading for resistivity
• Reservoir Evaluation System (RES) – Q2 2009
– Real Time only
– Provides direct measurement of formation and fluid properties of the reservoir
– Improved accuracy of formation properties for permeability, fluid gradients
– Down-hole lab analysis for fluid properties evaluation (unique)
– Mini DST / Interference testing
• Compact Dipole Sonic – Q3 2009
– Real Time and Memory
– Complete geophysical, petrophysical, and mechanical properties evaluation service
Open-Hole – Technology Developments

© 2009 Weatherford. All rights reserved. 29
• Memory Pulsed Neutron (MPND) – Q2 2008
– Memory
– Formation evaluation behind casing includes reservoir monitoring
– Flexibility: E-Line, Slickline, or CT conveyed
• Mechanical Cutting Tool – Q3 2008
– Real Time with future Memory capability
– Severs 2 3/8” & 2 7/8” tubing without the use of explosives
– Reduces NPT by allowing multiple cuts in a single run
• Direct Pump Setting Tool (DPST) – Q3 2008
– Real Time with future Memory capability
– Direct replacement for competitor’s setting tool; uses electro-hydraulics to set plugs and packers without the use of explosives
– Reduces NPT by allowing multiple plugs to be set by significantly reducing surface preparation time between runs
Cased-Hole – Technology Developments
© 2009 Weatherford. All rights reserved. 30
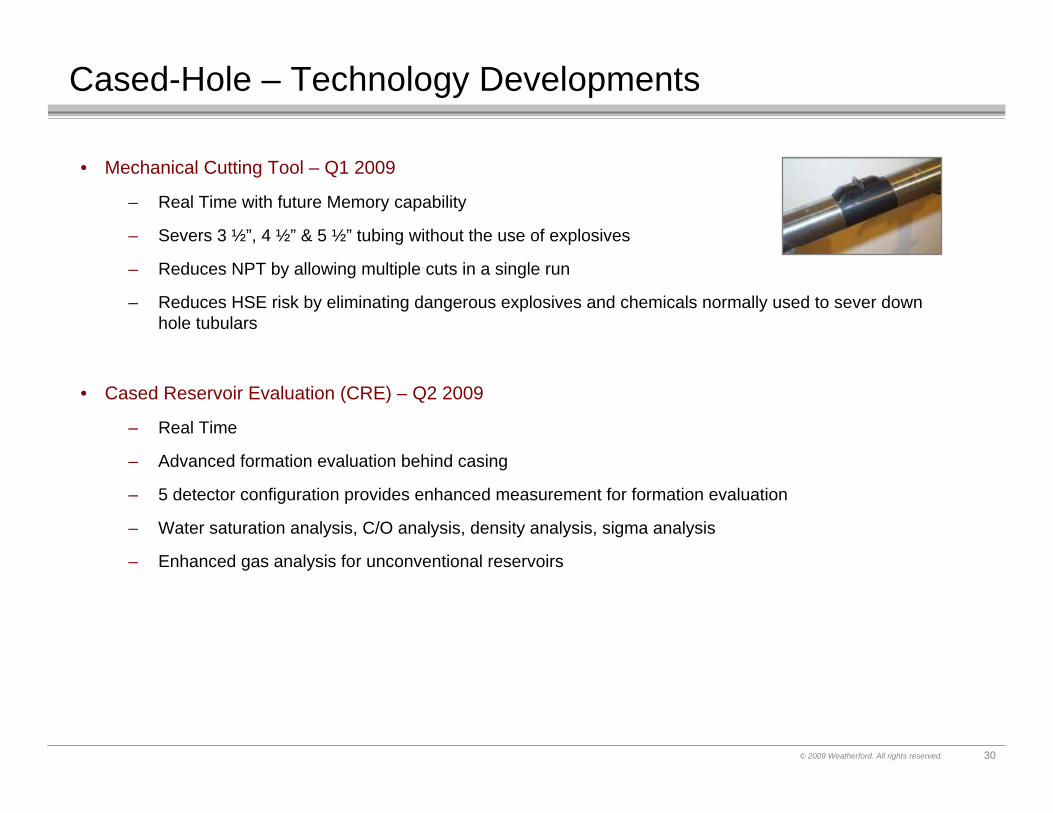
• Mechanical Cutting Tool – Q1 2009
– Real Time with future Memory capability
– Severs 3 ½”, 4 ½” & 5 ½” tubing without the use of explosives
– Reduces NPT by allowing multiple cuts in a single run
– Reduces HSE risk by eliminating dangerous explosives and chemicals normally used to sever down hole tubulars
• Cased Reservoir Evaluation (CRE) – Q2 2009
– Real Time
– Advanced formation evaluation behind casing
– 5 detector configuration provides enhanced measurement for formation evaluation
– Water saturation analysis, C/O analysis, density analysis, sigma analysis
– Enhanced gas analysis for unconventional reservoirs
Cased-Hole – Technology Developments

© 2009 Weatherford. All rights reserved. 31
Forward View

© 2009 Weatherford. All rights reserved.
• Volatility
– Shale production
– Decline curves
– LNG deliveries
– Industrial demand
– Average rig count ~800 in U.S. and ~250 in Canada
• Efficiency
– $150 million reduction in fixed and variable costs
– Headcount
– Infrastructure
– Supply Chain
32
North America Outlook – Near-Term

© 2009 Weatherford. All rights reserved. 33
North America Outlook – Long-Term
• Secular forces in the market
– Shale
– Heavy Oil
– Deepwater
• Mid-single digit annual market growth
• Weatherford should grow above the market rate
– Young technologies
– Strong in shale (directional, evaluation, completion, stimulation)
– Strong in heavy oil (directional, completion, artificial lift)
– Strong in deepwater
▪ Legacy (tubular running, cementation, line hangers, fishing, proprietary drilling tools)
▪ Higher end technologies (directional, wireline, completion)

© 2009 Weatherford. All rights reserved.
• Severe Pullback
– North Sea
– Russia
– Central Europe
– Venezuela
– Argentina
• Weak Markets
– Saudi
– West Africa
– Asia Pacific
• Steady Markets
– Middle East ex Saudi
– North Africa
– Mexico
– Brazil
– China
34
International Outlook – Near-Term

© 2009 Weatherford. All rights reserved. 35
International Outlook – Long-Term
• Secular forces in the market
– Emergence of heavy oil
– Emergence of gas
– More challenging reservoirs
• Low double-digit annual market growth
• Weatherford should grow well above the market rate
– Required breadth, depth and reach
– Young technologies with immature global share (high local share)
– Strong in heavy oil (directional, completion, artificial lift)

© 2009 Weatherford. All rights reserved. 36
E&P Spending**WFT*
*Full year 2008
International – Most Growth Opportunities
North America46%
Latin America13%
Eastern Hemisphere41%
North America30%
Latin America12%
Eastern Hemisphere58%
* * Barclays Capital – 2008 Survey
© 2009 Weatherford. All rights reserved. 37
International Competitive Requirements
• Breadth = Client Relevance, Economies of Scale and Solutions
• Depth = Technology
• Infrastructure = Reach

© 2009 Weatherford. All rights reserved. 38
Implications for the Future
• Shift in geographic exposure
• Shift in product and service mix
• Margin and return expansion

© 2009 Weatherford. All rights reserved. 39
TargetedCurrent Revenue*
*Full year 2008
Geographic Shift
North America46%
Latin America13%
Eastern Hemisphere41%
North America25%
Latin America25%
Eastern Hemisphere50%
2008 2013

© 2009 Weatherford. All rights reserved. 40
Service Line Shift
• Artificial Lift
• Well Construction
• Drilling Services
• Drilling Tools
• Completion
• Wireline
• Re-Entry & Fishing
• Stimulation & Chemicals
• Integrated Drilling
• Pipeline & Specialty Services
• Drilling Services
• Well Construction
• Artificial Lift
• Completion
• Integrated Drilling
• Wireline
• Stimulation & Chemicals
• Re-Entry & Fishing
• Drilling Tools
• Pipeline & Specialty Services
20132007

© 2009 Weatherford. All rights reserved. 41
Margin and Return Expansion
• Technology intensity
• Economies of scale
• Efficiencies at delivery point
– Evaluation
– Drilling
– Intervention
– Production
• Best in class growth

© 2009 Weatherford. All rights reserved. 42
This presentation contains forward-looking statements within the meaning of the Private Securities Litigation Reform Act of 1995 concerning, among other things, the prospects for Weatherford’s operations which are subject to certain risks, uncertainties andassumptions. These risks and uncertainties, which are more fully described in Weatherford International Ltd.’s reports and registration statements filed with the SEC, include the impact of oil and natural gas prices and worldwide economic conditions on drilling activity, the demand for and pricing of Weatherford's products and services and domestic and international economic and regulatory conditions. Should one or more of these risks or uncertainties materialize, or should the assumptions prove incorrect, actual results may vary in material aspects from those currently anticipated.


