37
Web Analytics Primer Chad Richeson
| Date post: | 25-Jul-2015 |
| Category: |
Business |
| Upload: | chad-richeson |
| View: | 239 times |
| Download: | 2 times |
Web Analytics Primer
Chad Richeson
• Since the dawn of the World Wide Web, site owners have been trying to quantify Web Traffic.
• Remember when sites reported ‘Hits’?
• Stage 1 (1995-2002):
• Server-side measurement – count the # of server requests generated
• Stage 2 (2002-Present)
• Client (browser)-side “tagging”
• Stage 3 (2008-Present)
• Client+server hybrid measurement and Tag Management
How To Measure Web Traffic?
January 25, 2013www.societyconsulting.co
m2

Web Logs……….……….……….……….
Web Logs……….……….……….……….
3
Server-side Measurement
January 25, 2013www.societyconsulting.c
om
Web Serve
r
Browser
Browser
Browser
25
Requests
5 Requests
2 Requests
Description• Browser makes requests
of web server to render page
• Web server “logs” how many requests were made.
• The birth of log file analysis!
Advantages• Easy/cheap to implement
• Best option available at the time
Disadvantages• “Hits” not equivalent to “pages”
• No concept of the User, Visit, etc. at the log level – must be processed to be useful
• Also captures non-human traffic
• Content Caching can skew web log numbers
Web Logs……….……….……….……….
4
Server-side Measurement
January 25, 2013www.societyconsulting.co
m
Log Files:
• Hard to read, but contain rich information
• Data is written to the log in the sequence each event was observed
Requires Processing to be Useful
• There are a lot of inexpensive tools on the market that will perform log file analysis (processing) for you, but they can’t handle large amounts of data or create sophisticated metrics.
• Many companies now generate so much log data that it can’t be processed by traditional tools – new approaches had to be invented (more on that later.)

5
What’s Does a Server Log Look Like?
January 25, 2013www.societyconsulting.co
m
Google crawler indexing the
siteUser that came so the site from
Page view from a user that was already on the
site
Fields Contained in this Log File: • IP Address – somewhat useful for IDing users (cookies can also be used but have their
own problems.)
• Timestamp – when the event occurred. Beware the timezone of the server!
• Access Request – “GET” me the page using HTTP/1.1 protocol
• Result Status – “200” is success; 404 is Not Found; many other codes exist
• Bytes Transferred – 10801 bytes were transferred in the 2nd log entry
• Referring URL – the previous page the user was on. Not always captured.
• User Agent String – the browser, operating system, & language. Mostly reliable.

6
Client-side Measurement
January 25, 2013www.societyconsulting.c
om
Web Server
Browser
Browser
Browser
25
Requests
5 Requests
2 Requests
Description• Browser makes requests
of web server to render page
• Upon rendering, the page activates a “tag” .
• The tag sends data to a measurement server, whose sole job is to collect and process web data.
Advantages• Tags tend to be more reflective
of actual “human” behavior
• Caching not an issue
• Back-end processing is typically more sophisticated & scalable
• Can have multiple tags per page
• Rich JS information can be collected
Disadvantages• Each page must be tagged
• Some tags increase Page Load Time
• Cost of tagging and processing (getting better)
Measure-ment
System
TAG
TAG
TAG

7
What is a Page Tag?
January 25, 2013www.societyconsulting.c
om
• A Page Tag is a piece of code that resides in the HTML on the page. It frequently relies on helper technologies such as Javascript to expand its capabilities.
• Since a page tag “makes a call”, it CAN slow down how fast your page loads. Make sure you keep an eye on “PLT” – Page Load Time.
• Large sites typically have many page tags on them:
• Web Analytics (Omniture, WebTrends, CoreMetrics, GA, etc.)
• Custom Targeting (e.g. BlueKai, AudienceManager)
• 3rd Party Ad Networks (e.g. Atlas, DoubleClick, etc.)
• Marketing Campaign Funnel (Ad Networks, Search Engines)
• Testing/Experimentation (Adobe, WebTrends, etc)
• Etc
• Etc
8
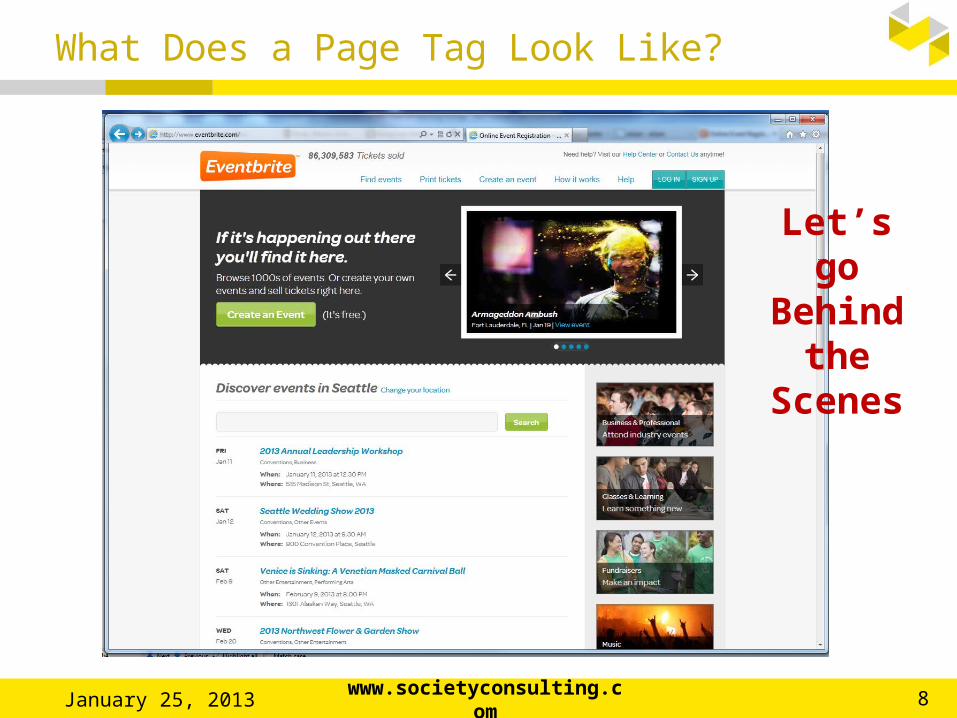
What Does a Page Tag Look Like?
January 25, 2013www.societyconsulting.c
om
Let’s go Behind
the Scenes

9
What Does a Page Tag Look Like?
January 25, 2013www.societyconsulting.c
om

10
What Does a Page Tag Look Like?
January 25, 2013www.societyconsulting.c
om
Google Analytics tag is located at the
bottom of the EventBrite page.

11
Client-Server “Hybrid” Measurement
January 25, 2013www.societyconsulting.c
om
Description• Web logs and page
tracking are enabled with a common Page ID
• Data is combined after collection in a central storage & processing environment.
• Best of both worlds?
Advantages• Useful when the content you’re
serving is different for each customer (only the server knows the differences)
• Enables “whole page unification” across Ads & Content
• Very powerful when combined with Experimentation & Targeting
Disadvantages• More expensive
• Requires excellent data “mastering”
• Lots of storage needed!
• Lots of data skill needed!
Web Server
Browser
Browser
Browser
Measure-ment System
TAG
TAG
TAG
Web Logs……….……….……….……….
Web Logs……….……….……….……….
Web Logs……….……….……….……….
Integrated Data Store

• Putting a Page Tag on every URL is a tedious job. Many sites have thousands (or more) URLs.
• Adding, changing, or removing tags typically requires modifying the HTML of each page… this is time consuming.
• Content Management Systems can streamline some of this, but do not offer robust Tag Management capabilities.
• If you’re manually editing tags, mistakes can tend to pile up over time, requiring regular “audits”
• Solution? Centralized Tag Management
Tag Management
January 25, 2013www.societyconsulting.co
m12

• Companies such as Adobe and Ensighten offer Centralized Tag Management Solutions.
• Instead of putting code on the page, the TMS puts a “container” on the page, which calls the tags you wish to invoke. You manage the tags from a central server.
• If you have lots of URLs and lots of Tags, leveraging a TMS can drive tremendous efficiency and fewer mistakes.
Tag Management
Web Server
Browser
Browser
Browser
Measure-ment System
TAG
TAG
TAG
Web Logs……….……….……….……….
Web Logs……….……….……….……….
Web Logs……….……….……….……….
Integrated Data Store
Tag Management System
January 25, 2013www.societyconsulting.co
m13

• Identifying “Users” (or Visitors) is one of the biggest challenges in Web Analytics!
• The Perfect User ID doesn’t yet exist (Facebook notwithstanding)
• Cookies are an old technology but still very prevalent.
• Challenges:
• Users are now using many devices to access the same site (home computer, work computer, tablet, phone, etc.)
• Sometimes a device is shared across more than one user (example: a home computer.)
• Unless the user logs in on every device, it’s impossible to know exactly how many users you have and track them individually.
Cookies & User Identification
January 25, 2013www.societyconsulting.co
m14
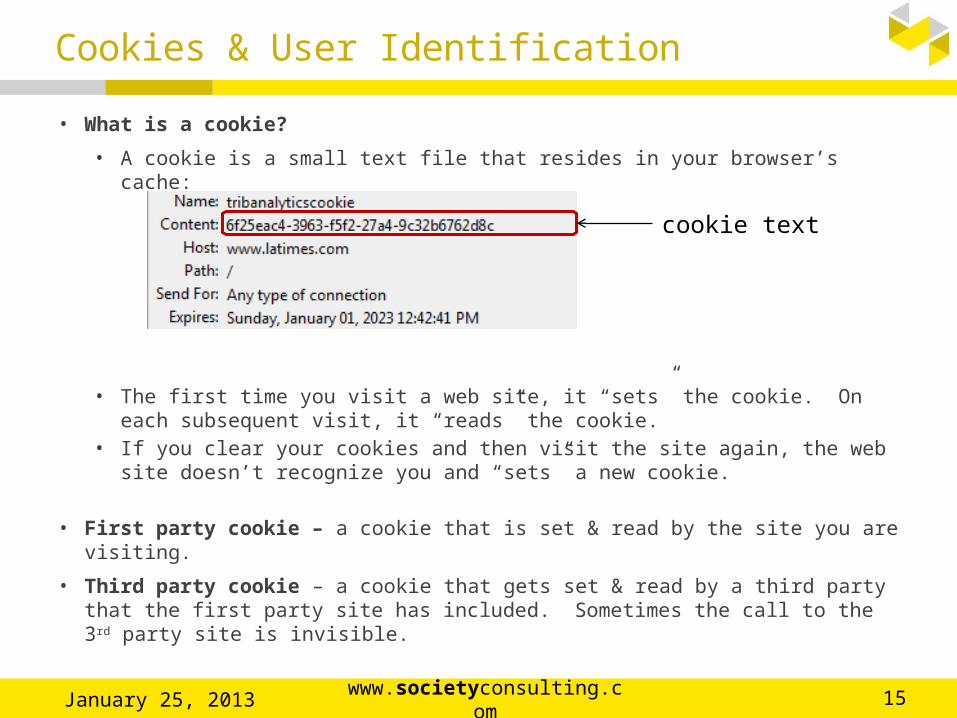
• What is a cookie?
• A cookie is a small text file that resides in your browser’s cache:
• The first time you visit a web site, it “sets” the cookie. On each subsequent visit, it “reads” the cookie.
• If you clear your cookies and then visit the site again, the web site doesn’t recognize you and “sets” a new cookie.
• First party cookie – a cookie that is set & read by the site you are visiting.
• Third party cookie – a cookie that gets set & read by a third party that the first party site has included. Sometimes the call to the 3rd party site is invisible.
Cookies & User Identification
cookie text
January 25, 2013www.societyconsulting.co
m15

Cookie Deletion
• Studies have shown that 10-20% of users churn their cookies frequently – after every session or every day. This churn can lead to a large number of cookies in your results.
• Example: assume your site has 100 “real” users. During a one month period…• 80 of the users will have one cookie each = 80 cookies• 20 of the users will churn their cookies every day, and
create 30 cookies each = 600 cookies.• Total = 680 cookies, 88% of which look like new
users!
Cookies & User Identification
January 25, 2013www.societyconsulting.co
m16
17
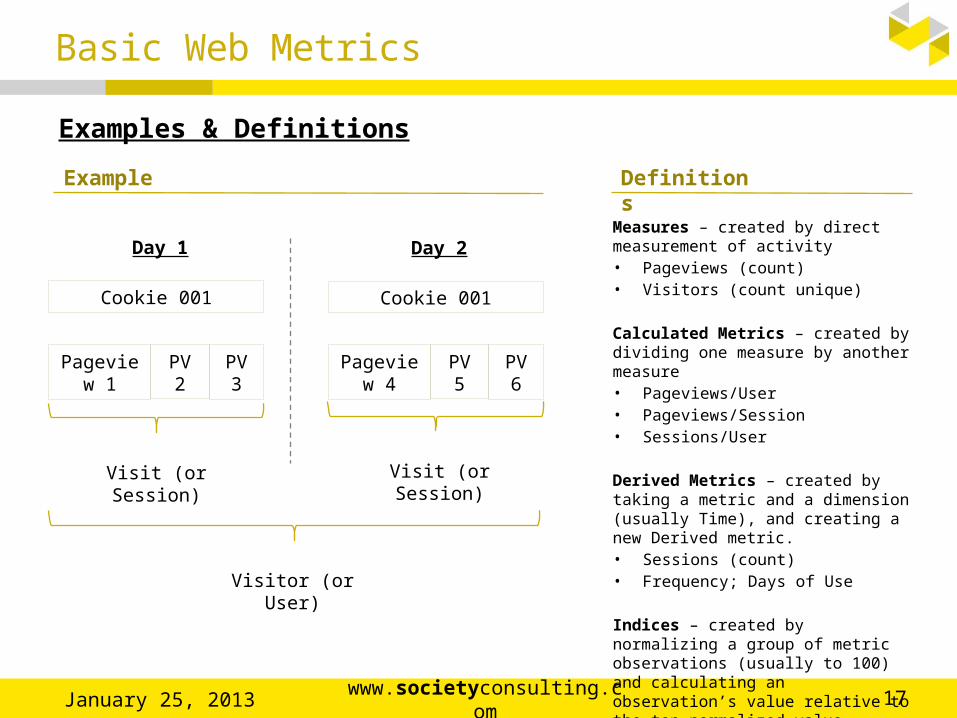
Basic Web Metrics
Examples & Definitions
Cookie 001 Cookie 001
Pageview 1
PV 2
PV 3
Day 1 Day 2
Visit (or Session)
Visit (or Session)
Visitor (or User)
Pageview 4
PV 5
PV 6
Measures – created by direct measurement of activity• Pageviews (count)• Visitors (count unique)
Calculated Metrics – created by dividing one measure by another measure• Pageviews/User• Pageviews/Session• Sessions/User
Derived Metrics – created by taking a metric and a dimension (usually Time), and creating a new Derived metric.• Sessions (count)• Frequency; Days of Use
Indices – created by normalizing a group of metric observations (usually to 100) and calculating an observation’s value relative to the top normalized value.
Example Definitions
January 25, 2013www.societyconsulting.co
m
18
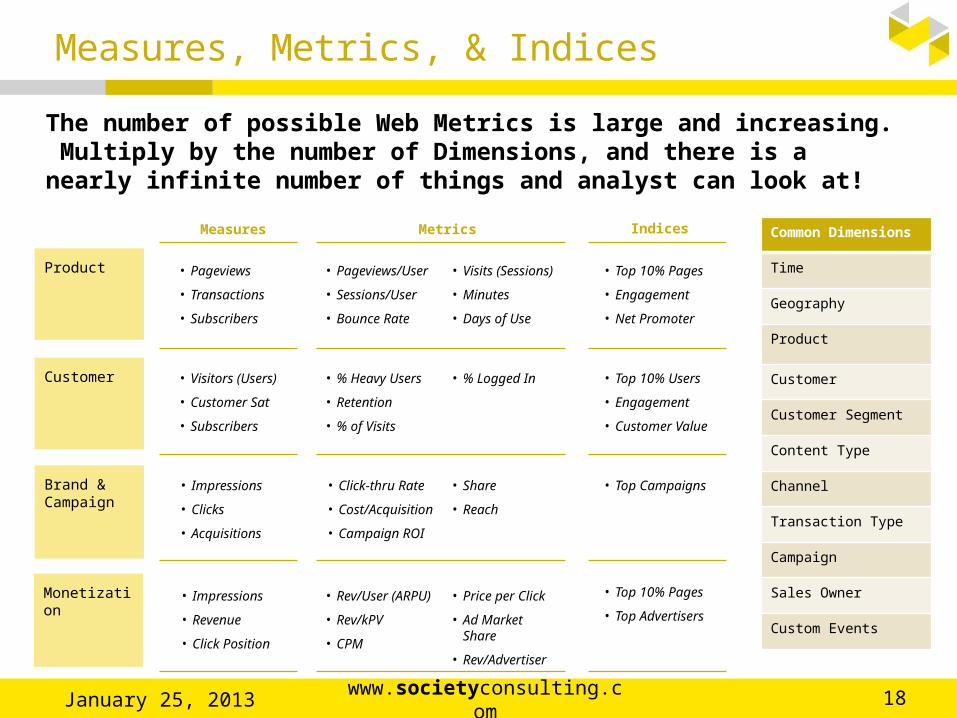
Measures, Metrics, & Indices
January 25, 2013www.societyconsulting.co
m
The number of possible Web Metrics is large and increasing. Multiply by the number of Dimensions, and there is a nearly infinite number of things and analyst can look at!
• Visitors (Users)
• Customer Sat
• Subscribers
• Pageviews/User
• Sessions/User
• Bounce Rate
• Pageviews
• Transactions
• Subscribers
Measures Metrics Indices
• Visits (Sessions)
• Minutes
• Days of Use
Common Dimensions
Time
Geography
Product
Customer
Customer Segment
Content Type
Channel
Transaction Type
Campaign
Sales Owner
Custom Events
Product
Customer
Brand & Campaign
• Top 10% Pages
• Engagement
• Net Promoter
Monetization
• Top 10% Users
• Engagement
• Customer Value
• % Logged In
• Impressions
• Revenue
• Click Position
• Rev/User (ARPU)
• Rev/kPV
• CPM
• % Heavy Users
• Retention
• % of Visits
• Share
• Reach
• Impressions
• Clicks
• Acquisitions
• Click-thru Rate
• Cost/Acquisition
• Campaign ROI
• Top Campaigns
• Price per Click
• Ad Market Share
• Rev/Advertiser
• Top 10% Pages
• Top Advertisers

• Prioritize. Make sure your business leaders have designated their top metrics (commonly called KPIs – Key Performance Indicators)
• See books by Eric T. Peterson for more help here.
• Build a Tree that shows how all of your metrics interrelate. Connect them to revenue and profit. Focus on the DRIVERS and LEADING INDICATORS.
• Revenue is a Lagging Indicator!• Customer Satisfaction is a Leading Indicator.• New Customers is a Driver.
• Useful Technique with Web Data: DE-AVERAGE
How to Cope?
January 25, 2013www.societyconsulting.co
m19

20
The Benefits of De-Averaging
January 25, 2013www.societyconsulting.co
m
Users Pages0%
10%
20%
30%
40%
50%
60%
70%
80%
90%
100%
10%1%
10%
2%
10%
4%
10%
4%
10%
5%
10%
8%
10%
9%
10%
10%
10%
20%
10%
40%30%
40%
11%
100% 100%Top Decile
Bottom Decile
Source: compilation of various analyses
70%
• There really is no “average” Internet user.
• Small numbers of users can drive a lot of traffic.
• Break down your important metrics into deciles to gain new levels of insight.

21
Days of Use
Current Year Actual
Next Year Goal % gro
>8 (Light) 7m 6m (15%)
8-21 (Med) 3m 4m 33%
>22 (Heavy)
1m 2m 100%
Total 11m 12m 10%
Using De-Averaging to Create New Metrics
January 25, 2013www.societyconsulting.co
m
Threshold metrics add a “mix” focus to business goals, which can have major impact on growth.
1 3 5 7 9 11 13 15 17 19 21 23 25 27 29
-
5.0
10.0
15.0
20.0
25.0
30.0
35.0 8.0 days of use
Visitors by Days of Use
22.0 days of use
# low users
# medium users
# high users
MED+HIGHtotal users
HIGHusers
Setting goals on Threshold metrics allows you to change the mix of users, while also growing & migrating the user base upward.
Assuming flat PV/user, changing the mix of the user base would increase pageviews by 50%, while total users only grow by 10%.
Applying to Business Goals
22
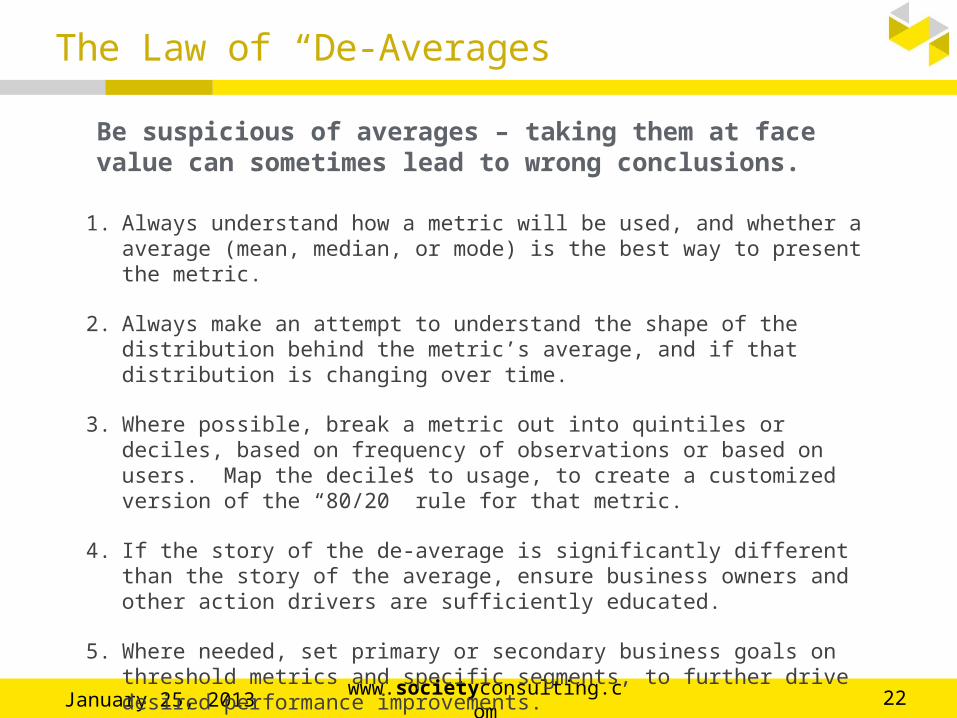
The Law of “De-Averages”
January 25, 2013www.societyconsulting.co
m
Be suspicious of averages – taking them at face value can sometimes lead to wrong conclusions.
1. Always understand how a metric will be used, and whether a average (mean, median, or mode) is the best way to present the metric.
2. Always make an attempt to understand the shape of the distribution behind the metric’s average, and if that distribution is changing over time.
3. Where possible, break a metric out into quintiles or deciles, based on frequency of observations or based on users. Map the deciles to usage, to create a customized version of the “80/20” rule for that metric.
4. If the story of the de-average is significantly different than the story of the average, ensure business owners and other action drivers are sufficiently educated.
5. Where needed, set primary or secondary business goals on threshold metrics and specific segments, to further drive desired performance improvements.

23
Generic Purchase Funnel
Awareness
Consideration
Conversion
January 25, 2013www.societyconsulting.co
m
• Most purchase funnels consist of three main parts.
• Web analytics can be used to optimize and improve each step!
24
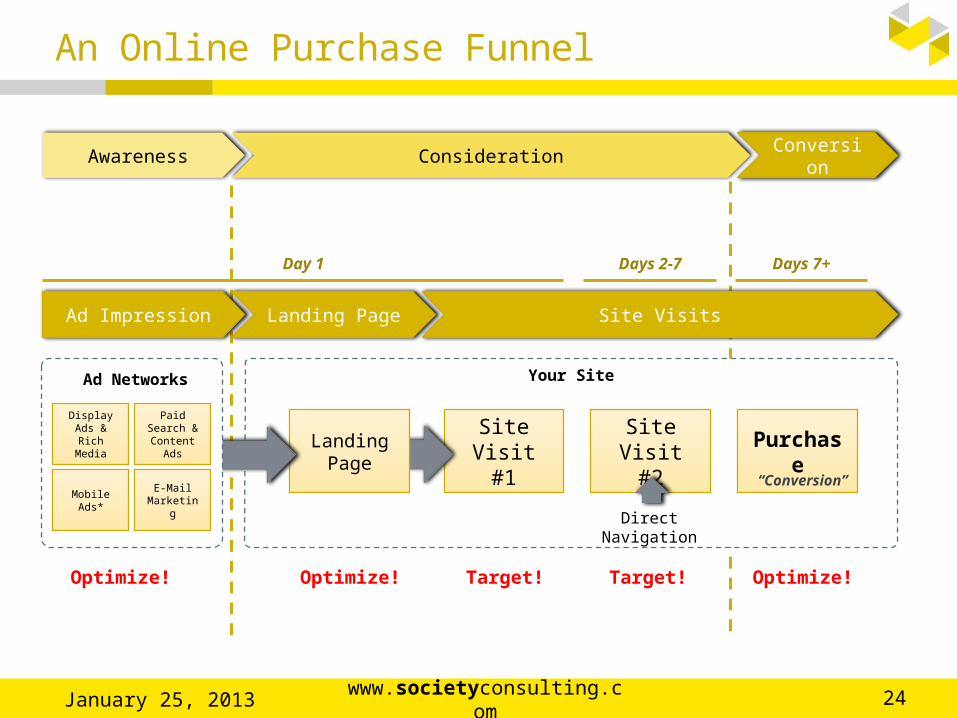
Your Site
An Online Purchase Funnel
January 25, 2013www.societyconsulting.co
m
Site Visit #1
Site Visit #2
Purchase
Landing Page
Display Ads & Rich
Media
Paid Search & Content
Ads
Mobile Ads*
E-Mail Marketing
Direct Navigation
“Conversion”
Day 1 Days 2-7 Days 7+
Ad Impression Landing Page Site Visits
Optimize!
Ad Networks
Awareness ConsiderationConversio
n
Optimize!
Optimize!
Target! Target!

How to improve an Online Purchase Funnel:
• Create multiple (even targeted) landing pages. The language on your landing page needs to match the Display Ad, Email, or Keyword that brought the user there!
• Example: if a user searched on ‘Shoes’ and clicked on your ad, the landing page should be the Shoes section, not your general storefront.
• Improving stick rates early in the funnel lead to better performance later in the funnel.
• Understand the user “paths” that lead to conversion. Start with what’s working, and decompose it into high conversion paths and low conversion paths. Test & iterate.
• Constantly test (optimize) your checkout/conversion page(s). This is a very important page – small improvements can mean a lot of money.
• Targeting can improve performance at every stage.
Improving Your Purchase Funnel
January 25, 2013www.societyconsulting.co
m25
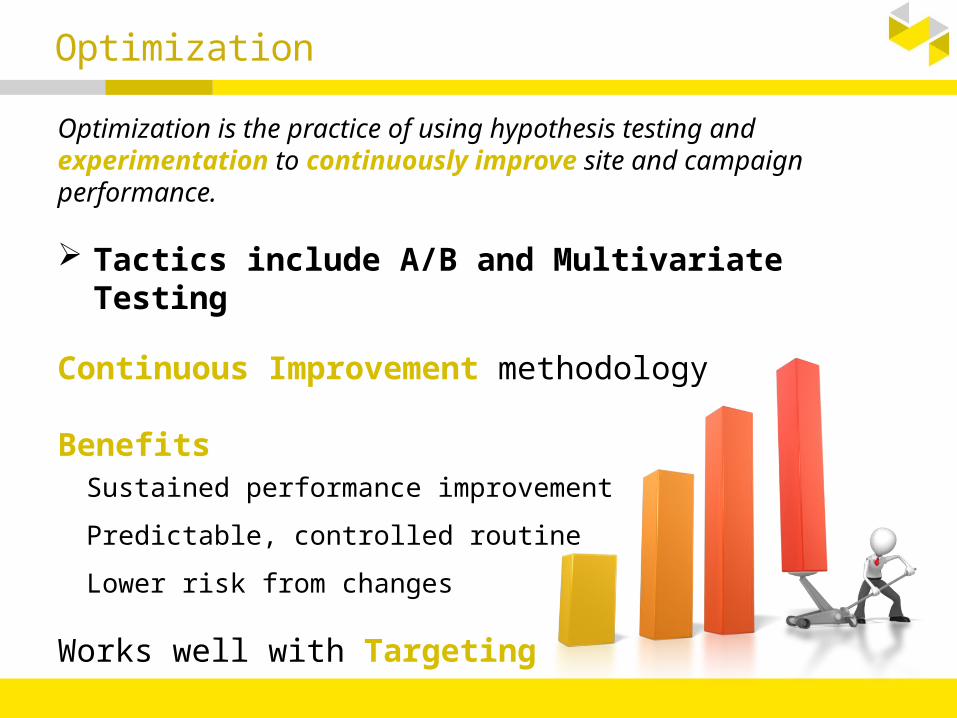
Optimization is the practice of using hypothesis testing and experimentation to continuously improve site and campaign performance.
Tactics include A/B and Multivariate Testing
Continuous Improvement methodology
BenefitsSustained performance improvement
Predictable, controlled routine
Lower risk from changes
Works well with Targeting
Optimization
27
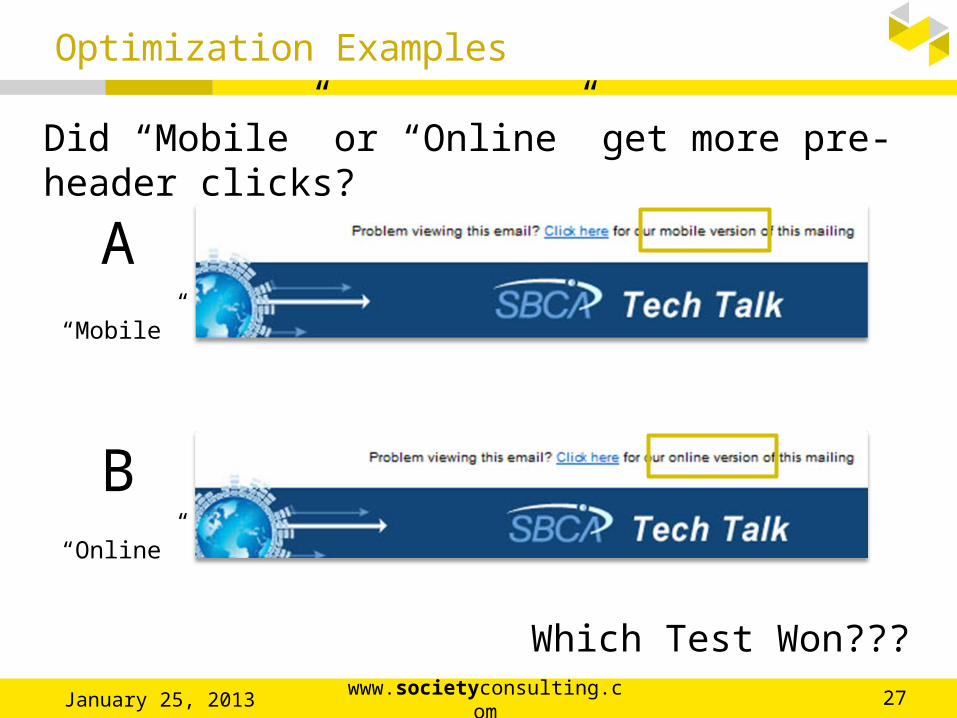
A
Did “Mobile” or “Online” get more pre-header clicks?
B
“Mobile”
“Online”
Which Test Won???
Optimization Examples
January 25, 2013www.societyconsulting.co
m
28
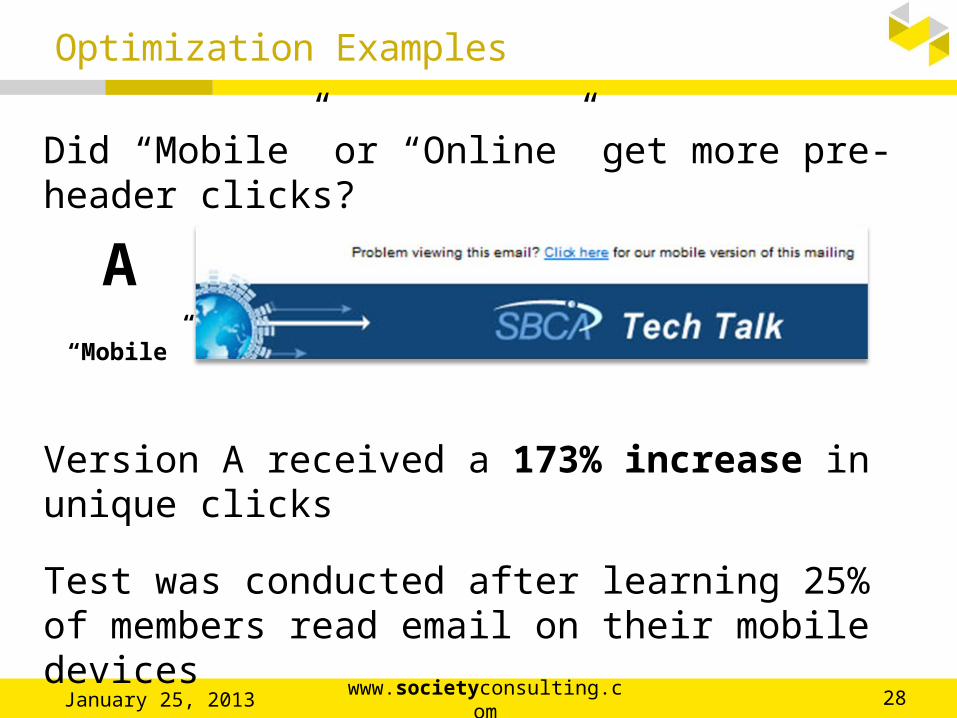
A
Did “Mobile” or “Online” get more pre-header clicks?
“Mobile”
Version A received a 173% increase in unique clicks
Test was conducted after learning 25% of members read email on their mobile devices
Optimization Examples
January 25, 2013www.societyconsulting.co
m
29
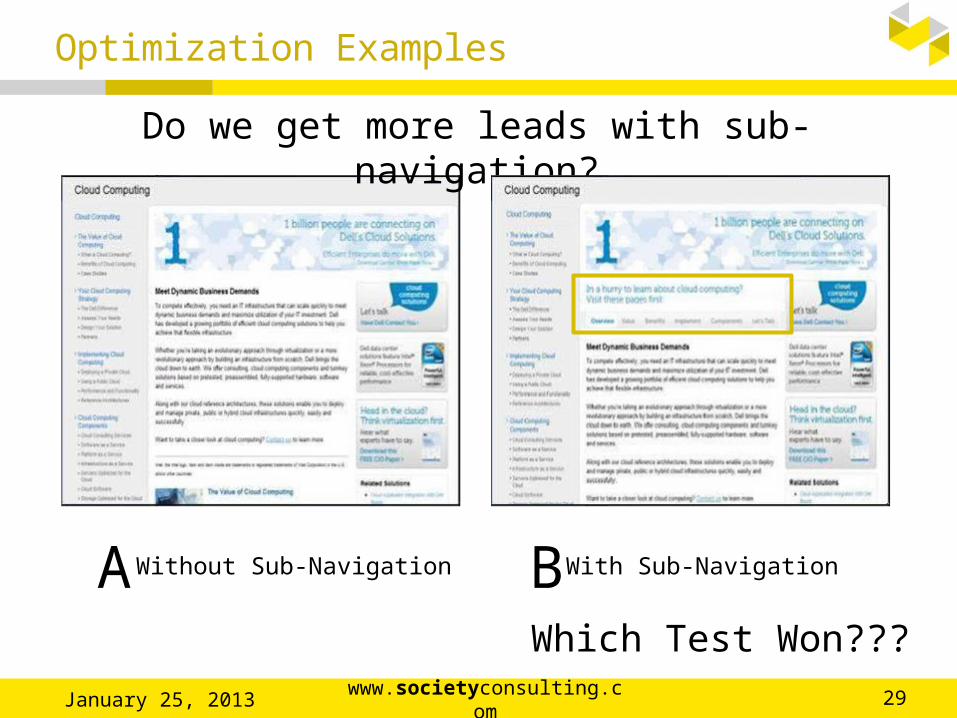
Which Test Won???
A
Do we get more leads with sub-navigation?
BWithout Sub-Navigation With Sub-Navigation
Optimization Examples
January 25, 2013www.societyconsulting.co
m
30
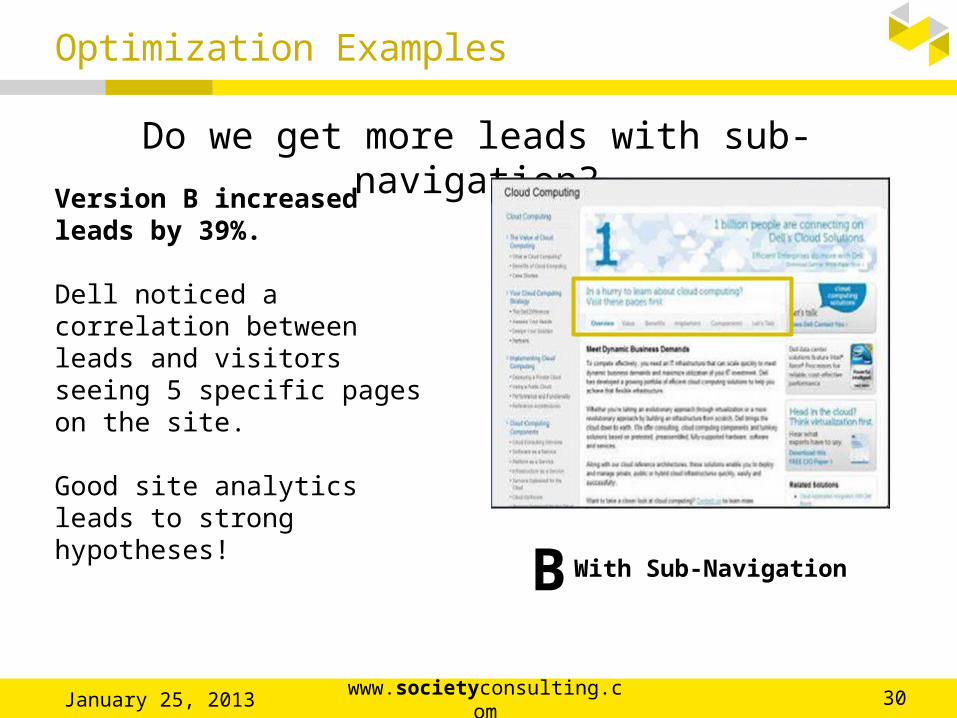
Do we get more leads with sub-navigation?
BWith Sub-Navigation
Version B increased leads by 39%.
Dell noticed a correlation between leads and visitors seeing 5 specific pages on the site.
Good site analytics leads to strong hypotheses!
Optimization Examples
January 25, 2013www.societyconsulting.co
m

31
A
B
Sarah
Blair
A
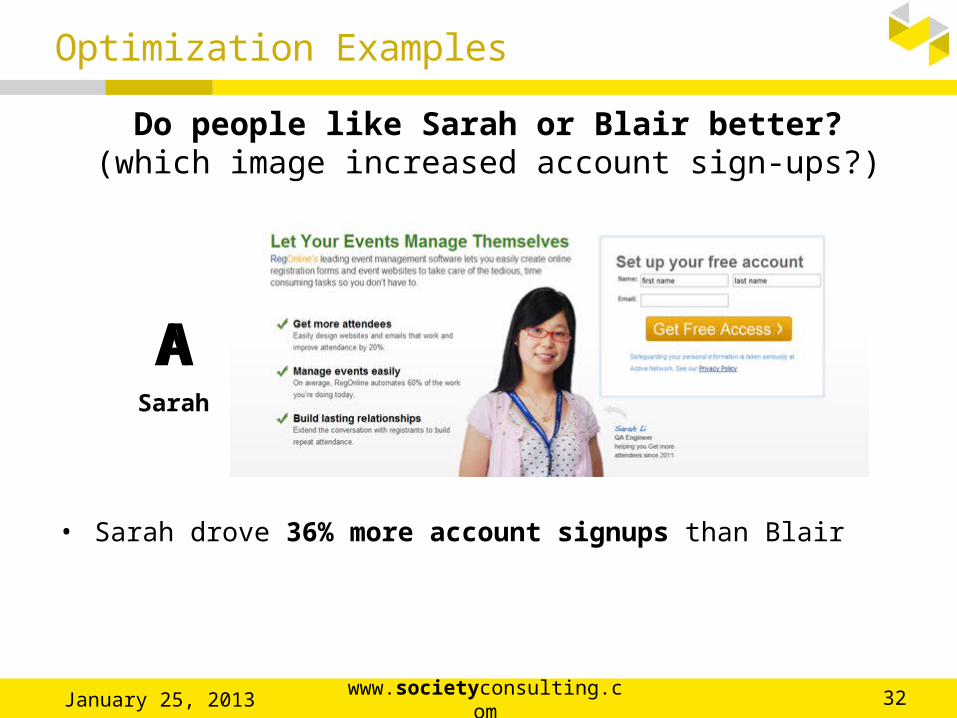
Do people like Sarah or Blair better?(which image increased account sign-ups?)
Optimization Examples
January 25, 2013www.societyconsulting.co
m
32
ASarah
A
• Sarah drove 36% more account signups than Blair
Do people like Sarah or Blair better?(which image increased account sign-ups?)
Optimization Examples
January 25, 2013www.societyconsulting.co
m

• Optimization should be an ongoing program – you will continue to get benefit as long as you do it.
• As you get more sophisticated, you can run many experiments at once. But don’t get sloppy with the samples
• Be patient – some tests (especially UX changes) take many months to show results.
• Get agreement up front on the Evaluation Criteria with Business and IT decision-makers.
• Be aware of confounding factors such as site changes that occur independently of your experiments. They can pollute your metrics and lead to incorrect conclusions.
• Targeting increases the power of Optimization.
Optimization Tips
January 25, 2013www.societyconsulting.co
m33
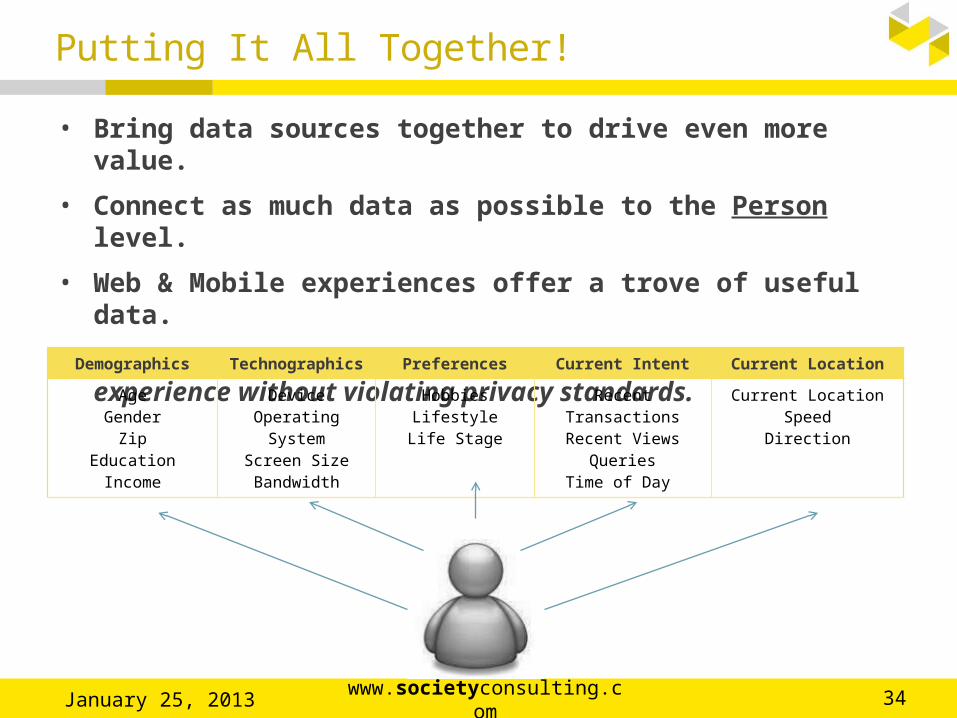
• Bring data sources together to drive even more value.
• Connect as much data as possible to the Person level.
• Web & Mobile experiences offer a trove of useful data.
• Exercise this power in a way that improves the customer experience without violating privacy standards.
Putting It All Together!
Demographics Technographics
Preferences Current Intent Current Location
AgeGender
ZipEducation
Income
DeviceOperating
SystemScreen SizeBandwidth
HobbiesLifestyle
Life Stage
Recent TransactionsRecent Views
QueriesTime of Day
Current LocationSpeed
Direction
January 25, 2013www.societyconsulting.co
m34
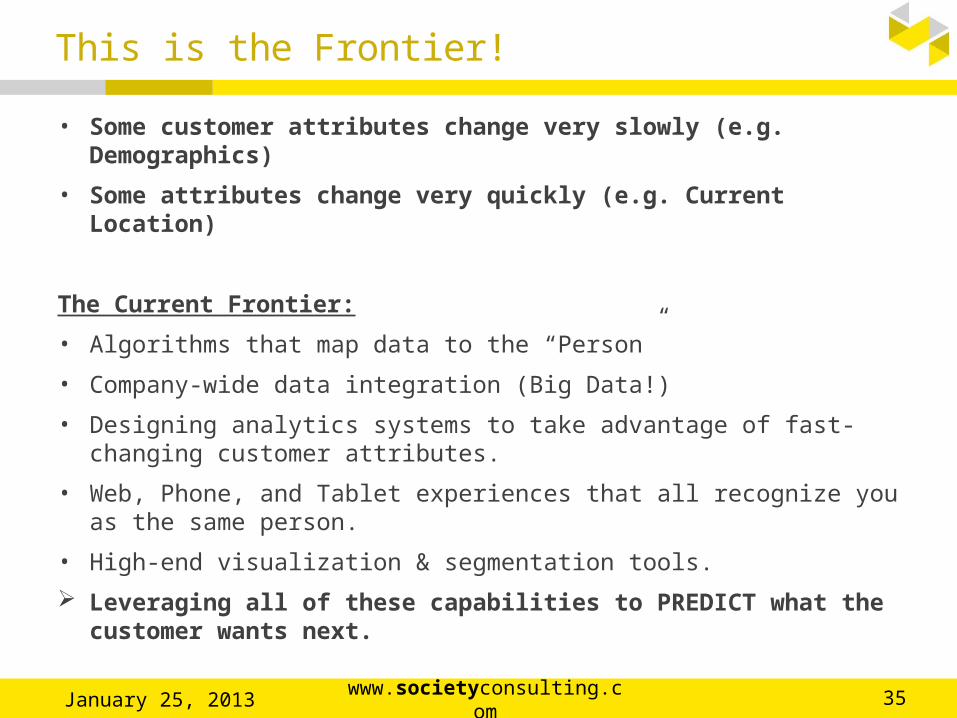
• Some customer attributes change very slowly (e.g. Demographics)
• Some attributes change very quickly (e.g. Current Location)
The Current Frontier:
• Algorithms that map data to the “Person”
• Company-wide data integration (Big Data!)
• Designing analytics systems to take advantage of fast-changing customer attributes.
• Web, Phone, and Tablet experiences that all recognize you as the same person.
• High-end visualization & segmentation tools.
Leveraging all of these capabilities to PREDICT what the customer wants next.
This is the Frontier!
January 25, 2013www.societyconsulting.co
m35
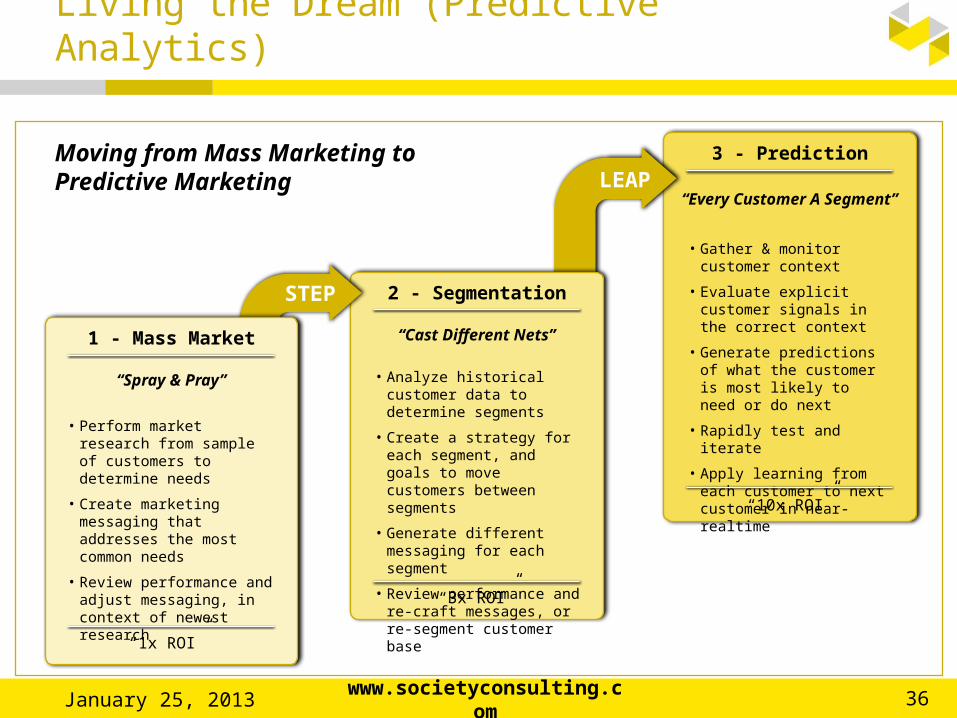
Living the Dream (Predictive Analytics)
Moving from Mass Marketing to Predictive Marketing
“Every Customer A Segment”
3 - Prediction
• Gather & monitor customer context
• Evaluate explicit customer signals in the correct context
• Generate predictions of what the customer is most likely to need or do next
• Rapidly test and iterate
• Apply learning from each customer to next customer in near-realtime
LEAP
“10x ROI”
“Cast Different Nets”
2 - SegmentationSTEP
• Analyze historical customer data to determine segments
• Create a strategy for each segment, and goals to move customers between segments
• Generate different messaging for each segment
• Review performance and re-craft messages, or re-segment customer base
“3x ROI”
“Spray & Pray”
1 - Mass Market
• Perform market research from sample of customers to determine needs
• Create marketing messaging that addresses the most common needs
• Review performance and adjust messaging, in context of newest research
“1x ROI”
36www.societyconsulting.c
omJanuary 25, 2013

• To understand Web Analytics, you have to understand how the data is generated. But don’t get lost among the trees.
• User Identification is an ongoing challenge and should be seen as an area that will require mental bandwidth, creativity, and innovation to get right.
• Don’t take Web Metrics at face value. Get nimble at de-composing them and understanding the underlying trends.
• Optimization (A/B testing) programs take time to develop, but pay off handsomely in the long run. Start learning sooner than later.
• The grand prize when you put everything together is multi-channel, predictive, customer-level analytics. This is the future of business, not just analytics!
In Summary
January 25, 2013www.societyconsulting.co
m37


