44
Learning Analytics Primer Navigating the Scope of Disruptive Analytics Solutions to Deliver Maximum Impact Mike Rustici watershedLRS.com @mikerustici
| Date post: | 22-Jan-2018 |
| Category: |
Data & Analytics |
| Upload: | watershed |
| View: | 156 times |
| Download: | 3 times |
Learning Analytics PrimerNavigating the Scope of Disruptive Analytics
Solutions to Deliver Maximum Impact
Mike RusticiwatershedLRS.com
@mikerustici
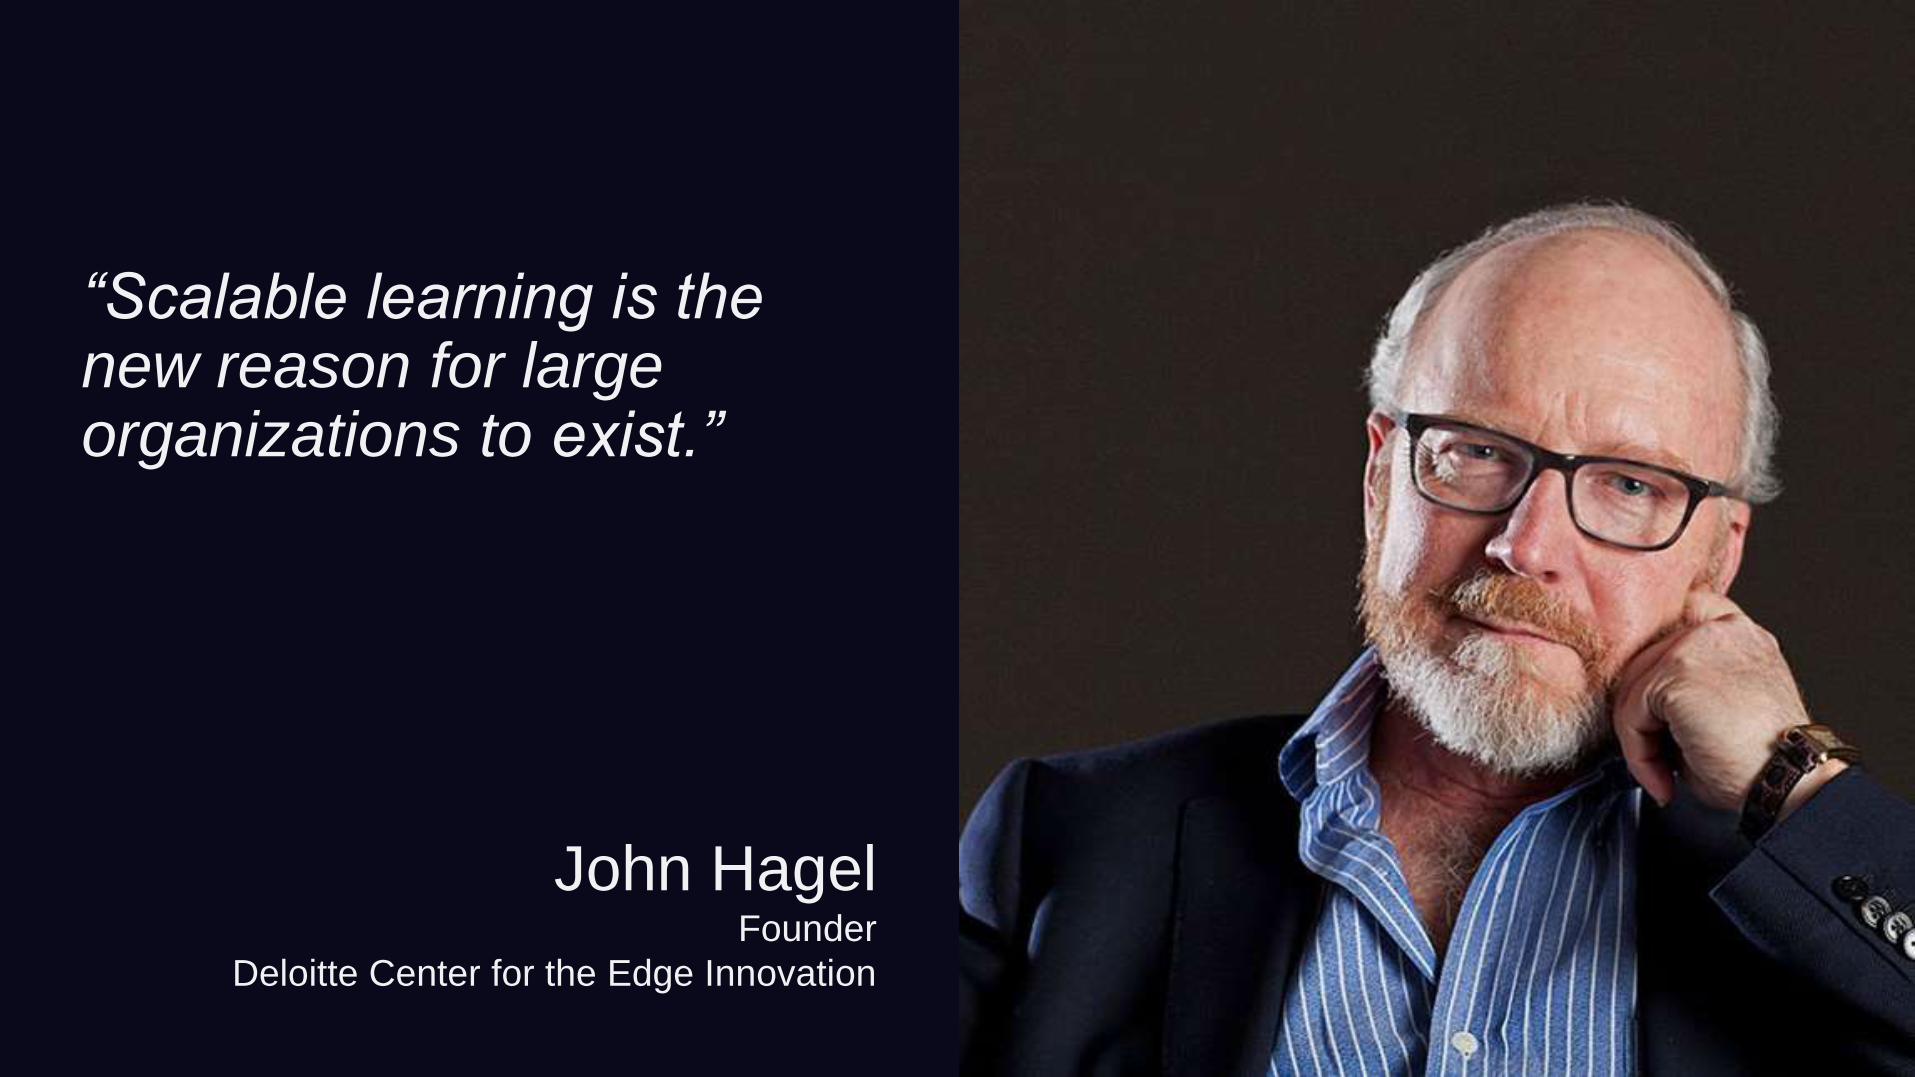
“Scalable learning is the new reason for large organizations to exist.”
John HagelFounder
Deloitte Center for the Edge Innovation
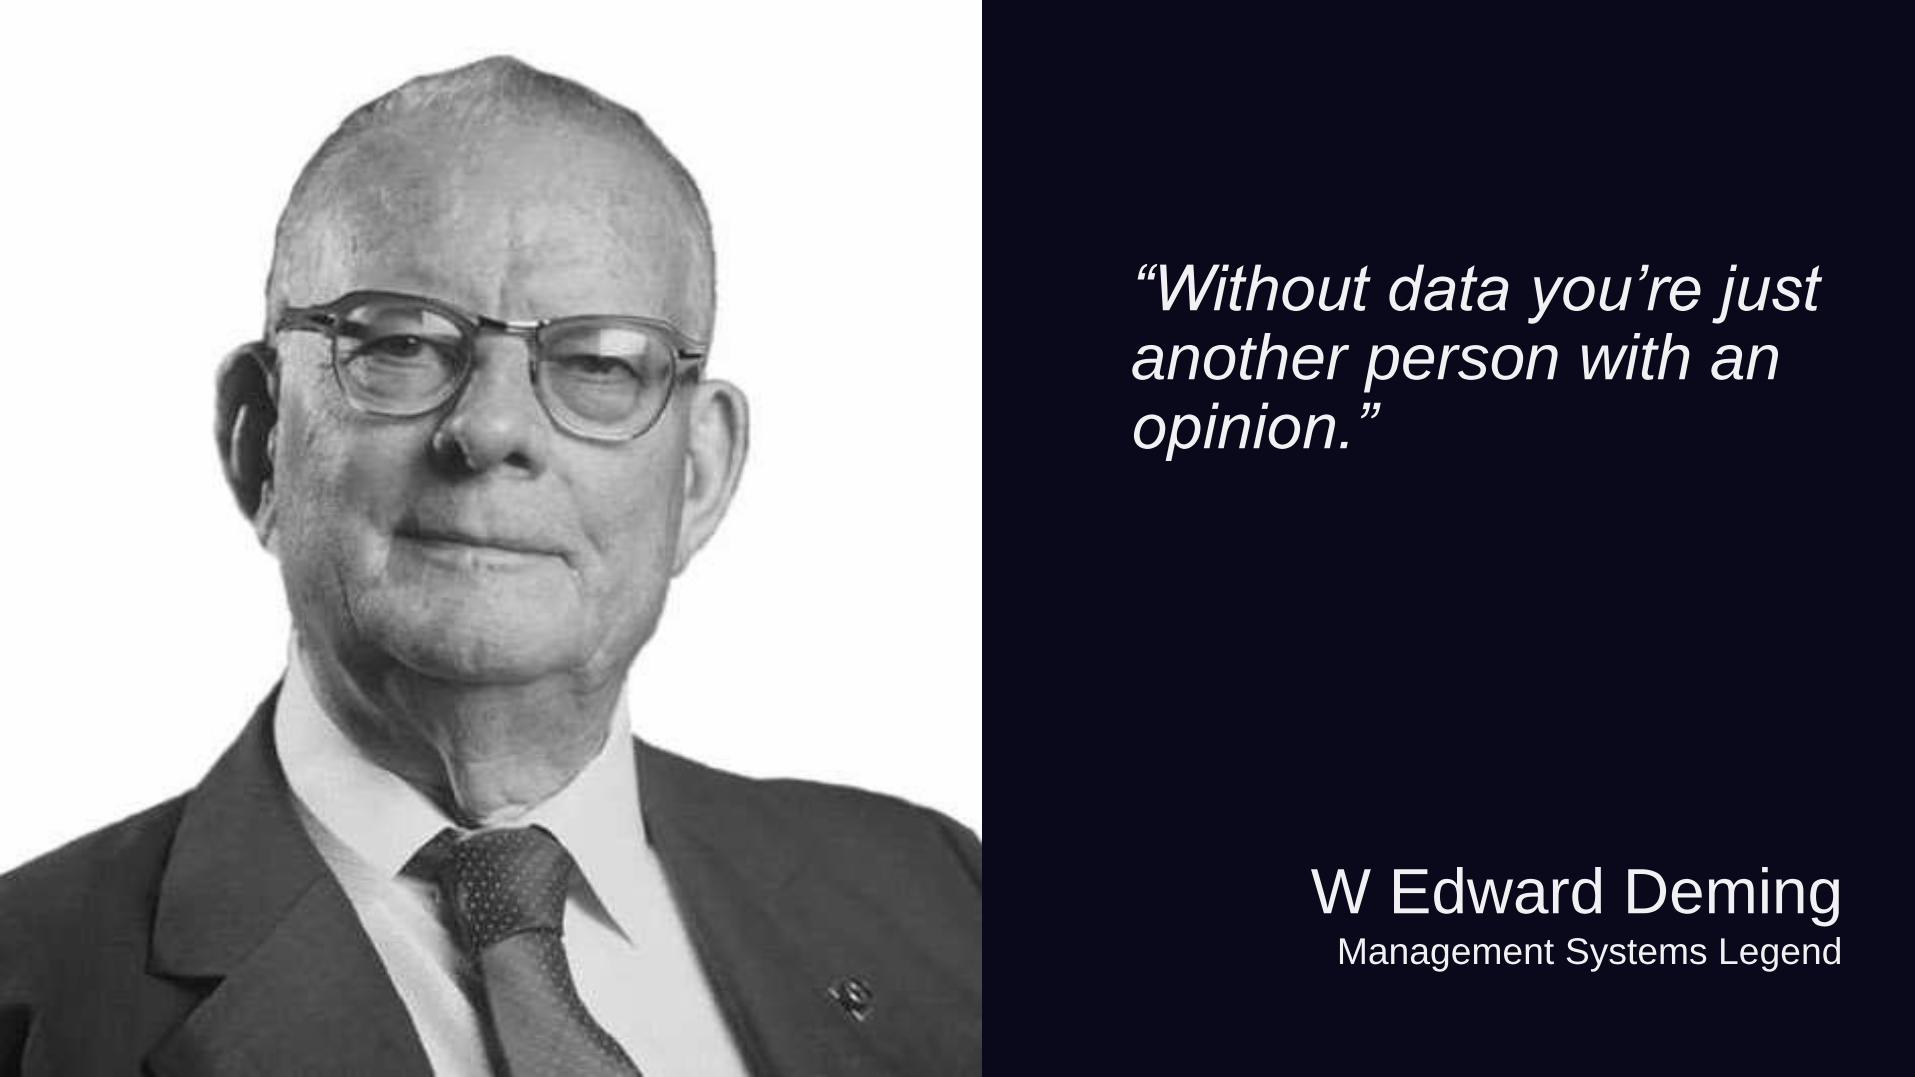
“Without data you’re just another person with an opinion.”
W Edward DemingManagement Systems Legend
“L&D is responsible for improving our most
important asset, our people. If we can
improve L&D, we can improve the world.”
MeI said that

measurementsurvey
page
05
14%
Not effective
at measuring
formal
learning
43%
Not effective
at measuring
experiential
learning
51%
Not effective
at measuring
informal
learning
Source: Measuring the ROI of Informal Learning, Brandon Hall, 2015
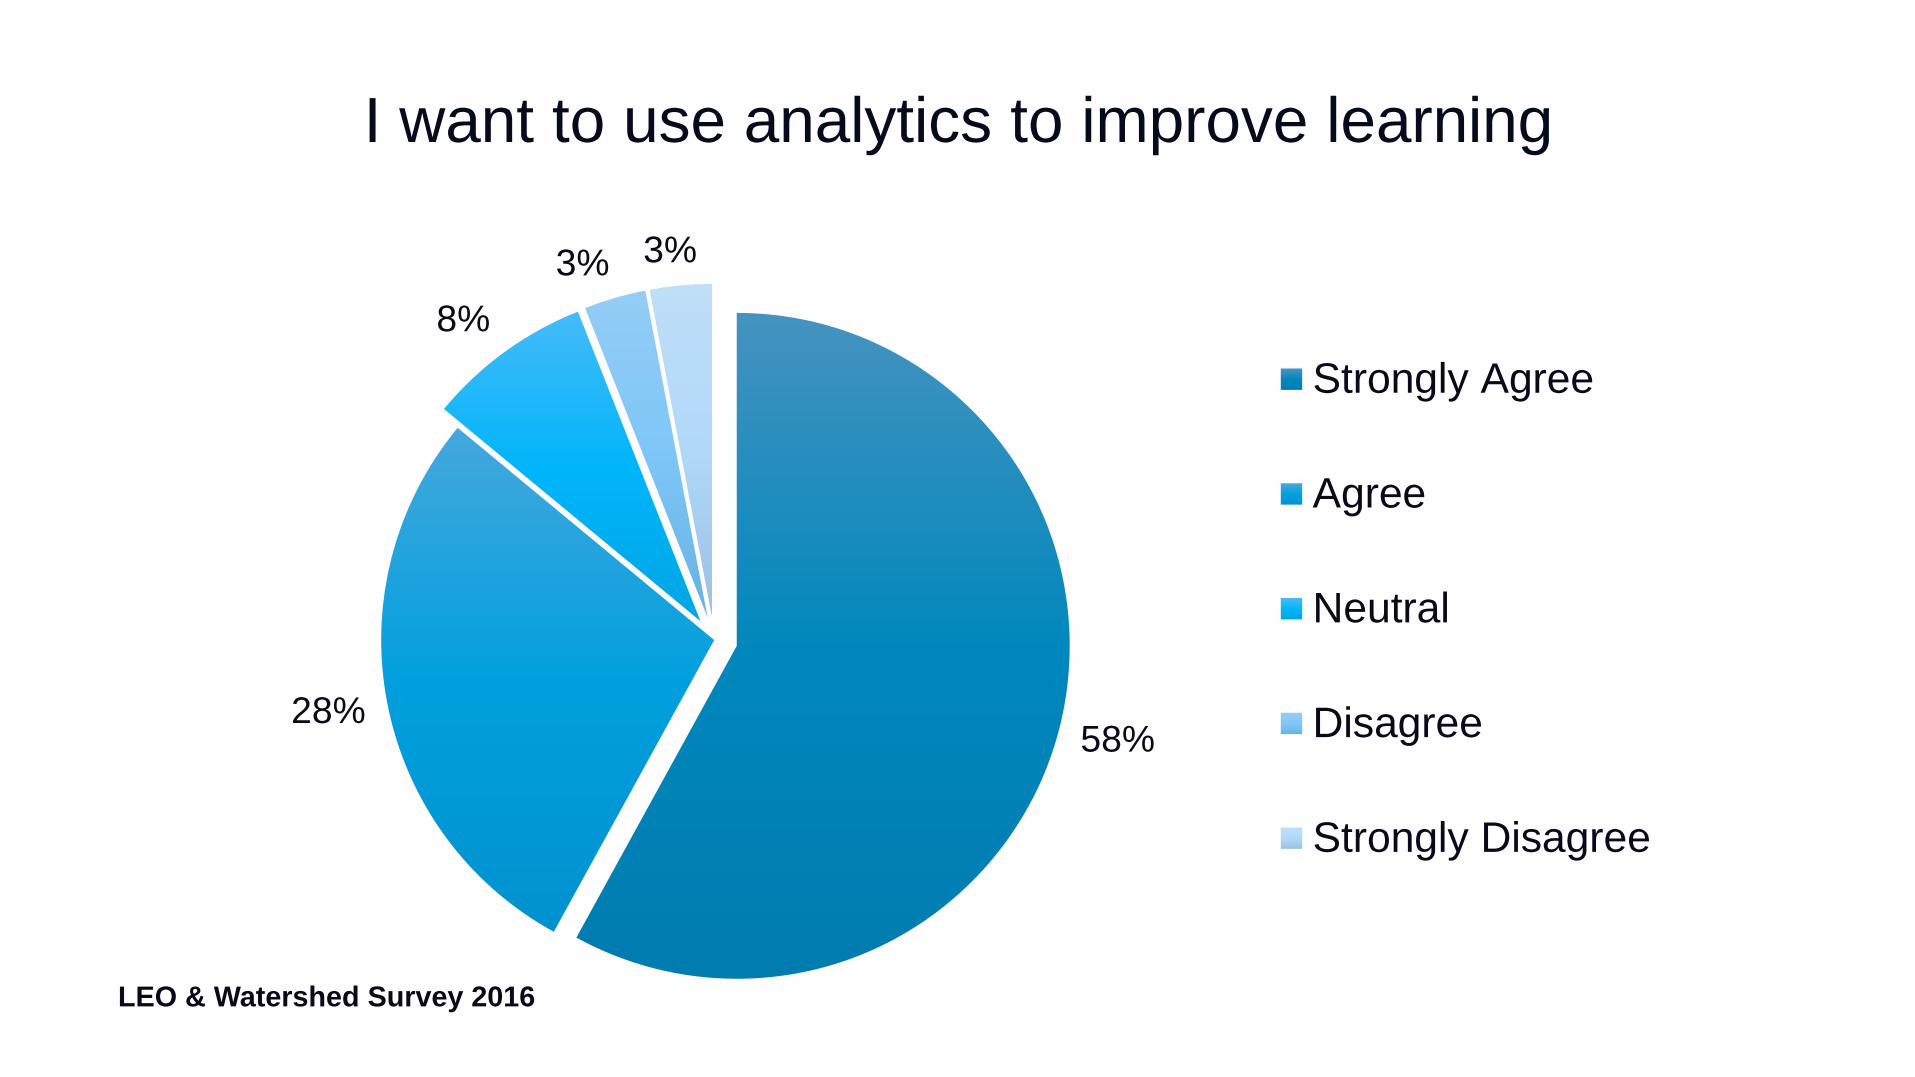
I want to use analytics to improve learning
58%28%
8%
3% 3%
LEO & Watershed Survey 2016
Strongly Agree
Agree
Neutral
Disagree
Strongly Disagree
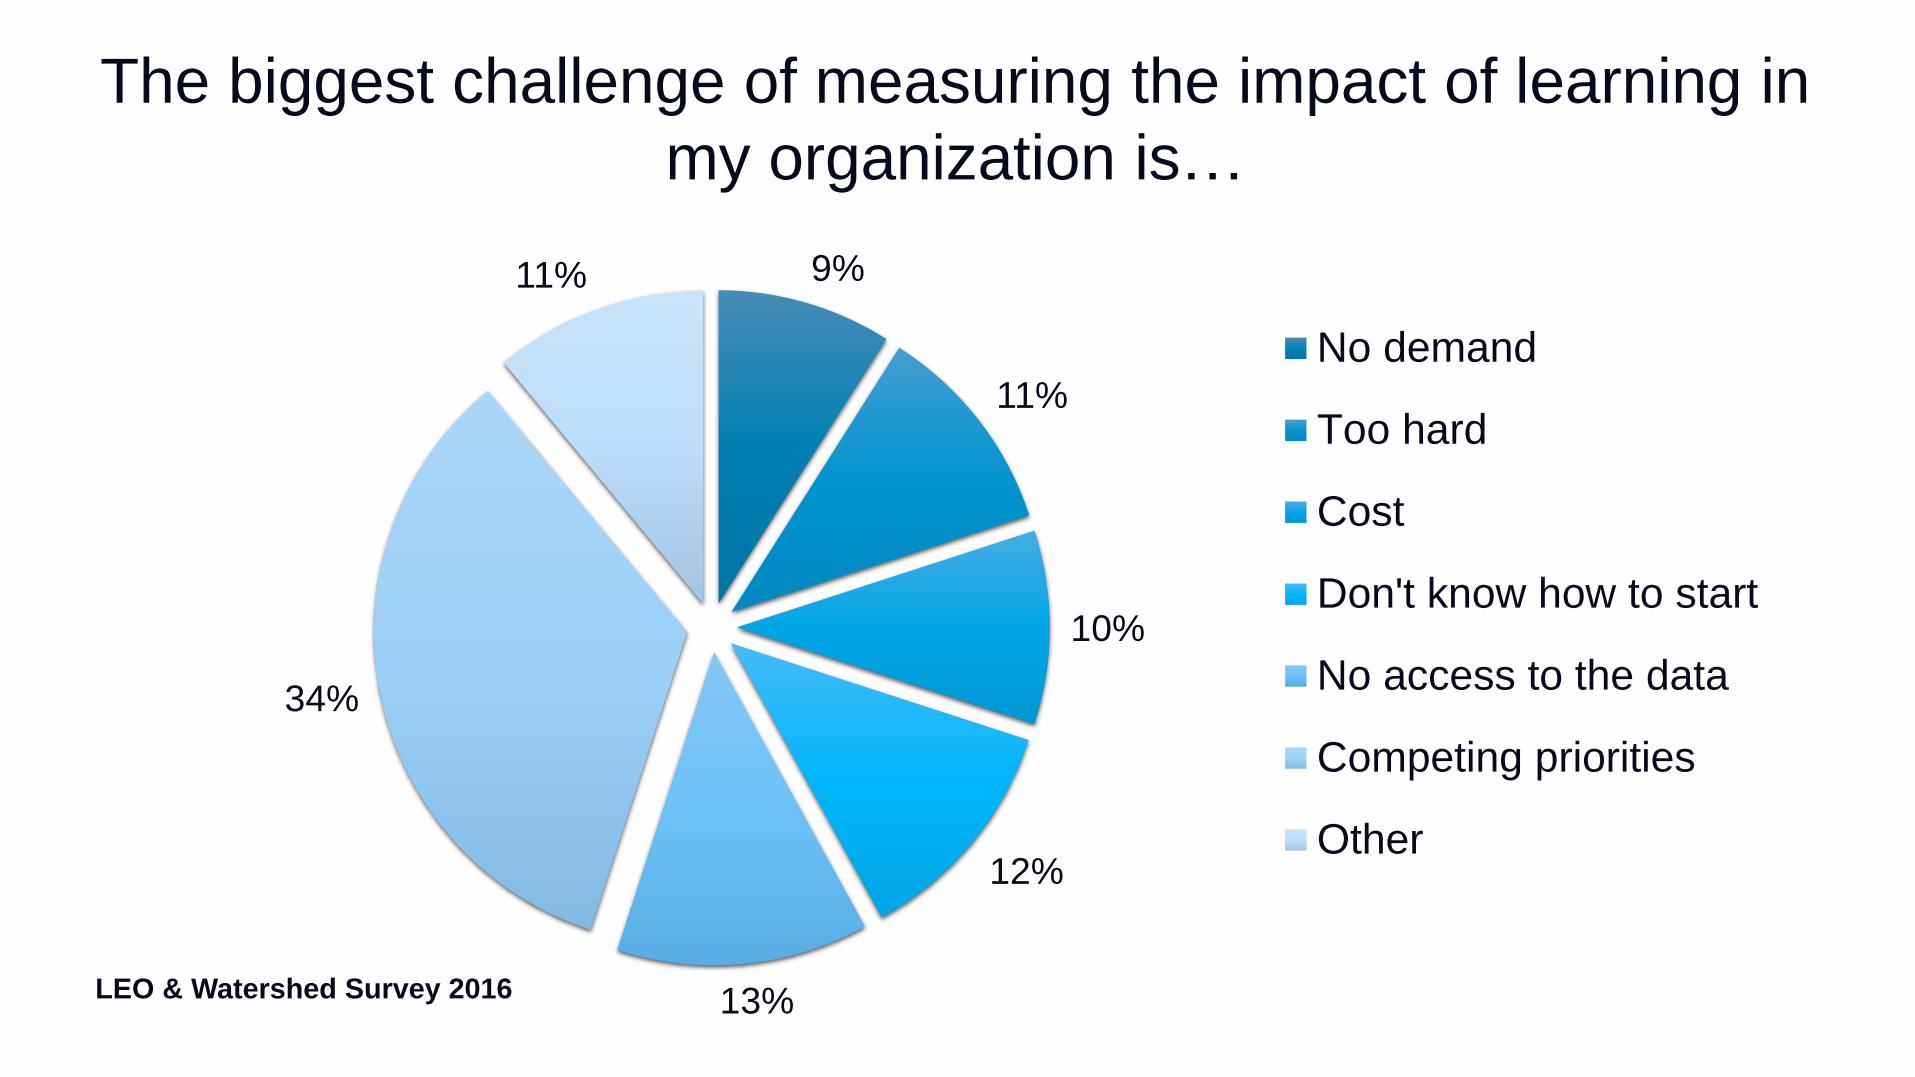
The biggest challenge of measuring the impact of learning in
my organization is…
9%
11%
10%
12%
13%
34%
11%
LEO & Watershed Survey 2016
No demand
Too hard
Cost
Don't know how to start
No access to the data
Competing priorities
Other
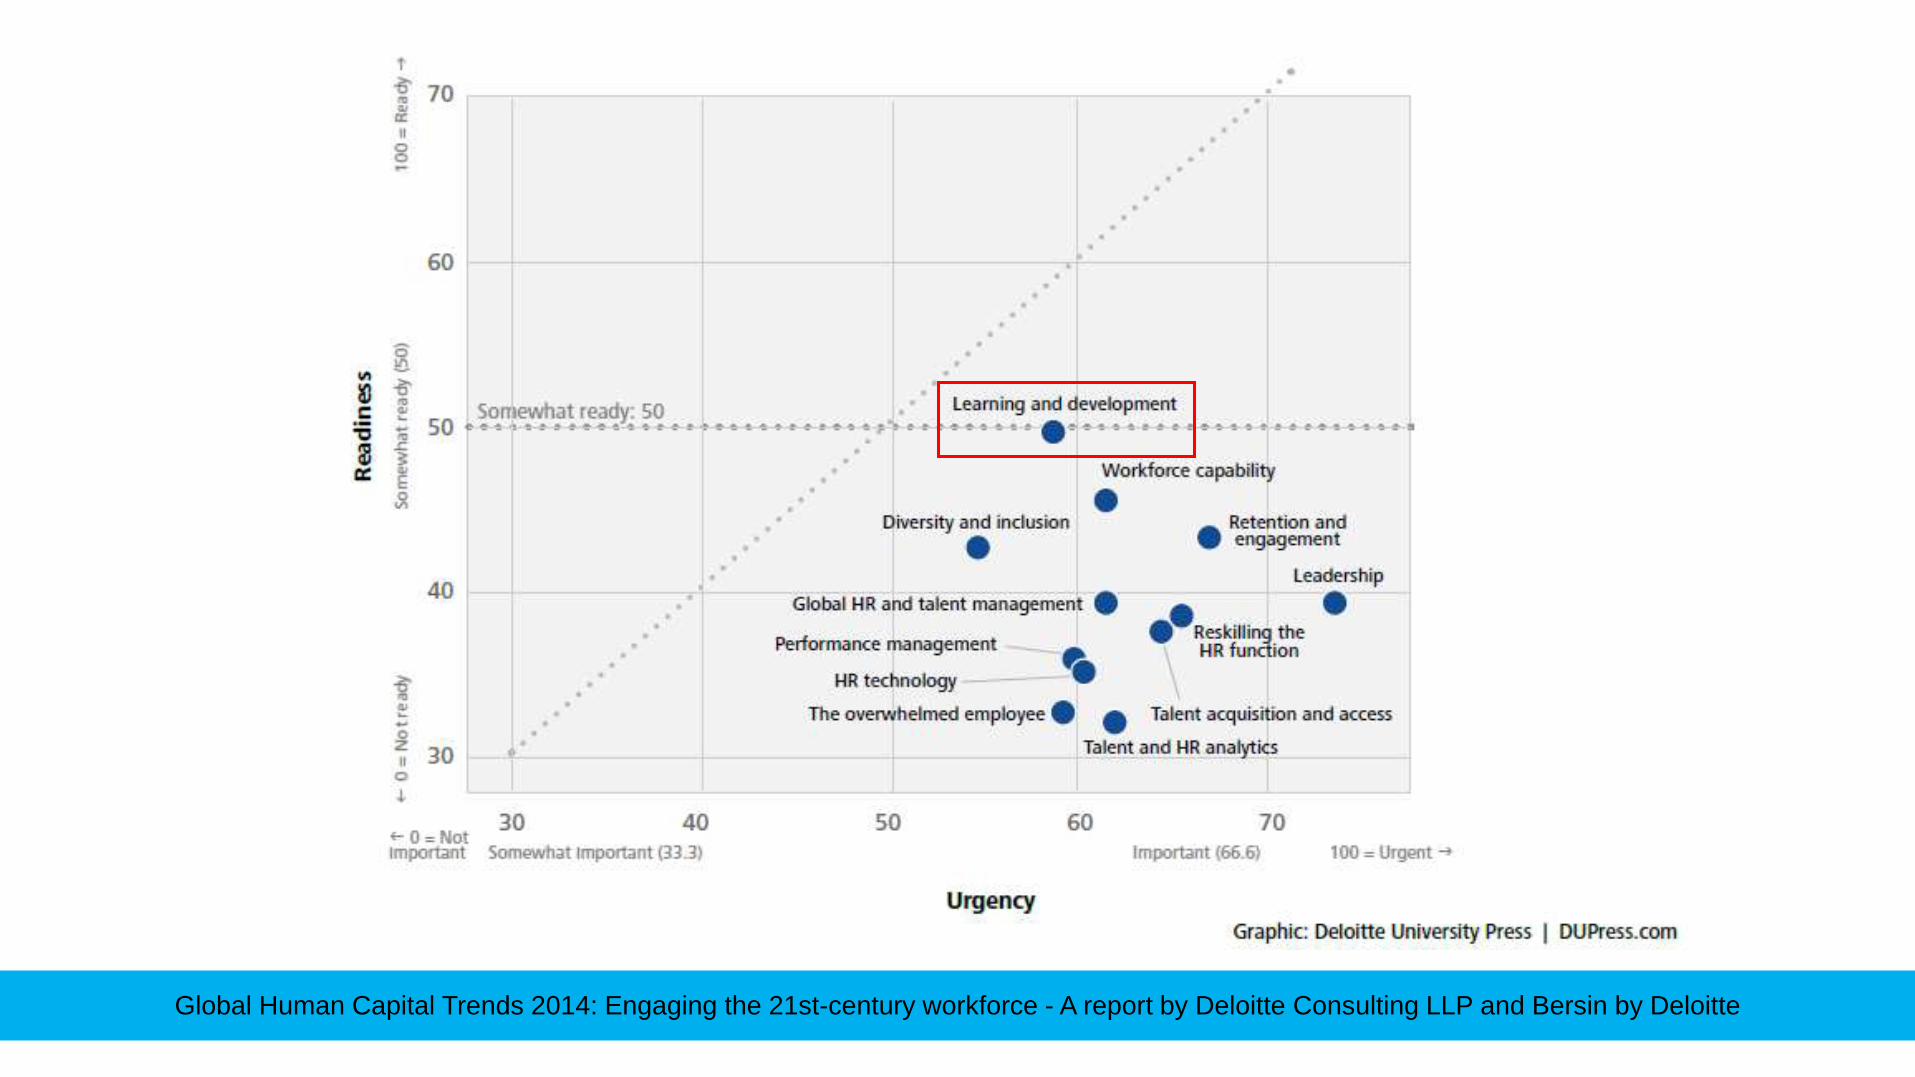
Global Human Capital Trends 2014: Engaging the 21st-century workforce - A report by Deloitte Consulting LLP and Bersin by Deloitte
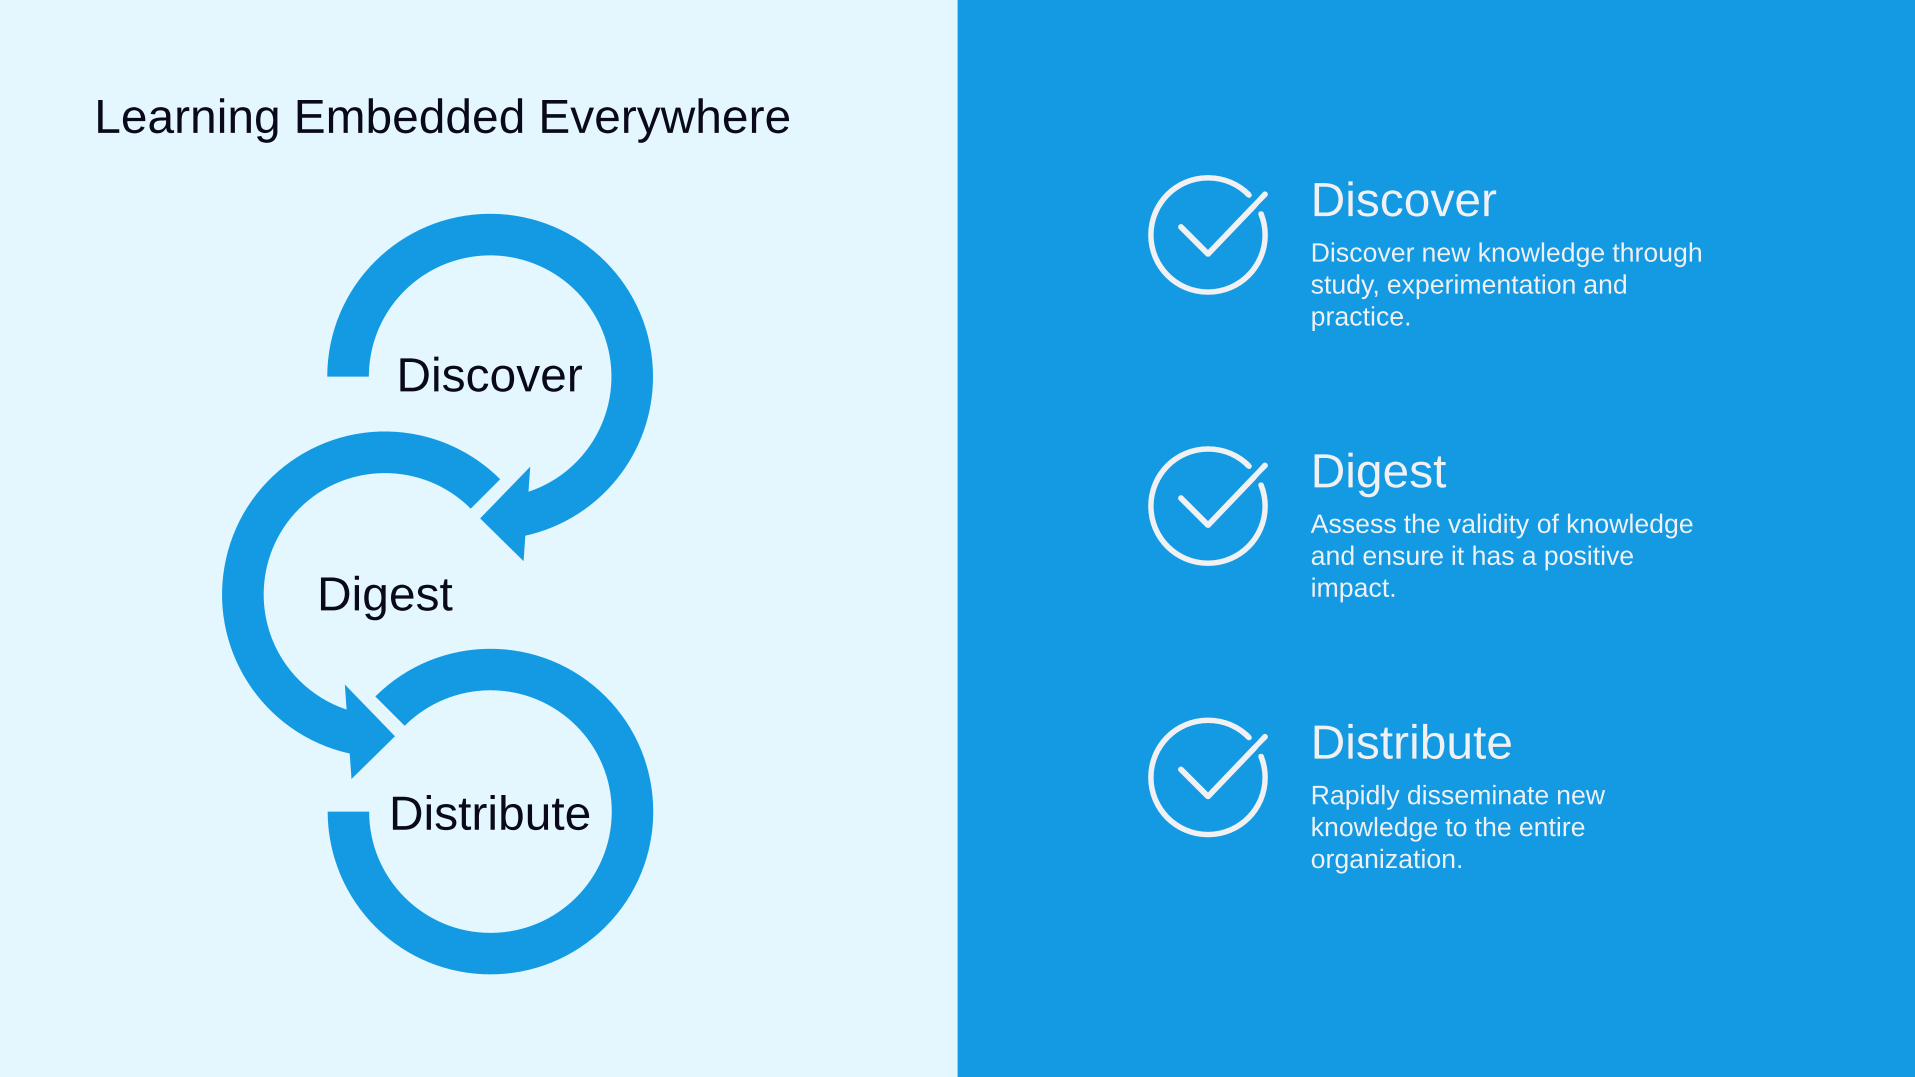
DiscoverDiscover new knowledge through
study, experimentation and
practice.
DigestAssess the validity of knowledge
and ensure it has a positive
impact.
DistributeRapidly disseminate new
knowledge to the entire
organization.
Discover
Digest
Distribute
Learning Embedded Everywhere
askyourself
Are your learning systems going
to
get you there?
isn’t itbecause…
Small moves, smartly made
“In an exponential world, small moves,
smartly made can set big changes in motion.”
– John Hagel
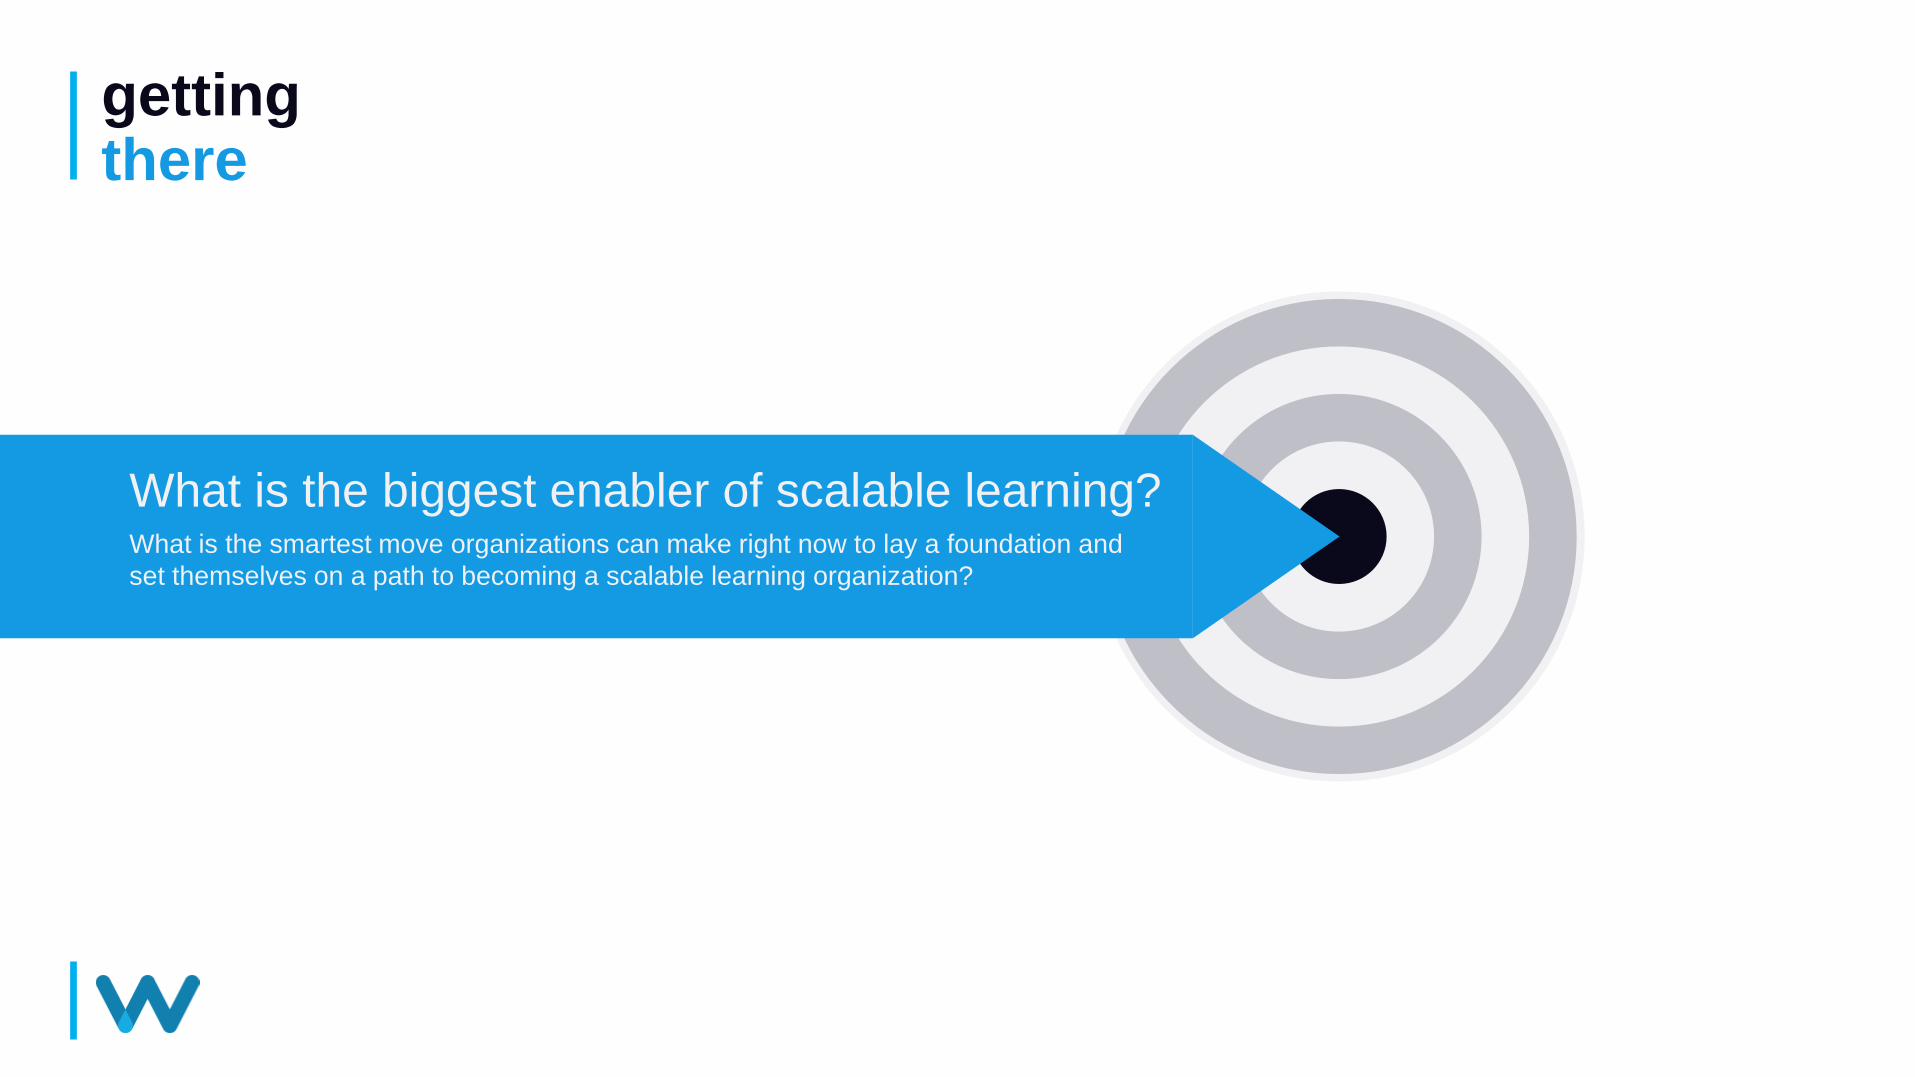
getting there
What is the smartest move organizations can make right now to lay a foundation and
set themselves on a path to becoming a scalable learning organization?
What is the biggest enabler of scalable learning?
© Watershed Systems, Inc 2017
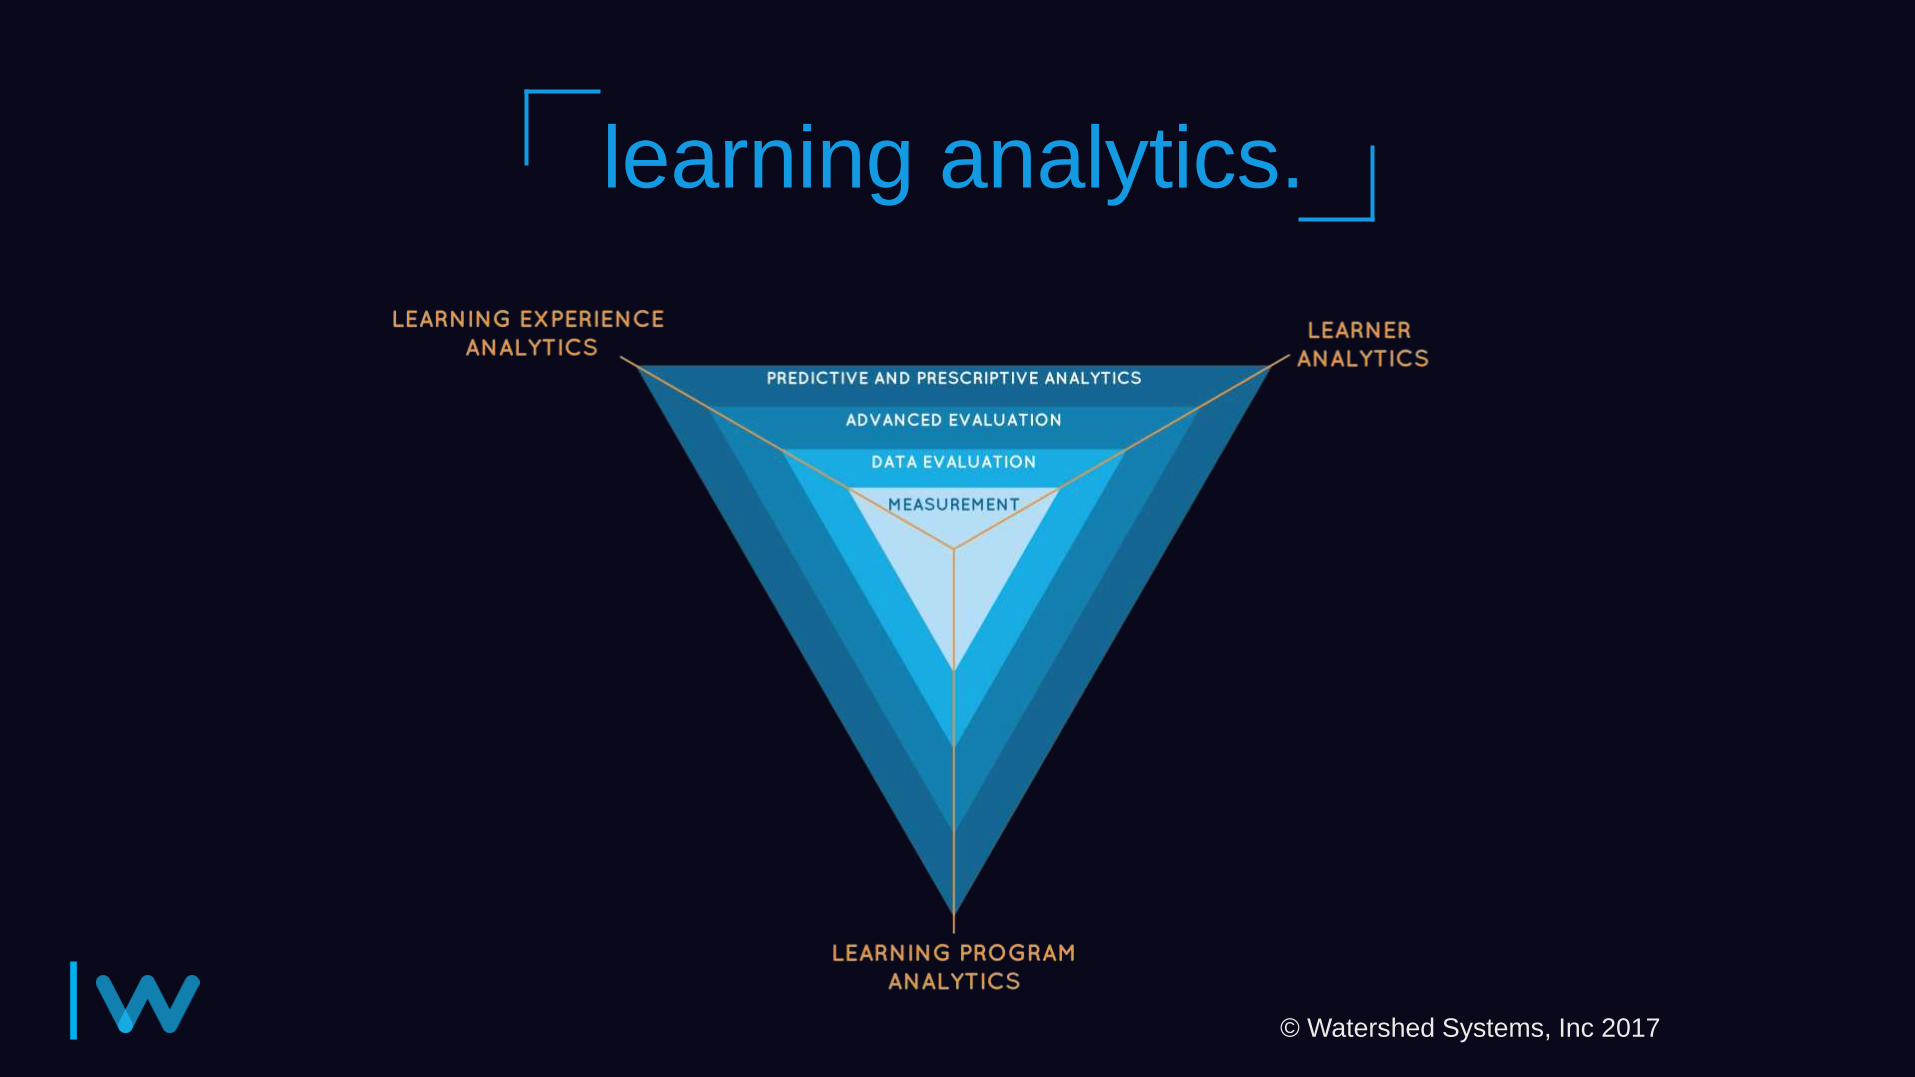
learning analytics.
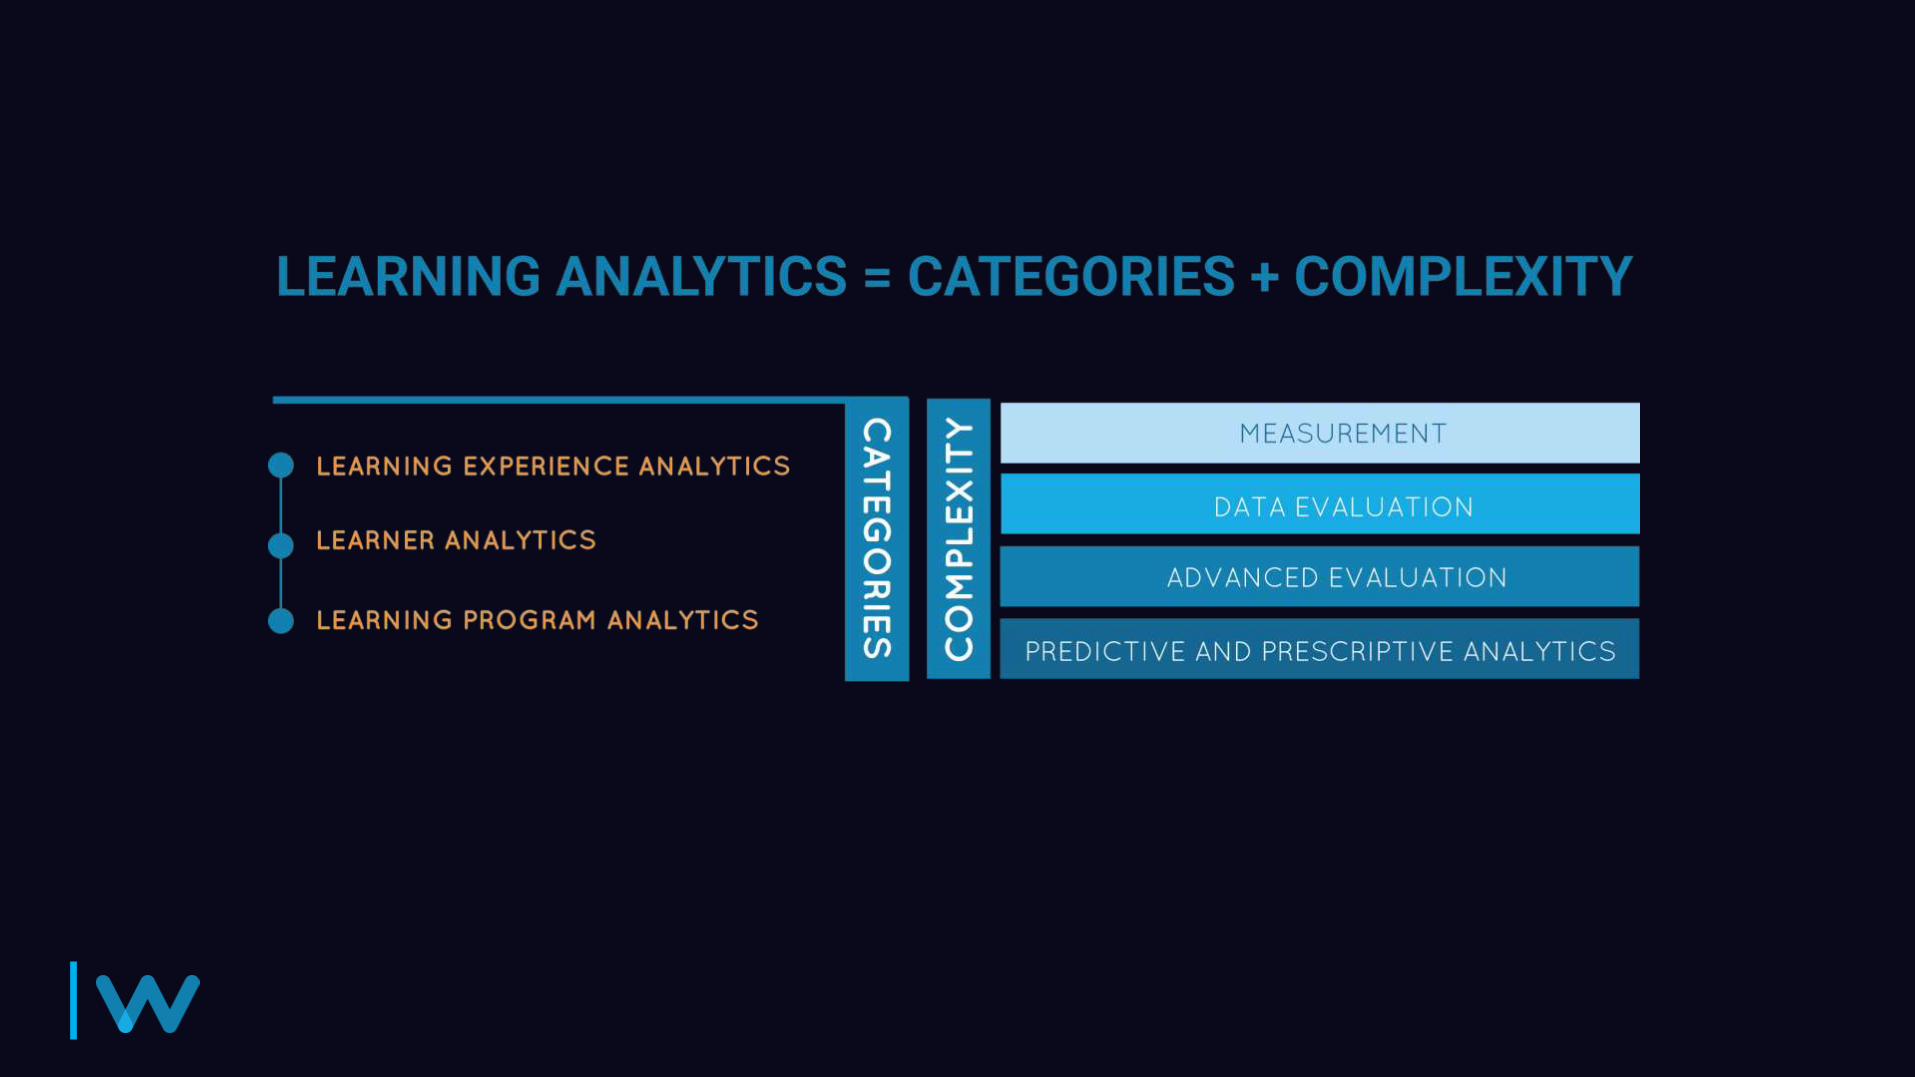
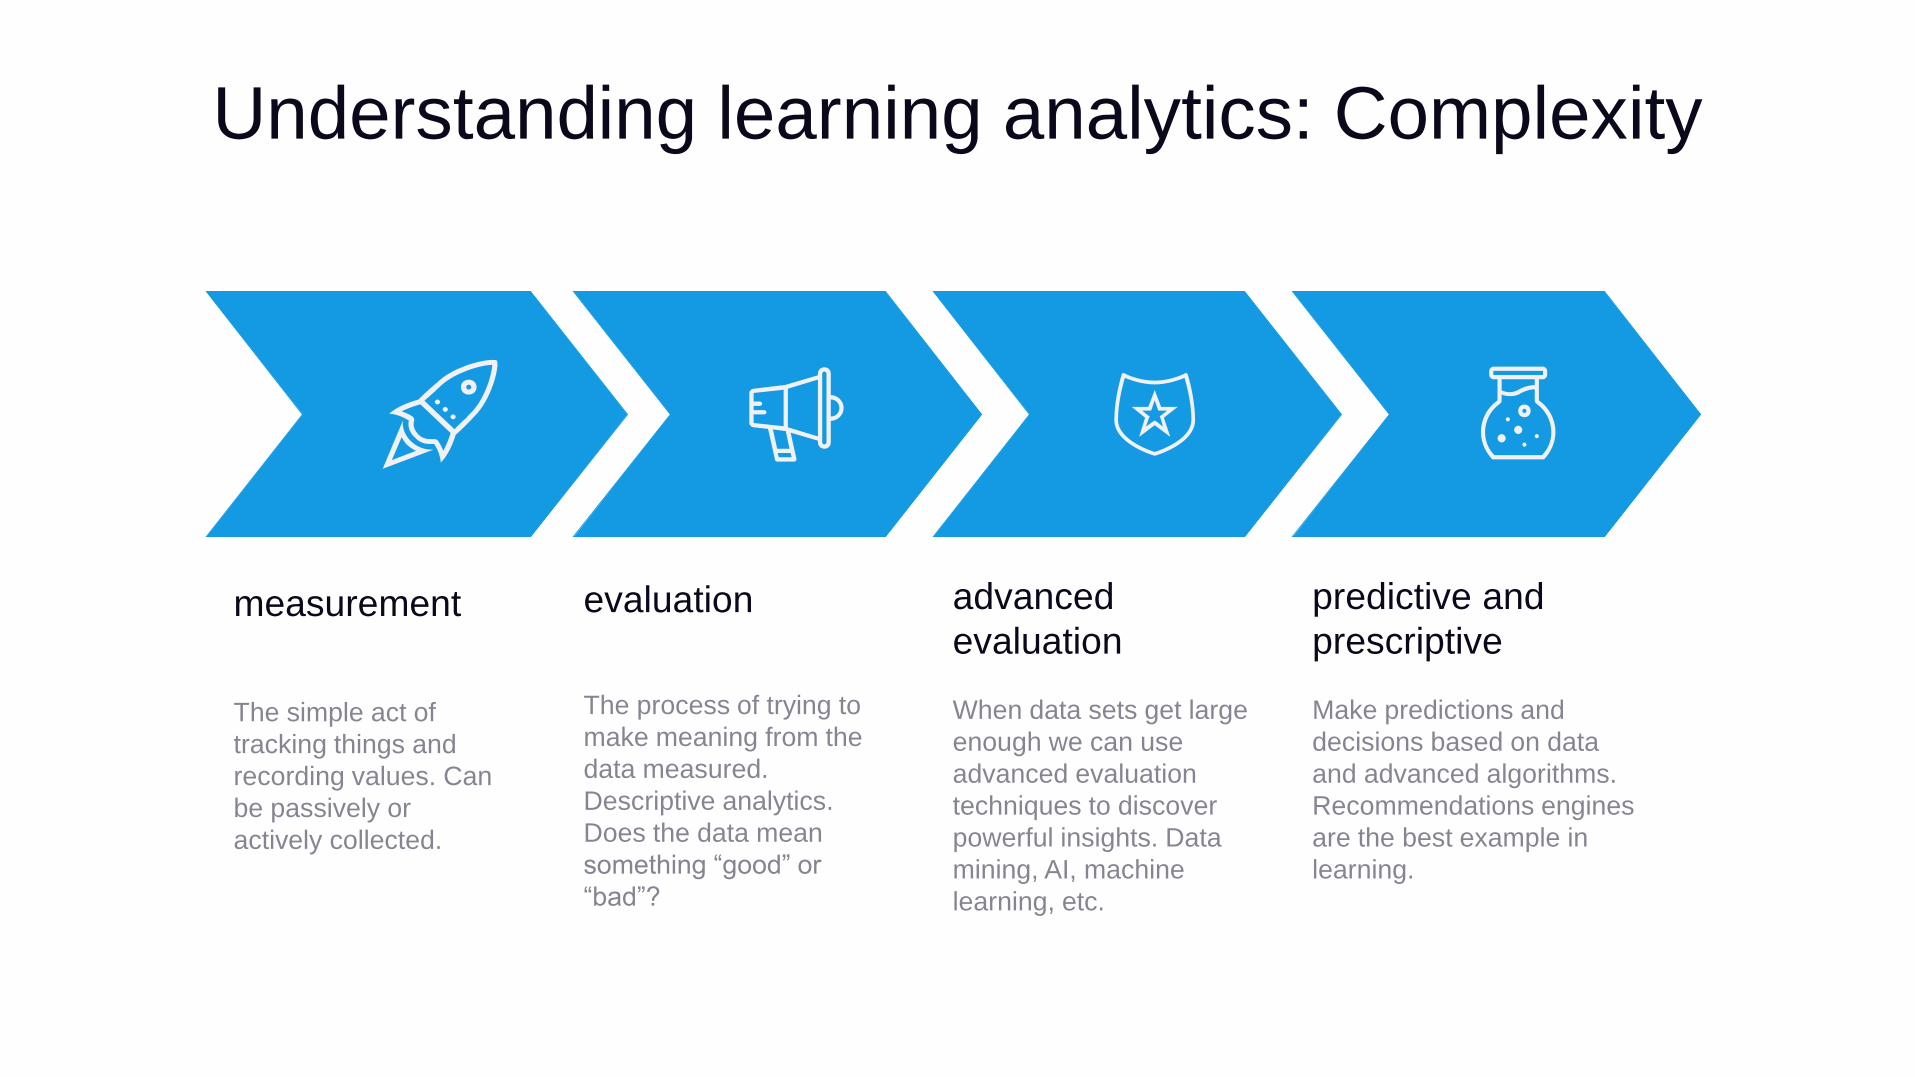
Understanding learning analytics: Complexity
measurement
The simple act of
tracking things and
recording values. Can
be passively or
actively collected.
evaluation
The process of trying to
make meaning from the
data measured.
Descriptive analytics.
Does the data mean
something “good” or
“bad”?
advanced
evaluation
When data sets get large
enough we can use
advanced evaluation
techniques to discover
powerful insights. Data
mining, AI, machine
learning, etc.
predictive and
prescriptive
Make predictions and
decisions based on data
and advanced algorithms.
Recommendations engines
are the best example in
learning.
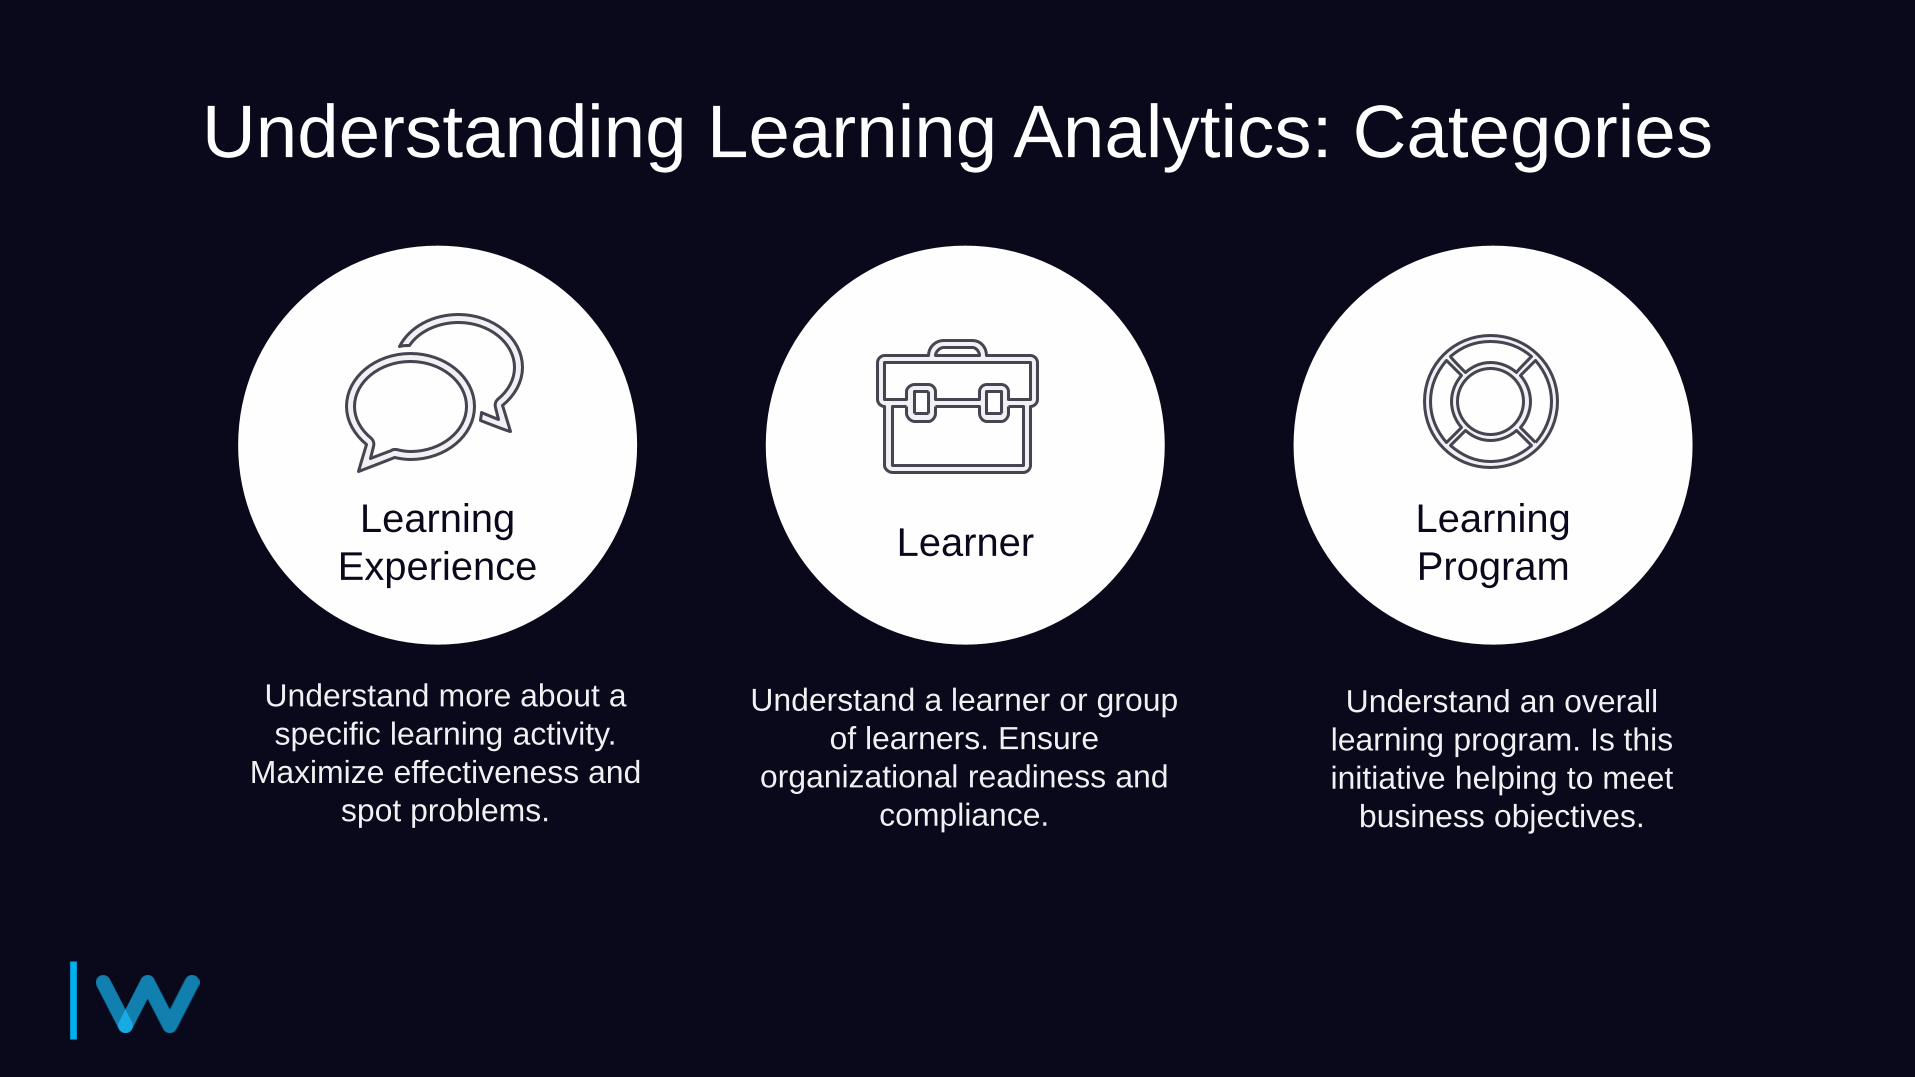
Learning
ExperienceLearner
Learning
Program
Understanding Learning Analytics: Categories
Understand an overall
learning program. Is this
initiative helping to meet
business objectives.
Understand a learner or group
of learners. Ensure
organizational readiness and
compliance.
Understand more about a
specific learning activity.
Maximize effectiveness and
spot problems.
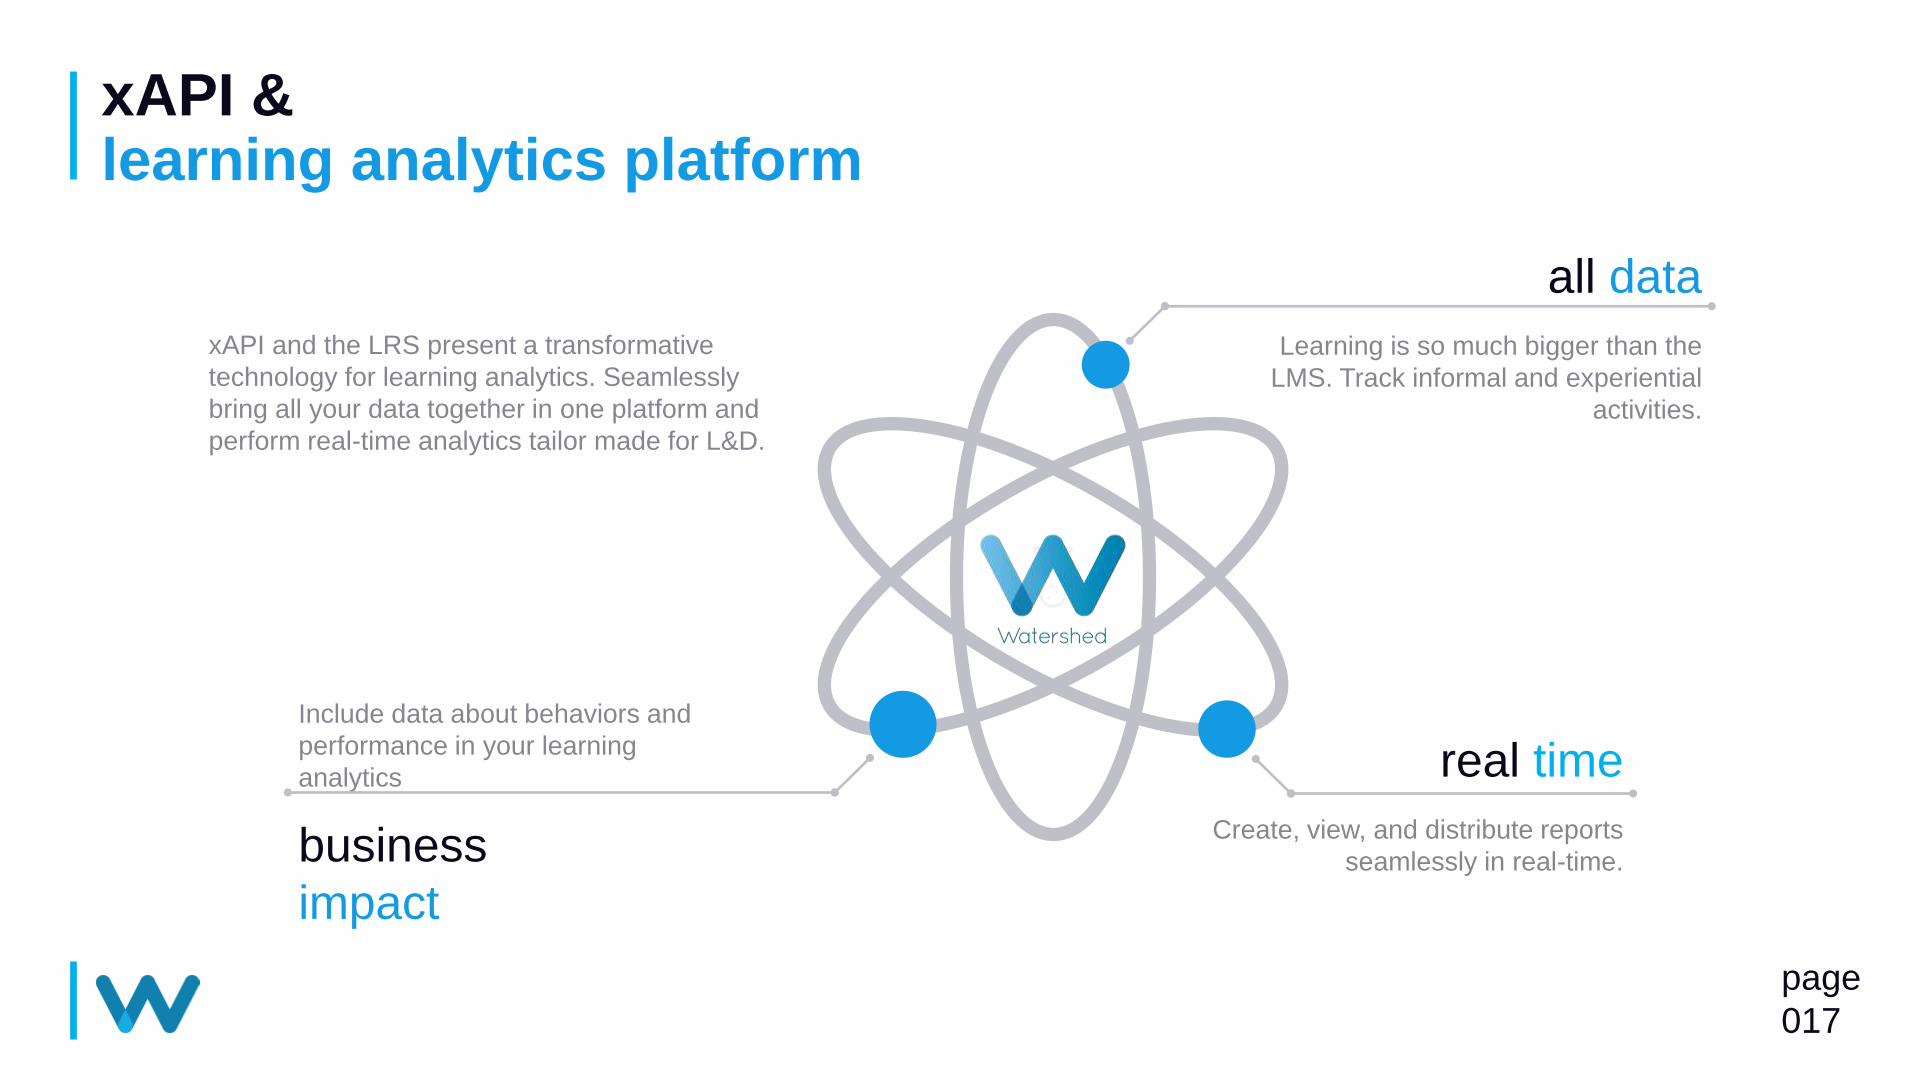
xAPI &learning analytics platform
page
017
all data
Learning is so much bigger than the
LMS. Track informal and experiential
activities.
xAPI and the LRS present a transformative
technology for learning analytics. Seamlessly
bring all your data together in one platform and
perform real-time analytics tailor made for L&D.
business
impact
Include data about behaviors and
performance in your learning
analytics real time
Create, view, and distribute reports
seamlessly in real-time.
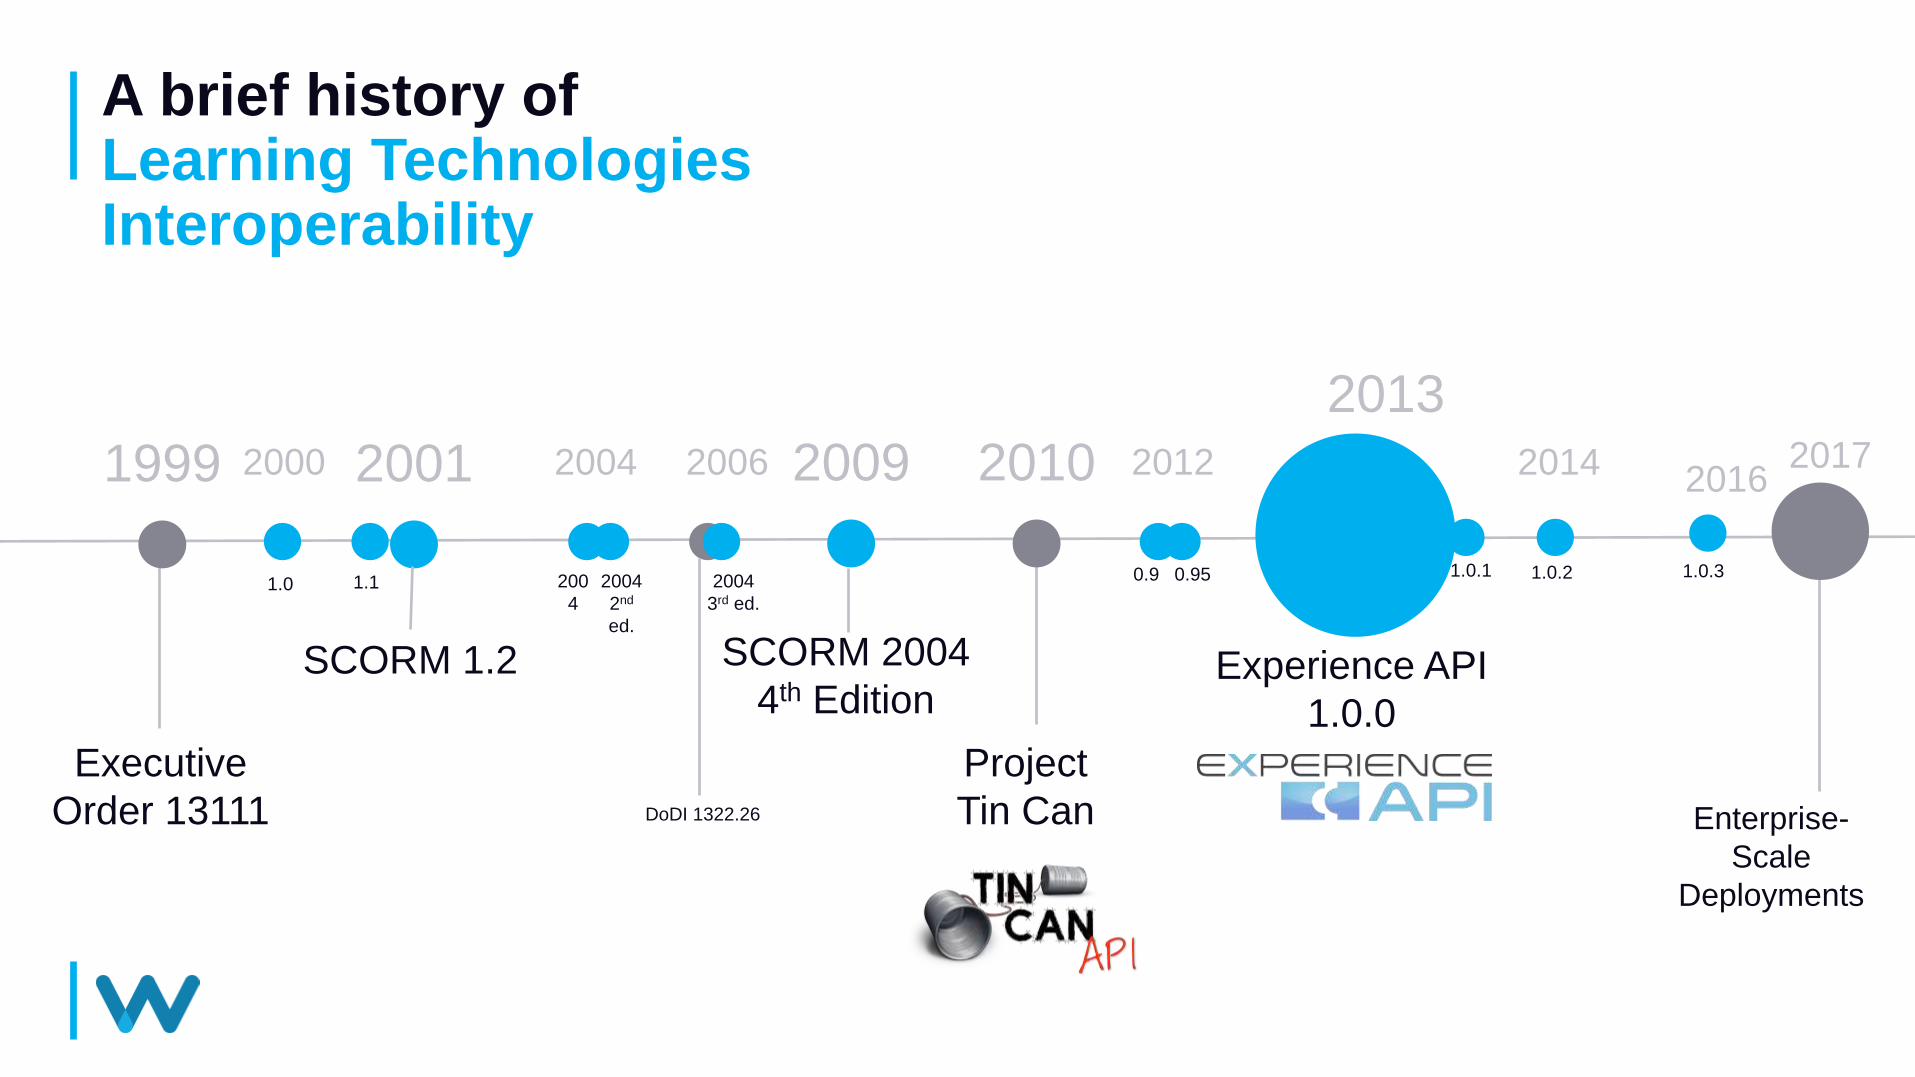
A brief history ofLearning Technologies Interoperability
SCORM 1.2
2001
Executive
Order 13111
1999
SCORM 2004
4th Edition
2009
Project
Tin Can
20102004 2006
2013
Experience API
1.0.0
2012 2014 20172000
1.0 1.1 200
4
2004
2nd
ed.
2004
3rd ed.
DoDI 1322.26 Enterprise-
Scale
Deployments
1.0.1 1.0.2 1.0.30.9 0.95
2016
Five steps to get started with Learning Analytics
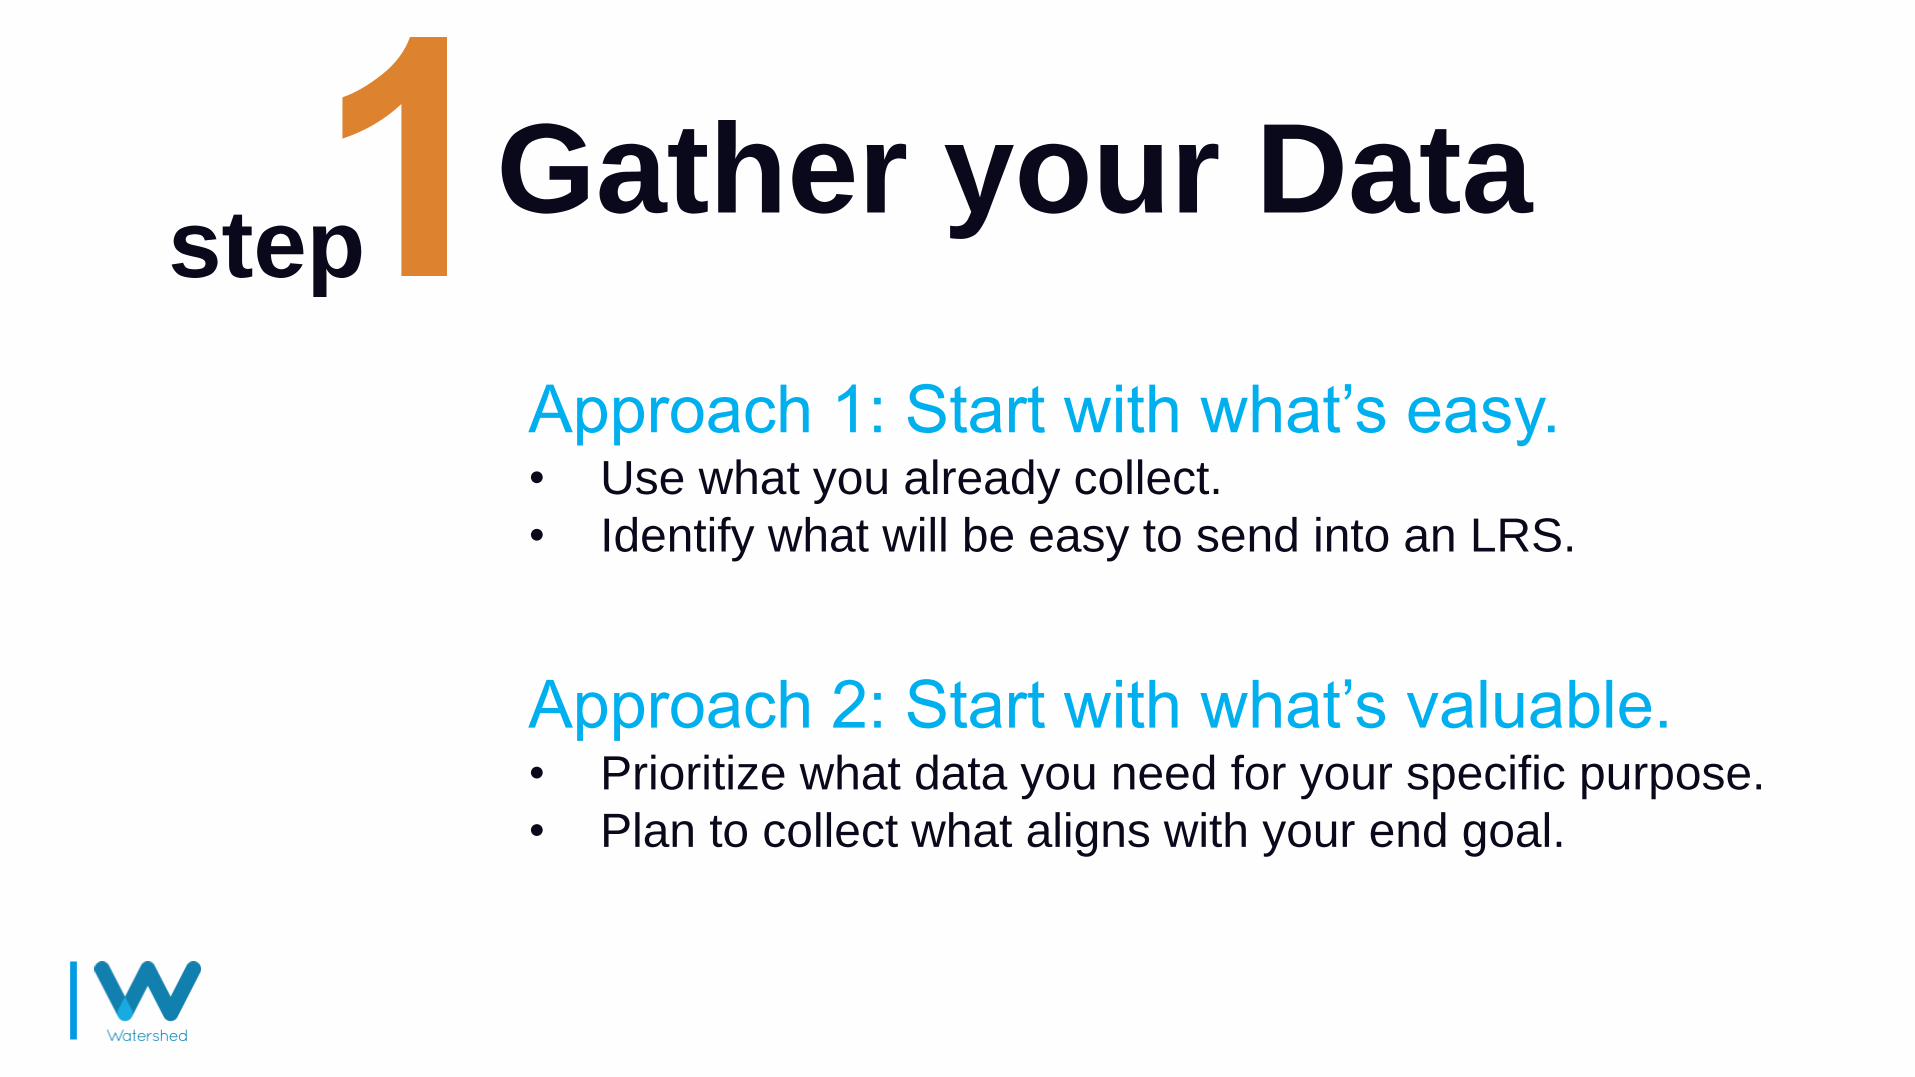
Gather your Data
Approach 1: Start with what’s easy.• Use what you already collect.
• Identify what will be easy to send into an LRS.
step
Approach 2: Start with what’s valuable.• Prioritize what data you need for your specific purpose.
• Plan to collect what aligns with your end goal.
step
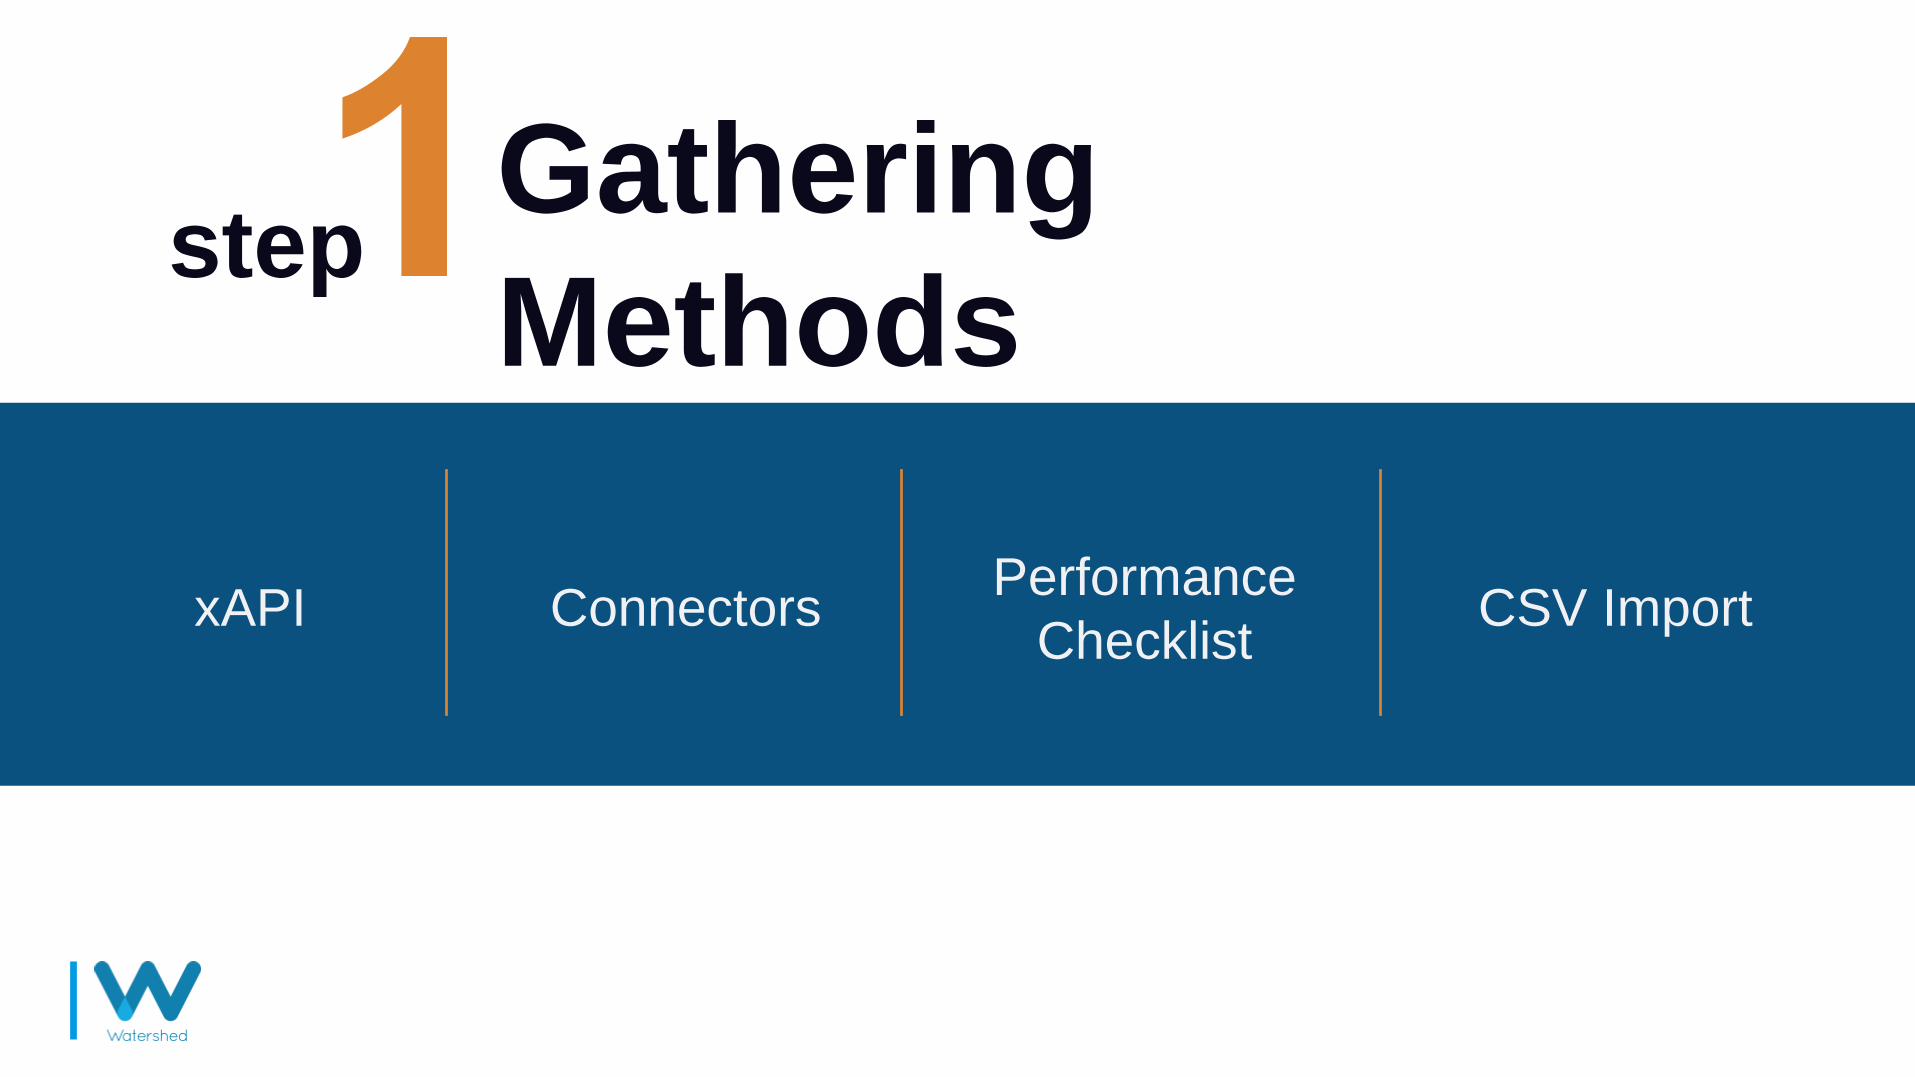
Gathering
Methodsstep
Performance
ChecklistConnectorsxAPI CSV Import
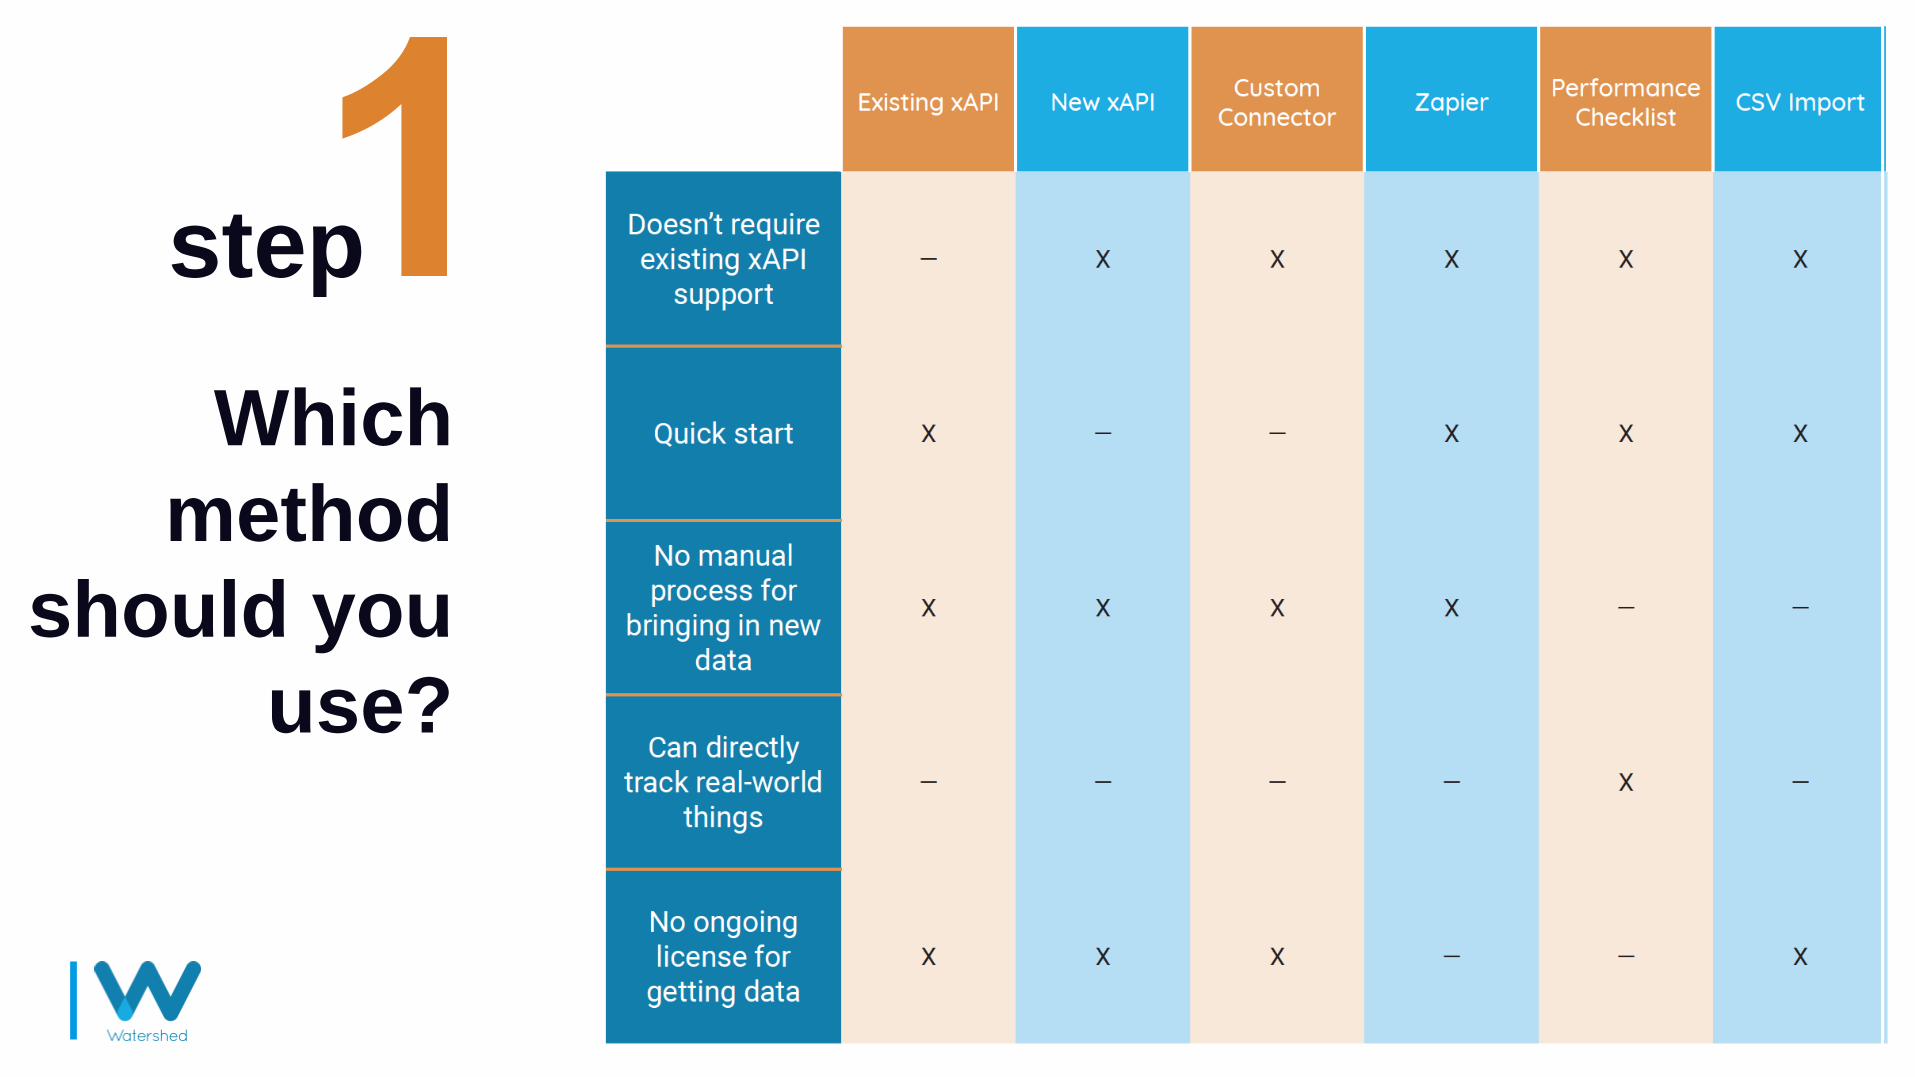
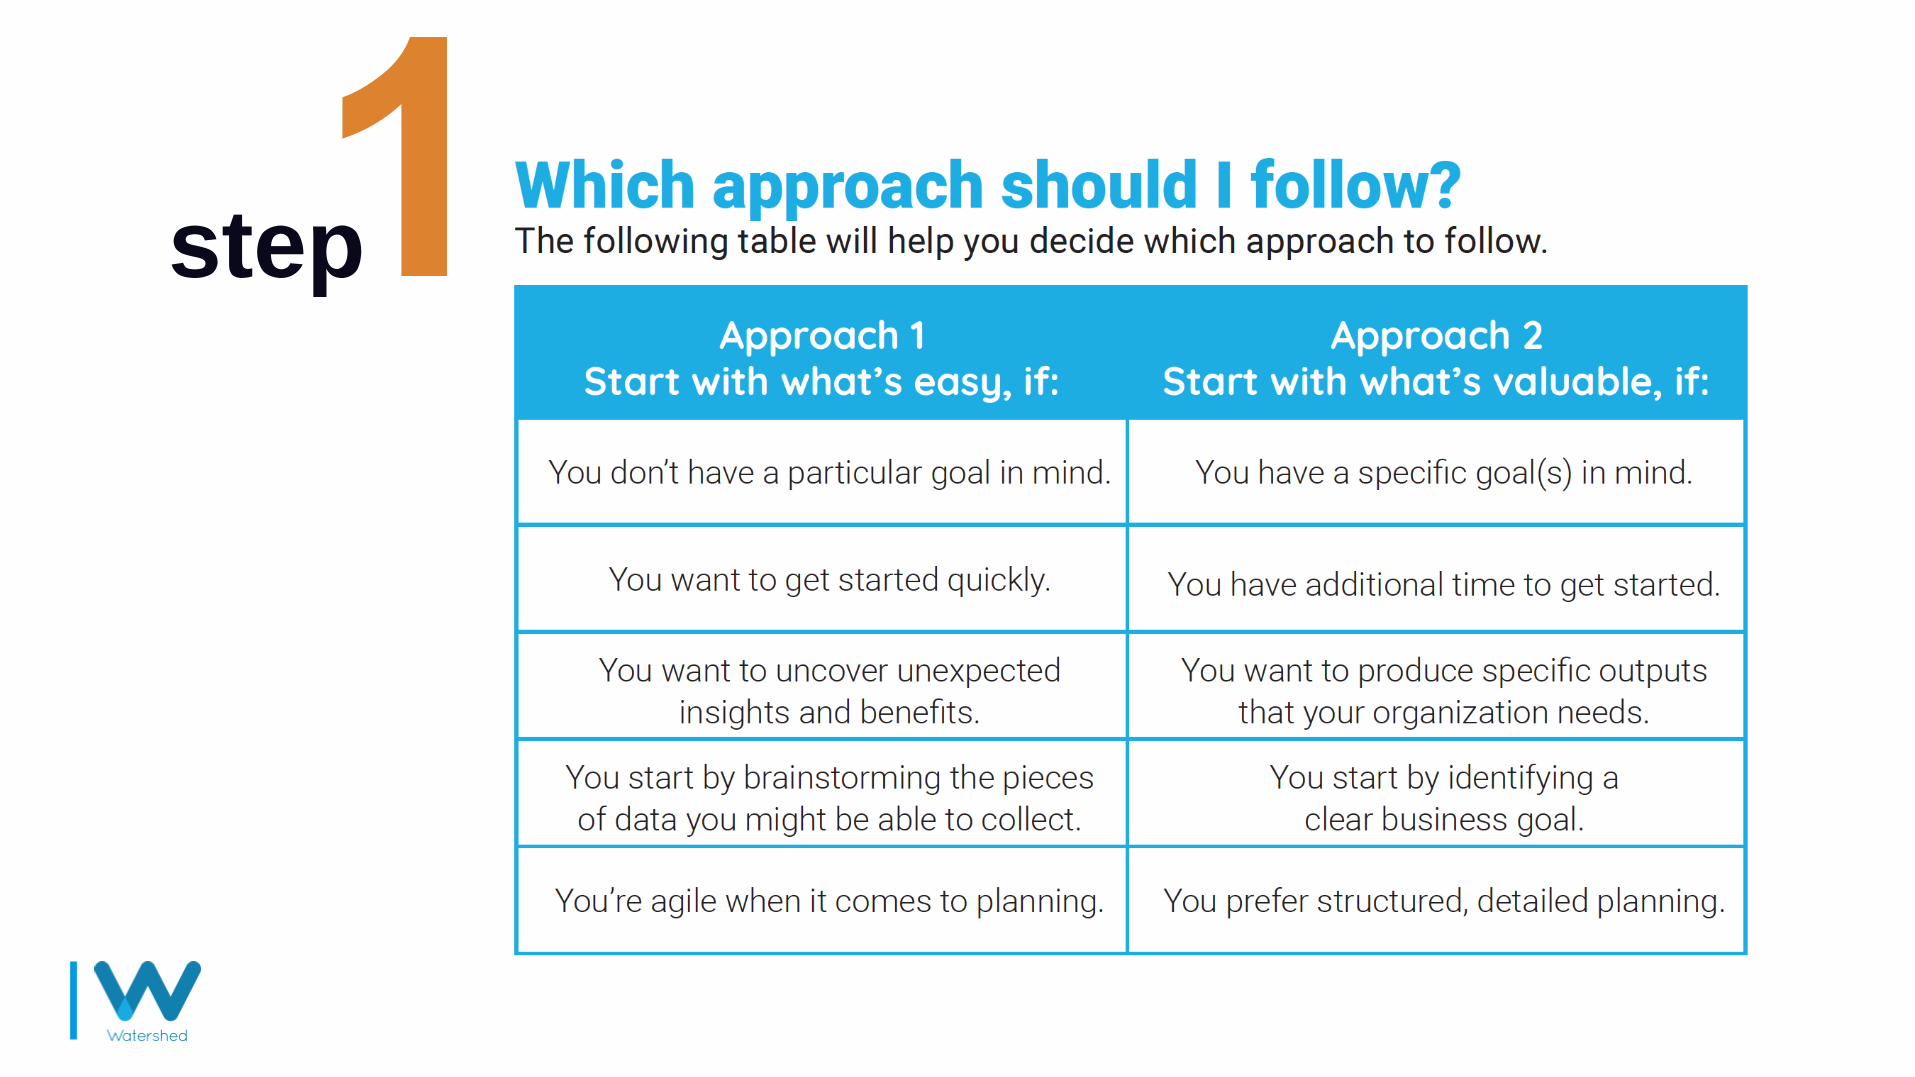
Which
method
should you
use?
step
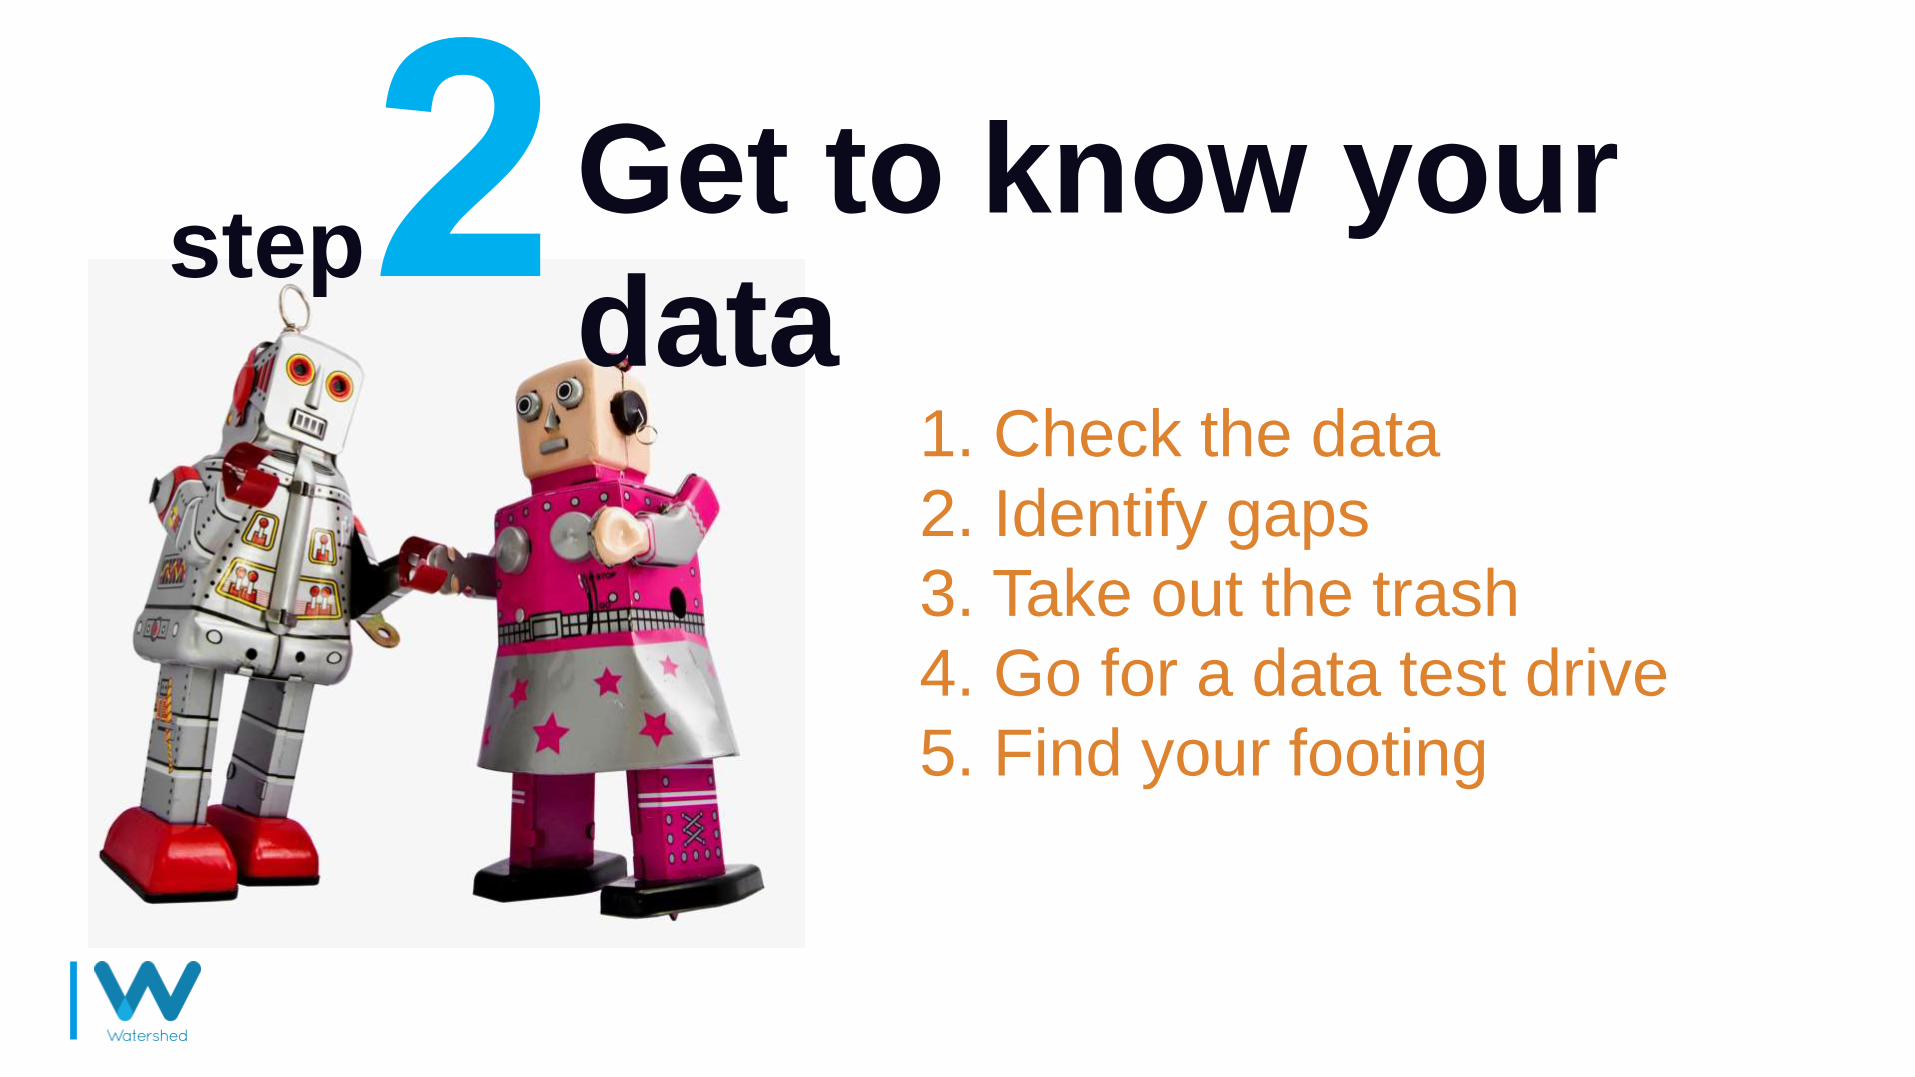
Get to know your
data1. Check the data
2. Identify gaps
3. Take out the trash
4. Go for a data test drive
5. Find your footing
step
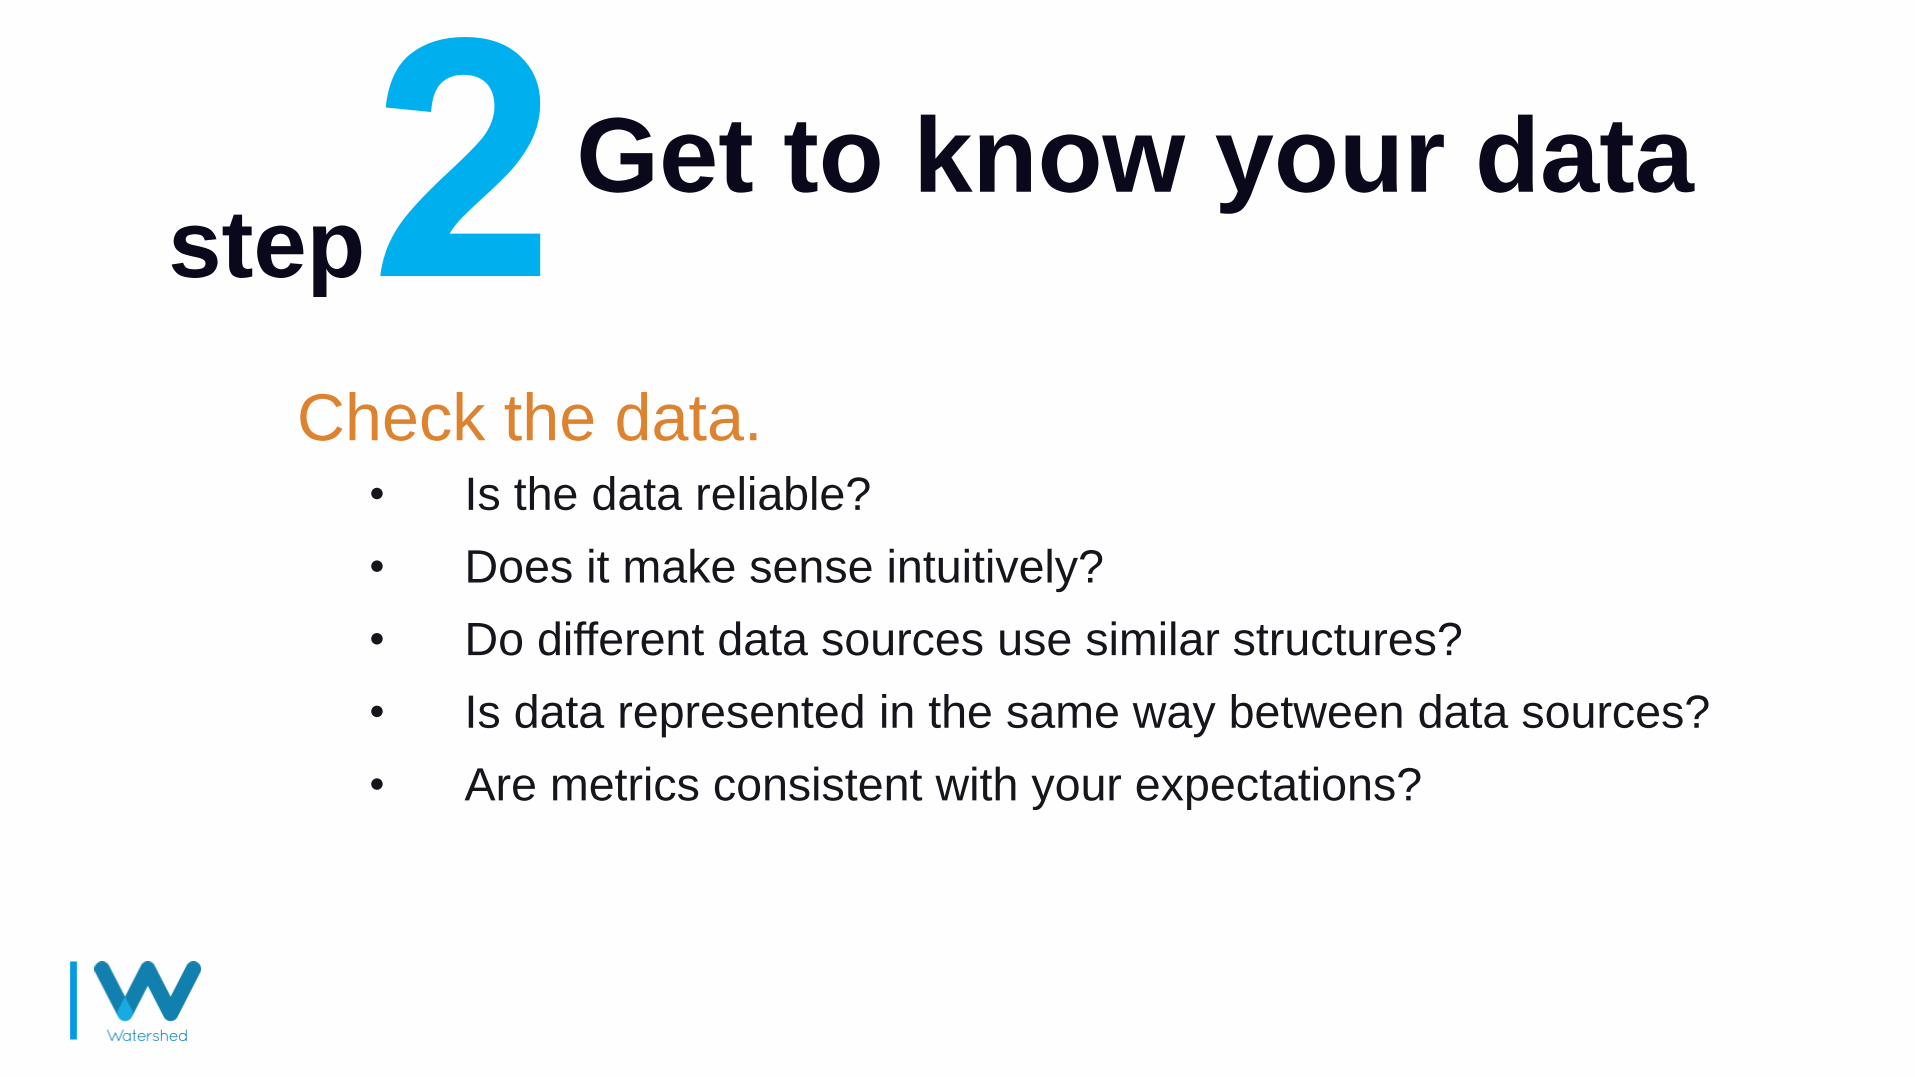
Get to know your data
Check the data.• Is the data reliable?
• Does it make sense intuitively?
• Do different data sources use similar structures?
• Is data represented in the same way between data sources?
• Are metrics consistent with your expectations?
step
Get to know your data
Identify gaps.• Are there learning activities you’re not tracking?
• Are you tracking the correct data about learning activities?
• What data will you need in the future?
step
Take out the trash.• Have you found excessive in the data?
• Is there junk data that you are collecting?
Get to know your data
Go for a data test drive.• Don’t just look at the raw data.
• Look at reports or visualization with this data.
• Compare new/clean data with historical data.
step
Find your footing.• Make sure you’re confident in the data you have before moving
on to step 3 (operationalize).
Operationaliz
e your data
Save souls from spreadsheet hell.• Eliminate manual work and reduce errors.
step
Make small improvements.• Automate manual processes.
• Incorporate new information into workflows.
Operationaliz
e your data
Report on additional metrics.• Go beyond completions, achievements, scores, and attendance.
• Add interesting analytics about your learners or experiences.
• Look at data from different angles (compare departments or teams).
step
Define Benchmarks• Define KPIs or benchmarks right away, even if you adjust later.
• Monitor data against these benchmarks from the start.
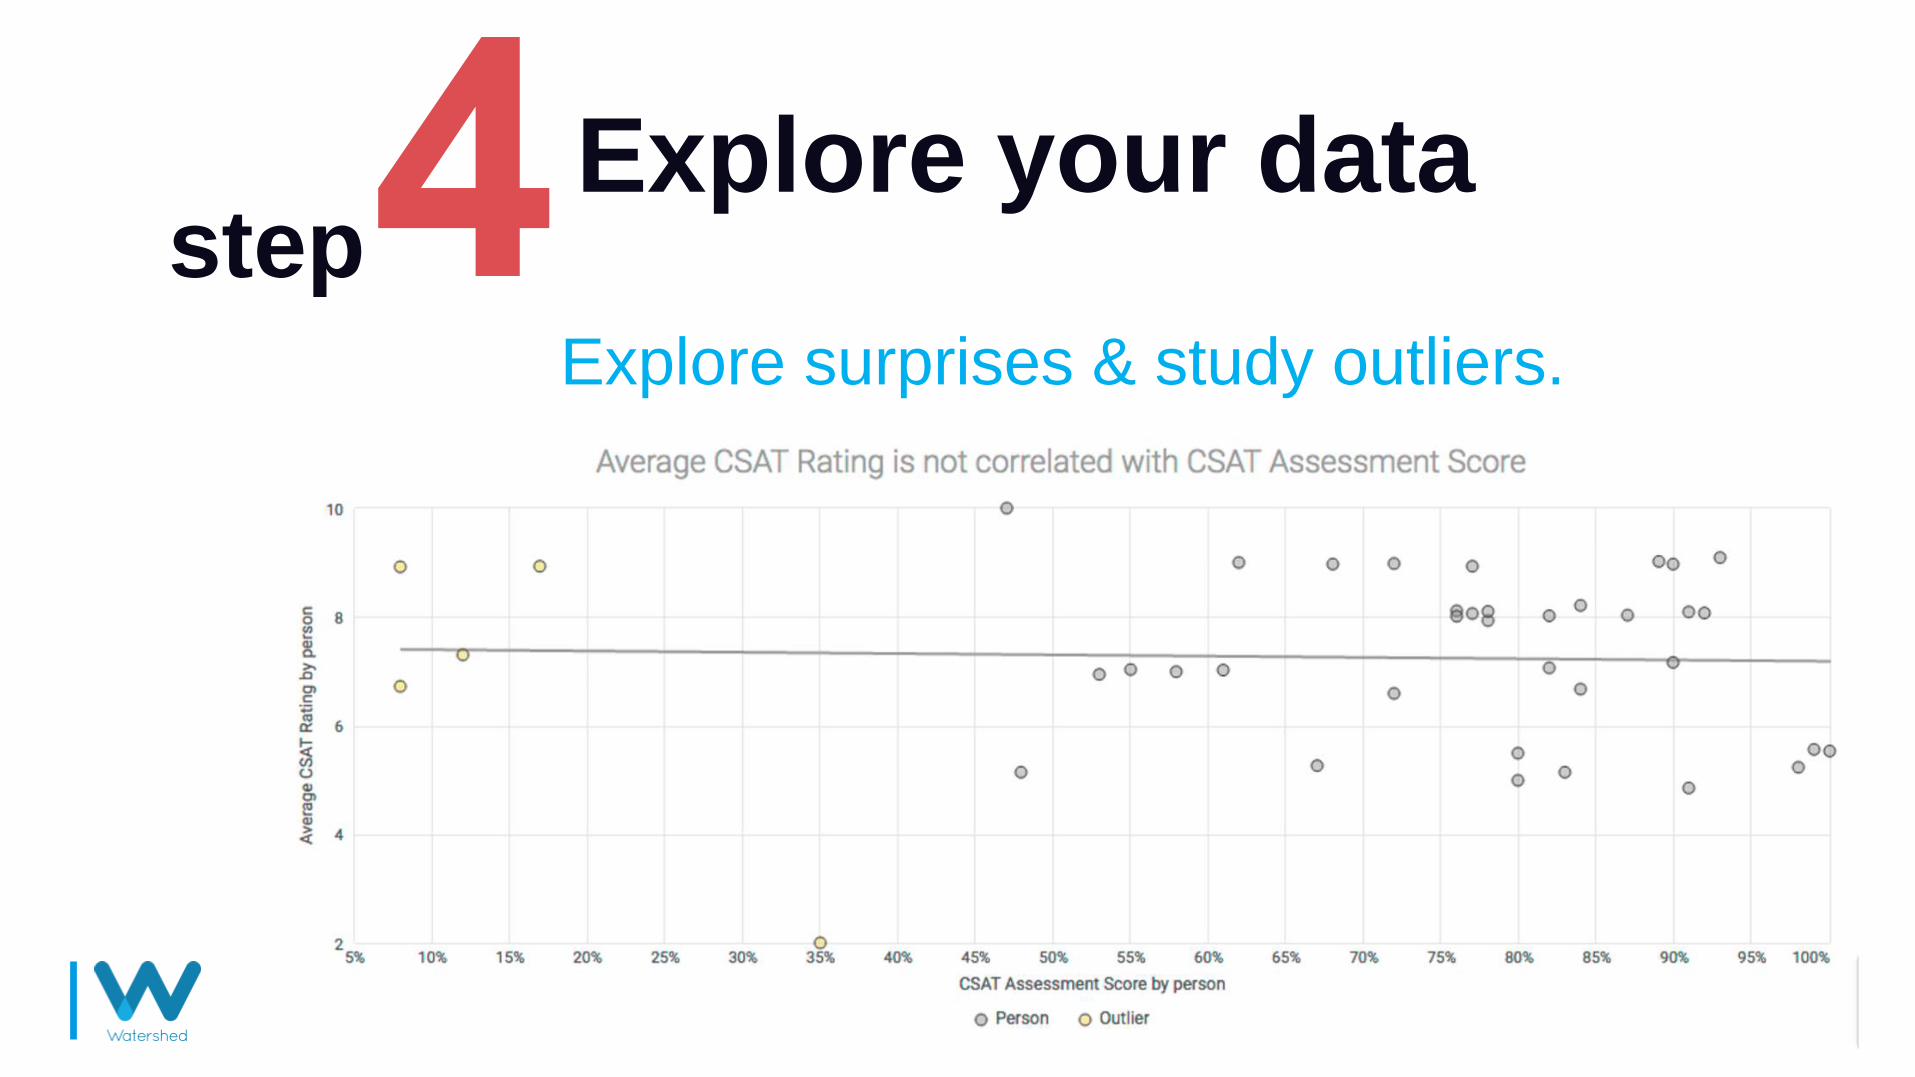
Explore your data
Explore surprises & study outliers.
step
Explore your data
• Ask more questions.• Form your own questions, see if your data can answer them.
• Consider the possible answers and resulting actions.
• Evaluate your program.• Look at the learning program holistically.
• Can you measure the impact on the larger business goal?
step
Explore your datastep
Build on what
you’ve learnedstep
If you started with what’s easy (in step 1)• Add metrics that are harder to capture, but more valuable to evaluate.
• Continue to iterate until you’ve identified your most valuable metrics.
If you’ve already identified your most valuable metrics• Use the Seven Steps of Learning Evaluation to reevaluate metrics.
• Identify if you need new metrics.

step
The future in practice
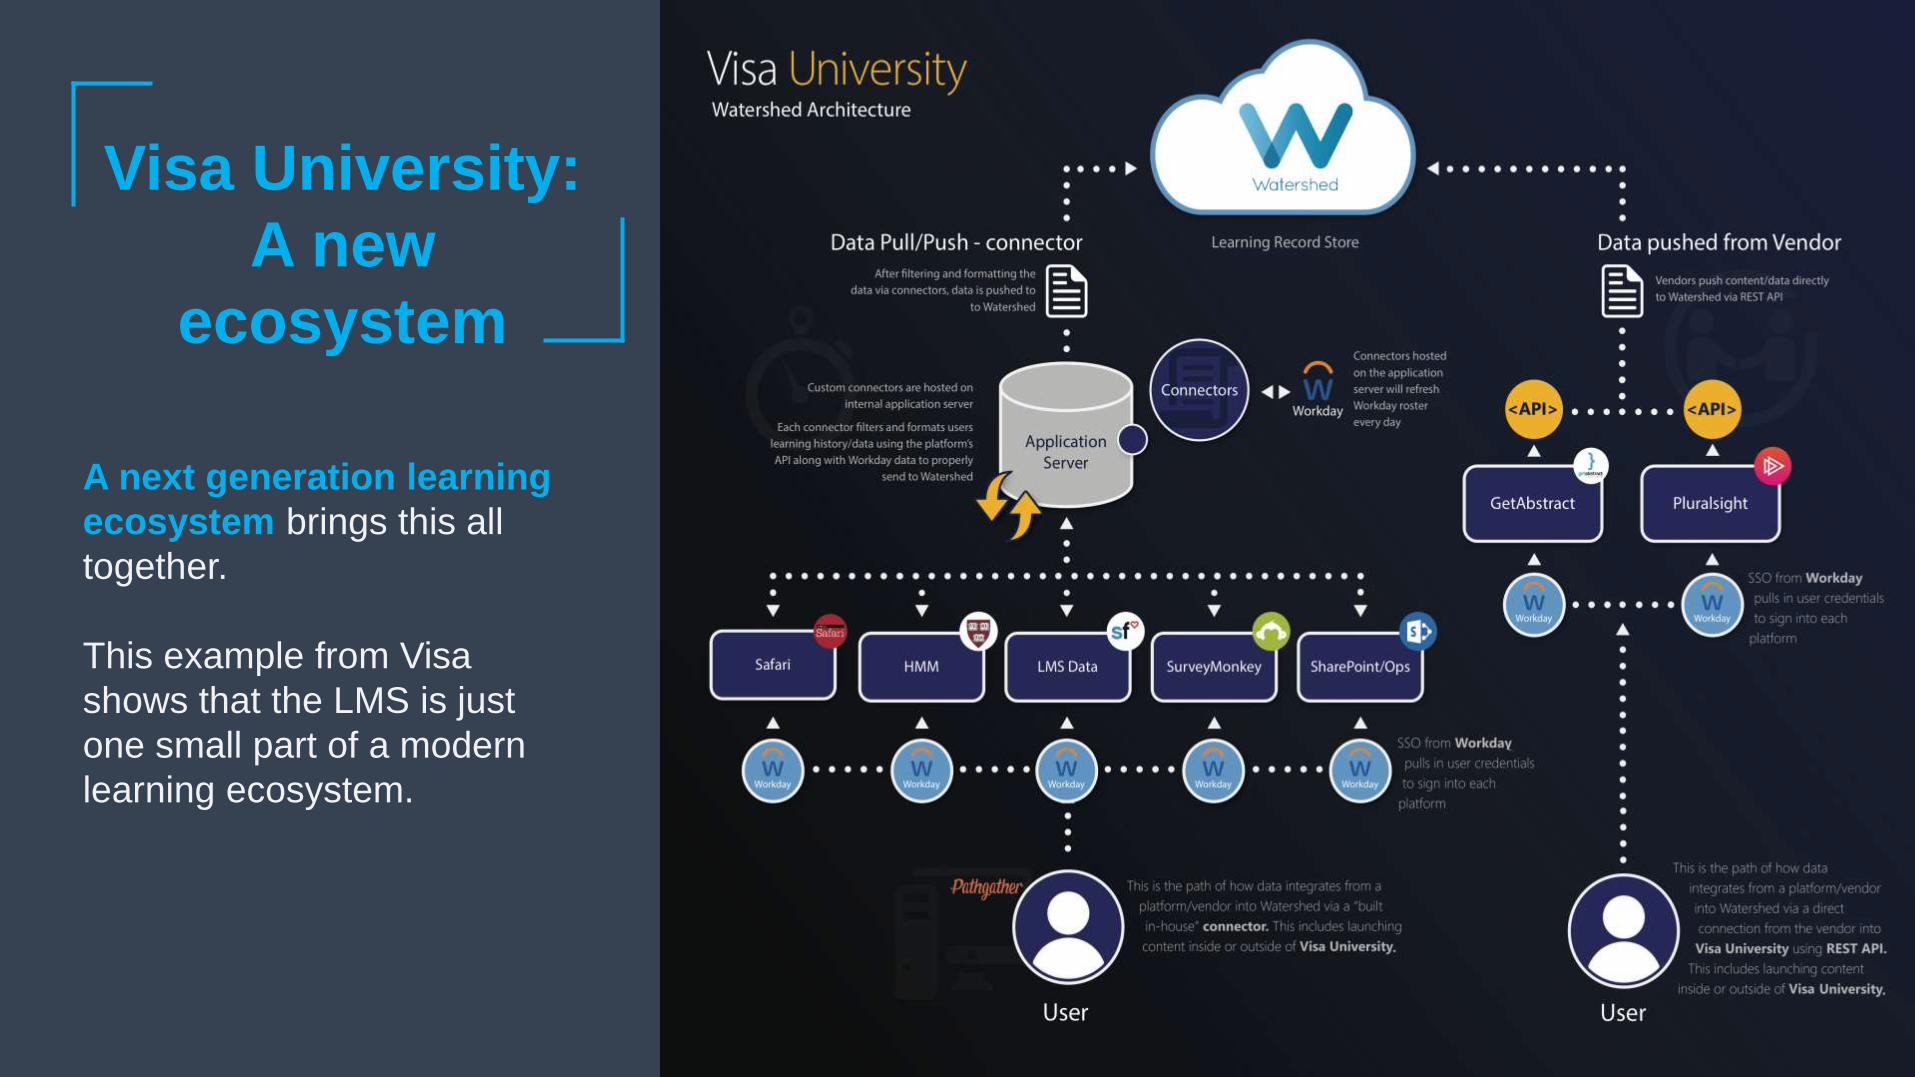
Visa University:
A new
ecosystem
A next generation learning
ecosystem brings this all
together.
This example from Visa
shows that the LMS is just
one small part of a modern
learning ecosystem.
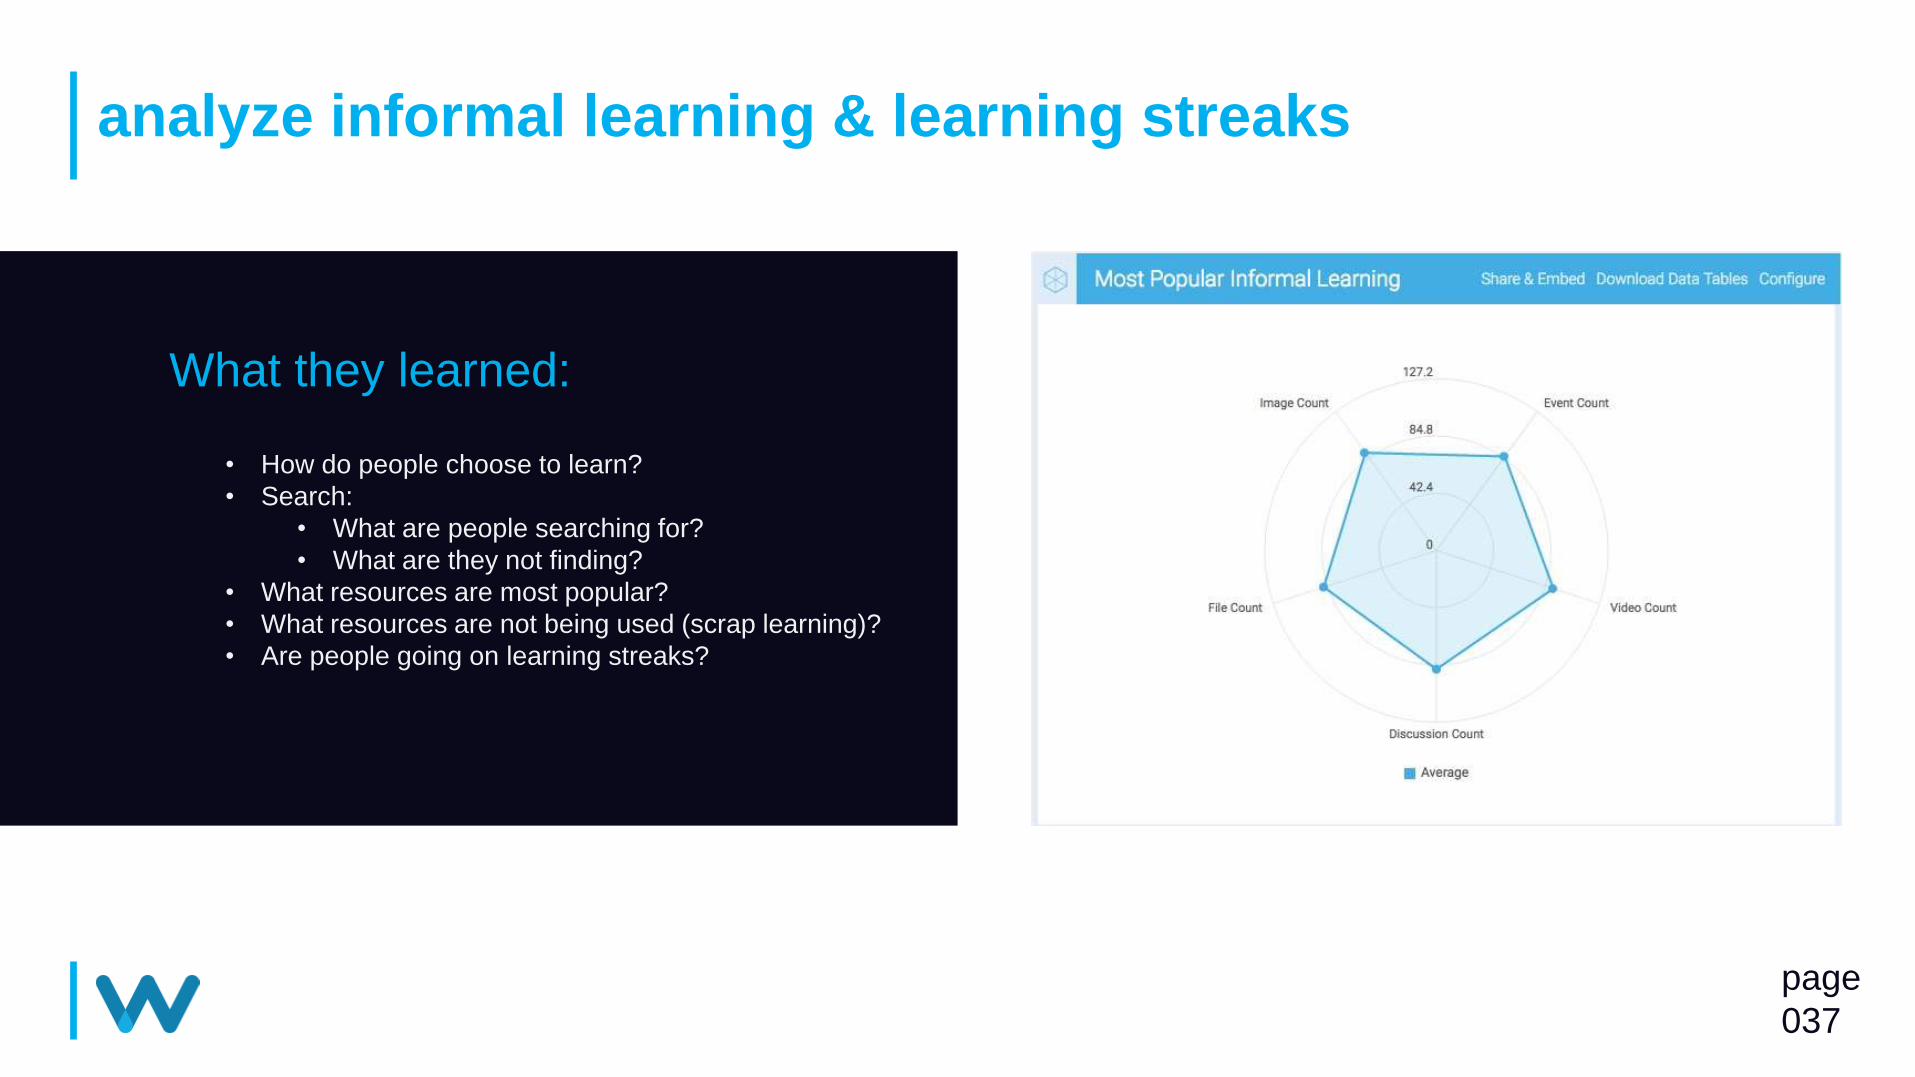
analyze informal learning & learning streaks
page
037
What they learned:
• How do people choose to learn?
• Search:
• What are people searching for?
• What are they not finding?
• What resources are most popular?
• What resources are not being used (scrap learning)?
• Are people going on learning streaks?

Code Blue
When a patient's heart stops
and needs to be resuscitated.
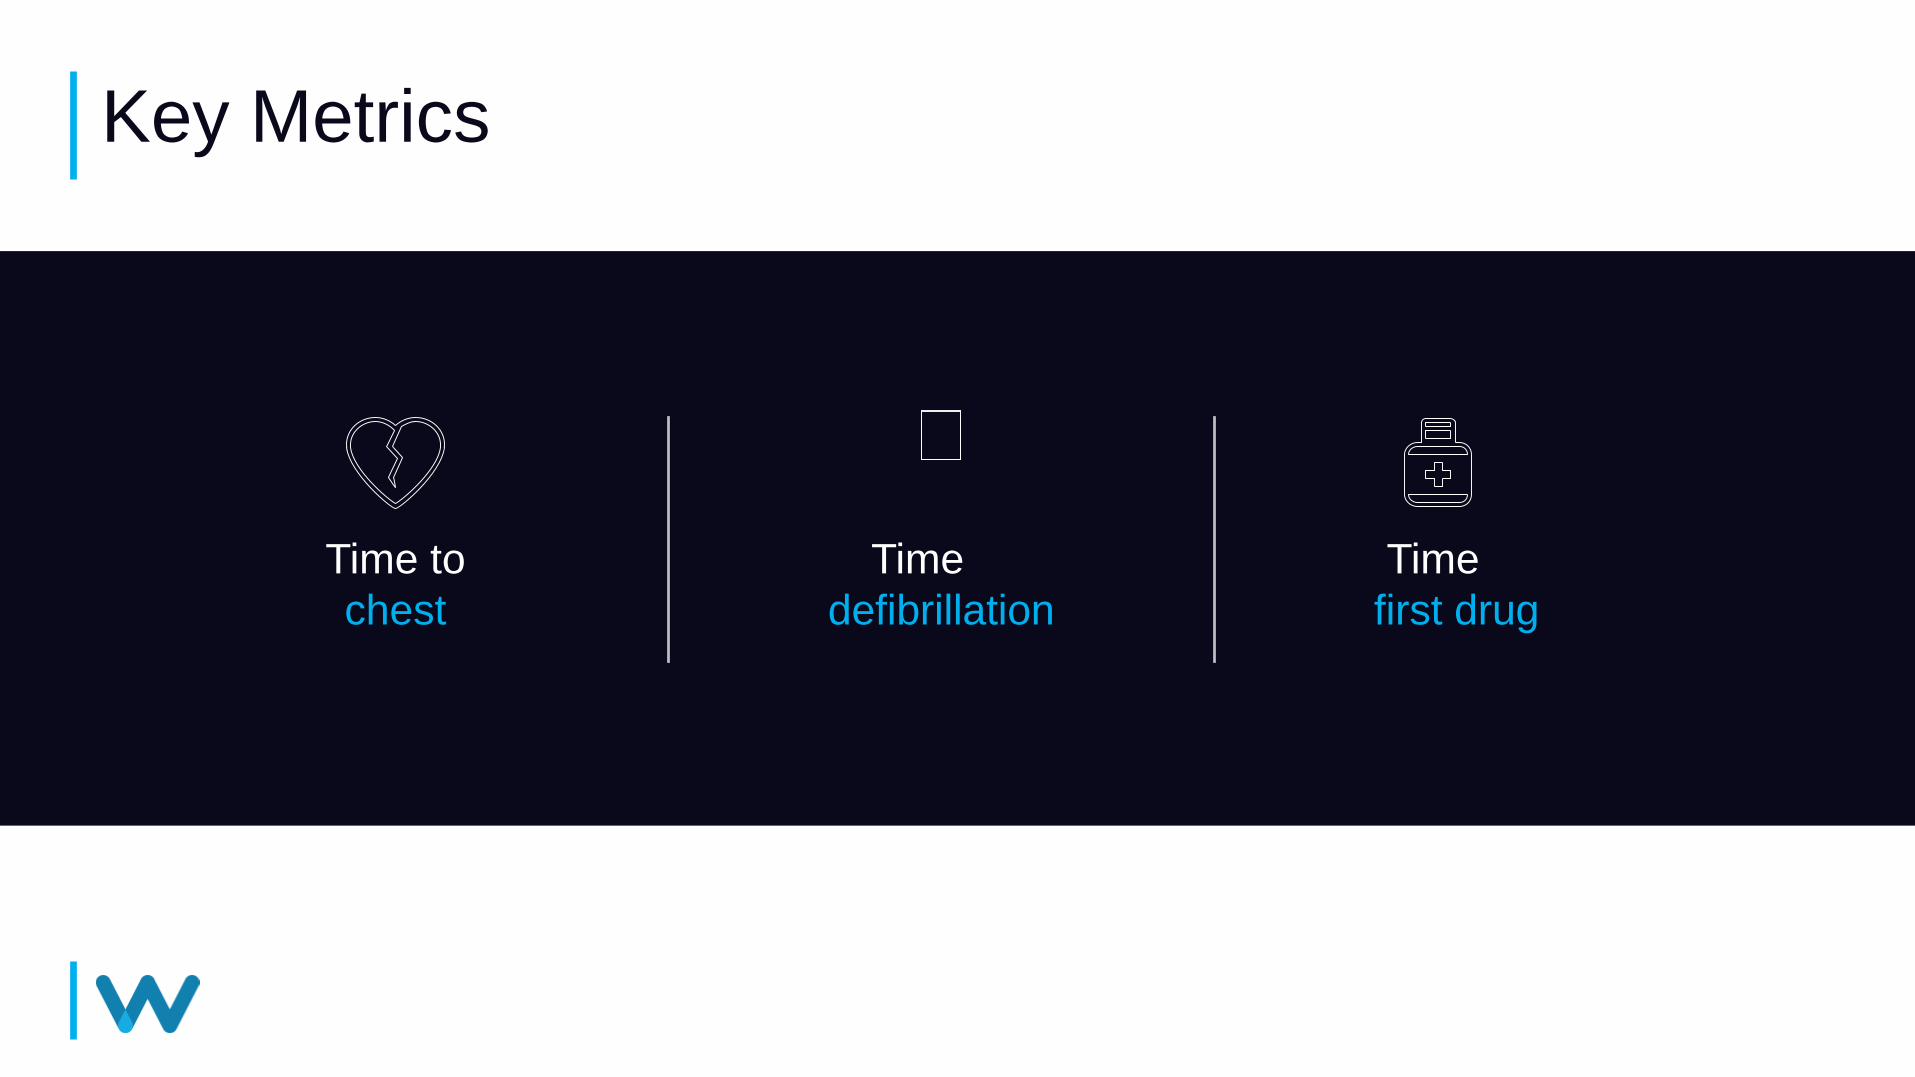
Key Metrics
Time to
first drug
Time to
defibrillation
Time to
chest

Mock Code Blue/ In person
Observation
Mobile Simulation/
Defibrillator App
LMS Training Lab
Learning Analytics Platform
(Watershed)
Getting There: Modern Ecosystem
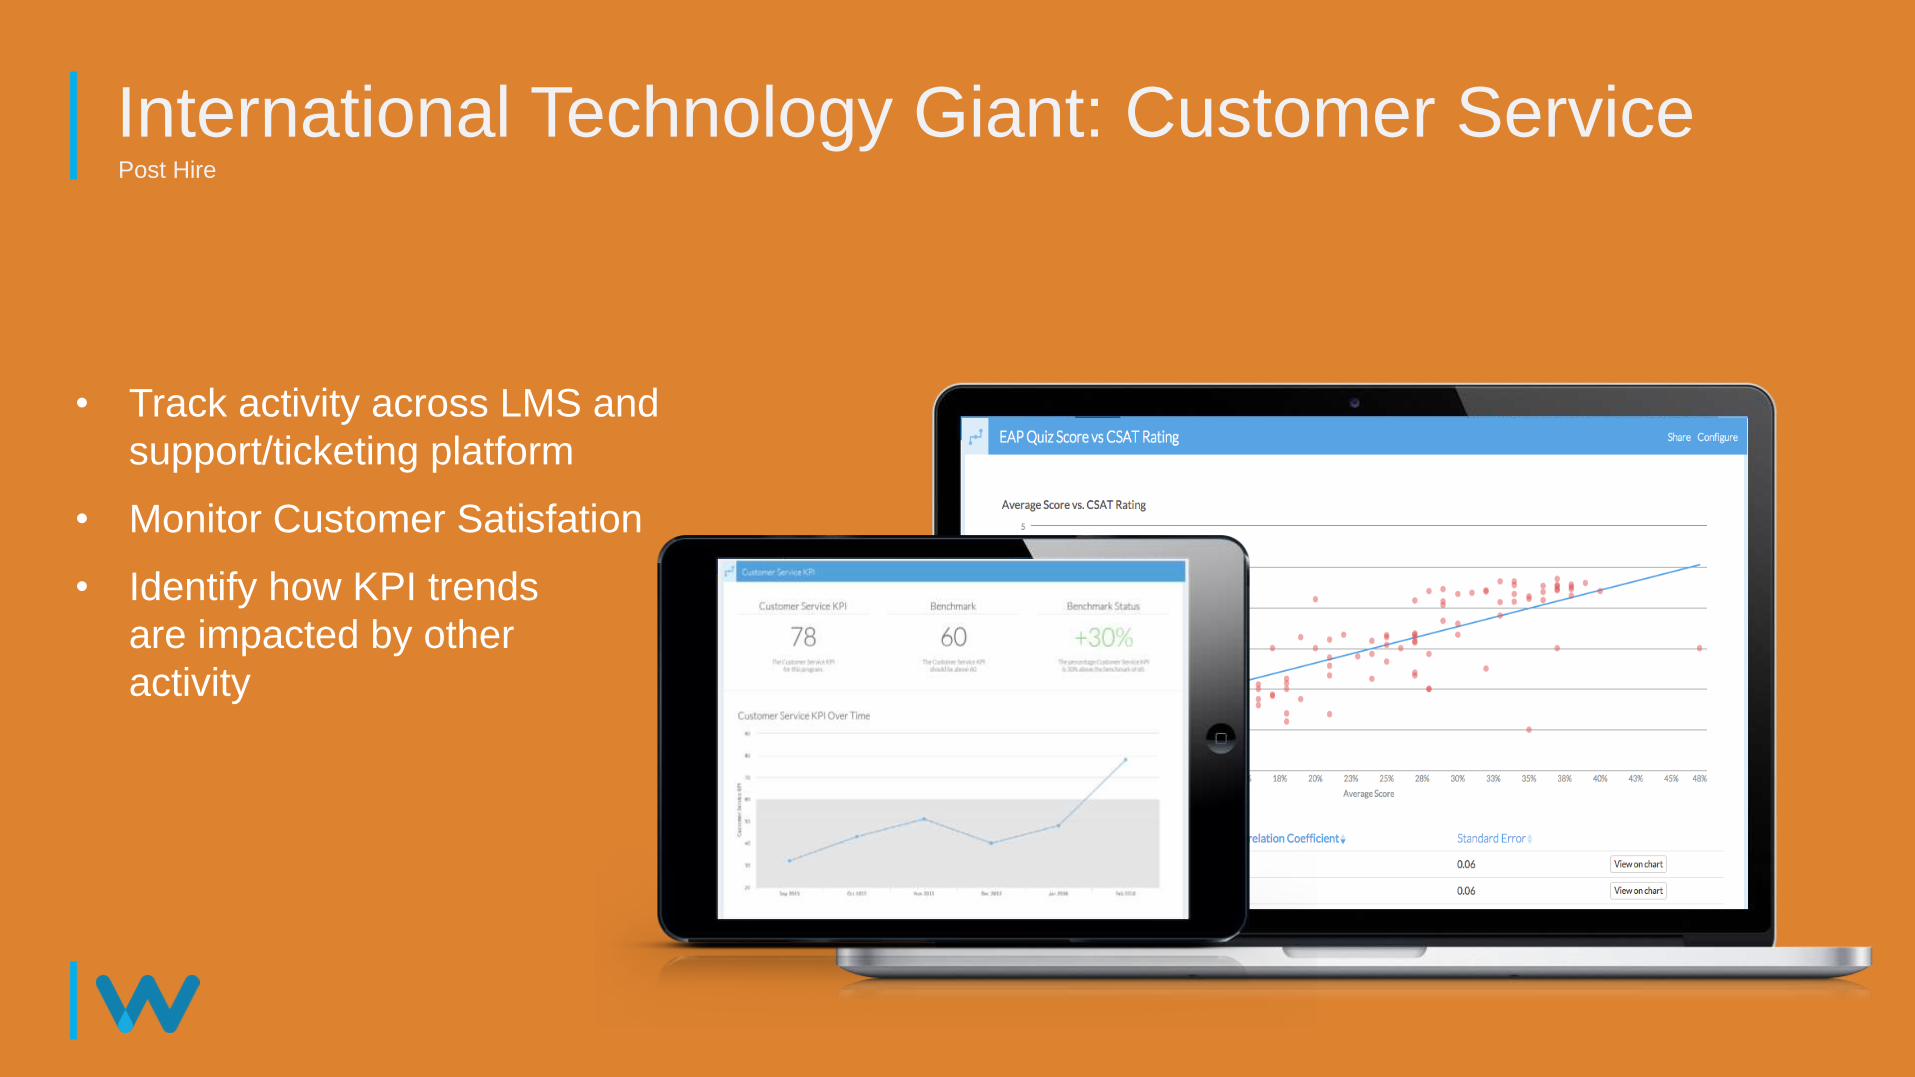
Post Hire
International Technology Giant: Customer Service
• Track activity across LMS and
support/ticketing platform
• Monitor Customer Satisfation
• Identify how KPI trends
are impacted by other
activity
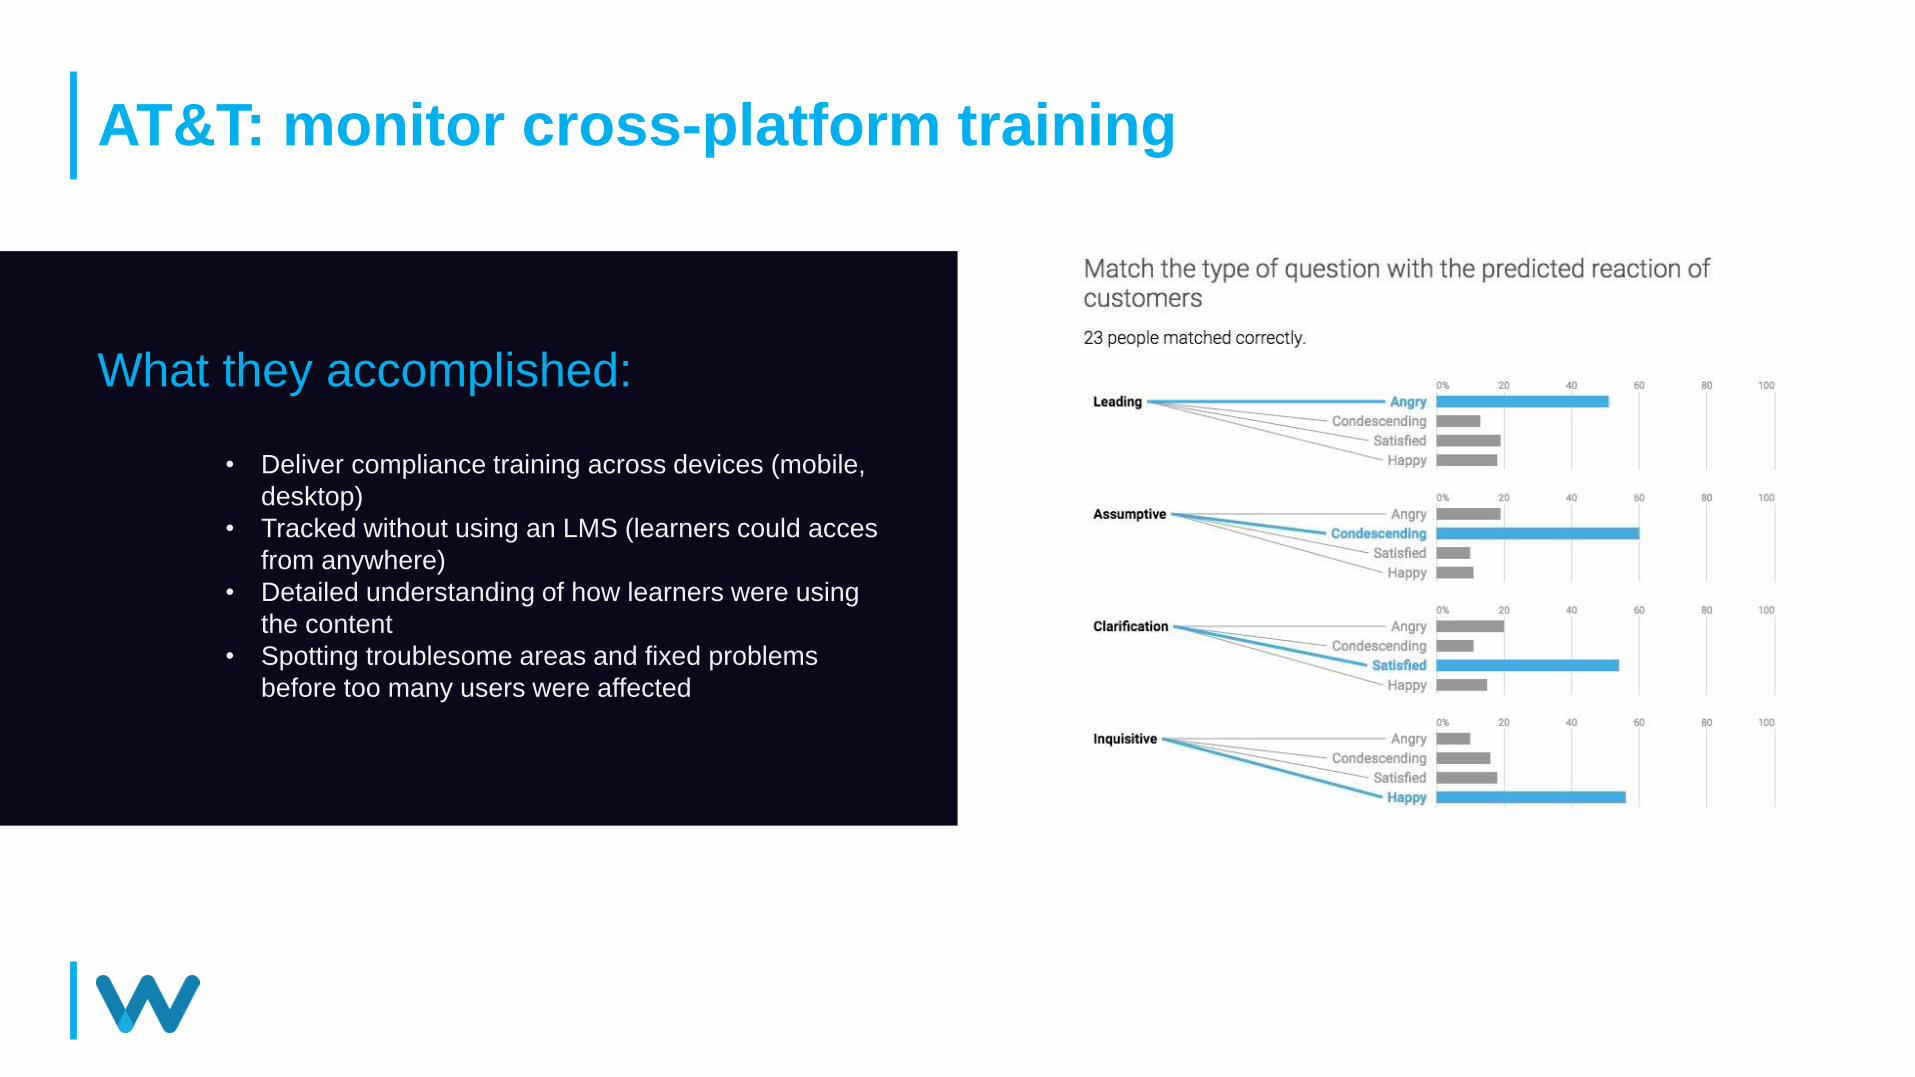
AT&T: monitor cross-platform training
What they accomplished:
• Deliver compliance training across devices (mobile,
desktop)
• Tracked without using an LMS (learners could acces
from anywhere)
• Detailed understanding of how learners were using
the content
• Spotting troublesome areas and fixed problems
before too many users were affected
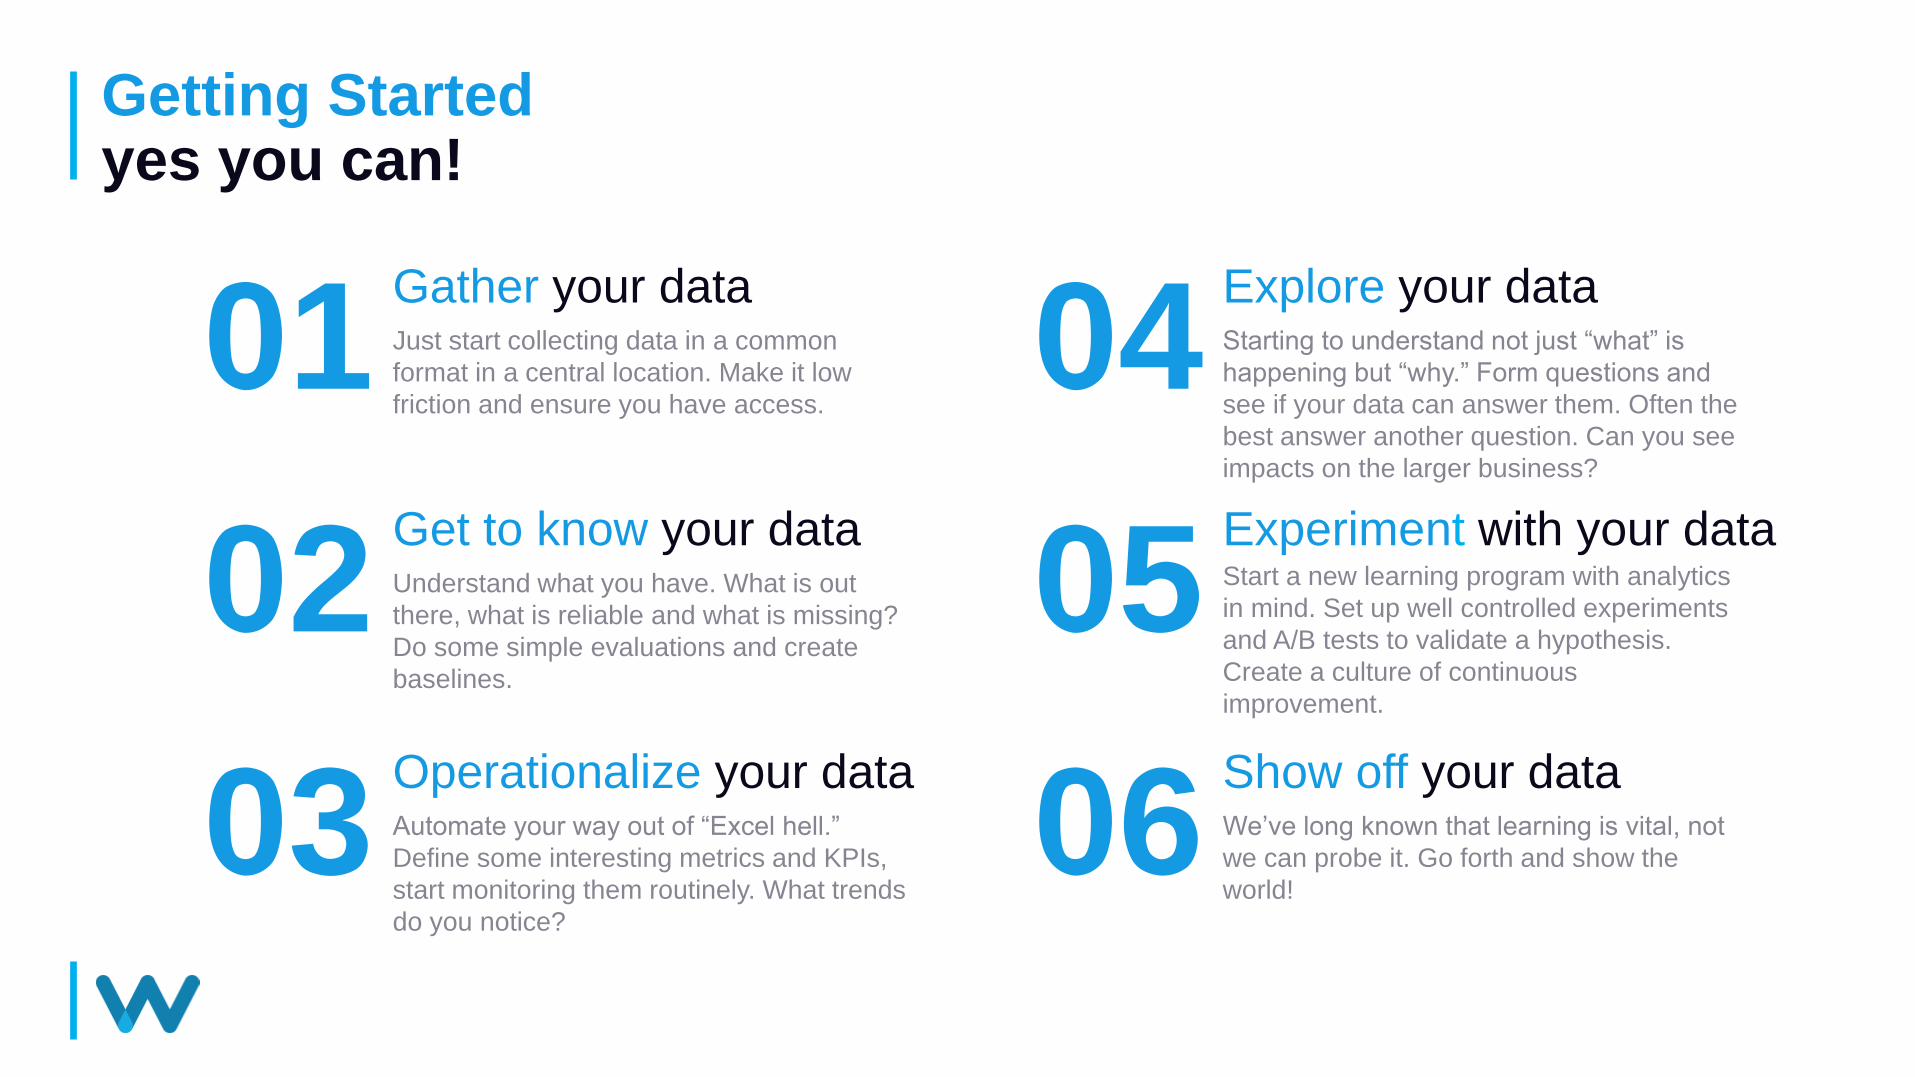
Getting Startedyes you can!
01Gather your dataJust start collecting data in a common
format in a central location. Make it low
friction and ensure you have access.04
Explore your dataStarting to understand not just “what” is
happening but “why.” Form questions and
see if your data can answer them. Often the
best answer another question. Can you see
impacts on the larger business?
02Get to know your dataUnderstand what you have. What is out
there, what is reliable and what is missing?
Do some simple evaluations and create
baselines.
05Experiment with your dataStart a new learning program with analytics
in mind. Set up well controlled experiments
and A/B tests to validate a hypothesis.
Create a culture of continuous
improvement.
03Operationalize your dataAutomate your way out of “Excel hell.”
Define some interesting metrics and KPIs,
start monitoring them routinely. What trends
do you notice?
06Show off your dataWe’ve long known that learning is vital, not
we can probe it. Go forth and show the
world!
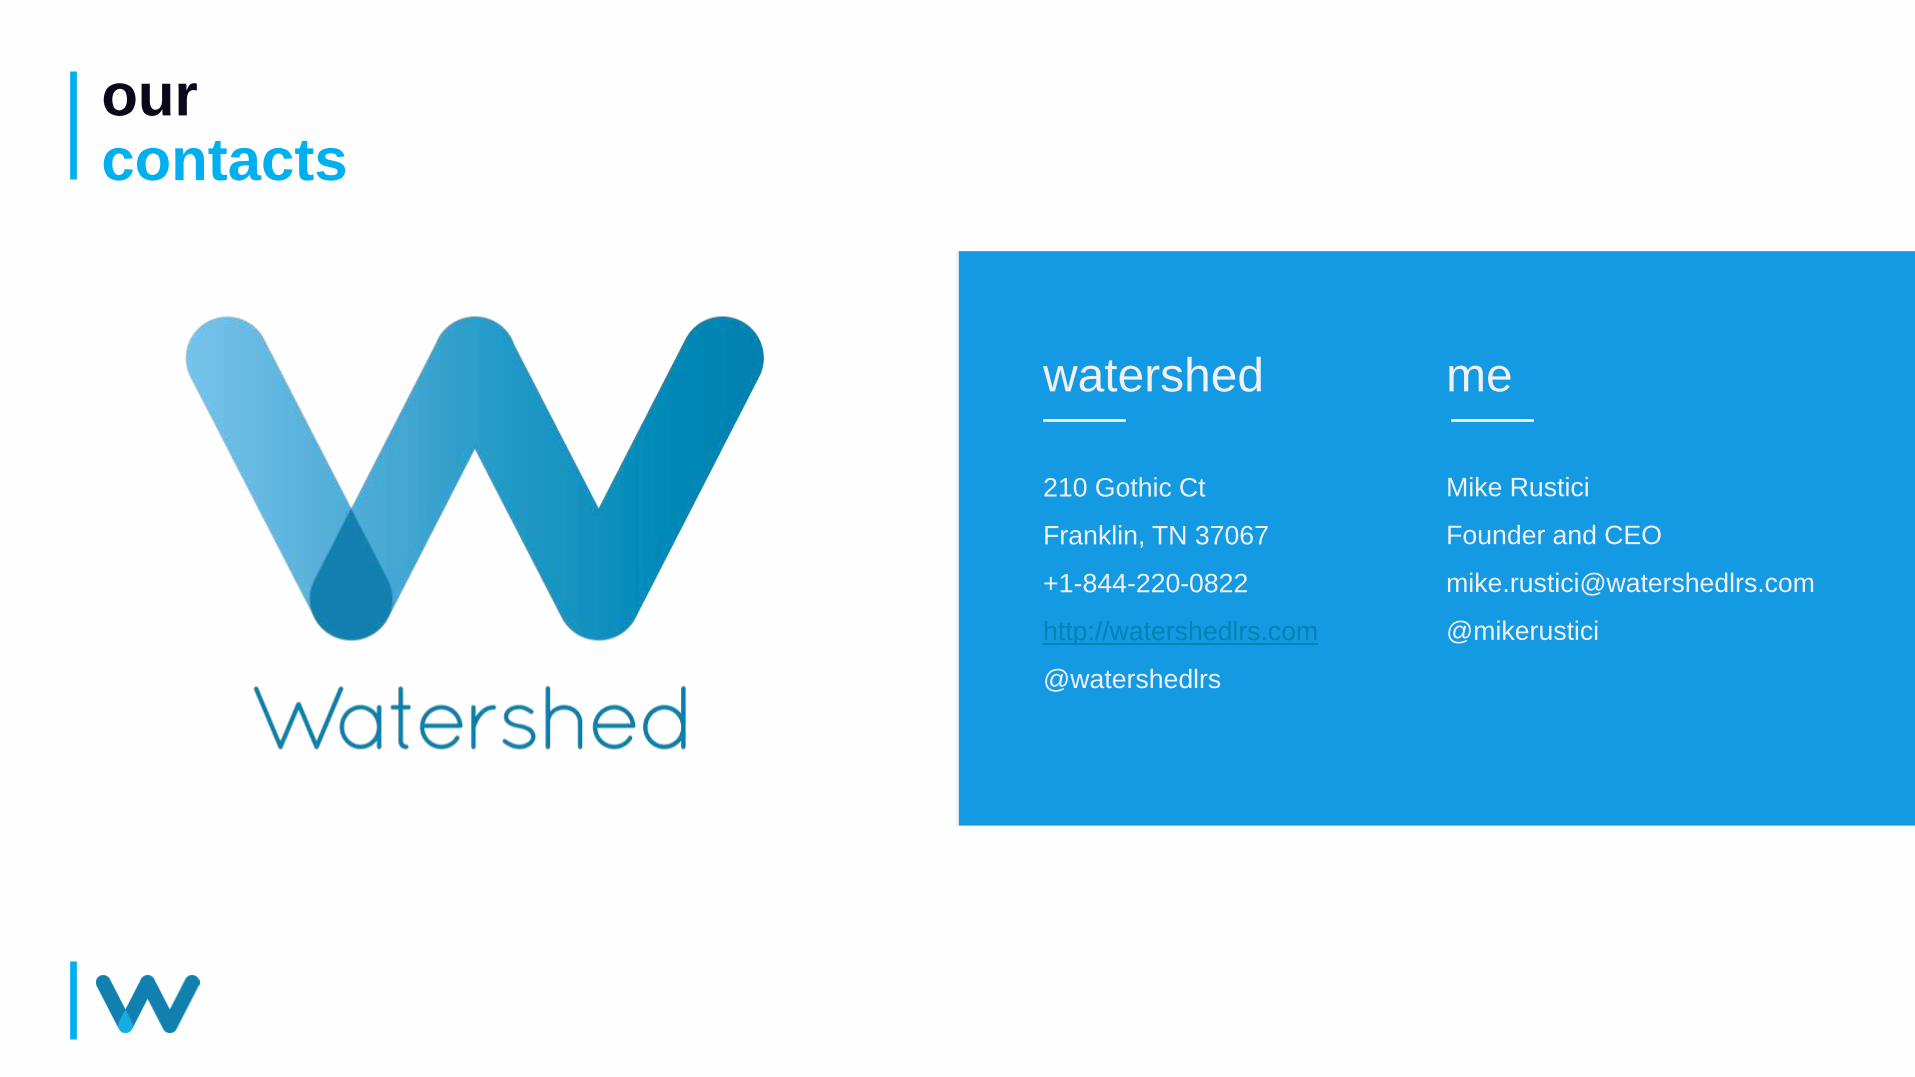
ourcontacts
watershed
210 Gothic Ct
Franklin, TN 37067
+1-844-220-0822
http://watershedlrs.com
@watershedlrs
me
Mike Rustici
Founder and CEO
@mikerustici


