• Full and timely repayment of debt Ø Investment grade ratings are ‘BBB-’ and higher, reflecting very low probability of
default
• Qualitative and quantitative aspects of proposed debt financing Ø Assess Key Drivers: Completion, Operation, Revenue (Volume and Price) and Debt Structure Ø Stronger, Midrange, or Weaker assessments Ø Primary quantitative metric is Debt Service Coverage Ratio (DSCR)
• Cash Available for Debt Service (CFADS) divided by Debt Service (DS) • Cash cushion indicated by extent CFADS exceeds DS • As reflected by DSCR > 1.00 times (x)
• Peer comparisons
4 www.fitchratings.com
Renewable Energy Technology Risk Comparison
Ope
ratio
n R
isk
Completion Risk Low High
Wind
Geothermal
Solar (PV) Hydro
Solar (CSP)
Biomass
5 www.fitchratings.com
Completion Risk
Cost Adequate budget given scope and comparison to peers Liquidity for cost overruns and potential contractor replacement
Schedule Realistic implementation timeframe Adequate allowance for delays
Performance Contractors’ Relevant Experience: complexity, scale and interface with other contractors
Fitch Base Case • Energy production subject to 0%-10% adjustment (existing or greenfield) • Availability adjustments based on technology, reflecting ramp up aging • O&M expense adjustments based on technology to reflect full life cycle costs
Single and Combination Stress Cases • Minimum energy production • Break-even Operations and Maintenance (O&M) Expense • Break-even availability • Combination break-even scenarios
Fitch Rating Case • One-year P90 energy production with other potential production adjustments • Base case availability subject to incremental decreases • Base Case O&M expense subject to incremental increases
12 www.fitchratings.com
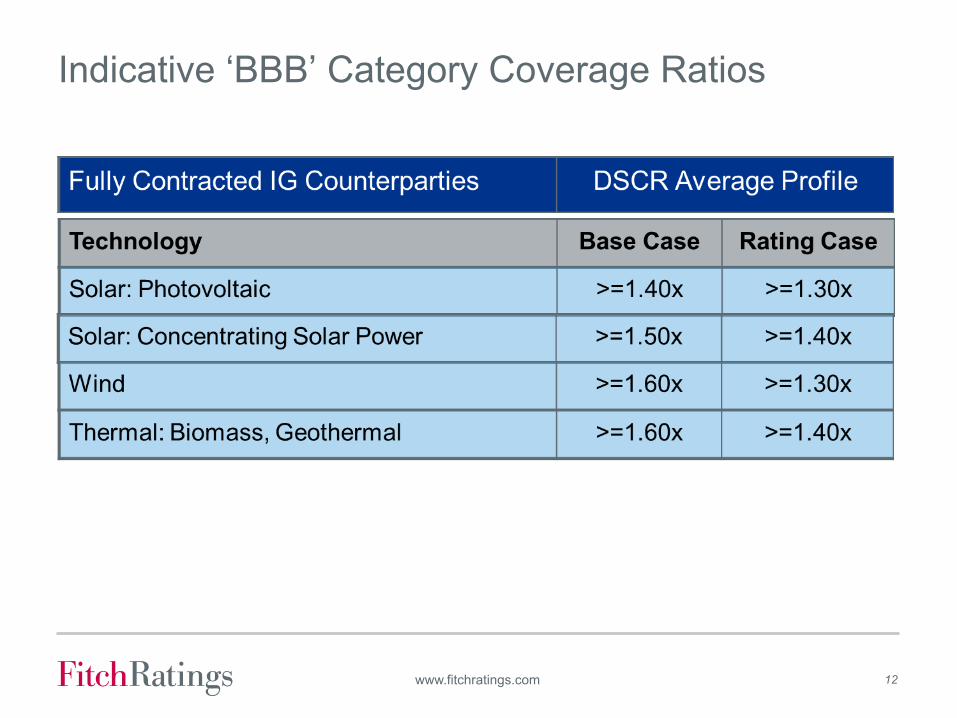
Indicative ‘BBB’ Category Coverage Ratios
13 www.fitchratings.com
Renewable Examples: Solar Star & Shepherds Flat
Project Solar Star Shepherds FlatFitch Rating 'BBB-' Stable 'BBB-' StableCapacity (MW) 579 845 Rated Debt ($MM) 1,325 1,200 Debt /MW ($MM) 2.29 1.42 Debt term 20 21.5 COD 2015 2014Completion Risk Stronger n/a Revenue Risk - Price Midrange Midrange Revenue Risk - Volume Midrange Midrange Operating Risk Midrange Midrange Debt Structure Midrange Midrange Base case DSCR avg. (x) 1.51 1.75 Rating case DSCR avg. (x) 1.32 1.41 Rating case DSCR min. (x) 1.31 1.31
14 www.fitchratings.com
Q & A
15 www.fitchratings.com
Disclaimer
Fitch Ratings’ credit ratings rely on factual information received from issuers and other sources. Fitch Ratings cannot ensure that all such information will be accurate and complete. Further, ratings are inherently forward-looking, embody assumptions and predictions that by their nature cannot be verified as facts, and can be affected by future events or conditions that were not anticipated at the time a rating was issued or affirmed.
The information in this presentation is provided “as is” without any representation or warranty. A Fitch Ratings credit rating is an opinion as to the creditworthiness of a security and does not address the risk of loss due to risks other than credit risk, unless such risk is specifically mentioned. A Fitch Ratings report is not a substitute for information provided to investors by the issuer and its agents in connection with a sale of securities.
Ratings may be changed or withdrawn at any time for any reason in the sole discretion of Fitch Ratings. The agency does not provide investment advice of any sort. Ratings are not a recommendation to buy, sell, or hold any security.
ALL FITCH CREDIT RATINGS ARE SUBJECT TO CERTAIN LIMITATIONS AND DISCLAIMERS. PLEASE READ THESE LIMITATIONS AND DISCLAIMERS AND THE TERMS OF USE OF SUCH RATINGS AT WWW.FITCHRATINGS.COM.
New York 33 Whitehall Street New York, NY 10004
London 30 North Colonnade Canary Wharf London E14 5GN


![[Webinar] Nuxeo Platform 5.6 Overview](https://static.documents.pub/doc/80x56/54b539644a7959fa5d8b45c6/webinar-nuxeo-platform-56-overview.jpg)


