Webinar Series National Nutrition Research Roadmap 2016‒2021: Advancing Nutrition Research to Improve and Sustain Health Webinar 4: The National Nutrition Research Roadmap: Application of Systems Science, Design and Systems Change to Effect Population Level Change in Eating Behaviors
Transcript
Webinar Series National Nutrition Research Roadmap
2016‒2021: Advancing Nutrition Research to
Improve and Sustain Health
Webinar 4:
The National Nutrition Research Roadmap:
Application of Systems Science, Design and
Systems Change to Effect Population Level
Change in Eating Behaviors
A Few Reminders
CPE Credit
• ASN designates this educational activity for
a maximum of 1 CPEUs. Dietitians and
Dietetic Technicians, Registered should only
claim credit commensurate with the extent of
their participation in the activity.
• To claim credit, please take the post webinar
evaluation to be emailed after the webinar.
This webinar is being recorded.
Please mute your phone and/or computer microphone.
Questions & Answers
Please use the “questions” box on
your “Go To Meetings” screen to
submit questions to our presenters.
Please submit your questions at any
time during today’s webinar.
Faculty Speakers
Bruce Y. Lee, MD, MBA
Associate Professor of International Health
Johns Hopkins Bloomberg School of Public Health
Michele Forman, PhD
Head, Department of Nutrition Science
Purdue University
Mark Denbaly, PhD
Deputy Division Director for Food Economics Data
USDA
Elizabeth Larimore, MS
Agricultural Economist, USDA
Moderator
Marian L. Neuhouser, PhD, RD
Fred Hutchinson Cancer Research Center
President, American Society for Nutrition
Learning Objective
At the end of this program, attendees will be
able to:
Describe research gaps and opportunities
related to the application of systems
science, design and systems change to
effect population level change in eating
behaviors, as found in the National Nutrition
Research Roadmap
5
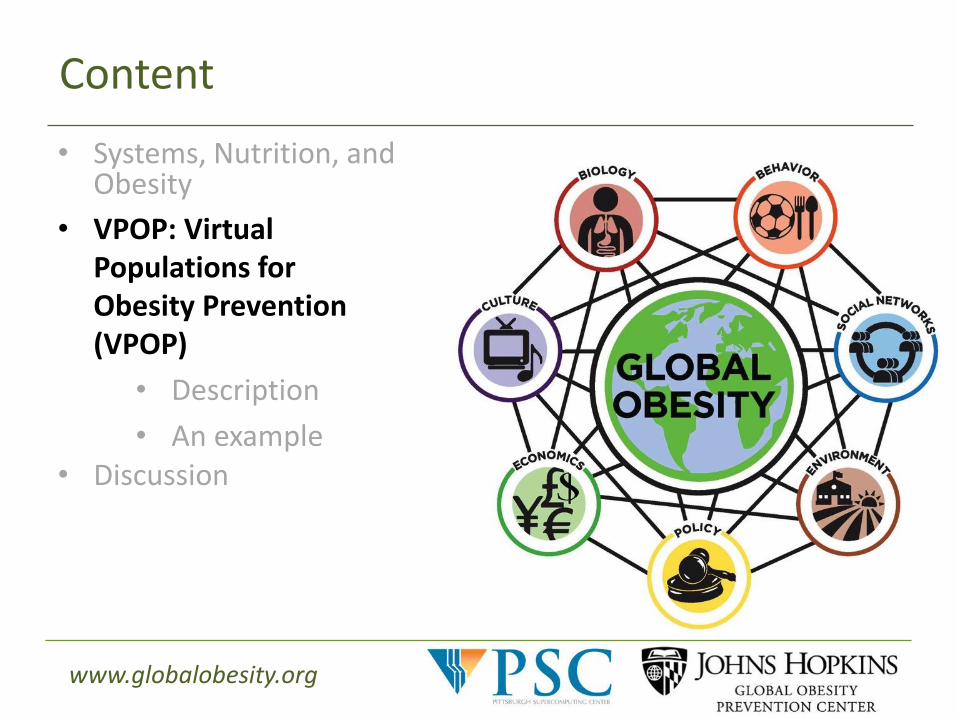
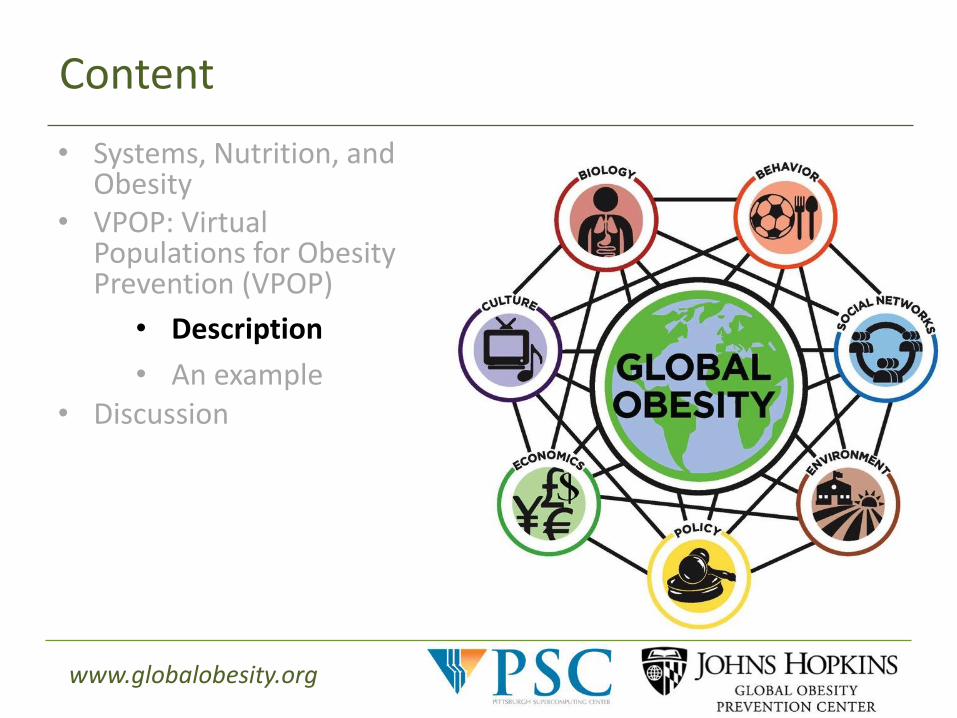
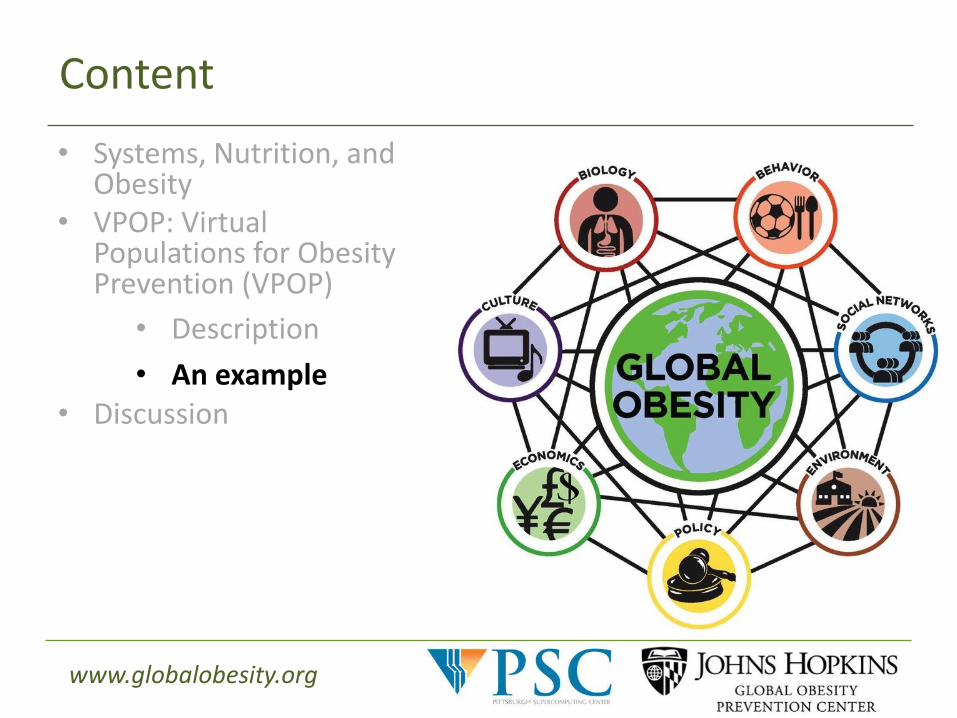
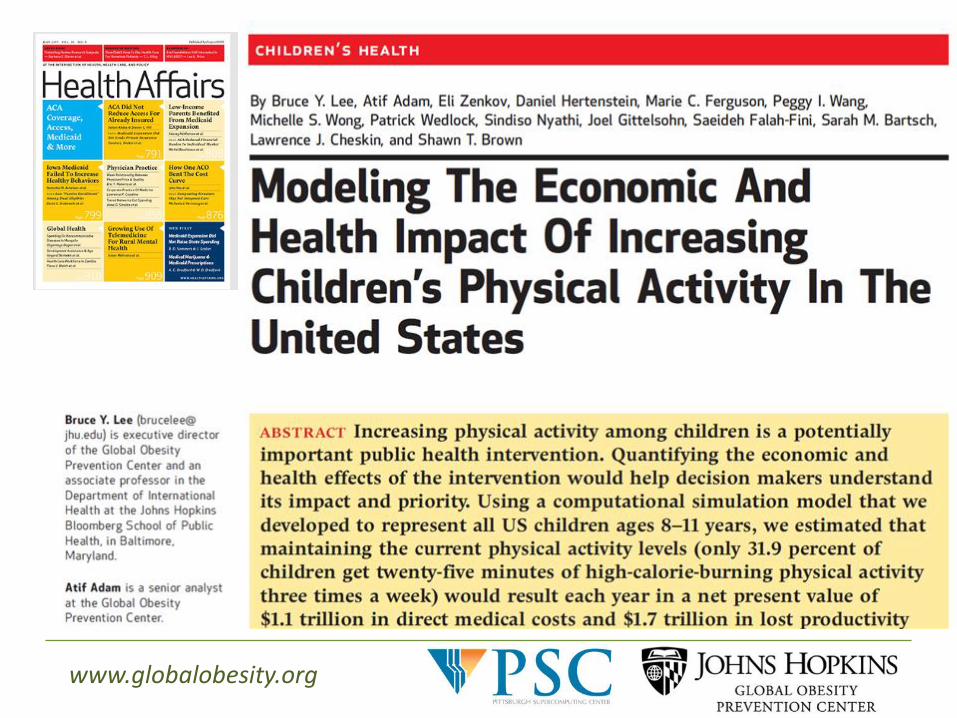
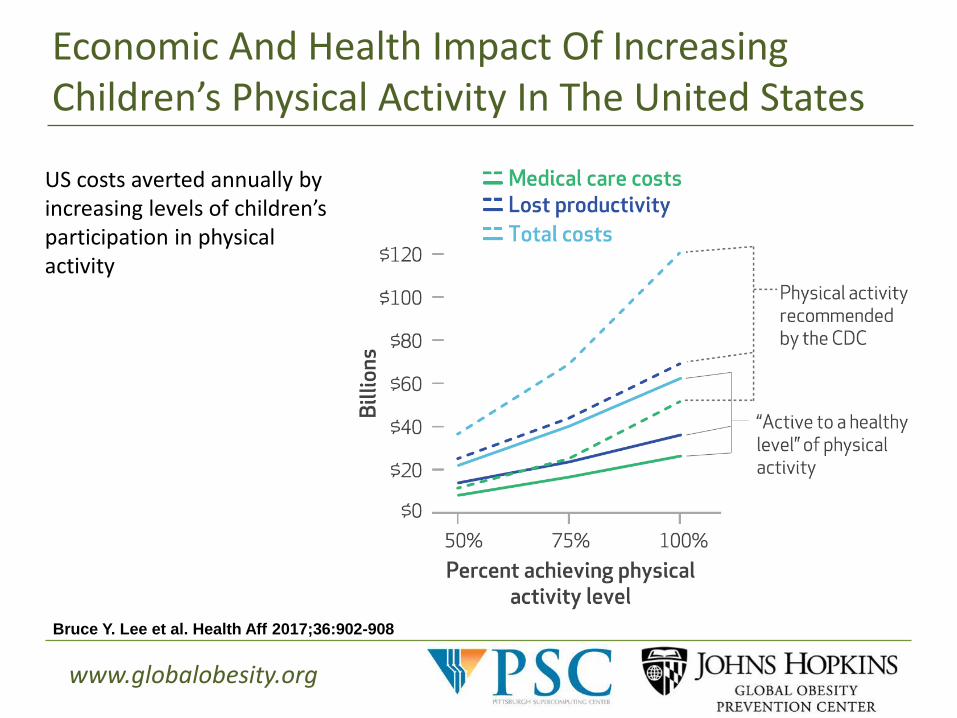
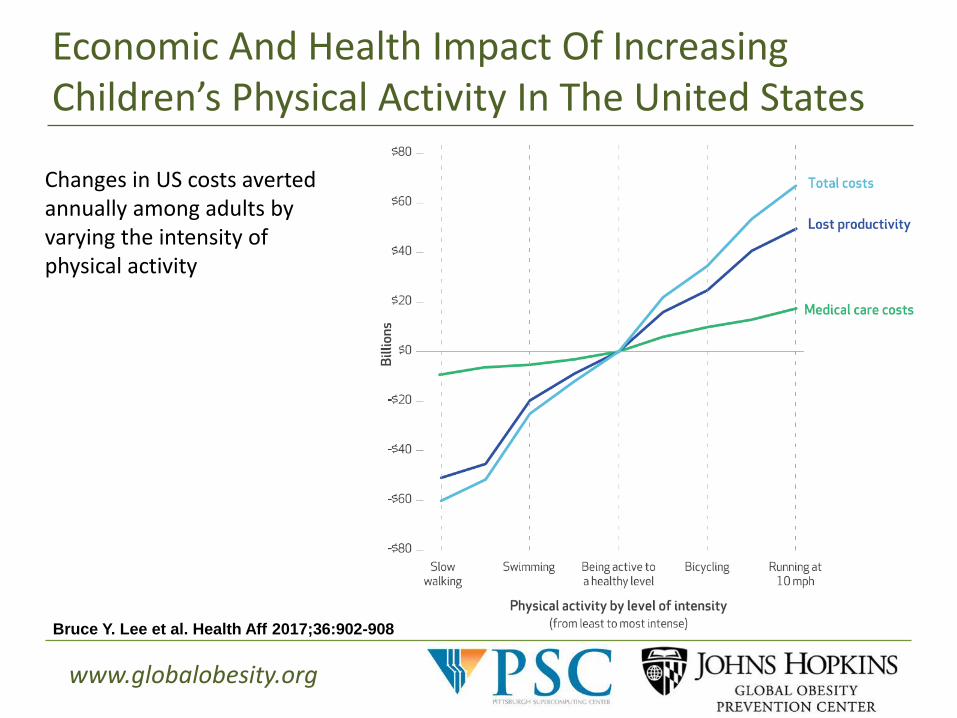
Use of Modeling To Explore Intervention Impact
Bruce Y. Lee, MD, MBA
Executive Director, Global Obesity Prevention Center (GOPC)
Associate Professor, Department of International Health
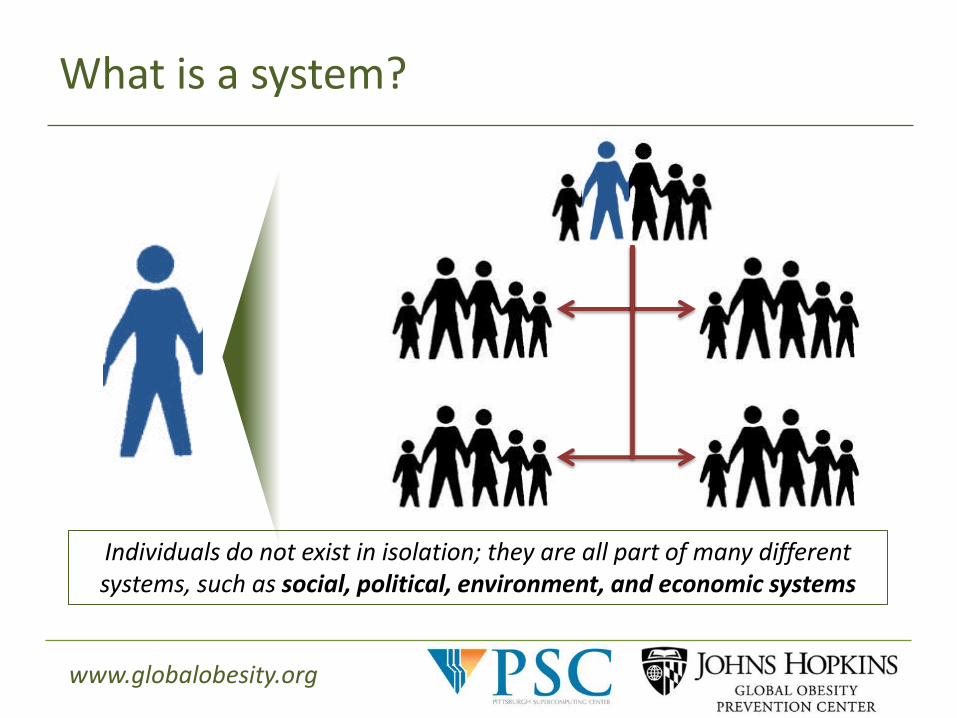
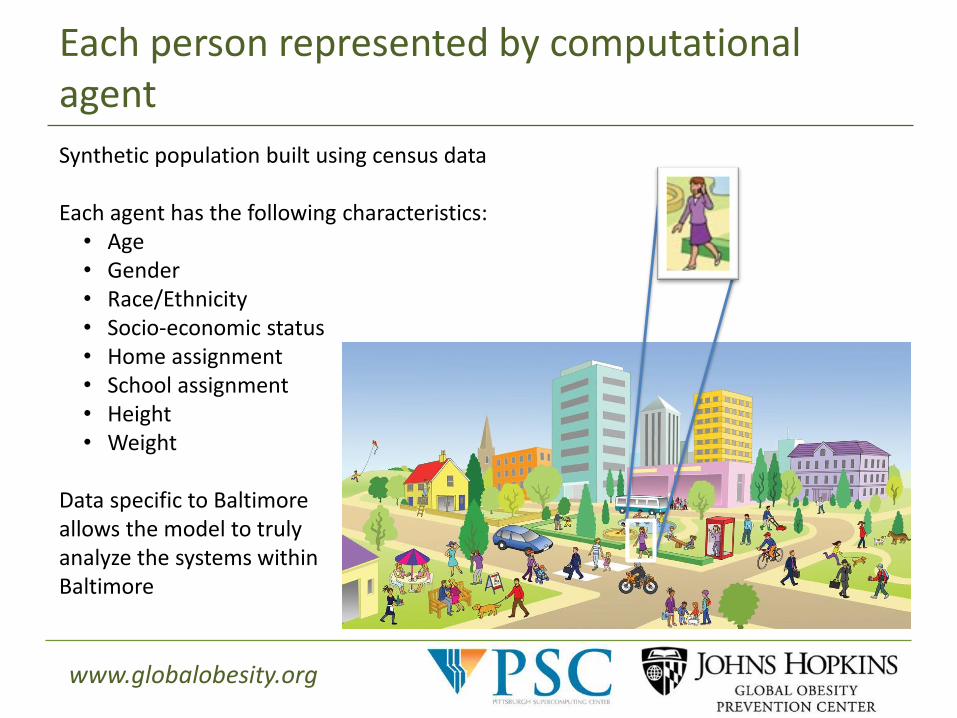
• Dietary patterns, health, and diseases are linked in a complex system • Systems approaches have transformed many other fields • Systems approaches can transform the way we understand and address
dietary patterns, health, and diseases • Systems approaches can allow us to fully harness the increasing amount of
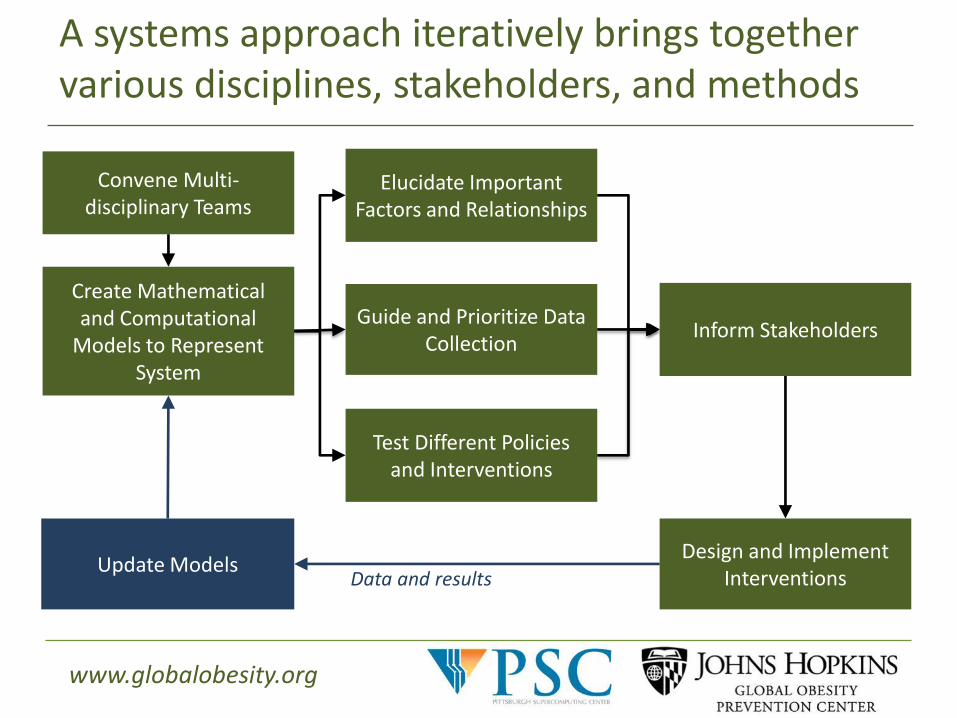
available data • Incorporate systems methodologies such as systems mapping and
computational modeling into research and decision making • Using systems approaches also includes:
• Convening disciplines not traditionally associated with obesity with those that are
• Bringing together traditional and non-traditional study methodologies
• Eunice Kennedy Shriver National Institute of Child Health and Human Development (NICHD) and Office of Behavioral and Social Sciences Research (OBSSR) via U54 HD070725
• NICHD via U01HD086861 • NICHD via R01HD086013 • National Heart Lung and Blood Institute
(NHLBI) • Bill & Melinda Gates Foundation • Laureus Sport for Good Foundation • The Aspen Institute’s Sports & Society
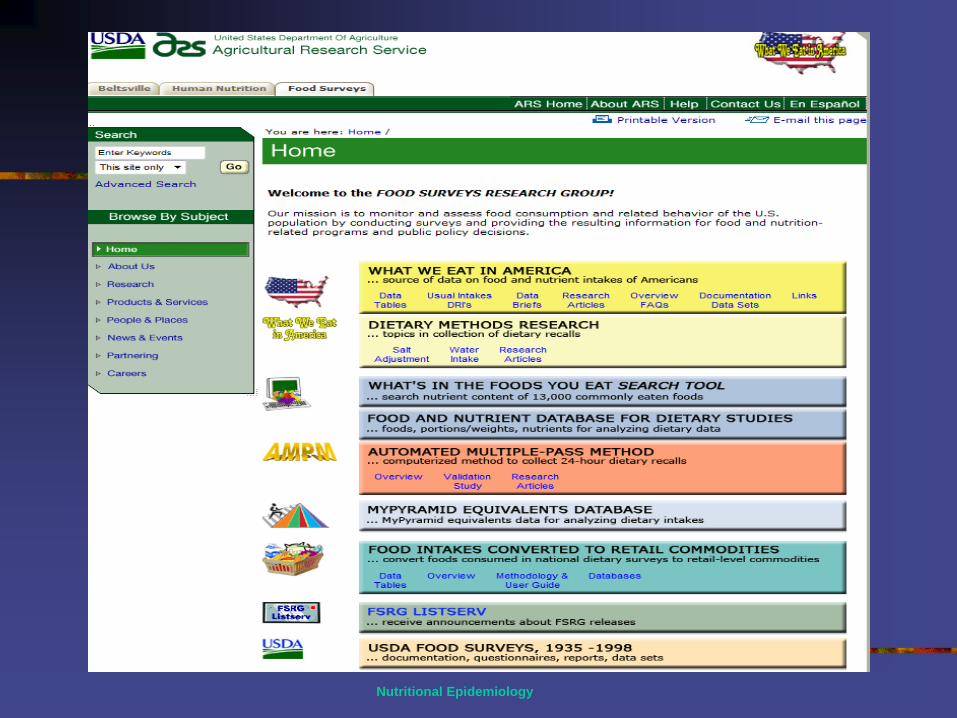
National Household Food Acquisition and Purchase Survey
(FoodAPS)
Mark Denbaly and Liz Larimore USDA - Economic Research Service
Application of Systems Science, Design, and Systems Change to Effect Population Level Change in Eating Behaviors
Webinar, May 31st, 2017
The information presented here are those of the authors and not those of USDA or the Economic Research Service.
56
Table of Contents
• Why FoodAPS?
• Research Questions Enabled by FoodAPS-1
• New Insights Provided by FoodAPS-1 Data
• Plans for the Second Round of FoodAPS
57
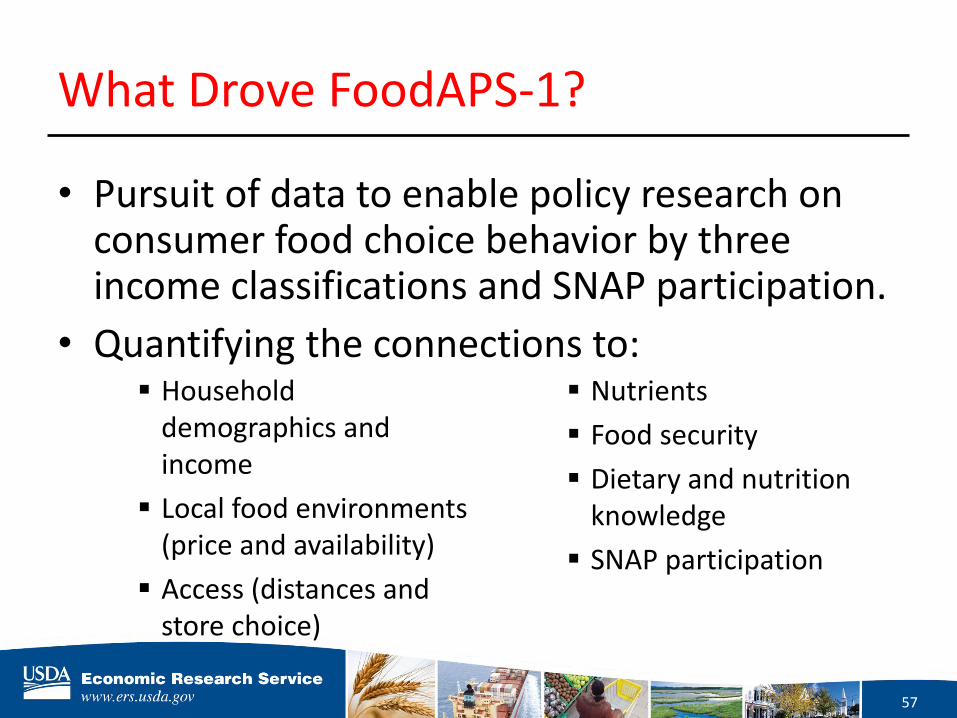
What Drove FoodAPS-1?
• Pursuit of data to enable policy research on consumer food choice behavior by three income classifications and SNAP participation.
• Quantifying the connections to: Household
demographics and income
Local food environments (price and availability)
Access (distances and store choice)
Nutrients
Food security
Dietary and nutrition knowledge
SNAP participation
58
Opportunities for insightful research Data on SNAP participation, shopping habits and store preferences, household expenditures, and food security provide opportunity for new research.
• Restricted FoodAPS-1 data are being used by 168 external researchers across 61 projects
• Recently released public-use data are fueling more research
• Current FoodAPS research includes:
NBER and UKCPR grants
Independent external research projects
USDA cooperative agreements
See the list on the FoodAPS Research Projects and Publications webpage
• Food Environment – Where do households shop and how do they get
there?
– How do neighborhood characteristics impact food decisions, and nutrition?
– How does food access impact food security
• Food Prices – How do food prices impact healthy food choices?
• Food Away From Home – How healthy are the food-away-from-home choices
of low-income households?
FoodAPS-1 Data are Sparking Research in a Variety of Areas
60
FoodAPS-1 Data are Sparking Research in a Variety of Areas, continued • SNAP
– Do SNAP recipients pay the best prices?
– What foods do new SNAP recipients acquire?
– Is SNAP like cash for recipients and stores?
• WIC
– Are households less price sensitive when using WIC benefits?
– How does geography impact WIC participation?
• Other Food Assistance Programs
– How do school meal programs impact what children obtain?
61
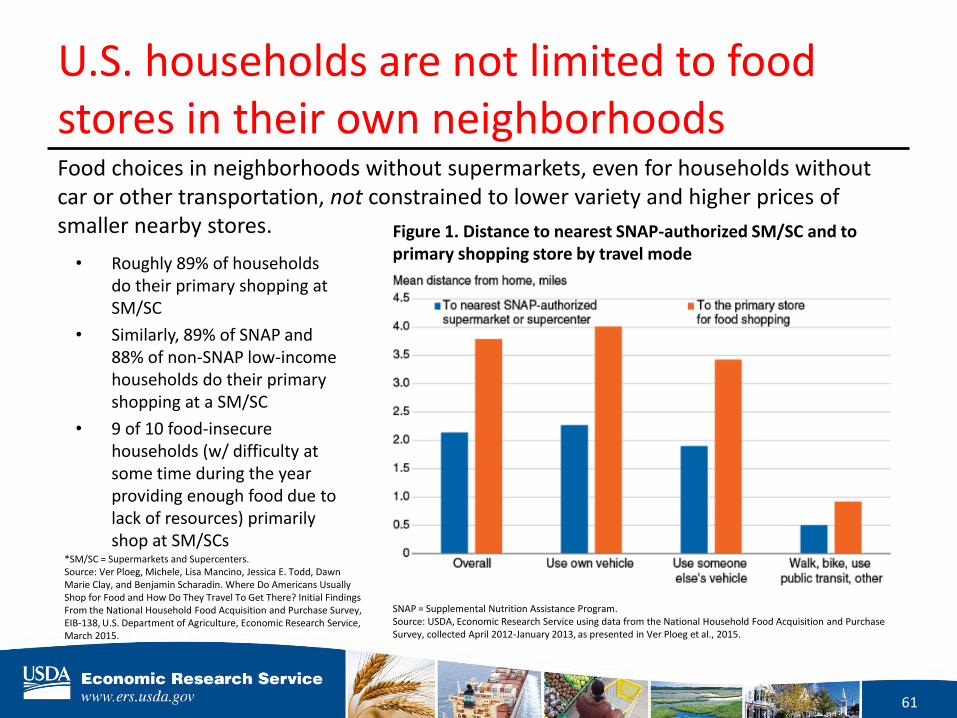
U.S. households are not limited to food stores in their own neighborhoods
• Roughly 89% of households do their primary shopping at SM/SC
• Similarly, 89% of SNAP and 88% of non-SNAP low-income households do their primary shopping at a SM/SC
• 9 of 10 food-insecure households (w/ difficulty at some time during the year providing enough food due to lack of resources) primarily shop at SM/SCs
Food choices in neighborhoods without supermarkets, even for households without car or other transportation, not constrained to lower variety and higher prices of smaller nearby stores.
SNAP = Supplemental Nutrition Assistance Program. Source: USDA, Economic Research Service using data from the National Household Food Acquisition and Purchase Survey, collected April 2012-January 2013, as presented in Ver Ploeg et al., 2015.
Figure 1. Distance to nearest SNAP-authorized SM/SC and to primary shopping store by travel mode
*SM/SC = Supermarkets and Supercenters. Source: Ver Ploeg, Michele, Lisa Mancino, Jessica E. Todd, Dawn Marie Clay, and Benjamin Scharadin. Where Do Americans Usually Shop for Food and How Do They Travel To Get There? Initial Findings From the National Household Food Acquisition and Purchase Survey, EIB-138, U.S. Department of Agriculture, Economic Research Service, March 2015.
62
Households often bypass the nearest supermarket to obtain groceries
• The average straight-line distance, 2.1 miles
• The average distance to store where household usually shops, 3.8 miles
• This behavior holds even for those who walk, bike, or take public transit traveled
SNAP = Supplemental Nutrition Assistance Program. WIC = Special Supplemental Nutrition Program for Women, Infants, and Children. Source: Ver Ploeg, Michele, Lisa Mancino, Jessica E. Todd, Dawn Marie Clay, and Benjamin Scharadin. Where Do Americans Usually Shop for Food and How Do They Travel To Get There? Initial Findings From the National Household Food Acquisition and Purchase Survey, EIB-138, U.S. Department of Agriculture, Economic Research Service, March 2015.
Figure 2. Distance to nearest SNAP-authorized SM/SC and to primary shopping store for selected subgroups
63
New Insights: SNAP Households Food Shopping Behaviors
Does regional price variation influence the real value of SNAP benefits? • Bronchetti et al. (2015) findings suggest that 20% to 30% of SNAP
households face TFP prices that are high enough to be purchased with their benefits plus 30% of their net income. The proportion increases as the distance increases.
• Basu et al. (2016) find that living in areas with higher cost of living is associated with acquisition of less healthy foods. Authors find that SNAP households are no more likely to live in lower cost of living areas.
• Lyford et al. (2016) find that budgeting plays a crucial role in the affordability of food for individuals receiving SNAP. On average the index of food prices paid by SNAP recipients was 0.09 points lower.
• Chang et al. (2016) find that, while SNAP recipients are better able to employ competent consumer strategies, these strategies are far from ubiquitous.
64
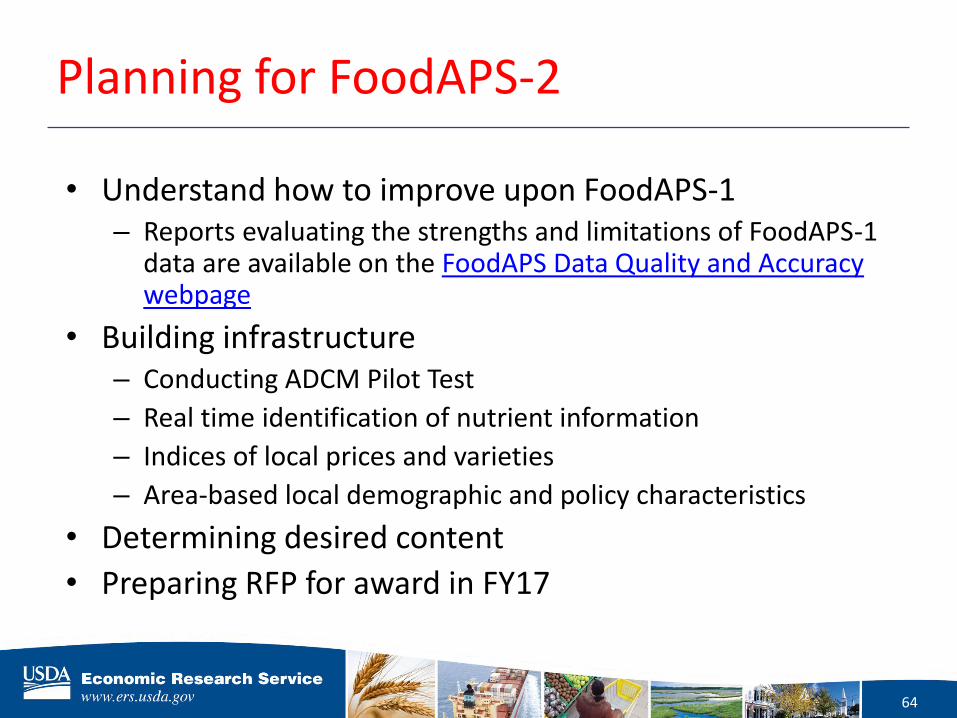
Planning for FoodAPS-2
• Understand how to improve upon FoodAPS-1 – Reports evaluating the strengths and limitations of FoodAPS-1
data are available on the FoodAPS Data Quality and Accuracy webpage
• Building infrastructure – Conducting ADCM Pilot Test
– Real time identification of nutrient information
– Indices of local prices and varieties
– Area-based local demographic and policy characteristics