Page 1
Office of the Commissioner, 7th floor, KHB Annex, Cauvery Bhavan, K G Road, Bengaluru-09
WELCOME To
Regional Review Meeting of States of Southern Region
29th & 30th July, 2019 Bengaluru, Karnataka
GOVERNMENT OF KARNATAKA
WATERSHED DEVELOPMENT DEPARTMENT
Page 2
KARNATAKA
• Total area 190.50 lakh ha. Cultivable area 118.05 lakh ha. (62%).
• Only 34% area under irrigation. Highest Drought Prone area next to Rajasthan.
• 10 Agro-climatic zones with rich crop diversity
• 81% are SF/MF holdings. Average size of holding 1.36 ha.
Page 3
32%
37% 4%
27%
PRESENT STATUS OF WATERSHED INTERVENTION IN KARNATAKA STATE (AREA IN LAKH HA)
Total Area of the state not
suitable for Watershed
Interventions
Area covered with Watershed
Interventions
Present area Area under
Watershed Interventions
Remaing area available for
Watershed Interventions
(69.85)
(60.80) (52.31)
(7.54)
Out of 7.54 lakh ha. watershed area under treatment under PMKSY-WDC (IWMP projects), in
6.48 lakh ha. batch V &VI projects (132 projects) watershed activities stopped, as per DoLR, GOI
Letter No. Z-11011/32/2014-PPC dated. 01.08.2018
Page 4
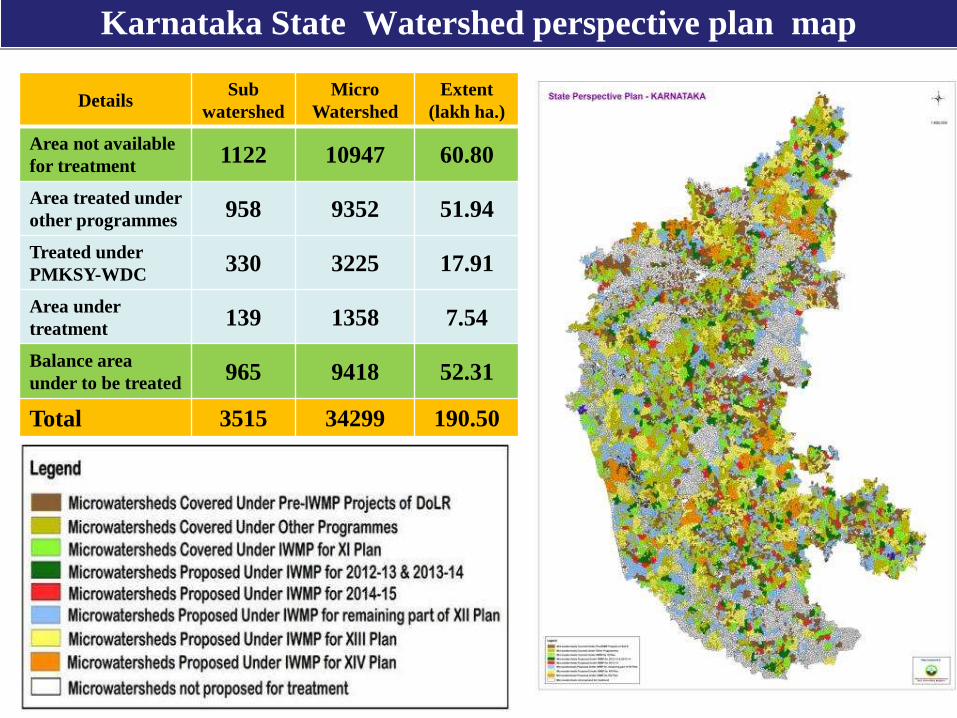
Karnataka State Watershed perspective plan map
Details Sub
watershed
Micro
Watershed
Extent
(lakh ha.)
Area not available
for treatment 1122 10947 60.80
Area treated under
other programmes 958 9352 51.94
Treated under
PMKSY-WDC 330 3225 17.91
Area under
treatment 139 1358 7.54
Balance area
under to be treated 965 9418 52.31
Total 3515 34299 190.50
Page 6
Structure of implementation of Watershed
projects in Karnataka State
• Since 2000 a separate Watershed Development
department, as multidisciplinary team at HQ and
field created for implementation
• Since 2014-15 the field units have been merged
with Agriculture Dept.
• At GP level Watershed Committees execute the
works
Page 7
Community Based Organization are formed at the project level
Self Help Groups ( Avg. 34 SHGs/project with 15-20 members)
User Groups (Avg. 36 UGs/project with 35-40 members)
Watershed Committee / Executive Committee
GP President will be the President of the Committee
Departmental staff – Secretary cum treasurer(AAO)
Execution by Watershed Committee
11 – 15 members
Watershed Committees /
Executive Committee
SHGs 4 - 5 UGs 5 - 6
GPs 2 - 3
( formed under 61 A of Panchayat Raj Act )
Page 8
Sl
No
Name of
the
Batch
Total
number of
projects
sanctioned
Total area
sanctioned
(lakh ha)
Project
cost
Total
funds
released
Total
Exp.
% Progress to
the project cost
Area
treated
(in lakh
ha.)
Remarks
1 2 3 4 5 6 7 8 9 10
1 Batch-I 119 4.91 632.68 617.17 584.66 92.41 4.54
All the 119 projects are
completed and Final completion
and Evaluation report submitted
to DoLR by Jan-2019
2 Batch-II 127 5.46 703.93 704.47 642.41 91.26 4.98
All the 127 projects are
completed and final completion
and Evaluation report submitted
to DoLR by Jan-2019
3 Batch-III 116 5.48 711.75 610.49 610.82 85.82 4.70
All the projects are completed on
31.3.2019. Proposal submitted to
DoLR to vide letter dated
12.06.19 to extend the project
period beyond March-19 and
release the funds allocated to the
State
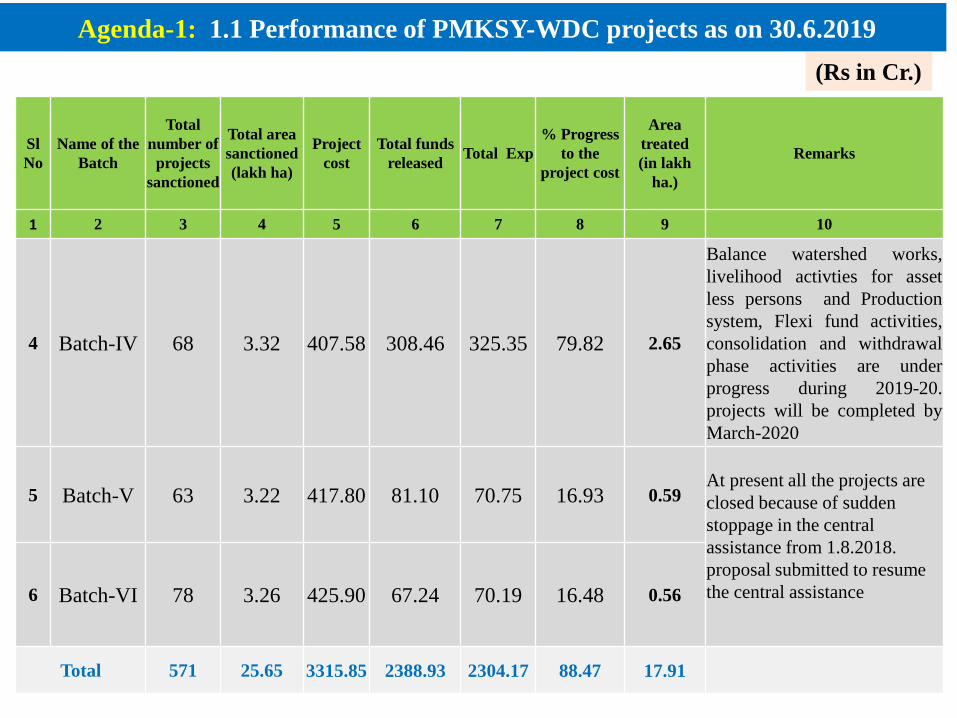
Agenda-1.1: Performance of PMKSY-WDC projects as on 30.6.2019
(Rs in Cr.)
Page 9
Sl
No
Name of the
Batch
Total
number of
projects
sanctioned
Total area
sanctioned
(lakh ha)
Project
cost
Total funds
released Total Exp
% Progress
to the
project cost
Area
treated
(in lakh
ha.)
Remarks
1 2 3 4 5 6 7 8 9 10
4 Batch-IV 68 3.32 407.58 308.46 325.35 79.82 2.65
Balance watershed works,
livelihood activties for asset
less persons and Production
system, Flexi fund activities,
consolidation and withdrawal
phase activities are under
progress during 2019-20.
projects will be completed by
March-2020
5 Batch-V 63 3.22 417.80 81.10 70.75 16.93 0.59 At present all the projects are
closed because of sudden
stoppage in the central
assistance from 1.8.2018.
proposal submitted to resume
the central assistance
6 Batch-VI 78 3.26 425.90 67.24 70.19 16.48 0.56
Total 571 25.65 3315.85 2388.93 2304.17 88.47 17.91
Agenda-1: 1.1 Performance of PMKSY-WDC projects as on 30.6.2019
(Rs in Cr.)
Page 10
0.00
2.00
4.00
6.00
8.00
10.00
12.00
14.00
16.00
18.00
0.09 0.23 1.01
3.14 3.95
2.44 1.17 1.53
2.07 2.09
0.18
17.91
Year wise area treated under PMKSY-WDC programme in Karnataka State (in lakh.ha)
Page 11
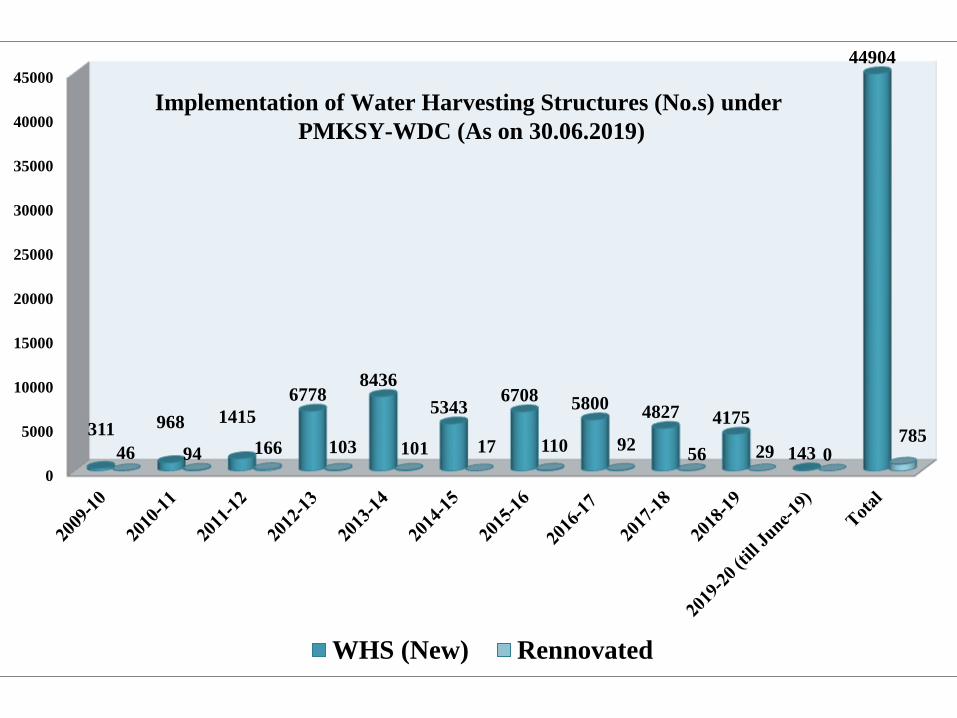
0
5000
10000
15000
20000
25000
30000
35000
40000
45000
311 968 1415
6778 8436
5343 6708 5800
4827 4175
143
44904
46 94 166 103 101 17 110 92 56 29 0
785
WHS (New) Rennovated
Implementation of Water Harvesting Structures (No.s) under
PMKSY-WDC (As on 30.06.2019)
Page 12
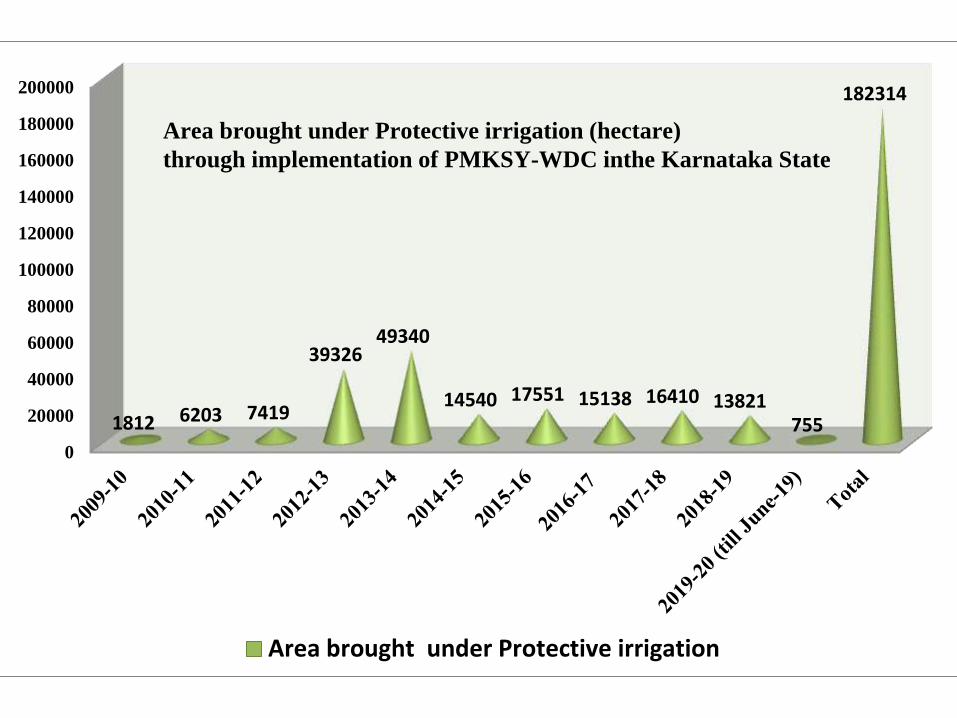
0
20000
40000
60000
80000
100000
120000
140000
160000
180000
200000
1812 6203 7419
39326 49340
14540 17551 15138 16410 13821 755
182314
Area brought under Protective irrigation
Area brought under Protective irrigation (hectare)
through implementation of PMKSY-WDC inthe Karnataka State
Page 13
0
50000
100000
150000
200000
250000
300000
2530 5316 12983 26095
72877
24722 21668 20095
40681 34980
813
262759
Farmers benifitted
Number of farmers benifitted under PMKSY-WDC in
Karnataka State
Page 14
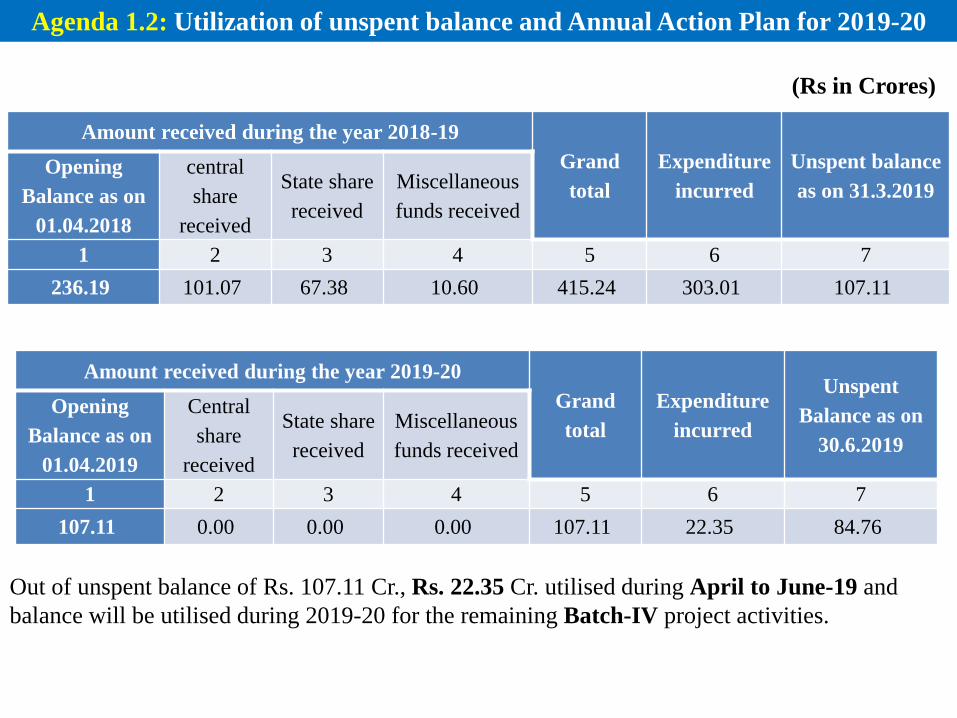
Agenda 1.2: Utilization of unspent balance and Annual Action Plan for 2019-20
Amount received during the year 2018-19
Grand
total
Expenditure
incurred
Unspent balance
as on 31.3.2019
Opening
Balance as on
01.04.2018
central
share
received
State share
received
Miscellaneous
funds received
1 2 3 4 5 6 7
236.19 101.07 67.38 10.60 415.24 303.01 107.11
Out of unspent balance of Rs. 107.11 Cr., Rs. 22.35 Cr. utilised during April to June-19 and
balance will be utilised during 2019-20 for the remaining Batch-IV project activities.
Amount received during the year 2019-20
Grand
total
Expenditure
incurred
Unspent
Balance as on
30.6.2019
Opening
Balance as on
01.04.2019
Central
share
received
State share
received
Miscellaneous
funds received
1 2 3 4 5 6 7
107.11 0.00 0.00 0.00 107.11 22.35 84.76
(Rs in Crores)
Page 15
Sl.
No.
Name of the
Batch I Quarter II Quarter III Quarter IV Quarter
Total
requirement
(2019-20)
1 2 3 4 5 6 7
1
Batch-III*
(Projects Sanctioned
in 2011-12)
12.67 29.56 42.24
2
Batch-IV
(Projects Sanctioned
in 2012-13)
21.69 25.94 25.95 31.00 104.58
3
Batch-V**
(Projects Sanctioned
in 2013-14)
0.28 0.28
4
Batch-VI**
(Projects Sanctioned
in 2014-15)
0.39 0.39
Total 22.36 38.61 55.51 31.00 147.48
Agenda 1.2: Utilization of unspent balance and Annual Action Plan for 2019-20
*Proposal submitted to extend the project period beyond March-19.
**Fund required for Audit and documentation of the activities
Page 16
Agenda 1.3: Status of completion of Batch-I, Batch-II and Batch-III projects
Sl
No
Name of
the batch
Total
No. of
Projects
Date of
Sanction of
projects
Date of
Completion
of Projects
Submission of
final project
wise
completion
report
Submission of
final project
wise evaluation
report
1 2 3 4 5 6 7
1 Batch-I 119 30.09.2009 31.3.2017
Submitted all
119 completion
report
Submitted all
119 evaluation
report
2 Batch-II 127 29.9.2010 31.3.2018
Submitted all
127 completion
report
Submitted all
127 evaluation
report
3 Batch-III 116 16.9.2011 31.3.2019
Proposal submitted to DoLR to
extend the project period beyond
March-2019. Reply from DoLR
awaited
Total 362 246 246
Page 17
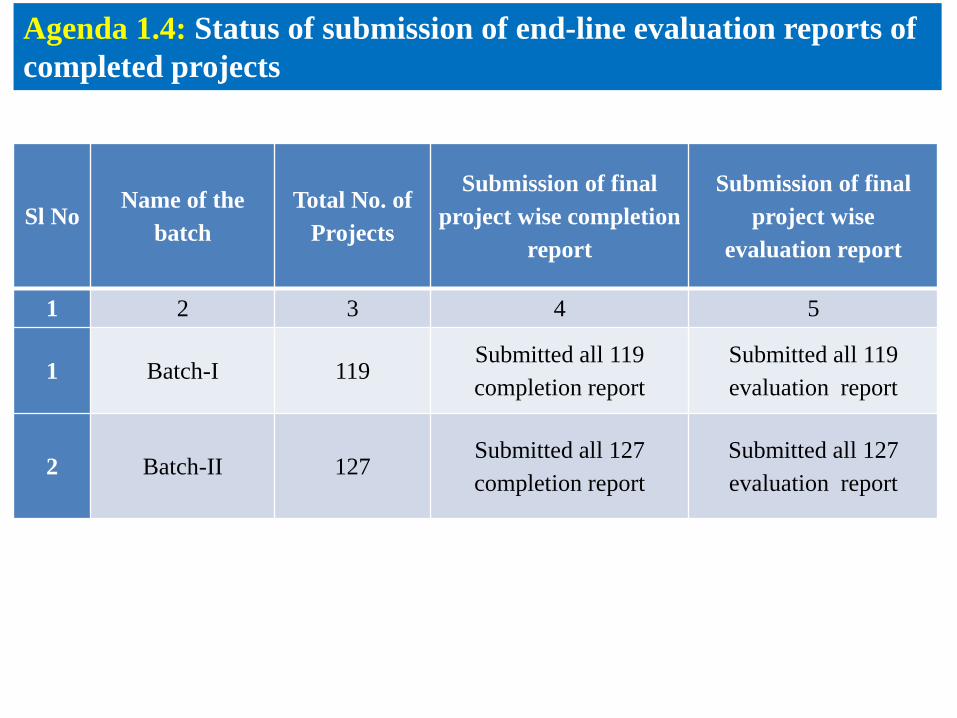
Agenda 1.4: Status of submission of end-line evaluation reports of
completed projects
Sl No Name of the
batch
Total No. of
Projects
Submission of final
project wise completion
report
Submission of final
project wise
evaluation report
1 2 3 4 5
1 Batch-I 119 Submitted all 119
completion report
Submitted all 119
evaluation report
2 Batch-II 127 Submitted all 127
completion report
Submitted all 127
evaluation report
Page 18
STATUS OF WATERSHED DEVELOPMENT FUND (WDF) & ASSET
TRANSFER TO G.P.S (BATCH-I & II Projects )
Sl. No. Details Batch-I Batch-II
1 No. of Projects 119 127
2 No. of ECs 330 375
WDF Fund Available
38.72 Cr.
Asset created
10,363
Fund Transferred
32.39 Cr.
Asset Transferred
8,137
Page 19
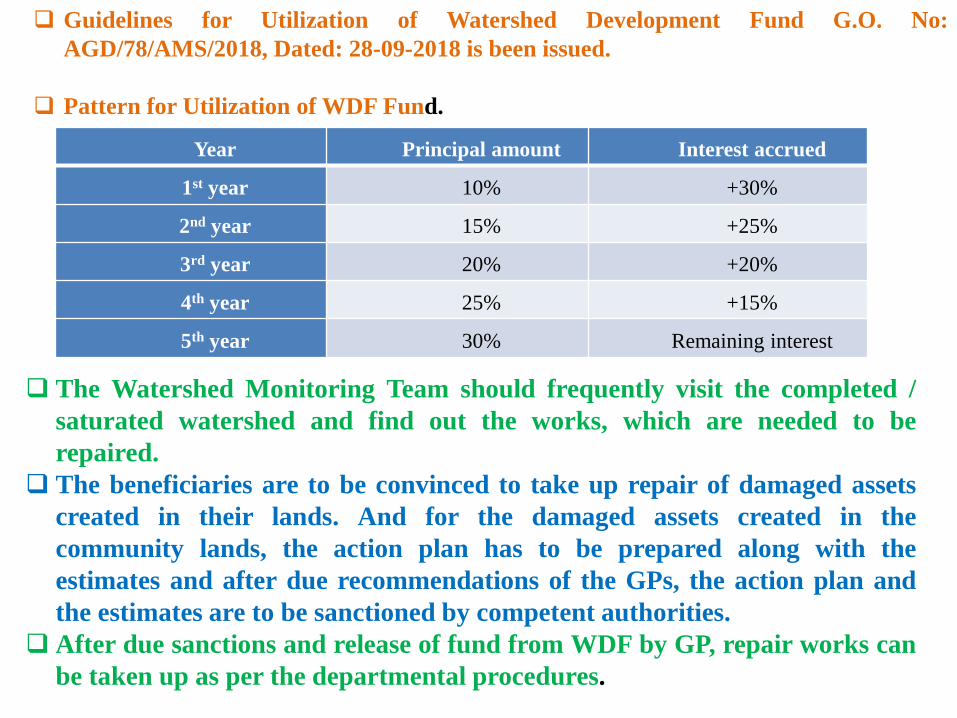
Year Principal amount Interest accrued
1st year 10% +30%
2nd year 15% +25%
3rd year 20% +20%
4th year 25% +15%
5th year 30% Remaining interest
Guidelines for Utilization of Watershed Development Fund G.O. No:
AGD/78/AMS/2018, Dated: 28-09-2018 is been issued.
Pattern for Utilization of WDF Fund.
The Watershed Monitoring Team should frequently visit the completed /
saturated watershed and find out the works, which are needed to be
repaired.
The beneficiaries are to be convinced to take up repair of damaged assets
created in their lands. And for the damaged assets created in the
community lands, the action plan has to be prepared along with the
estimates and after due recommendations of the GPs, the action plan and
the estimates are to be sanctioned by competent authorities.
After due sanctions and release of fund from WDF by GP, repair works can
be taken up as per the departmental procedures.
Page 20
Agenda 1.5: Projects likely to be completed during 2019-20,
especially in Quarter-II
Sl No Name of the batch
Total No. of
Projects
sanctioned
No.of projects likely to be
completed
in quarter-II of 2019-20
1 2 3 4
1 Batch-III 116 51
2 Batch-IV 68 4
Total 184 55
Page 21
Yet be
Moderate
Total
Geotag Accepted
103809 116559* 2738
Rejected
10012
Agenda 1.6: Implementation of Srishti & Drishti
* On an average 204 photos are geotagged per project
Page 22
Agenda 1.7: Implementation of PFMS
At present SLNA (State) level, WCDC (District) level and PIA
(Taluk) level transactions under PMKSY-WDC is through State
Treasury (Khajane–2) system and expenditure is monitored by
“Public Financial Management System” (PFMS).
Only Executive Committee level is under banking system. There
are 160 Executive Committees in Batch-IV, all these Committees
are mapped on PFMS, and Executive Committee level
transactions are made online through Print Payment Advise
(PPA) (Expenditure Advance Transfer (EAT) module) when PPA
is generated and sent to Bank for payment, then only money will
be transferred to the concerned beneficiary account or vender
account.
Page 23
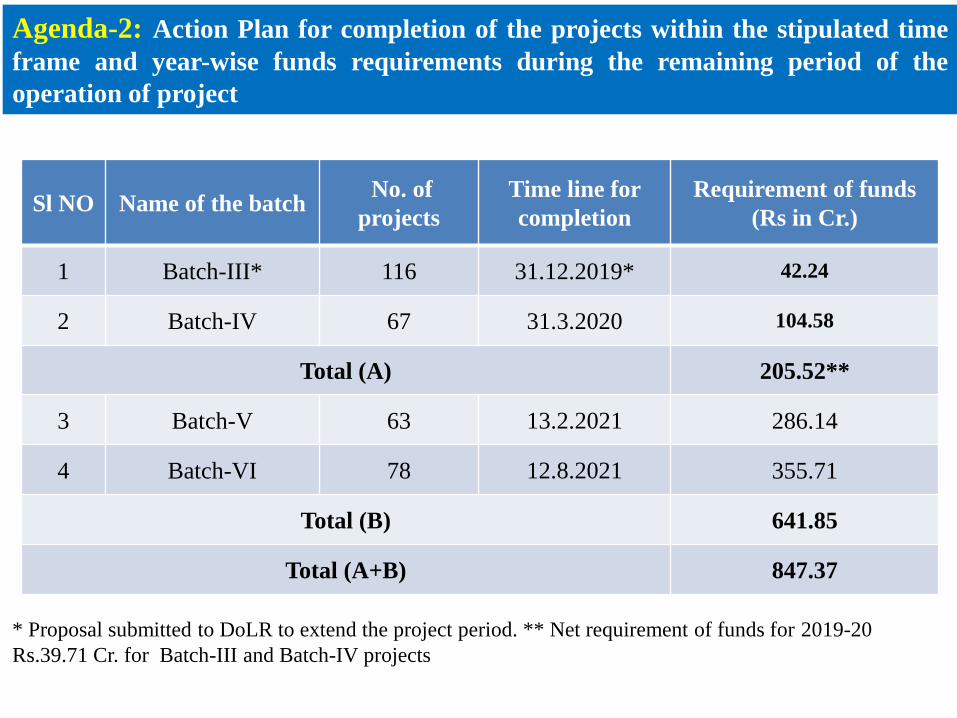
Agenda-2: Action Plan for completion of the projects within the stipulated time
frame and year-wise funds requirements during the remaining period of the
operation of project
Sl NO Name of the batch No. of
projects
Time line for
completion
Requirement of funds
(Rs in Cr.)
1 Batch-III* 116 31.12.2019* 42.24
2 Batch-IV 67 31.3.2020 104.58
Total (A) 205.52**
3 Batch-V 63 13.2.2021 286.14
4 Batch-VI 78 12.8.2021 355.71
Total (B) 641.85
Total (A+B) 847.37
* Proposal submitted to DoLR to extend the project period. ** Net requirement of funds for 2019-20
Rs.39.71 Cr. for Batch-III and Batch-IV projects
Page 24
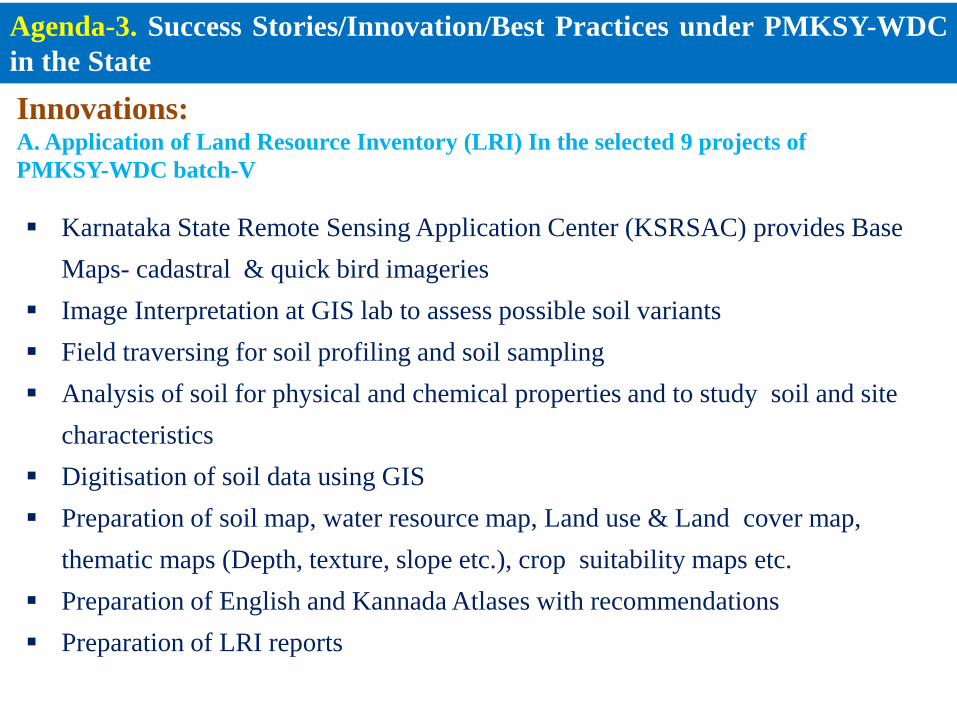
Agenda-3. Success Stories/Innovation/Best Practices under PMKSY-WDC
in the State
Innovations: A. Application of Land Resource Inventory (LRI) In the selected 9 projects of
PMKSY-WDC batch-V
Karnataka State Remote Sensing Application Center (KSRSAC) provides Base
Maps- cadastral & quick bird imageries
Image Interpretation at GIS lab to assess possible soil variants
Field traversing for soil profiling and soil sampling
Analysis of soil for physical and chemical properties and to study soil and site
characteristics
Digitisation of soil data using GIS
Preparation of soil map, water resource map, Land use & Land cover map,
thematic maps (Depth, texture, slope etc.), crop suitability maps etc.
Preparation of English and Kannada Atlases with recommendations
Preparation of LRI reports
Page 25
Sujala -III for science based site-specific planning and implementation of watershed and
other flagship programmes in Karnataka through the establishment of LRI Digital
Library, LRI Portal and Decision Support System
Generation of site-specific LRI Database
& Thematic outputs using state of art RS,
GIS & Mapping techniques by Consortium
partners
Integration of multiple spatial & non-
spatial data sets generated into a
seamless state-wide data set on a unified
platform
Facilitating easy access to all the line
depts. & other stakeholders
Facilitating access of the data over
mobile platforms
Extending decision support to multiple
stakeholders for conservation planning,
nutrient, pest management and other
uses
Page 26
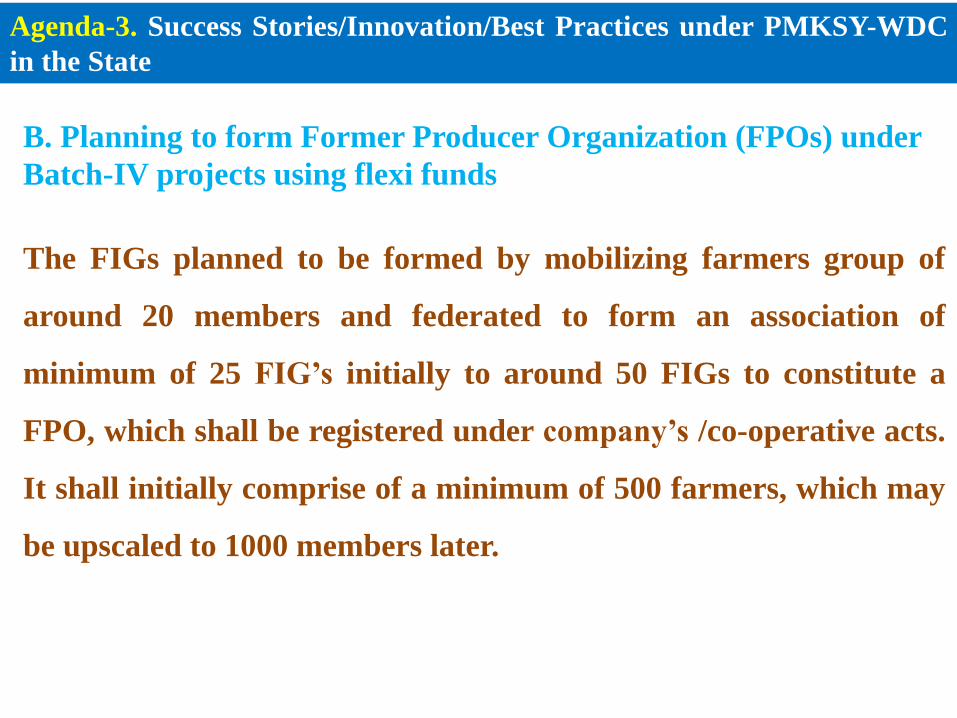
Agenda-3. Success Stories/Innovation/Best Practices under PMKSY-WDC
in the State
B. Planning to form Former Producer Organization (FPOs) under
Batch-IV projects using flexi funds
The FIGs planned to be formed by mobilizing farmers group of
around 20 members and federated to form an association of
minimum of 25 FIG’s initially to around 50 FIGs to constitute a
FPO, which shall be registered under company’s /co-operative acts.
It shall initially comprise of a minimum of 500 farmers, which may
be upscaled to 1000 members later.
Page 27
Addressing the entire value chain, right from the stage of pre-production to the consumers table through appropriate & timely interventions
Promotion of good agricultural practices
to enhance production & productivity &
providing nutritional security to the people.
Mobilising farmers into FIGs and formation
to Farmer Producer Organisation (FPOs)
Creating employment opportunities for
skilled and unskilled persons,
especially unemployed youth.
Improving value addition and making
farming aviable business proposition
thereby ensuring
increase in farmer’s profitability
PUBLIC -PRIVATE PARTNERSHIP FOR INTEGRATED AGRICULTURE DEVELOPMENT (PPP-IAD)
Augmenting the current Government efforts
in agricultural development by leveraging
the capabilities of the private sector by :
Page 28
Monitoring Domain
Data Availability
Domain Remunerative
prices
Market linkages Post
harvest / Value
Addition
Agricultural practices
and productivity
State and Private partners
jointly built up PHM
infrastructure
to support farmers
Entire value chain – right from
preproduction to consumers table
Ensure market linkages
Making farming business
viable
Steps to address the challenges
Promotion of GAP
by private partners
Reduce involment
of Middleman
Aggregation to FPOs
Direct Marketing
Creation of
infrastructure
Development of PPP-model to attract investment in
integrated value chains
Page 29
Journey of PPP- IAD in Karnataka
Year of initiation
Number of projects
approved during 2018-19
2017-18
8 Projects under
implementation
7
Period of projects
sanctioned
3 - 5 years
Districts covered
3 – 5
years 3 – 5
years
12
Farmers covered
Area covered
Major crops 78650
55550
Page 30
30
Ongoing Field Activities Farmers Training Programs
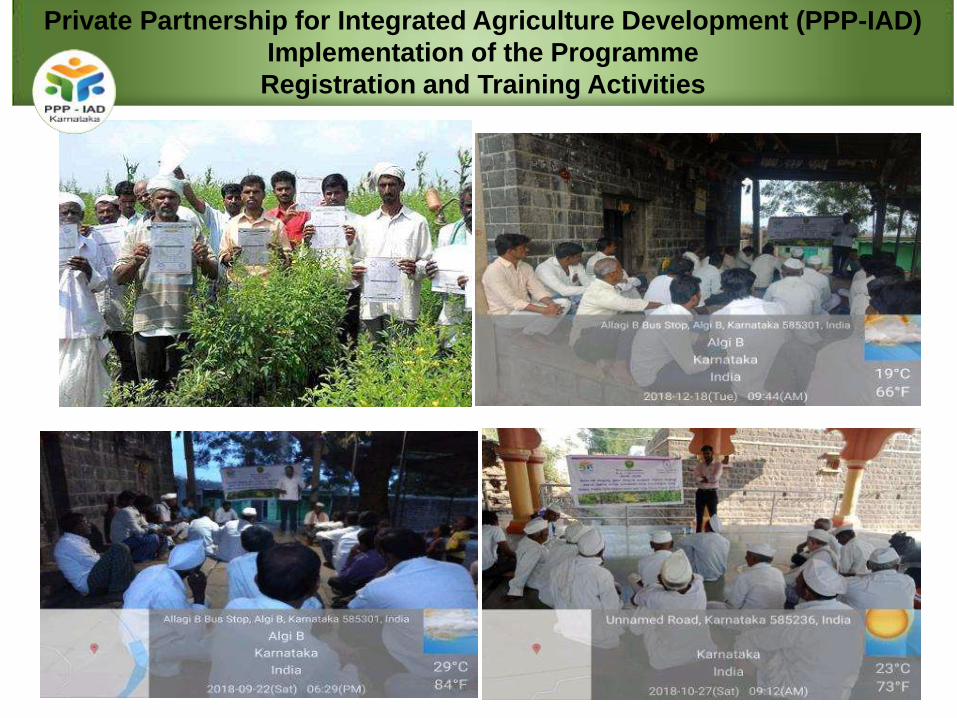
Private Partnership for Integrated Agriculture Development (PPP-IAD)
Implementation of the Programme
Registration and Training Activities
Page 31
Private Partnership for Integrated Agriculture Development (PPP-IAD)
Implementation of the Programme
Seed Production and Demonstrations
Seed production Area : 156.4 Ha ; Quantity of Seed production : 1561.15 Qtls
Page 32
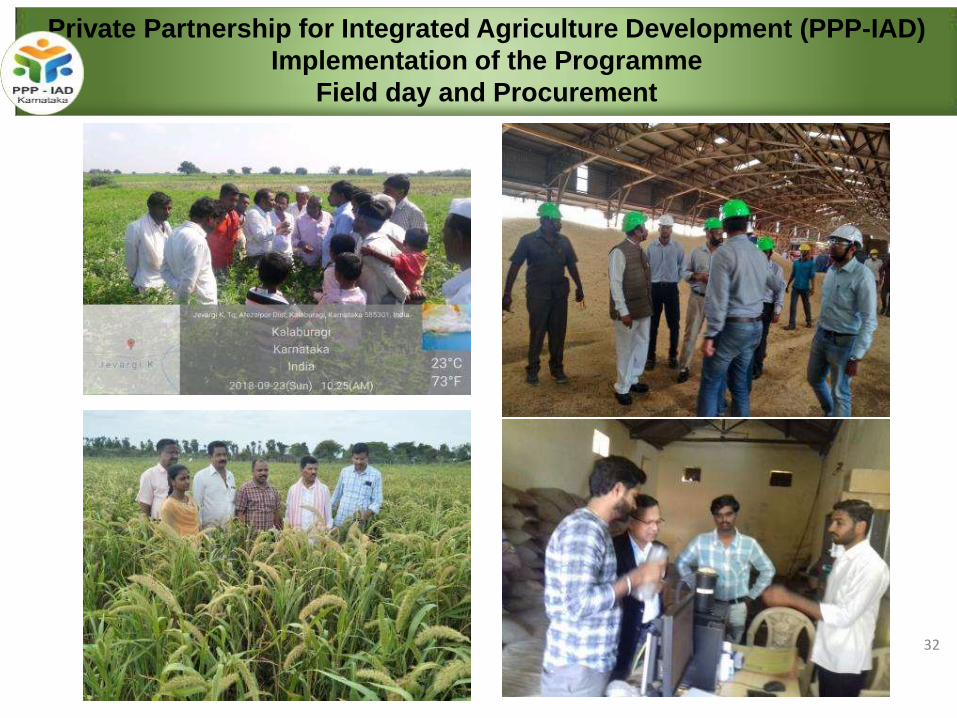
Private Partnership for Integrated Agriculture Development (PPP-IAD)
Implementation of the Programme
Field day and Procurement
32
Page 33
Karnataka FPO Policy-2018
Collectivization of primary producers,
especially small and marginal farmers, into
producer organizations
Karnataka Farmer Producer Organizations
Policy 2018 launched.
Policy shall be common for all departments
and developmental agencies
The state envisages to form atleast one
FPO in every hobli jurisdiction there by
collectivizing atleast 5 lakhs farmers over the
next five years.
Page 34
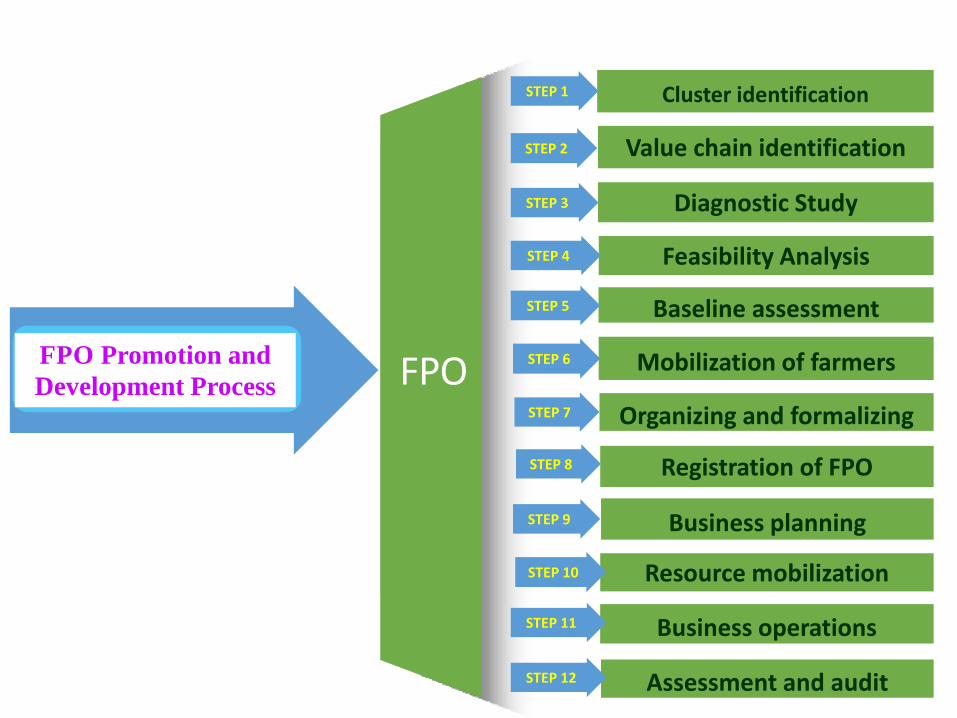
Feasibility Analysis
Cluster identification
Organizing and formalizing
Diagnostic Study
Value chain identification
Baseline assessment
Resource mobilization
Mobilization of farmers
Assessment and audit
Business planning
Registration of FPO
Business operations
FPO Promotion and
Development Process
Page 35
Agenda-4. Progress on Jal Shakthi Abhiyan (JSA) in Karnataka State
Department of drinking water and Sanitation, Ministry of Jal Shakthi, GOI
has identified 52 blocks falling in 18 districts in the State for the Jal Shakthi
Abhiyan Programme.
During 2019-20 Karnataka State is implementing only Batch-IV programme
remaining activties.
Instructions issued to all 18 district Joint Director of Agriculture to
implement the balance activities of Watershed works under Batch-IV
programme and instructed to update the progress in JSA portal and also to
extend cooperation to JSA team.
Proposal submitted to DoLR to provide funds to construct the water
harvesting structures which are more of material intensive in nature under
PMKSY-WDC programme of Batch-V and Batch-VI and also the extend the
project periods of Batch-III beyond March-19.
Page 36
Agenda-4. State target for Jal -Shakthi Abhiyan (JSA)
State target for under PMKSY-WDC for Jal Shakti Abhiyan (JSA)
Name of the State: KARNATAKA
Indicator
Ongoing and expected activities to be completed by
From 1.4.2019 to 31.12.2019
Batch-III* Batch-IV Total
Phy
New WHS Created to be created
Farm Pond 20 32 52 Check Dam / Vented dam 34 57 91 Nala bund 38 23 61 Percolation Tank/MPT 27 7 34 Ground Water Recharge Structure 22 30 52 Others GOKATTE/MPT 3 3 Total (A) 141 152 293 Soil and Moisture conservation measures (ha) Staggered trenching Contour Bunding/ Field Bunding/TCB 523 5068 5591 Graded Bunding Bench Terracing Gully plugs (Nos) 939 939
Page 37
VISIT OF JAL SHAKTHI ABHIYAN TEAM TO PMKSY-WDC
PROJECT AREA IN BALLARY DIST, KARNATAKA STATE
Page 38
Visit of Jal Shakthi Abhiyan Team to PMKSY-WDC project area in
Ballary Dist, Karnataka State
Page 39
Jalashakthi Abhiyana Team Visit to RKVY-Checkdam in Tarikere Village of Hosdurga Taluk
Page 40
Jalashakthi Abhiyan Team visit to Nalabund in Beerenahalli village of Hiriyuru Taluk
Page 42
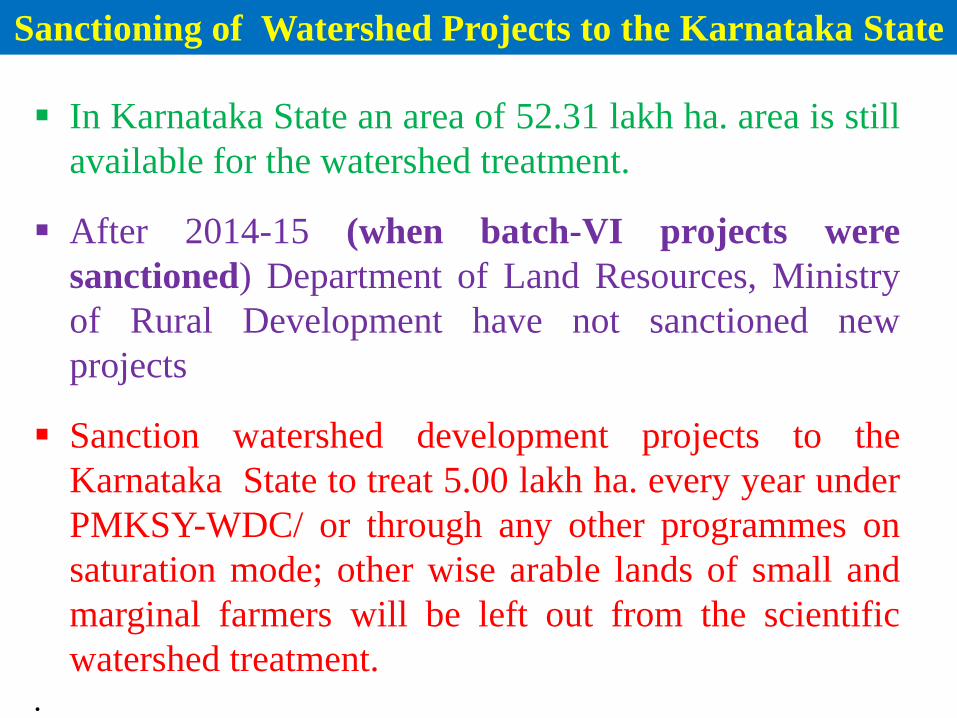
In Karnataka State an area of 52.31 lakh ha. area is still
available for the watershed treatment.
After 2014-15 (when batch-VI projects were
sanctioned) Department of Land Resources, Ministry
of Rural Development have not sanctioned new
projects
Sanction watershed development projects to the
Karnataka State to treat 5.00 lakh ha. every year under
PMKSY-WDC/ or through any other programmes on
saturation mode; other wise arable lands of small and
marginal farmers will be left out from the scientific
watershed treatment. .
.
Sanctioning of Watershed Projects to the Karnataka State
Page 43
Resume central assitance under PMKSY-WDC projects of
Batch-V and Batch-VI.
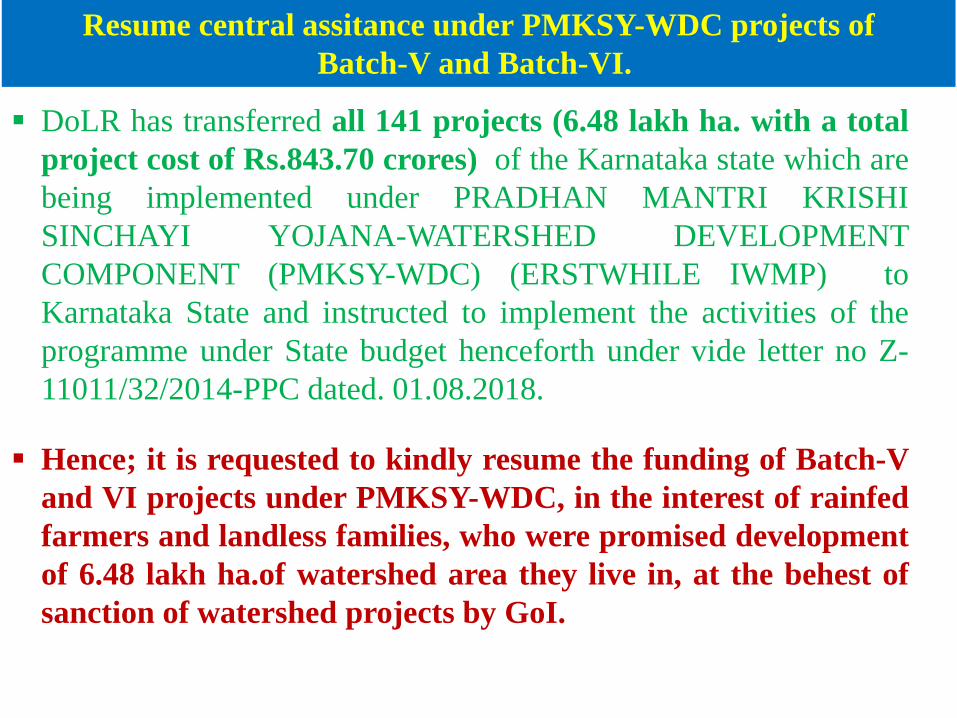
DoLR has transferred all 141 projects (6.48 lakh ha. with a total
project cost of Rs.843.70 crores) of the Karnataka state which are
being implemented under PRADHAN MANTRI KRISHI
SINCHAYI YOJANA-WATERSHED DEVELOPMENT
COMPONENT (PMKSY-WDC) (ERSTWHILE IWMP) to
Karnataka State and instructed to implement the activities of the
programme under State budget henceforth under vide letter no Z-
11011/32/2014-PPC dated. 01.08.2018.
Hence; it is requested to kindly resume the funding of Batch-V
and VI projects under PMKSY-WDC, in the interest of rainfed
farmers and landless families, who were promised development
of 6.48 lakh ha.of watershed area they live in, at the behest of
sanction of watershed projects by GoI.
Page 44
Extension of Batch-III project period to beyond 2019
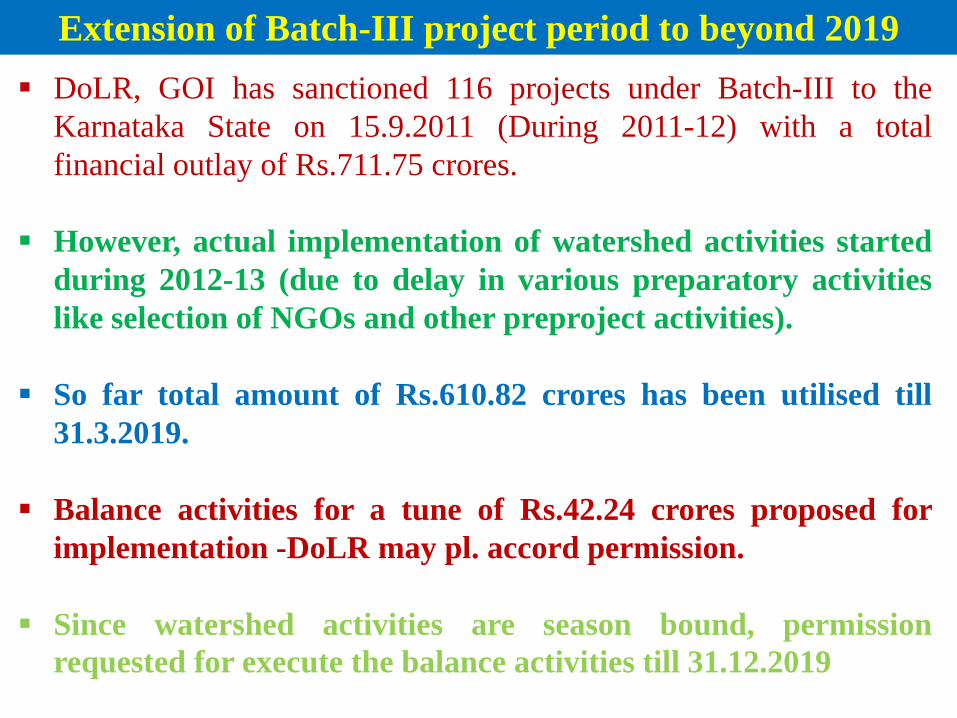
DoLR, GOI has sanctioned 116 projects under Batch-III to the
Karnataka State on 15.9.2011 (During 2011-12) with a total
financial outlay of Rs.711.75 crores.
However, actual implementation of watershed activities started
during 2012-13 (due to delay in various preparatory activities
like selection of NGOs and other preproject activities).
So far total amount of Rs.610.82 crores has been utilised till
31.3.2019.
Balance activities for a tune of Rs.42.24 crores proposed for
implementation -DoLR may pl. accord permission.
Since watershed activities are season bound, permission
requested for execute the balance activities till 31.12.2019
Page 45
GLIMPSE OF VARIOUS
WATERSHED ACTIVITIES
Page 46
Check Dam Check Dam
Farm pond Farm pond
Page 47
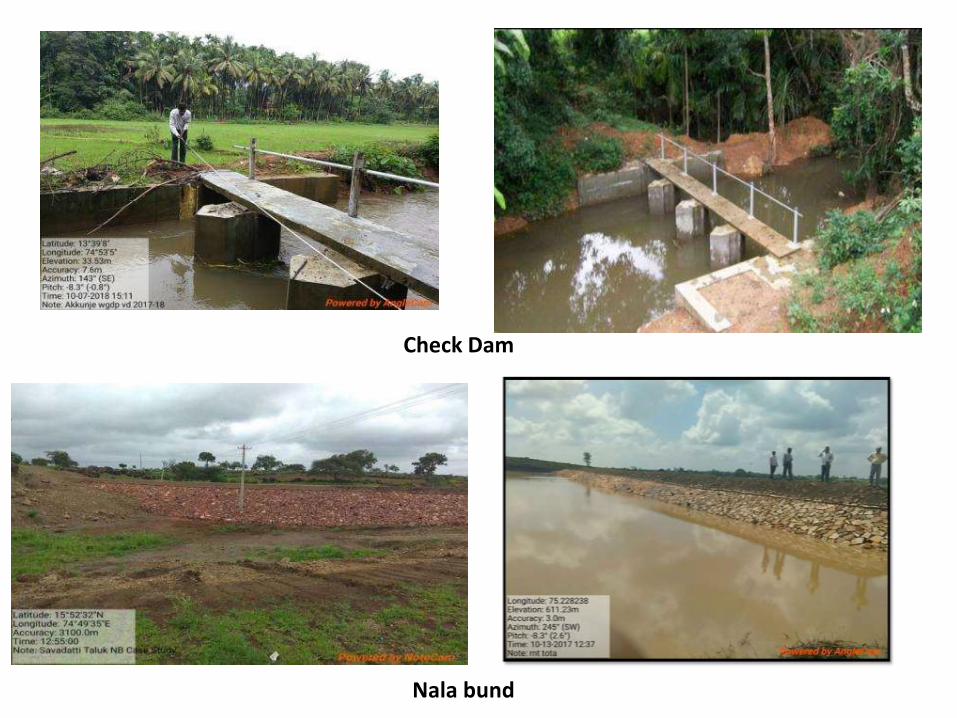
Check Dam
Nala bund
Page 49
Check Dam
Nala bund
Page 50
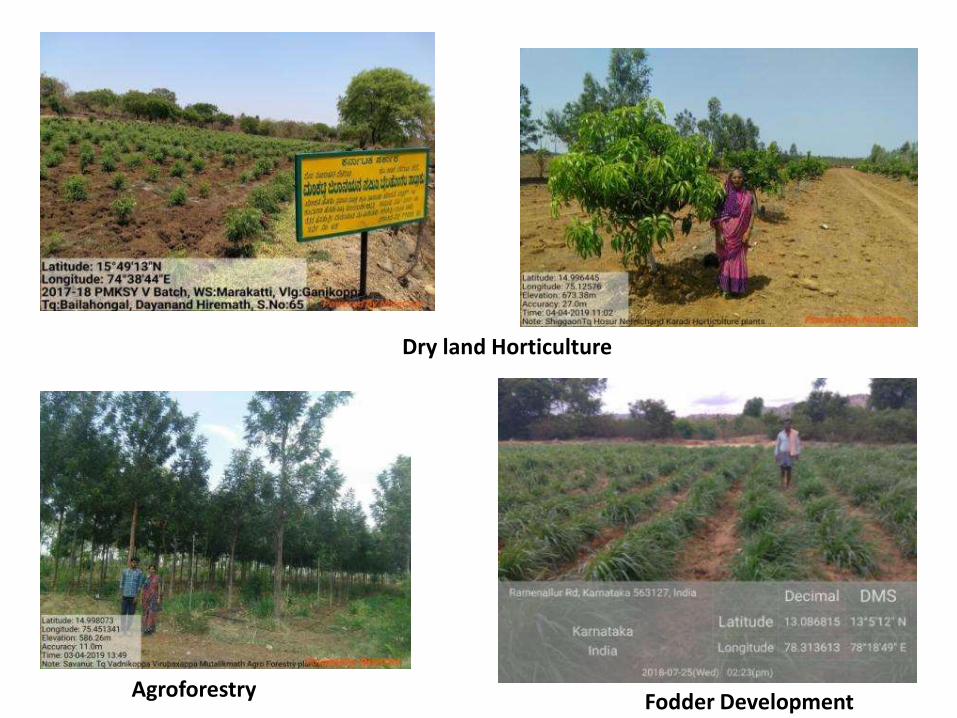
Dry land Horticulture
Agroforestry Fodder Development
Page 51
Dry land Horticulture
Page 52
Dry land Horticulture Dry land Horticulture
Dry land Horticulture
Page 53
Fodder Development
Page 54
Agenda 1.8: Convergence of various
programmes in PMKSY-WDC project areas during last Five Years
Sl. No. Name of the Programme
Financial Progress (Rs in lakhs)
2014-15 2015-16 2016-17 2017-18 2018-19 2019-20
(till June) Total
1 MGNREGA 298.95 140.54 367.98 482.86 938.35 883.62 3112.30
2 PMKSY-OI 0.00 0.00 3394.75 6095.33 6447.81 39.23 15977.11
3 RKVY 49.43 43.70 18.17 577.99 447.46 3.18 1139.94
4 SUJALA-III 16.40 16.23 13.11 247.29 516.20 33.97 843.20
5 KBY 225.53 3185.18 3228.12 2922.67 3386.55 285.81 13233.86
6 Micro-irrigation 774.31 2683.66 3400.66 4069.61 4285.82 42.35 15256.40
7 Other
programmes 470.38 513.46 665.69 723.66 702.67 58.60 3134.47
Grand Total 1835.01 6582.76 11088.48 15119.41 16724.86 1346.77 52697.29
Page 55
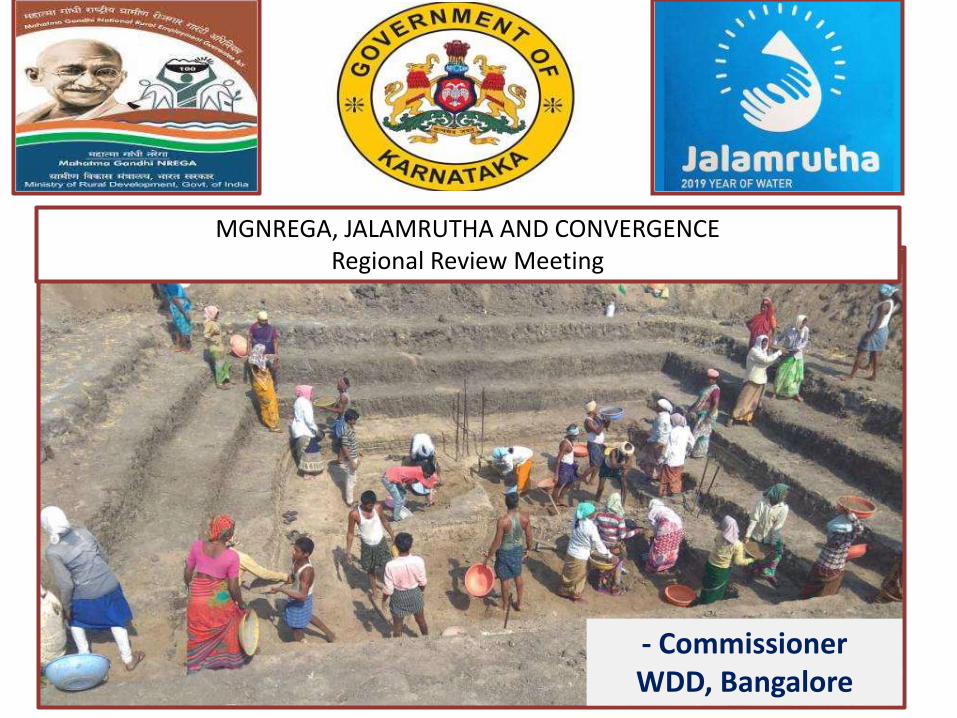
MGNREGA, JALAMRUTHA AND CONVERGENCE Regional Review Meeting
- Commissioner WDD, Bangalore
Page 56
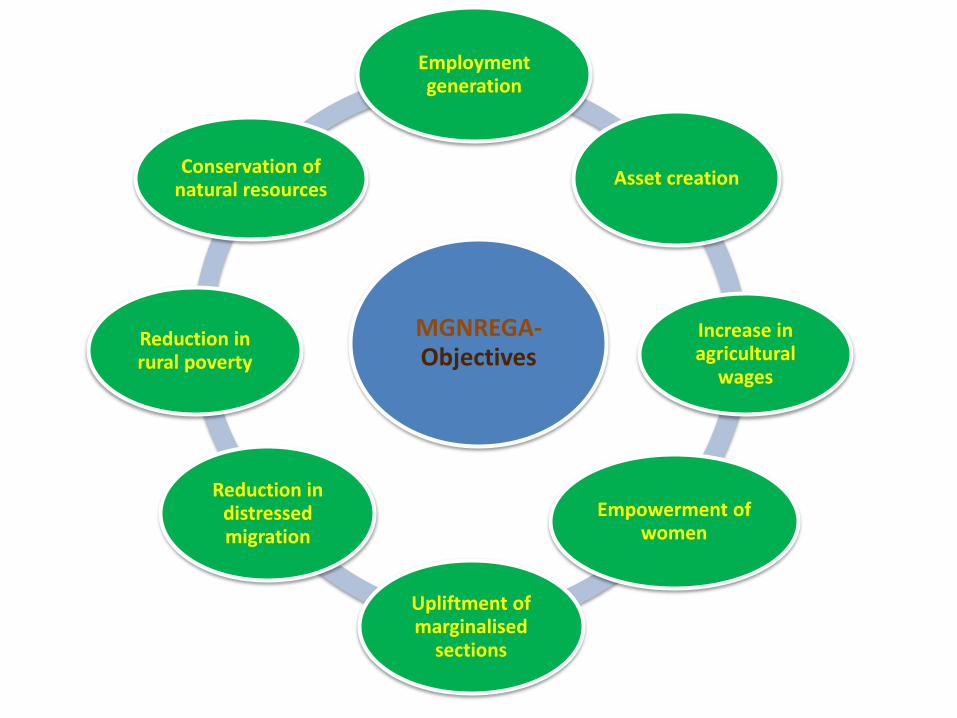
MGNREGA- Objectives
Employment generation
Asset creation
Increase in agricultural
wages
Empowerment of women
Upliftment of marginalised
sections
Reduction in distressed migration
Reduction in rural poverty
Conservation of natural resources
Page 57
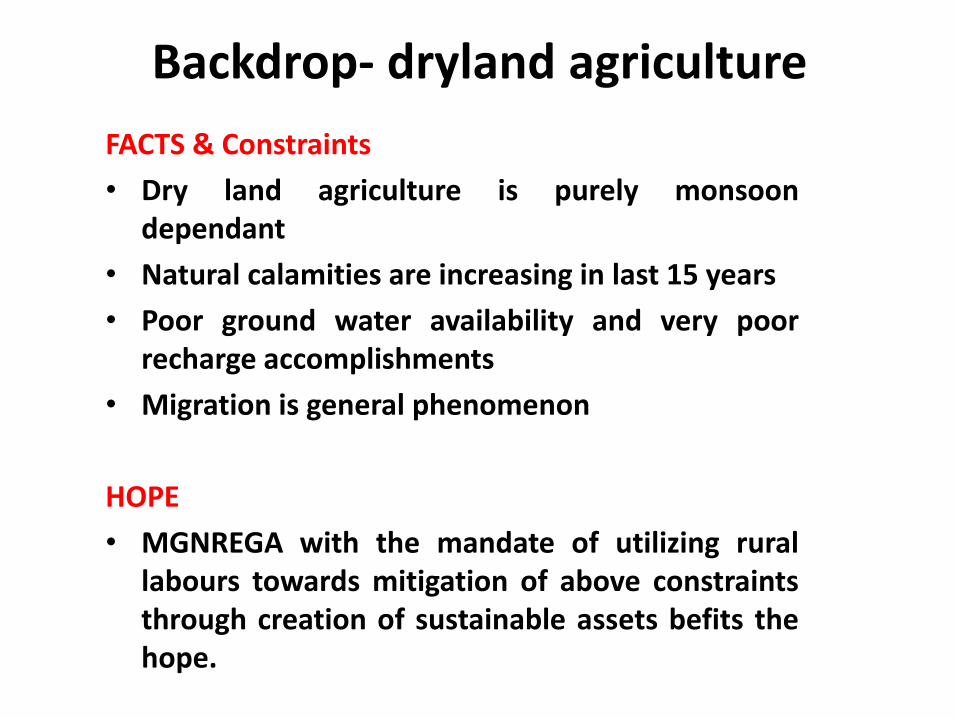
Backdrop- dryland agriculture
FACTS & Constraints
• Dry land agriculture is purely monsoon dependant
• Natural calamities are increasing in last 15 years
• Poor ground water availability and very poor recharge accomplishments
• Migration is general phenomenon
HOPE
• MGNREGA with the mandate of utilizing rural labours towards mitigation of above constraints through creation of sustainable assets befits the hope.
Page 58
Need of the work
• Erosion control in arable and non-arable lands and is mainly aimed to slope stabilization and drainage line treatment.
• Soil Conservation and run off management through individual beneficiary works
• To check erosion - Trench cum Field bundings are taking across the slope.
• Farm ponds - store the water in the rainfed area where water is scantly available, this can be used as life saving irrigation to the crops.
• Both the components help in ground water recharge and increase crop production.
• Vermi compost pits, borewell recharge pits
Page 59
The concept of Ridge to valley approach or the Watershed approach under MGNREGA
• As concept is having area approach and watershed based
• Apart from the MGNREGA provision of gender equality towards employment, the concept gives equal opportunity to treat each parcel of land across big, small, marginal, SC or ST holding.
• action plans are prepared based on scientific inputs from KSRSAC watershed maps, the ridge to valley treatment is well imbibed by rural leadership.
• The abundance availability of rural labour and the educative empowerment through scientific inputs .
• Net planning and action plans are done based on 11.08.2014 MoRD Convergence guidelines
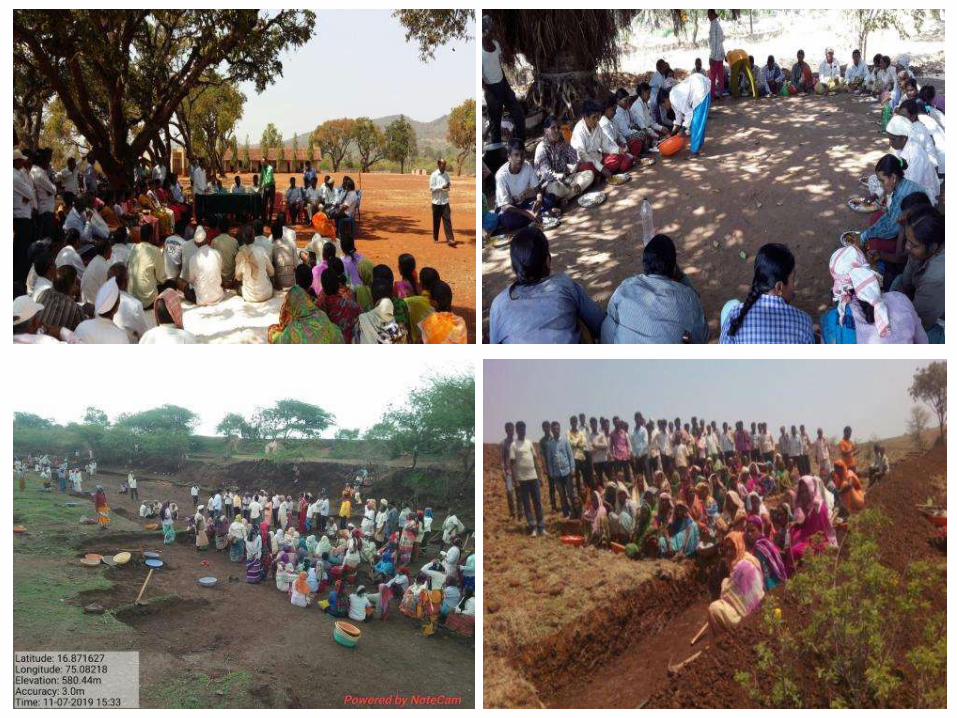
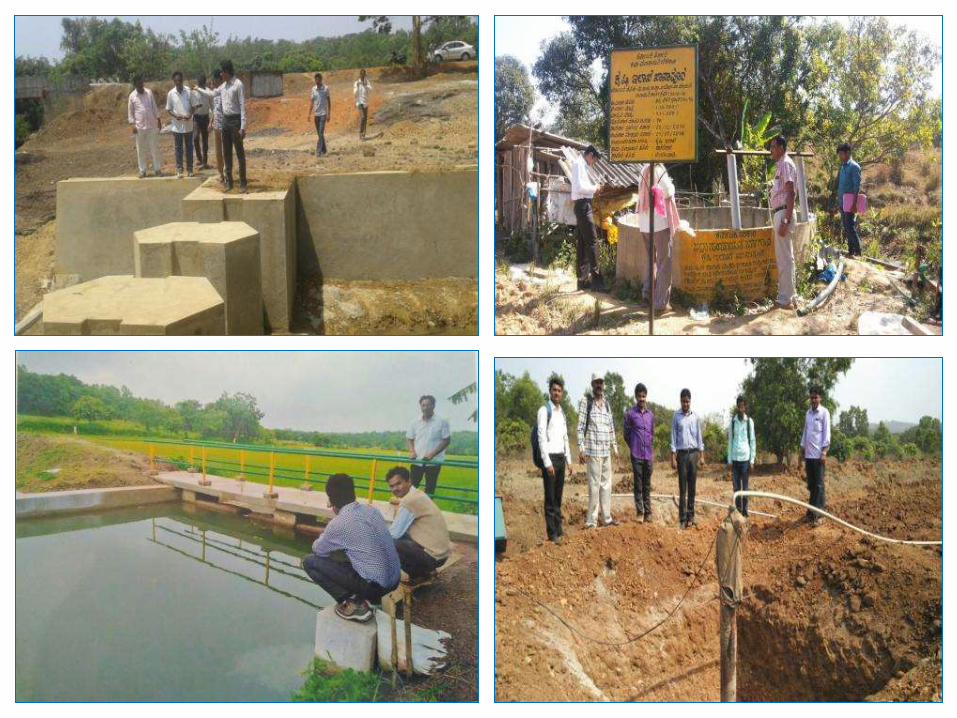
• During 2016-17 about 52 Micro Watersheds were treated ridge to valley approach in Belagavi District, as Jalamrutha Watershed Projects.
Page 60
A Scientific Approach towards Soil and Water Conservation
“ Jalamurtha”
Belagavi District
Thousands have lived without love, not one without water W. H. Auden
Page 61
Belagavi District were declared drought hit.
2015-16 - 8 talukas
2016-17 - all 10 Talukas
2017-18- No Drought
2018-19- Kharif 3 Talukas,
Rabi all 10 Talukas.
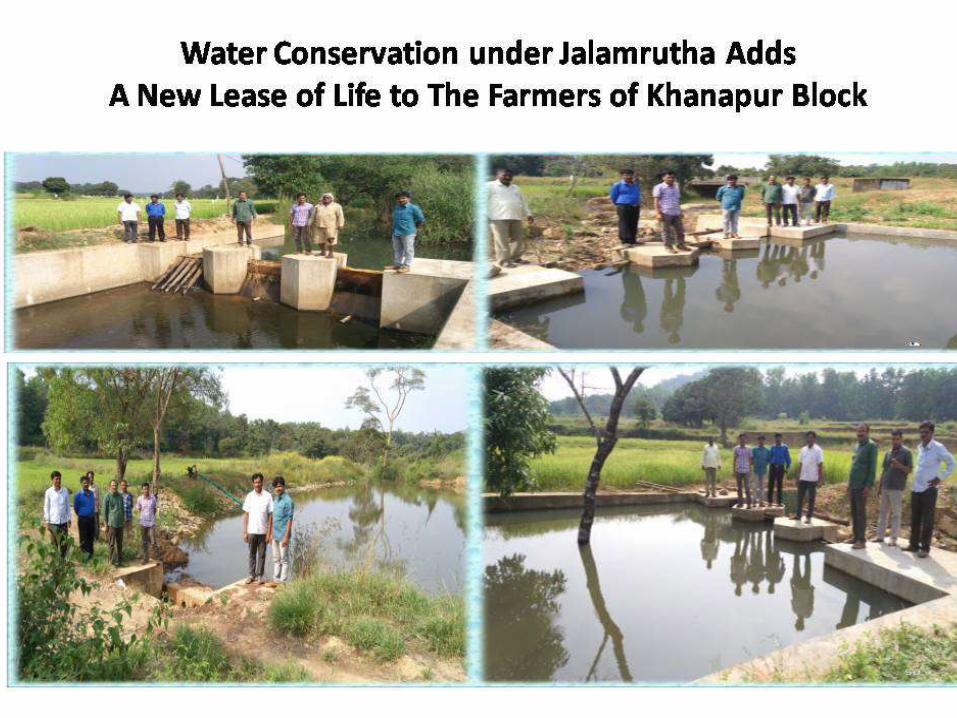
To combat the drought, Agriculture Department and Zilla
Panchayat, Belagavi decided to go in for a long term solution by
comprehensive treatment of 50 Micro Watersheds under MGNREGA
(of which 44 have already taken off on the ground so far, in 2018-19
another 9 Micro watersheds ds) based on Ridge to Valley concept.
The project was named ‘Jalamrutha’ and Agriculture Department,
Gok was designated as the implementing agency.
Page 63
Sl NO.
Taluka/ Blocks
Total Geographical Area in
Hector
Action Plan (2015-16) Action Plan (2018-19) Action Plan (2019-20) Action Plan (Total)
Project Cost (in Lakhs)
No. of Works
PD Project Cost (in Lakhs)
No. of Works
PD Project Cost (in Lakhs)
No. of Works
PD Project Cost (in Lakhs)
No. of Works
PD
1 Belagavi 1510.42 247.558 1575 105812 0 0 0 0 0 0 247.56 1575 105812
2 Savadatti 5575.22 1013.473 1702 445559 206.44 238 83943 822.20 1113 301241 2042.11 3053 830743
3 Ramdurg 4738.56 1571.823 3366 612779 0 0 0 0 0 0 1571.82 3366 612779
4 Khanapur 9651.88 785.741 1454 231099 869.63 808 219016 0 0 0 1655.37 2262 450115
5 Hukkeri 4257.01 503.758 1104 147583 0 0 0 91.14 148 19305 594.90 1252 166888
6 Athani 4965.88 1013.097 2919 297971 0 0 0 0 0 0 1013.10 2919 297971
7 Raibag 2321.23 461.539 1660 135746 0 0 0 0 0 0 461.54 1660 135746
8 chikkodi 2299.70 658.647 1134 292341 0 0 0 22.88 52 9188 681.53 1186 301529
9 Bailhongal 3010.75 1040.995 2766 436298 0 0 0 0 0 0 1041.00 2766 436298
Total 38330.65 7296.631 17680 2705188 1076.07 1046 302959 936.22 1313 329734 9308.92 20039 3337881
Action Plan Approved under Jalamrutha (Ridge to Valley Approach)
Page 64
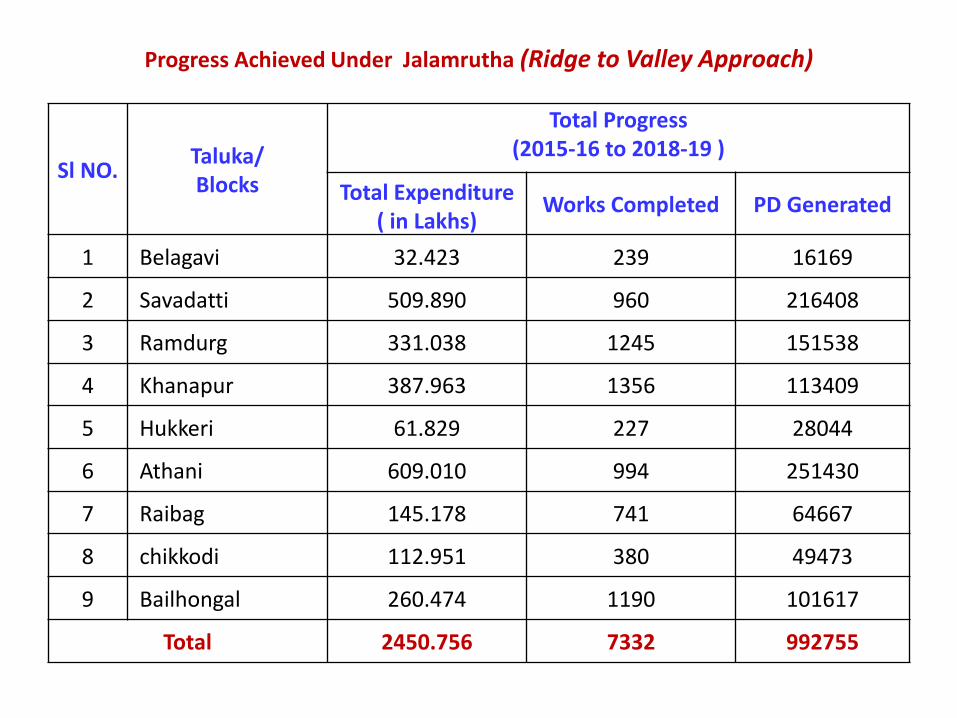
Progress Achieved Under Jalamrutha (Ridge to Valley Approach)
Sl NO. Taluka/ Blocks
Total Progress (2015-16 to 2018-19 )
Total Expenditure ( in Lakhs)
Works Completed PD Generated
1 Belagavi 32.423 239 16169
2 Savadatti 509.890 960 216408
3 Ramdurg 331.038 1245 151538
4 Khanapur 387.963 1356 113409
5 Hukkeri 61.829 227 28044
6 Athani 609.010 994 251430
7 Raibag 145.178 741 64667
8 chikkodi 112.951 380 49473
9 Bailhongal 260.474 1190 101617
Total 2450.756 7332 992755
Page 70
“Central Team, Cabinet Sub committee and Higher Officials visit to Work Site”
Page 71
‘National Level’ Out standing Performance Award Under the Category of “EFFECTIVE IMPLEMENTATION OF MGNREGA”
Page 72
MGNREGA Progress Sl. No. Year Expenditure
(Rs. In Lakhs) Mandays
1 2016-17 5409.88 19.40 lakh
2 2017-18 4302.32 14.61 lakh
3 2018-19 6495.45 28.05 lakh
2019-20 Programme:
Target Progress
Fin PD Fin PD
151.00 Cr. 30.00 lakh 100.44 Cr. 34.30 lakh
27994 Fresh works & 14588 on going works
18.61 Cr. pending payment (15.51 Cr. material payment)
Page 73
Components under MGNREGA
Trench cum bunding
• • Farm Pond
Page 74
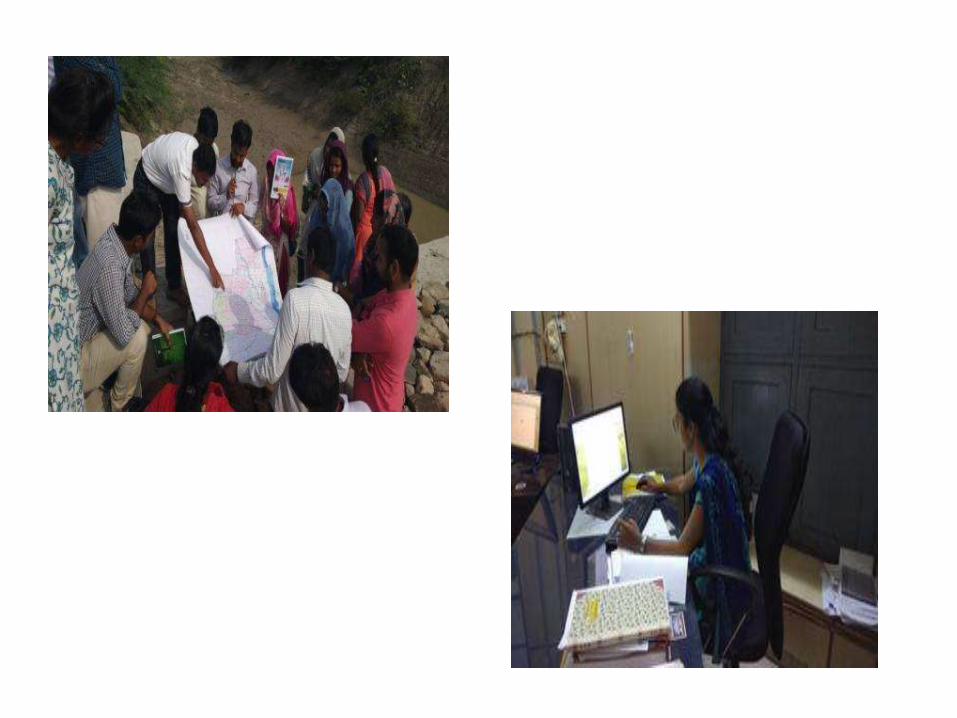
Work flow
• Planning:
– KSRSAC (Karnataka State Remote Sensing Applications Centre) for micro watershed maps
– Targets for generation of PDs to Districts.
– Daily monitoring of PD generation targets and quality work execution through Video Conferences, Whats app groups, regular field visits and meetings.
• Training given to officers – Watershed concepts mainly Ridge to Valley approach
– How to generate work codes, NMR, muster roll attendance, check measurements, MB recording payment procedures etc
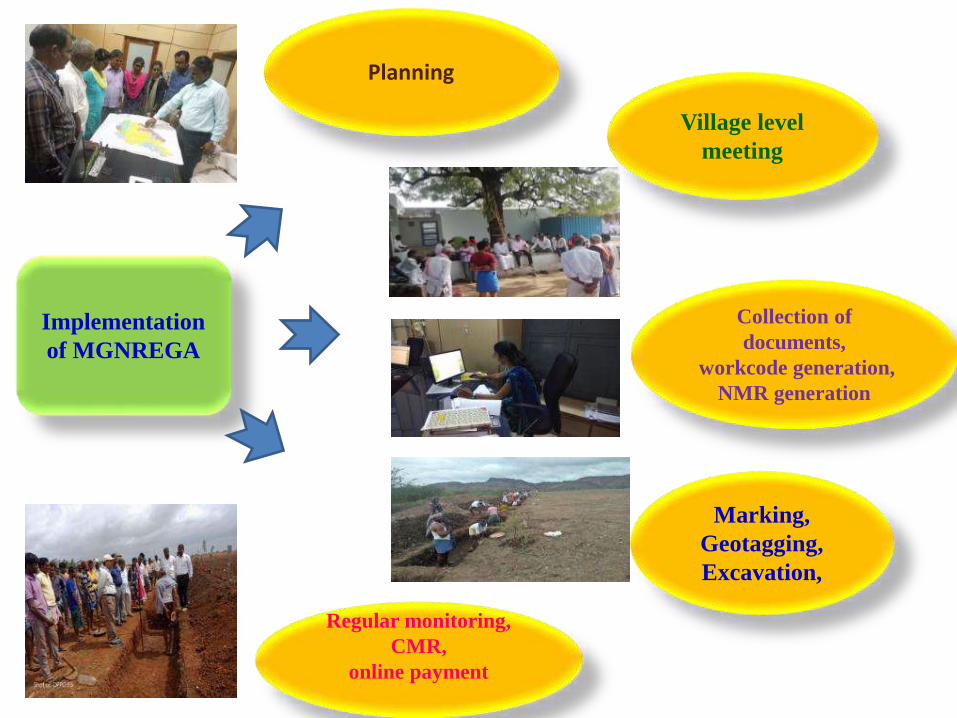
Page 76
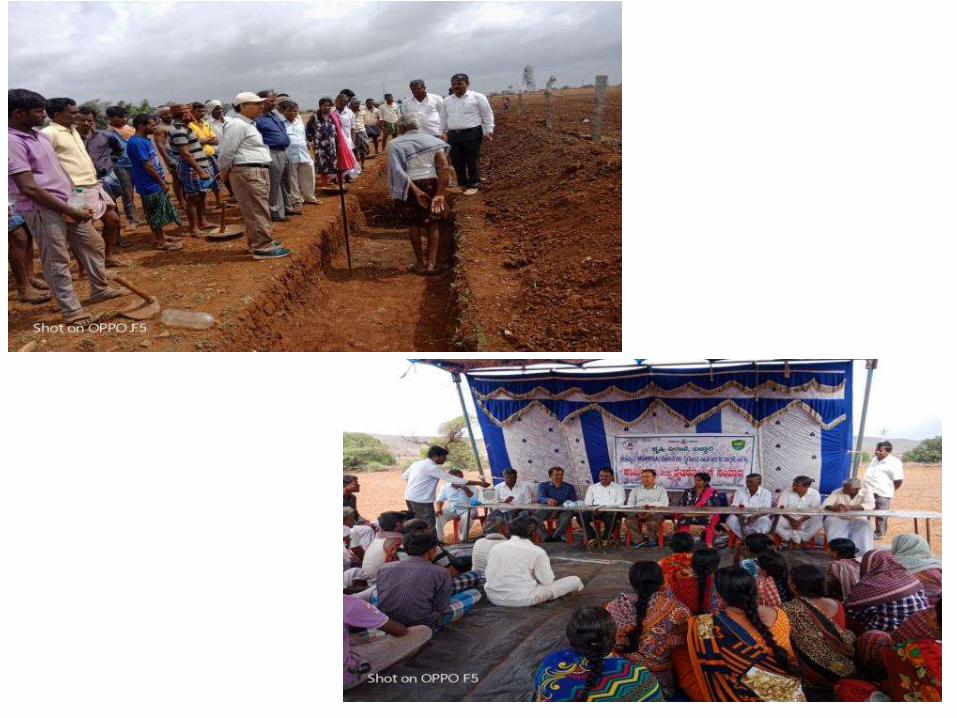
Planning
Village level
meeting
Collection of
documents,
workcode generation,
NMR generation
Marking,
Geotagging,
Excavation,
Regular monitoring,
CMR,
online payment
Implementation
of MGNREGA
Page 77
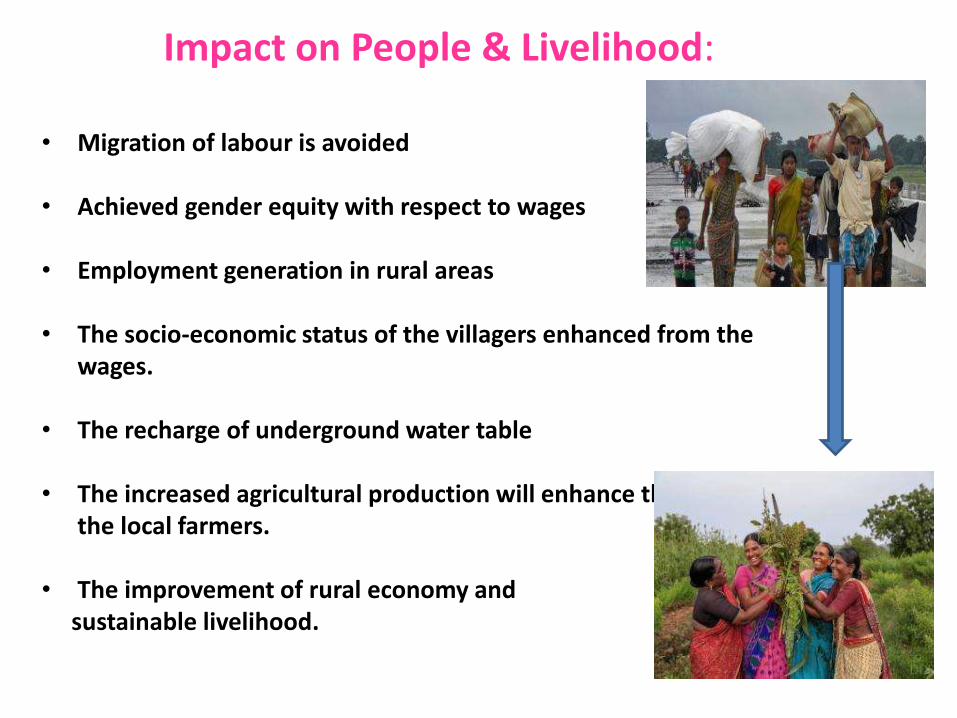
Impact on People & Livelihood:
• Migration of labour is avoided
• Achieved gender equity with respect to wages
• Employment generation in rural areas
• The socio-economic status of the villagers enhanced from the wages.
• The recharge of underground water table • The increased agricultural production will enhance the income of
the local farmers. • The improvement of rural economy and sustainable livelihood.
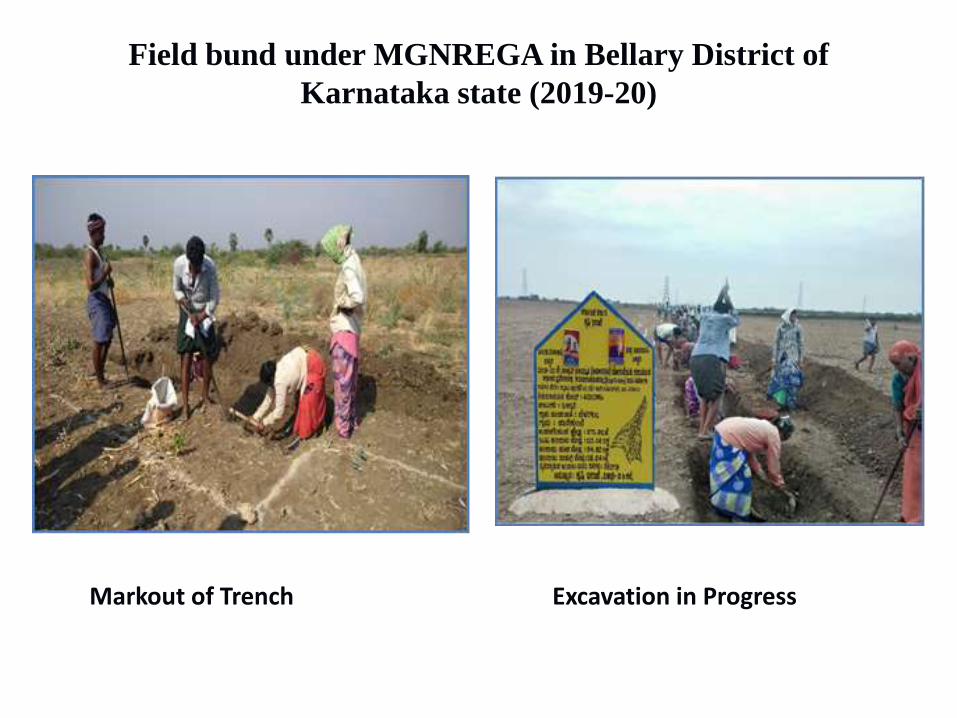
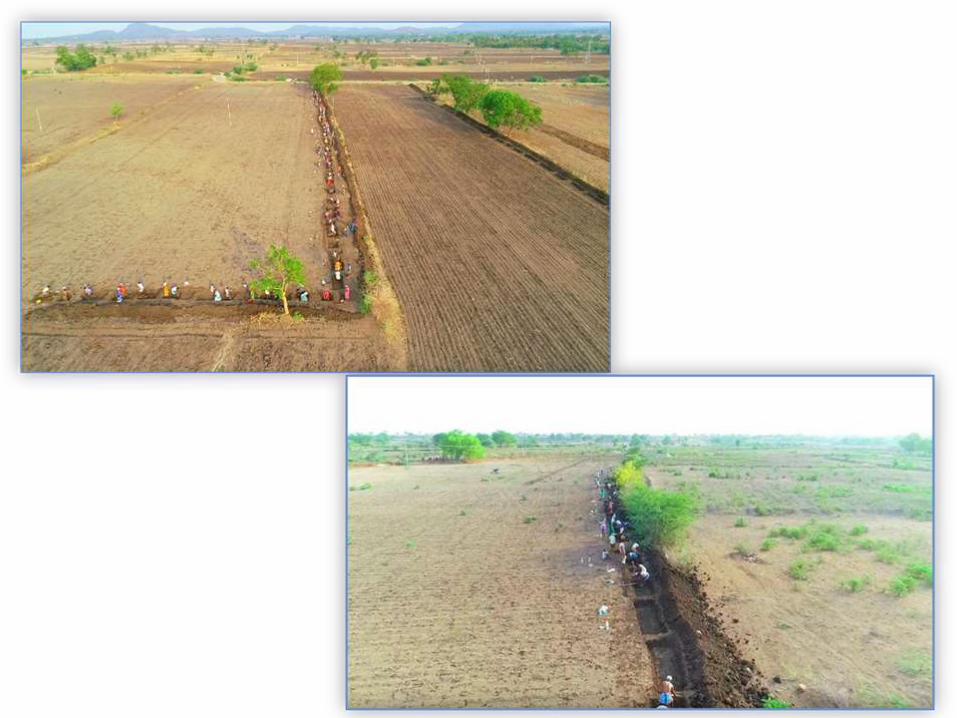
Page 78
Field bund under MGNREGA in Bellary District of
Karnataka state (2019-20)
Markout of Trench
Excavation in Progress
Page 79
Trenches Filled with Rain Water
Trench cum Field Bunding work
under MGNREGA
Page 86
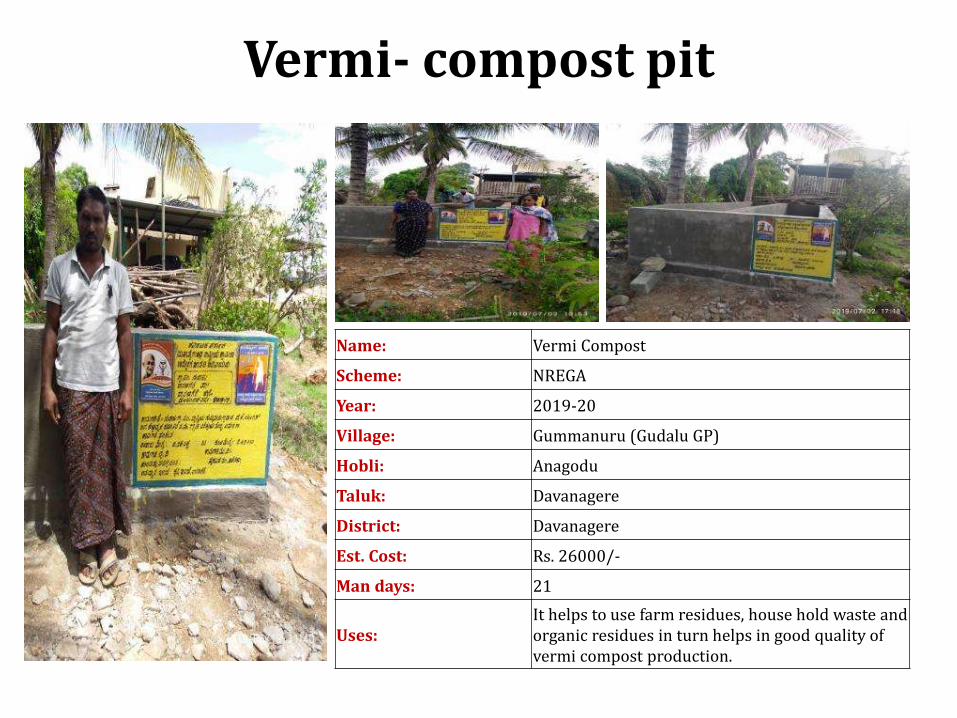
Vermi- compost pit
Name: Vermi Compost
Scheme: NREGA
Year: 2019-20
Village: Gummanuru (Gudalu GP)
Hobli: Anagodu
Taluk: Davanagere
District: Davanagere
Est. Cost: Rs. 26000/-
Man days: 21
Uses: It helps to use farm residues, house hold waste and organic residues in turn helps in good quality of vermi compost production.
Page 87
Nala revetment work at Gangagondanahalli Ubrani hobli
Channagiri Taluk Beneficiary Name : Community work
Gangagondanahlli Village Nala revetment for Nala from Rudrappa land to Gangadhara Land (100 mtr )
Year: 2018-19 Village : Gangagondanahlli Grama Panchayath : Nellihankalu
Page 88
Farm pond excavation by Department of Agriculture in
Bellary District of Karnataka state (2019-20)
Mark-out of Farm pond
Excavation of Farm pond
Page 90
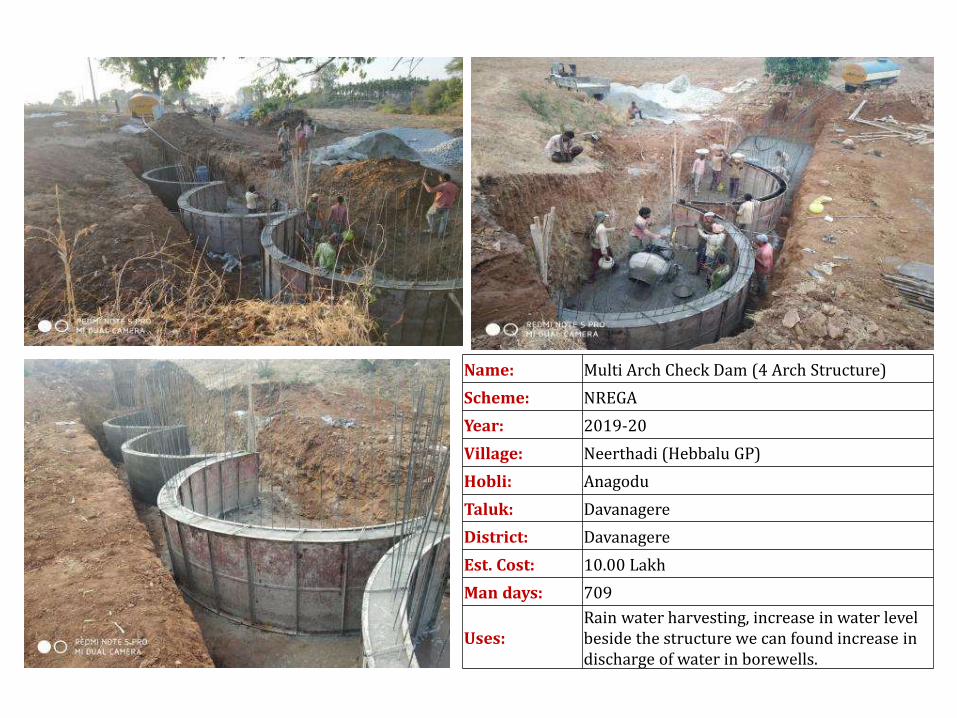
Name: Multi Arch Check Dam (4 Arch Structure)
Scheme: NREGA
Year: 2019-20
Village: Neerthadi (Hebbalu GP)
Hobli: Anagodu
Taluk: Davanagere
District: Davanagere
Est. Cost: 10.00 Lakh
Man days: 709
Uses: Rain water harvesting, increase in water level beside the structure we can found increase in discharge of water in borewells.
Page 91
Channagiri Taluka, Siddanamata Matriarch check-dam
Page 92
Completed Farm pond
Completed Farm pond filled with
Rain water
Page 94
JALAMRUTHA • The Government of Karnataka has launched the water
conservation program viz. Jalamrutha.
• The scheme focuses on drought-proofing measures, including protection and rejuvenation of water bodies.
• The program is launched by Rural Development and Panchayat Raj of Karnataka.
• Under the scheme, scientific approaches will be deployed for water budgeting, water harvesting and water conservation.
• Four Components (1) Water Literacy (2) Rejuvenation of Water Bodies (3) Creation of Water Harvesting Structure (4) Greening.
• WDD has planned to take up one sub-watershed in each taluka under Jalamrutha Watershed Project.
• PDPRs are prepared, awareness programmes are ongoing, DPR preparation is under progress.
Page 95
95
APPROVAL OF Jalamrutha Watershed DPRs IN DLC
Page 96
96
The Inaugural
Shri. H.K.Patil The then Minister for RDPR, GOK.
Binkadakatti GP
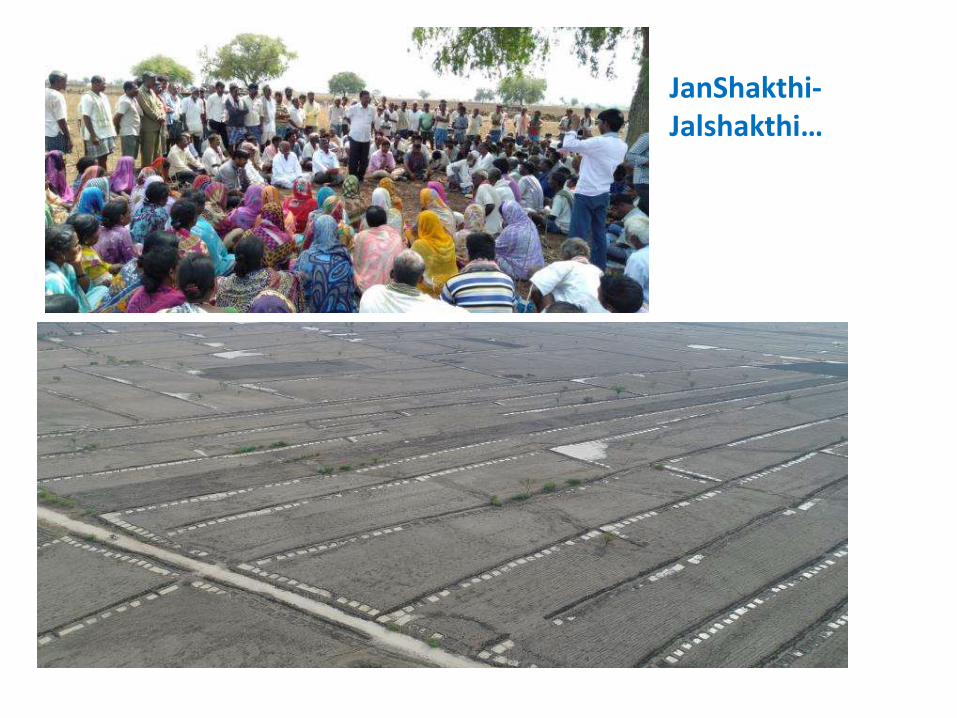
Page 97
JanShakthi- Jalshakthi…
Page 98
जलं ददाति जीवनम्,
जलं तवना मरणम्।।
“ No matter, how much rich you are, you
can’t live without water.”
Page 99
Performance of Watershed Development Programmes
in Karnataka (PMKSY-WD Component)
Page 100
MEL&D is a tool to inform corrective measures from time to time to the organizers for ensuring achievement of targets and specified goals with in the time frame and not to be seen as a tool to find fault.
MEL&D is a real-time tracking of progress and
performance of the project. MEL&D leads to learning which ensures
effective midcourse corrections. Documentation preserves ground experiences
(good and bad) for up-scaling and posterity.
Positioning of MEL & D
Page 101
Characteristic features of watersheds –Batch I
Divisions
Project
area
treated, ha
No. of
projects
Rainfed
area, %
Total No.
of
households
Proportion
of SC/ST
(%)
Annual
rainfall ,
mm
Bengalur 175,738 42 75.3 506,034 30.5 450 to
1050
Mysuru 86,596 20 75.3 1227,799 20.6 610 to
4700
Kalburgi 97,935 24 81.2 369,690 37.9 294 to
1152
Belagavi 131,050 33 89.3 245,081 21.6 465 to
3700
State
Total/
Mean*
491,319 119 80.3* 2348,604 27.7* 294 to
4700#
Note: 80.3% of net sown area is rainfed; # - Range of annual rainfall, mm
Page 102
Characteristic features of watersheds Batch II
Divisions Project
area, ha
No. of
projects
Rainfed
area, %
Total No.
of
households
Proportion
of SC/ST
(%)
Annual
rainfall ,
mm
Bengalur 150,483.62 38 70.5 462,547 29.3 450 – 3700
Mysuru 108,329.02 24 74.8 317,656 17.2 738 – 4099
Kalburgi 131,772.65 29 81.3 241,991 29.8 264 – 1023
Belagavi 156,055.18 36 77.0 318,658 22.8 465 – 4500
State
Total/
Mean*
546,640.47 127 75.9* 1340,852 24.8* 264 to 4500#
Note: 75.9% of net sown area is rainfed; # - Range of annual rainfall, mm
Page 103
Soil loss in Karnataka Soil loss
Extent of
Erosion
Soil loss,
tonnes /ha/year
% of total
geographical area
None to slight
< 5 15.6
Moderate 5 to 10 34.9
Strong 10 to 15 26.5
Severe 15 to 20 11.1
Very severe
20 to 40 9.2
Extremely severe
> 40 1.9
Soil erosion causes yield decline of 0.14
tons/ha/mm of soil loss
Page 104
Bunding work along with runoff water stored in structures across projects
Batch Bunding/
TCB, ha
Staggered
Trenches, ha
Total bunding,
ha
Total runoff water
stored – million
cu-m
I (2009-10) to
II (2010-11) 136,957 6395 143,352 17.20
Crop Yield increase over
no bunding (%) Crop
Yield increase over no
bunding (%)
Ragi 40 Cowpea 20
Maize 47 Jowar 44
Gr. nut 30 Tobacco 13
Potato 36 Cotton 66
Page 105
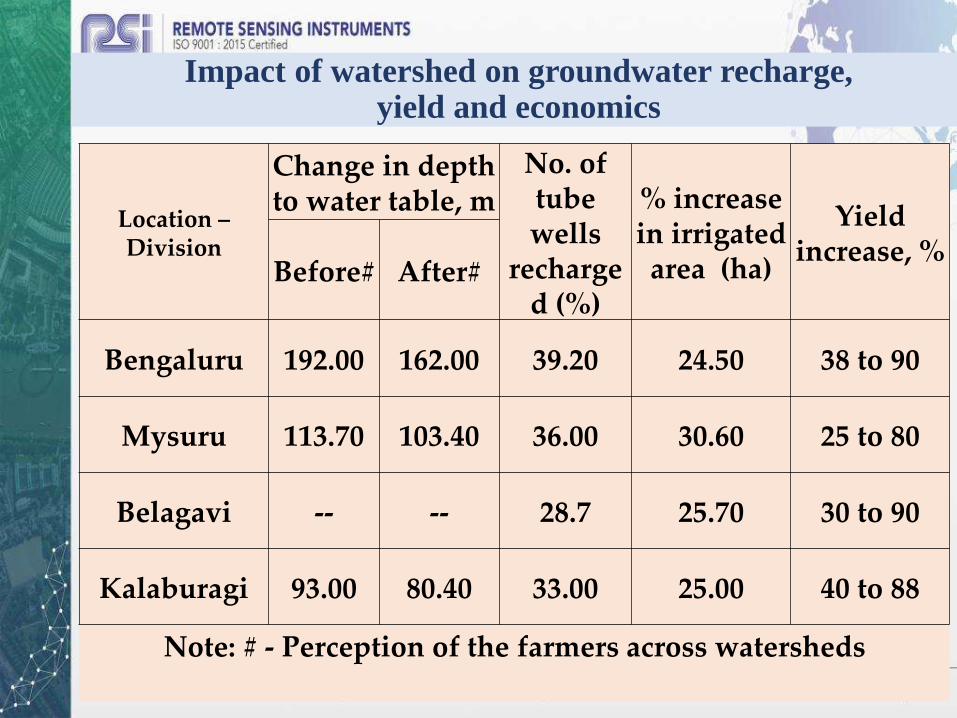
Impact of watershed on groundwater recharge, yield and economics
Location – Division
Change in depth to water table, m
No. of tube wells
recharged (%)
% increase in irrigated area (ha)
Yield increase, %
Before# After#
Bengaluru 192.00 162.00 39.20 24.50 38 to 90
Mysuru 113.70 103.40 36.00 30.60 25 to 80
Belagavi -- -- 28.7 25.70 30 to 90
Kalaburagi 93.00 80.40 33.00 25.00 40 to 88
Note: # - Perception of the farmers across watersheds
Page 106
Impact of Watershed Development Programme on Groundwater levels (in m.) in Mysore district
Wat
er l
evel
in
m b
gl
IWMP-1 –
Nagavala;
Ground
water
observatio
n site –
DMJ
Halli,
Mysuru
taluk CGWB
piezometer reading
Page 107
Yield improvement in crops
Crops Yield
improvement (%)
Ragi (509)# 38.2
Maize (694) 89.9
Paddy (162) 55.6
Pepper (10) 22
Groundnut (62)
62.3
Potato (37) 50.2
# - Number of farmers
Page 108
Horticulture activity
Batch/ Year
Total
Area
covered,
ha
Tree density, No./
100 ha Species grown
Survival
% Before After
I (2009-10) to
II (2010-11)
183,674.7
2 639 1499
Mango, Coconut, Sapota,
Guava, Lemon, Drum stick,
Pomegranate, Sitaphal
25 – 100
Guava, Aland Taluk Lime & Bengal Gram, Aland Taluk
Page 109
Forestry activity
Batch/ Year Area
covered, ha
Tree density, No. / 100 ha Species grown Survival %
Before After
I (2009-10) to II (2010-11)
200,921.48 591 2541 Teak, Silver oak, Hebbevu, Bamboo, Neem, Pongamia,
Agave, Tamarind, Glyricidia 25 - 100
Growing banana will provide additional income to the farmer. Providing irrigation to banana has improved the growth of Hebbevu (2013-14). After 12th year, each tree will fetch an income of Rs. 4000 to 5000/-
Activity – Hebbevu + Banana
Page 110
Animal Health Camps and village based trainings
• Two AHCs and VBTs are conducted in all villages in the watershed areas per year and on an average treated 345 livestock/camp.
• Major diseases treated are black quarter (BQ), Mastitis, Foot and Mouth disease (FM), Enterotoxemia (ET) and Sheep and Goat pox.
• Reduction in diseases ranged from 10 to 50% across the divisions.
• AHC improved animal health and productivity by 2.0 to 3.0 liters/day in cross bred cows and 0.5 to 1.0 liter/day in Desi cows along with good fodder and nutrition.
Page 111
Annual Income (Rs.) from livelihood activities
Activity
Annual
Income
- After
% Increase in
Net income
(Rs.) over
Pre-Project
Cow rearing 97,100/- 47
Tailoring 58,000/- 222
Catering 132,000/- 120
Sheep rearing 85,500/- 46
Goat rearing 61,600/- 43
Mat making 76,000/- 245
Leaf plate
making 48,000/- 23
Dress making 120,000/- 67
Chicken stall 228,000/- 111
Page 112
Impact on household income from agriculture (Rs./annum) across holdings
Batch/
Year Landless
Marginal
farmer
Small
farmer
Large
farmer
I (2009-10)
to II (2010-
11)
Before 21,180 to
41,232
14,209 to
28,182
26,053 to
27,410
51,597 to
59,864
2014-15 to
2015-16 After
36,490 to
78,332
29,877 to
96,061
56,933 to
77,874
91,032 to
170,105
% increase 72.3 to 90.0 110.3 to
147.0
118.4 to
184.0 76.4 to 184
Migration for employment lowered by 80 to 95% across watersheds