28
Wellness in the Workplace SURVEY REPORT 2015 Survey sponsored by

Wellness in the WorkplaceSURVEY REPORT 2015
Survey sponsored by

2 Wellness in the Workplace Survey 2015
About the Sponsors
Southern Cross Health Society
Southern Cross Health Society opened for business in 1961. More than 50 years on the not-for-profit friendly society is New Zealand’s leading health insurer.
With over 800,000 members, the business funded more than 170,000 elective procedures in the financial year ended 30 June 2015 – paying claims in excess of $800 million.
BusinessNZ
Level 6, Lumley House 3-11 Hunter Street
Wellington 6011New Zealand
P: 04 496 6555 E: [email protected]
www.businessnz.org.nz
Level 1, Ernst & Young Building 2 Takutai Square
Auckland 1010 New Zealand
P: 0800 800 181 E: [email protected]
www.southerncross.co.nz
BusinessNZ is New Zealand’s largest business representation group, providing a wide range of services for member businesses.
BusinessNZ undertakes analysis and advocacy on behalf of the wider business, manufacturing, importing and exporting sectors, making representation to Government, local government and other decision makers on issues important to business.
Wellness in the Workplace Survey 2015 3
Contents
Cutting to the chase - looking ahead 4
6
7
9
11
17
19
23
1. Background to the survey
2. Respondent demographics
3. Absence rates in 2014
4. Costs, drivers & factors around absence
5. Health insurance in the workplace
6. Stress points
7. Relationship & communication with staff
8. Managing older workers 27

4 Wellness in the Workplace Survey 2015
• The second Wellness in the Workplace survey shows a combination of areas where some improvements have been made, as well as identifying opportunities where enterprises can enhance the wellbeing of their staff.
• New Zealander's are most likely to be absent from work due to illness or injury unrelated to the workplace, with caring for a family member or other dependent the second most common cause of absence. Therefore enterprises need to consider how the number of such absences might be reduced.
• Although there has been an improvement from the previous survey, around 35% of staff continue to turn up for work even though they are ill. A more up-front staff policy, along with better workload management, would help to mitigate this problem.
• Reducing levels of harmful stress and improving wellbeing, particularly in larger businesses, involves a combination of factors:
• An emphasis on managing workloads would be the best place to start. This would help mitigate the issue of long hours worked and pressure to meet work targets and general workloads.
• Larger businesses tend to do a good job of identifying and putting processes in place to deal with stress/anxiety issues. However, there seems to be a disconnect when it comes to turning that information into something workable for staff.
• For enterprises with fewer than 50 staff there was a minimal net increase in overall stress levels but such business should look at options around stress identification and management to insure against future net increases.
• While around 7/10 New Zealand enterprises at the very least occasionally take a formal approach to collecting non-work related information on their staff, most are not overly proactive in terms of how best to use the information they collect. This is a relatively simple and straightforward way in which enterprises can identify initial steps towards assisting their employees.
• Most enterprises take a family-friendly approach to their workplace with larger enterprises taking a more cross-cutting approach to policies offered, particularly around location and fluidity of hours worked. More enterprises, including smaller enterprises, need to think about adopting these methods.
Cutting to the chase - looking ahead

Wellness in the Workplace Survey 2015 5
• To improve general staff wellbeing, there are two steps that smaller enterprises could take:
• The provision of flu vaccinations would be a relatively inexpensive way of preventingsignificant time out of the workforce and could perhaps be extended to family membersto reduce time taken to care for them.
• Flexible hours/working from home provided as part of a family-friendly policy made availableto all employees who wanted to adopt this option.
• 4 out of 5 businesses still do not have policies or arrangements in place for older workers,with over half seeing the issue as nonexistent. While this could be viewed as a positive beliefthat employing older workers is no different from hiring a worker of any age, it could alsoprevent businesses from recognising that older workers might present a set of challenges andopportunities that other age groups might not.
Reducing levels of harmful stress to
improve wellbeing, particularly amongst
larger businesses, involves a
combination of factors.

6 Wellness in the Workplace Survey 2015
This report outlines the main results of the second bi-annual Southern Cross Health Society – BusinessNZ Wellness in the Workplace survey.
The survey is intended to help employers benchmark absence levels among their own employees and identify how best to boost attendance and enhance employee health. It also provides policy makers with views on occupational health practice and absence in the workplace, about which information has often been lacking in this country.
The second survey was conducted between the months of March-June 2015. In total, 12 business associations took part, sending it out to a proportion of their members. In addition, BusinessNZ sent the questionnaire to a number of its Major Company Group members, as well as various Government departments. Respondents were asked to report their absence data for the 12-month period 1 January to 31 December 2014 and provide details of their policies and practices for managing employee attendance.
In total, 113 responses were received from entities across the private and public sectors. Although this was down from 119 responses for the 2012 survey, the respondent entities for 2015 employed 116,218 people (including 97,837 permanent staff), compared with 97,116 people, 89,955 permanent staff in 2013. The 2014 sample represented 6.52% of all employees in New Zealand, up from 5.68% in 20121.
By comparison on an international level, the most recent UK survey received 153 usable responses, despite its population being over 14 times larger than New Zealand’s, representing 3.4% of all UK employees.
Notes on survey comparisons
Although the surveys took place in 2013 and 2015, the fact that respondents were asked about their absense data for 2012 and 2014 means that for the purposes of this report, comparisons between the two surveys will state 2012 and 2014 as the comparison years.
1 Based on 1,709,000 and 1,781,300 filled jobs during the June 2012 and 2014 quarters respectively (Quarterly Employment Survey, Statistics New Zealand).
1. Background to the Survey
Purpose and overview
This is the second time in which the Southern Cross Health Society – BusinessNZ Wellness in the Workplace survey has been held in this country.
Prior New Zealand Research
There are relatively few sources of information available on the number of days away from work due to illness and injury in a New Zealand context.
Previous studies have looked at aspects of absenteeism and wellbeing in the workplace but there has been no overall attempt to provide a more comprehensive assessment of where New Zealand stands with respect to the connections between absenteeism, sickness, costs and related workplace issues and practices.

Wellness in the Workplace Survey 2015 7
Employee Count Number Average Median1-5 21 3.9 4.06-9 11 7.7 8.010-49 30 22.0 21.050-99 14 70.9 70.5100+ 37 3092 860Fewer than 50 62 13.3 9.5Great than 50 51 2263.0 340All 113 1028 30.0
Respondents by workforce size
While New Zealand is known as a country with a large proportion of micro-small sized enterprises, official data from StatisticsNZ show that employees are typically employed by relatively large-sized businesses (figure 1).
Therefore, given the make-up of New Zealand’s enterprises by size and the types of questions asked, there was a stronger targeting of medium to large enterprises in order to cover a higher proportion of employees.
Figure 1: New Zealand workforce: Proportion of employeesby employee size count group (Feb 2014)
Figure 2 shows that the 2014 survey had a smaller proportion of employees in large enterprises, which was down from 41% for the 2012 survey. This is an important point to note, given any overarching hourly or monetary values between the two time periods should be treated with some caution.
However, 45% of employees still came from enterprises employing 50 or more people.
Figure 2: Wellness survey: Proportion of employees by employee size count group. (2014)
Table 1 shows both the average and median number of workers by size of business. Because the survey includes a number of respondents with a very high number of employees, the overall average of 1028 workers per enterprise is significantly larger than the median number of 30.
Table 1: Average and median count of employees by business size (2014)
2. Respondent Demographics
0-519%
6-910%
10-4926%
50-9912%
100+33%
1–511%
6–98%
10-4925%
50–999%
100+47%

8 Wellness in the Workplace Survey 2015
Respondents by industry
Those responding to the survey came from a broad range of sectors in the economy (figure 3). The largest proportion was from the service sector, followed by business/finance and manufacturing.
In addition to the 104 private sector enterprises taking part, nine large public sector departments (up from eight in 2012) were also targeted giving a strong proportion of public sector representation. The nine public sector departments represented 38,412 staff, or exactly a third of those covered. This was up from 28,850 staff for the previous survey.
Respondents by region
As the questionnaire was again distributed by a number of regional and industry associations, responses came from all parts of the country (figure 4).
Unsurprisingly, the greatest number of responses came from Auckland, although there was still a good representation from the smaller regions.
Figure 3: Proportion of respondents by industry (2014)
Figure 4: Proportion of respondents by region (2014)
Whole, retail, accommodation,
cafes & restaurants 24%
Manufacturing 14%
Elec, gas, water &
construction 11%
Govt admin
7%
Ag, forest, fish & mining 4%
Other service 16%
Transport, storage & communication
8%
Business, finance & property
16%
Auckland 15%
Bay of Plenty
8%
Waikato 10%
Gisborne 4%
Taranaki 5%
Manawatu- Wanganui
4%
Wellington 9%
Marlborough 4%
Nelson-Tasman 4%
West Coast 4%
Canterbury 12%
Otago 6%
Southland 5%
Hawke’s Bay 5%
Northland 5%

Wellness in the Workplace Survey 2015 9
Key findings
• The average rate of absence in 2014 was 4.7 days per employee, slightly up from 4.5 days in 2012.
• Absence remains higher amongst manual employees than among non-manual staff.
• Average levels of absence generally climb with enterprise size.
• Average absence levels remain higher in the public
sector (6.7 days) than the private sector (4.6 days).
• When the number of days lost on average isprojected across the New Zealand workforce as awhole, around 6.7 million days were lost to absencein 2014. This was up from 6.1 million in 2012.
Time lost to absence averaged 4.7 days per employee in 2014
Employers were asked about the average number of days of absence per employee. Survey results in table 2 below show that overall absence was at 4.7 days on average per employee, which was up from 4.5 days in 2012.
Despite the slight increase in 2014, the results continue the general view expressed in a 2010 Treasury working paper2 that ‘the majority of people take less than five days sick leave each year’.
If we were to project the number of days lost on average across the New Zealand workforce as a whole, it indicates that around 6.7 million days were lost to absence in 2014.
New Zealand lost around 6.7 million
working days to absence
in 2014.
3. Absence Rates in 2014
Total Private sector Public sector Manual 5.1 4.9 9.8Non-manual 3.9 3.7 6.6All 4.7 4.6 6.7
Table 2: Absence levels: average days lost per employee (2014)
2 Holt, Heather, The Treasury (Nov 2010): The Cost of Ill Health: New Zealand Treasury Working Paper 10/04.

Table 3: Absence by size of business (2014)
Average days of absenceEmployee Count All Manual Non-ManualFewer than 50 4.6 4.8 3.4Great than 50 4.9 5.4 4.5
Public sector = higher absence
In line with the 2012 result, table 2 continues to show the public sector (both central and local) exhibiting a higher level of absence compared with the private sector for manual and non-manual staff.
For 2014, public sector absence levels were 45.7% higher than in the private sector – at 6.7 days per employee compared with the private sector at 4.6 days. Although this was a decrease from a 53.4% differential in 2012, overall absence levels were higher for both during 2014.
The overall differential of 2.1 days was close to the 2.3 days recorded in 2012, and almost identical to the latest UK findings of 2.0 days.
While the differential between the two sectors has narrowed somewhat, there are still significant gains to be made by the public sector in terms of boosting productivity by focussing on a general reduction in absence levels.
absence trends are managed more closely and minimised where possible.
The manual/non-manual gap
The 2014 results indicated a similar outcome to the 2012 results, whereby manual employees recorded higher average levels of absence than non-manual employees. This makes intuitive sense, given the nature of manual work – especially jobs involving a lot of physical work such as lifting – and provides some explanation for the higher rate of absence.
The results for 2014 (table 2) show that for manual employees, the average number of days lost per employee was 5.1, compared with 3.9 days for non-manual employees.
Like the overall result, the average number of days lost per manual and non-manual employee increased by 0.1 and 0.4 days respectively from the 2012 results.
The 1.2-day differential for 2014 is smaller than the 1.5-day differential recorded in 2012, and much smaller than the recent differential of 2.0 days for the latest UK findings.
Overall, although the average number of days has not changed significantly, a drop in average annual employee absence levels over time would be an overarching target to achieve to reduce working days lost.
Size of enterprise differentialsThe 2012 and 2014 findings, along with the UK results over time, indicate a range of factors behind the values recorded in table 3. Employees in smaller enterprises are typically in a better position to be aware of how their absence may adversely affect both their work colleagues and the business as a whole. Consequently,
10 Wellness in the Workplace Survey 2015

Wellness in the Workplace Survey 2015 11
• The median total cost for each absent employeein 2014 was $616, down from $837 in 2012.
• The direct costs of absence alone amounted to$1.45b across the economy in 2014.
• Non-work related illness and injury was by far themost widespread driver of employee absence,followed by caring for a family member/dependentdue to illness/injury.
• Although the gap has reduced since 2012, therecontinues to be a disconnect between culture andreality when it comes to illness and staying away
from work.
• Minor illness remained the dominant cause ofabsence for personal reasons, particularly for non-manual employees.
Key findings
4. Costs, Drivers & Factorsaround Absence
Costs of absence
In 2014 an absent employee typically cost their employer $616 a year
Like 2012, the 2014 survey asked respondents to quantify the total cost per absent employee, including the salary cost of absent individuals and replacement costs (e.g. through temporary staff or overtime worked by other employees).
Results in table 4 show each absent employee cost a median total of $616, a figure indicative of the cost savings to be achieved if employers can reduce the extent and duration of employee absences.
Employee CountMedian cost per absent
employee ($)
Total median cost by size of business ($)
1-5 339 1,5566-9 600 4,10010-49 644 16,06350-99 579 39,200100+ 917 543,134Fewer than 50 500 4,500Great than 50 841 142,808All 616 20,000
Table 4: Absence costs by workforce size ($) (2014)

12 Wellness in the Workplace Survey 2015
Absence costs rise with enterprise size
Table 4 shows the median total cost per absent employee, as well as the total median cost by size of business for 2014. For the former, costs tend to be higher the larger the enterprise, which was both the 2012 and 2014 data. Certainly, those enterprises with 5 or fewer staff show a sizably lower cost than those with more. The higher costs for larger enterprises can be due to a range of factors, including higher average levels of remuneration and higher staff absence levels.
The total median cost for all businesses was exactly $20,000, compared with $35,146 in 2012. On face value this might seem to be a significant reduction, but two issues need to be taken into account when comparing the results. First and most significantly, as alluded to on page 7, the increase in the proportion of smaller sized enterprises would have brought the average down, as the bigger the enterprise, the higher their total cost will be. In relation to this, the overall average value masks quite large differences by size of business. At one end, costs are relatively similar for those with fewer than 10 employees, with values well under $1,600. However, the cost increases significantly for larger businesses, capping at over half a million dollars for those with 100+ employees.
Direct costs of absence amount to more than $1.45b a year
Extrapolating the direct costs of absence over the entire economy, New Zealand’s results show the average absence level per employee of 4.7 days amounts to a cost of around $1.45b for the total economy5, which was up from $1.26b from 2012.
5 Based on Quarterly Employment Survey (SNZ) average weekly earnings for FTEs at $1,087.20, and total employed of FTEs of 1,419,400. All figures were taken from the June quarter 2014 results.
Drivers of absence
Main causes of absence
Respondents were asked to list the three main causes of absence during 2014 for both manual and non-manual employees.
Figure 5 shows the top drivers of absence in percentage terms. The most common cause of absence amongst both manual and non-manual workers is genuine sickness or injury unrelated to the workplace. Unsurprisingly, within this category the most common cause for both manual and non-manual employees was illness unrelated to the workplace.
Caring for a family member or other dependent due to illness or injury remained the second most common cause of absence, identified by just over 40% for non-manual employees and close to 30% of manual employees.
Attending/waiting for medical appointments (20.4%) was clearly the third most common cause of absence for non-manual employees, whereas for manual employees it was again paid sickness absence days seen as an entitlement (19.5%) – by those suspected as not actually being sick – and work-related illness or injury (17.7%) vied closely for third place.

Wellness in the Workplace Survey 2015 13
Figure 5: Main drivers of absence (2014)
0.0% 10.0% 20.0% 30.0% 40.0% 50.0% 60.0% 70.0% 80.0% 90.0% 100.0%
Travel or weather-related disruption
Caring for a family member or other dependent due to breakdown in support arrangements
Personal problems (e.g. drink/drug/relationship problems)
Recovery post op
Work related illness or injury
Paid sickness absence days seen as entitlement by those suspected to not actually be sick
Attending/waiting for medical appointments
Caring for a family member or other dependent due to illness or injury
Non work related illness or injury
Percent
Option
Non-Manual
Manual

14 Wellness in the Workplace Survey 2015
Should I stay or should I go?
Enterprises were asked on a scale of 1 (almost never) to 5 (almost always), to what degree their staff typically turned up for work with some form of illness, even though they should have stayed at home.
The mean value for 2014 was 3.09, which was down from 3.32 in 2012. Likewise, the median value fell from 3 to 4. The decrease in the overall values is a positive step, with figure 6 showing a more normal distribution pattern than 2012. Those who responded with a score indicating more often than not that ill staff who should have stayed at home would typically turn up for work
Figure 6: Degree to which staff typically turns up for work, even though they should stay home due to some formof illness (2012 & 2014)
dropped from 48.6% in 2012 to 34.9% in 2014.
By size of enterprise, table 5 shows that smaller sized businesses typically see the incidence of staff coming to work who should be at home occurring at a higher level.
0
5
10
15
20
25
30
35
40
45
50
Almost never 2 3 4 Almost always
Percent
Scale
2014
2012

Wellness in the Workplace Survey 2015 15
Culture of the workplace
Enterprises were then asked whether they thought the culture of their business encouraged employees to remain away from work when they were ill. Again, on a scale of 1-5, figure 7 shows the overall result for both 2014 and 2012. Encouragingly, the average result increased from 3.32 to 3.66, with only 13.8% of respondents answering with a value of 2 or lower, whereas there was a slight increase in those who answered with a value of 4 or more (56.9%). While this result is a step in the right direction, there continues to be a disconnect between culture and reality with over a third of employees continuing to turn up for work even though they are ill.
Figure 7: Culture of respondent business encouraging employees to remain away from work if they are ill (2012 & 2014)
Size of enterprise Mean Median1-5 3.17 3.006-9 3.45 4.0010-49 2.90 3.0050-99 3.64 3.00100+ 2.83 3.00<50 staff 3.08 3.00>50 staff 3.09 3.00Private sector 3.11 3.00Public sector 2.67 3.00
Table 5: Degree to which staff typically turn up to workeven though they should stay home with some form of illness (2014)
0
5
10
15
20
25
30
35
40
No, we have little ability to meetcustomer demands if staff are away
2 3 4 Yes, very clear on this policy, if ill thenstay at home
Percent
Scale
2014
2012

16 Wellness in the Workplace Survey 2015
Table 6 above shows that the culture to stay at home remains stronger for larger enterprises, again indicating that smaller businesses are often heavily reliant on staff being available to carry out their daily activities.
Factors behind absence
Table 7 shows the results for both manual and non-manual employees with minor illnesses continuing to be the most prevalent cause of absense, although more so for non-manual employees.
Size of enterprise Mean Median1-5 3.50 3.506-9 3.50 3.0010-49 3.43 4.0050-99 4.36 4.50100+ 3.71 4.00<50 staff 3.47 3.50>50 staff 3.90 4.00Private sector 3.67 4.00Public sector 3.56 3.00
Table 6: Culture of respondent business encouragingemployees to remain away from work if theyare ill (2014)
For manual employees, minor illness was followed by physical pain (23.9%) and injury (18.6%), symptomatic of the types of activities typically undertaken. Encouragingly though, these percentages were lower than in 2012.
For non-manual employees, injury (16.8%) and physical pain (15.9%) came in second and third respectively but not to the same degree as for manual employees for whom work/non-work anxiety/stress/depression was far more llikely than for non-manual employees.
Looking ahead• New Zealand’s workplace culture continues to be
more positive than negative, but employers needto be conscious of the ongoing disconnect betweenculture and reality with the largest proportion ofemployees continuing to turn up for work eventhough they are ill. A more up-front policy to staff,along with better management of workload, wouldhelp mitigate this problem.
Type Manual Number
Manual (%)
Non-Manual Number
Non-Manual (%)
Mainly minor illness (e.g. cold, flu, tummy bug, headache) 63 55.8 81 71.7Injury 21 18.6 19 16.8Physical pain (e.g. sore back, neck, knee, arthritis, musculoskeletal disorders etc) 27 23.9 18 15.9
More Major illness (e.g. heart, blood pressure, respiratory, cancer, bowel problems) 9 8.0 7 6.2
Non work-related anxiety/stress/depression 6 5.3 7 6.2Work-related anxiety/stress/depression 1 0.9 6 5.3Other 5 4.4 7 6.2
Table 7: Types of illness/injury that most frequently cause absence for personal reasons for manual and non-manualworkers (2014)

Wellness in the Workplace Survey 2015 17
• The 2014 data continues to show clear differencesin providing health insurance by size of enterprise,with smaller enterprises not viewing it as somethingto provide either now or in the future.
• For those who do not provide health insurance,evidence that it reduces absenteeism, removal ofFBT and a decrease in its costs were the primary
Respondents were asked whether they provided health insurance for their staff. Table 8 shows overall 69.1% answering in the negative, while 31.0% answered in the affirmative. This was similar to the 2012 result.
However, like 2012, it is important to note that there were significant differences by size of enterprise. Table 8 shows that overall, larger businesses are more likely to have some form of health insurance for their staff, while micro-small businesses do not, and do not intend to, in the future.
If enterprises are broken up by those with fewer or more than 50 employees, both the 2012 and 2014 surveys have shown that only around one-fifth provide health insurance, while roughly half of those with 50+ staff provide at least some form of health insurance.
Key findings
5. Health Insurance in theWorkplace
factors that would lead an enterprise to provide it.
• For those who provide health insurance but donot fully subsidise it, the top four factors had notchanged since 2012, although the gap betweenthem was noteably smaller in 2014.
1-5 6-9 10-49 50-99 100+ AllYes, for all employees 4.8 0.0 16.7 14.3 21.6 14.2Yes, but only a proportion of them 4.8 0.0 13.3 21.4 29.7 16.8No, but would consider it in the future 28.6 9.1 16.7 28.6 18.9 20.4No, we do not see it as something we would provide now or in the future 61.9 90.9 53.3 35.7 29.7 48.7
Table 8: Do you provide health insurance for your staff? (2014)
Provision of health insurance – what would it take?
For employers who do not provide health insurance, a follow-up question was asked about the factors that would cause them to consider providing it. Table 9 shows that as a proportion of those who did not provide health insurance at any level, there was only a small difference for the top three factors,
For those who do provide health insurance, a similar question was asked to the effect that if they did not fully subsidise their health insurance, which factors would cause them to consider increasing coverage.

18 Wellness in the Workplace Survey 2015
Table 9: Factors that would cause an enterprise to consider providing health insurance for their employees (2014)
Number PercentEvidence that it reduces absenteeism 45 57.7Removal of FBT on employer subsidised health insurance 44 56.4A decrease in the cost of health insurance 41 52.6Evidence that it assist in retaining staff due to perceived value as a benefit 35 44.9An approach by a health insurer to discuss policies, benefits and wellness programmes 7 9.0
Contributes to building our ‘employer brand’ 7 9.0Other 10 12.8
Table 10: Factors that would cause an enterprise to consider increasing health insurance coverage for their employees (2014)
Number PercentA decrease in the cost of health insurance 13 37.1Removal of FBT on employer subsidised health insurance 12 34.3Evidence that it assist in retaining staff due to perceived value as a benefit 12 34.3Evidence that it reduces absenteeism 11 31.4An approach by a health insurer to discuss policies, benefits and wellness programmes 1 2.9Contributes to building our ‘employer brand’ 0 0.0Receiving more information and knowledge about health insurance 0 0.0Other 1 2.9
Table 10 below shows that as a proportion of those who did provide some form of health insurance for their staff, the top four factors had not changed since 2012, although the gap between them was notably smaller in 2014.
Looking ahead
• The results from both 2012 and 2014 show that a part orfull provision of health insurance by employers centresaround medium-large businesses. Therefore,thosetypes of businesses that have yet to take up thisoption need clarity around evidence that it reducesabsenteeism.

Wellness in the Workplace Survey 2015 19
• Around nine out of ten enterprises believe wellnesshas at least some impact on the productivity ofstaff.
• Overall stress/anxiety levels for enterprises weremore on the moderate than high side.
• Despite overall moderate levels of stress recorded,the direction of stress levels in 2014 has increased,most notably for enterprises with 50+ staff.
• ‘General workload’ and ‘family relationships’ ledthe way in terms of the main causes of stress,
Key findings
6. Stress Points
although there is a sizeable discrepancy in those outlining long hours between the two broad-sized employee groups.
• Larger businesses are far more likely to undertakepractices to identify stress, with staff surveys themost common tool.
• Flexible hours are the most common stressmanagement tool instigated by enterprises, withover 60% of all businesses using it.
Stress and anxiety in the workplace
Most western-style countries are becoming increasingly aware of health issues and the impact work and lifestyle choices can have on staff wellbeing and performance at work. As a consequence, they are looking for ways to deal with employee stress in order to minimise lost working time and improve overall wellbeing.
Table 11 shows that on a scale of 1 (almost no effect) to 5 (significantly) all businesses by size view wellness impacting on the productivity of staff, with almost identical levels for those with fewer than 100 staff. However, this drops to 3.75 for 100+ staff, mainly due to the influence of a lower average for the public sector (3.43) as all respondents for this group employ over 100 staff.
The last column of table 11 shows on a scale of 1 (almost never stressful for most staff) to 5 (highly stressful for most staff) current stress/anxiety levels amongst staff. Generally speaking, the larger the business the greater the stress level, with private sector businesses experiencing slightly more stress/anxiety than in the public sector.
The fact that stress/anxiety increases as businesses become larger also means there is little surprise that it is large businesses that does not fare as well as smaller ones when it comes to changes experienced over 2014.
Table 11: Wellness impacting staff productivity & rating general stress/anxiety levels amongst staff (2014)
Employee Count
Impact wellness has on staff productivity
(mean)
Stress/anxiety levels amongst
staff(mean)
1-5 4.05 2.486-9 4.00 2.6410-49 4.03 2.3850-99 4.00 3.00100+ 3.75 3.00Private sector 3.98 2.70Public sector 3.43 2.63All 3.94 2.69

20 Wellness in the Workplace Survey 2015
Table 12: Change in direction of general stress levels staff experienced (2014)
Option All(%)
Fewer than 50
staff(%)
50+ staff(%)
Increased 28.6 23.3 35.6Stayed roughly the same 57.1 56.7 57.8
Decreased 14.3 20.0 6.7Net result +14.3 +3.3 +28.9
Table 12 shows that overall, general stress/anxiety levels increased during 2014 for those who provided a direction, with a net +14.3% of firms noting an increase. However, the net result was +28.9% for those with 50+ staff, compared with only +3.3% for those with fewer than 50 staff.
Figure 8 outlines the main causes of stress in the workplace. Three issues of note stand out. First, general workload creates the most stress/anxiety, particularly for businesses with 50+ staff. Second, issues around ‘family relationships’ are also important, but more so for those with fewer than 50 staff. Last, the difference in ‘long hours’ between the two broad sizes of business is considerable.
In terms of other comparisons, a larger proportion of those with 50+ staff outlined ‘other’ main causes of stress. Comments received tended to focus on co-worker and customer relationships.
Figure 9 outlines the main practices businesses used as part of its stress identification process. The obvious conclusion is that larger businesses are more likely to have identification processes in place. Large businesses are also more likely to have the ability to implement these types of structures, plus given the fact that key staff simply cannot have a closer relationship with a larger number of workers, more formal processes
are required.
In relation to stress managment processes in figure 10, both employee sized groups have ‘flexible hours’ as their most prevalent process, the other three specific options were all used by at least half of those with 50+ staff. Around one in five smaller enterprises used either ‘mobile working devices and IT support’ and/or ‘being able to work at home’, However, close to a third simply have no processes in place.
In terms of public/private comparisons, the fact that all of the Government agencies involved in the survey had more than 50 staff meant that the characteristics of how they identified and managed stress tended to be along similar lines to those for 50+ staff.
Looking ahead
• The results show that in broad terms, larger businesses typically have more stressful environments, although in the private sector at least, all businesses by size have almost identical views on how wellness of their staff can impact on productivity.
• As stress management practices and processes show, larger businesses are often in a better position to act on stress levels, due to the availability of resources and tools.
• Reducing levels of harmful stress, particularly amongst larger businesses involves a combination of factors. First, no matter what procedures are put in place, if net stress levels continue to show a sizeable increase year-on-year, then any actions will struggle to improve matters.
• Second, the interrelationship of many of the causes of stress need to be examined. For instance, an emphasis on managing workloads would be the

Wellness in the Workplace Survey 2015 21
best place to start, as it would also help mitigate the issue of long hours worked and pressure to meet work targets and general workloads.
• On the positive side, larger businesses tend to do agood job of identifying and putting processes in place forstress/anxiety issues, but there could be a disconnectwhen it comes to making use of the information.
• Last, while there was a minimal net increase in overallstress levels for enterprises with fewer than 50 staff,such businesses should at least investigate optionsaround stress identification and managements to curbfuture net increases.
Figure 8: Main causes of stress (2014)
0.0% 10.0% 20.0% 30.0% 40.0% 50.0% 60.0% 70.0%
Other
None
Lack of training
Management style/work relationships
Personal illness/health
Financial concerns
Pressure to meet work targets
Long hours
Family-relationships
General workload
Percent
Options
Greater 50
Fewer 50

22 Wellness in the Workplace Survey 2015
Figure 9: Practices undertaken as part of stress idenification (2014)
Figure 10: Stress management processes (2014)
0.0% 10.0% 20.0% 30.0% 40.0% 50.0% 60.0% 70.0%
None
Other
Stress audits
Risk assessment
Training for managers to identify and manage stress
Staff surveys
Percent
Options
Greater 50
Fewer 50
0.0% 10.0% 20.0% 30.0% 40.0% 50.0% 60.0% 70.0% 80.0%
None
Being able to work from home
Mobile working devices and IT support
Employee assistance programmes
Flexible hours
Percent
Options
Greater 50
Fewer 50
Wellness in the Workplace Survey 2015 23
7. Relationship & Communicationwith Staff
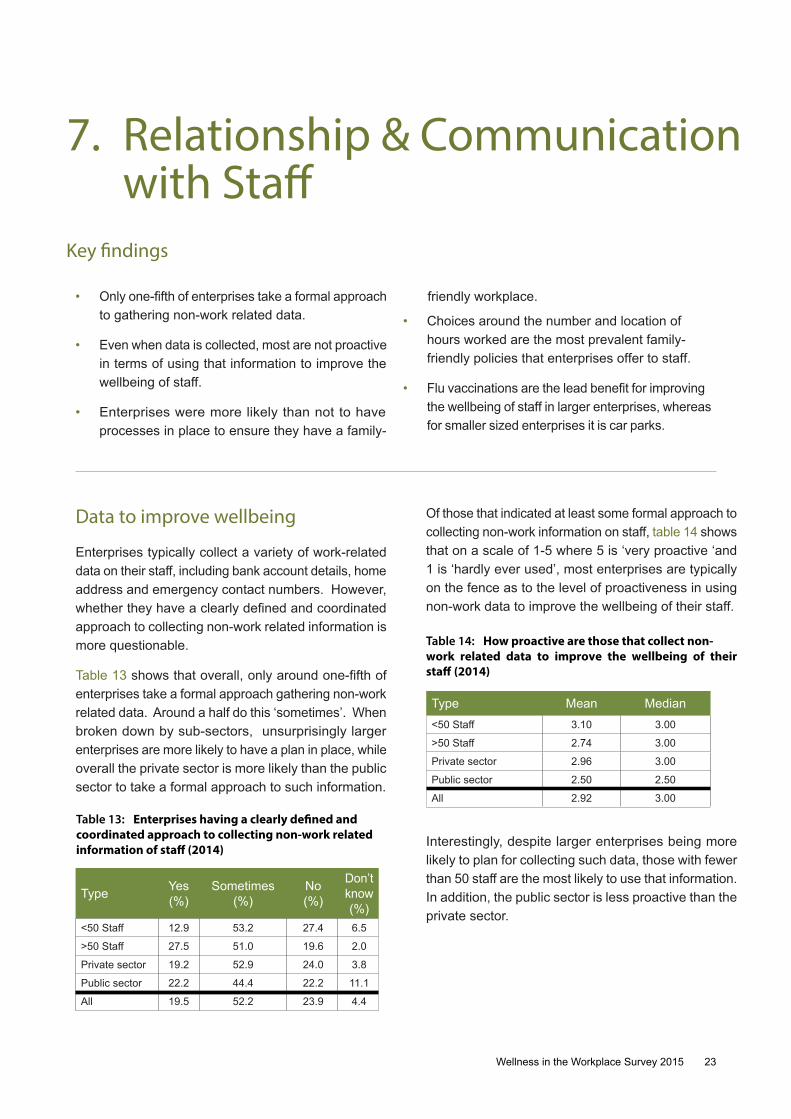
• Only one-fifth of enterprises take a formal approachto gathering non-work related data.
• Even when data is collected, most are not proactivein terms of using that information to improve thewellbeing of staff.
• Enterprises were more likely than not to haveprocesses in place to ensure they have a family-
Key findings
friendly workplace.
Type Yes (%)
Sometimes(%)
No (%)
Don’t know (%)
<50 Staff 12.9 53.2 27.4 6.5
>50 Staff 27.5 51.0 19.6 2.0
Private sector 19.2 52.9 24.0 3.8
Public sector 22.2 44.4 22.2 11.1
All 19.5 52.2 23.9 4.4
Data to improve wellbeing
Enterprises typically collect a variety of work-related data on their staff, including bank account details, home address and emergency contact numbers. However, whether they have a clearly defined and coordinated approach to collecting non-work related information is more questionable.
Table 13 shows that overall, only around one-fifth of enterprises take a formal approach gathering non-work related data. Around a half do this ‘sometimes’. When broken down by sub-sectors, unsurprisingly larger enterprises are more likely to have a plan in place, while overall the private sector is more likely than the public sector to take a formal approach to such information.
Table 13: Enterprises having a clearly defined and coordinated approach to collecting non-work related information of staff (2014)
Of those that indicated at least some formal approach to collecting non-work information on staff, table 14 shows that on a scale of 1-5 where 5 is ‘very proactive ‘and 1 is ‘hardly ever used’, most enterprises are typically on the fence as to the level of proactiveness in using non-work data to improve the wellbeing of their staff.
Table 14: How proactive are those that collect non-work related data to improve the wellbeing of their staff (2014)
Type Mean Median<50 Staff 3.10 3.00
>50 Staff 2.74 3.00
Private sector 2.96 3.00
Public sector 2.50 2.50
All 2.92 3.00
Interestingly, despite larger enterprises being more likely to plan for collecting such data, those with fewer than 50 staff are the most likely to use that information. In addition, the public sector is less proactive than the private sector.
• Choices around the number and location of hours worked are the most prevalent family-friendly policies that enterprises offer to staff.
• Flu vaccinations are the lead benefit for improving the wellbeing of staff in larger enterprises, whereas for smaller sized enterprises it is car parks.

24 Wellness in the Workplace Survey 2015
Type Mean Median<50 Staff 3.80 4.00
>50 Staff 3.52 4.00
Private sector 3.68 4.00
Public sector 3.75 4.00
All 3.68 4.00
We are family
Given the increasing trend to recognise ‘life balance’, where both work and non work life is holistically looked at, having a family-friendly workplace for staff is increasingly becoming a way in which staff are valued and is used as a retention tool.
On a scale of 1 (never) to 5 (always), enterprises were asked where they ensure that their workplace has a family-friendly workplace for staff.
Table 15: Extent to which enterprise ensures it has a family-friendly workplace for staff (2014)
Table 15 shows that the overall mean value was 3.68, which on balance tells us that enterprises were more likely than not to have a family-friendly workplace. When broken down into individual responses, close to a quarter (24.3%) of respondents did not have a view either way (i.e. a score of 3), but almost 62% responded with a score indicating effort towards a family-friendly workplace. On the flip side, only 14% indicated minimal to no effort in this space.
Flexible options
Figure 11 shows that like the question on processes for stress, ‘flexible hours’ was the most common option for enterprises when it came to family friendly policies. Indeed, options around the general time and place of work were the first port of call for both smaller and larger enterprises.
In terms of difference between the two employment groups, over 60% of those with 50+ staff also utilised ‘working from home’ and a ‘transitioned return to work’, with a ‘breast-feeding area’ rounding out the top four.
In contrast, while those with fewer than 50+ staff also sought to provide options around working from, and transitioning to, work, these were at a much lower level.
In terms of general benefits enterprises provide to improve the wellbeing of their staff, figure 12 shows a number of observations. First, the top four benefits are the same for all enterprises. However, whereas those with 50+ staff have a large secondary group of benefits that typically range between 29-41%, those with fewer than 50 staff experience a sharp falloff to the point where the fifth most common benefit is both ‘subsidised health insurance’ and ‘free healthy food’ at only 14.5%. Last, for larger enterprises the lead benefit is flu vaccinations, whereas for smaller sized enterprises it is car parks.
Table 16: Enterprises usually asking staff for input and ideas to improve employee wellbeing (2014)
Type Yes (%)
No (%)
Unsure (%)
<50 Staff 48.4 41.9 9.7
>50 Staff 66.7 27.5 5.9
Private sector 54.8 37.5 7.7
Public sector 77.8 11.1 11.1
All 56.6 35.4 8.0
Enterprises were also asked whether they usually ask staff for input and ideas to improve employee wellbeing. Table 16 shows that slightly more than half do, although there was a noticeable difference between those with +/- 50 staff, with two-thirds of larger businesses usually asking staff for input. In addition, the public sector was more inclined to ask staff than the private sector.

Wellness in the Workplace Survey 2015 25
Figure 11: Family-friendly policies offered (2014)
Figure 12: Benefits provided to improve the wellbeing of staff (2014)
0.0% 10.0% 20.0% 30.0% 40.0% 50.0% 60.0% 70.0% 80.0% 90.0%
None
Other
Onsite crèche
Bring your kids to work days
Breastfeeding area
Transitioned return to work
Working from home
Flexible hours
Percent
Option
Greater than 50
Fewer than 50
0.0% 10.0% 20.0% 30.0% 40.0% 50.0% 60.0% 70.0% 80.0% 90.0%
None
Other
Subsidised public transport
Subsidised food
Healthy food options in the snack box
Exercise groups
Superannuation programme
Free healthy food
Discounted gym membership
Regular health checks
Wellness programme
Subsidised health insurance
Car park
Education/training
Flexible hours/working at home
Flu vaccinations
Percent
Options
Greater 50
Fewer 50

26 Wellness in the Workplace Survey 2015
Getting the message across
Across all enterprises, person-to-person communication was the most effective method of communication, followed by email.
Looking ahead
• It is positive to see that around 7/10 New Zealandenterprises at the very least occasionally take a formalapproach to collecting non-work related information ontheir staff, which could be used to improve wellbeing.However, most are not overly proactive in terms ofhow best to use the information they collect. This isa relatively simple and straightforward way in whichenterprises can take initial steps towards assistingemployees.
• It is also positive to see most enterprises taking afamily-friendly approach to their workplace, with largerenterprises taking a more cross-cutting approach topolicies offered, particularly around location and fluidityof hours worked. This could be further enhanced bysmaller enterprises incorporating these methods.
• In terms of benefits provided to improve wellbeing,there are two areas where smaller enterprises couldprovide more for staff. First, the provision of fluvaccinations would be a relatively inexpensive wayof preventing significant time out of the workforce.In fact, the provision of flu vaccines could even beextended to direct family members given the highproportion who are absent due to caring for ill familymembers. Second, the gap between flexible hours/working from home provided as family-friendly policiescompared with benefits for all staff could be narrowed,with such options available for all employees.
The provision of flu vaccinations
would be a relatively
inexpensive way of preventing
significant time out of the
workforce.

Wellness in the Workplace Survey 2015 27
• 4 out of 5 businesses do not have policies orarrangements in place for older workers, despiteover 40% expecting an increase in workers above65 in their enterprise in the near future.
• Of those that do have policies/arrangements inplace, some change to hours of work was common,followed by lighter duties.
8. Managing Older Workers
discussions around retirement plans.
For those that did not have any policies or arrangements in place for older workers, the stance taken by most enterprises is that the issue around age is nonexistent, as they believe employing older workers is no different from hiring a worker of any age. This highlights how unaware many enterprises are of needing to recognise that older workers might present enterprises with a set of challenges and opportunities that other age brackets might not.
Those who provided comments when questioned on specific policies or barriers to assist older workers, fell into two categories. On one side, there was a view that age is never a consideration when hiring someone, while for others, their oldest staff were in their mid 40s at most, so older worker policies simply were not a practical consideration.
Key findings
• Of those that do not, the idea of specific policiesis in general an anathema to them, as they donot believe these are required or have even beenconsidered.
Type Yes (%)
No (%)
Unsure (%)
Policies or arrangements in place for older workers
20.4 79.6
Expect increase in proportion of workers above 65 in near future
40.7 46.9 12.4
The 2012 survey asked two questions in relation to older workers in the workplace, which showed that the vast majority of businesses did not have policies or arrangements in place for older workers. This was a concern given New Zealand’s workforce is aging. Because of these findings, the 2014 survey followed this up with a section dedicated to the issue of older workers.
Table 17 shows that for 2014, 4 out of 5 businesses still do not have any current policies or arrangements in place for older workers. However, over 40% of businesses expect to see an increase in the proportion of workers in their enterprise above 65 in the near future.
For those that had policies or arrangements in place for older workers, a change to hours of work was clearly the most common option employed. Lighter duties were also instigated by close to half of those businesses with policies in place, while around a third initiated
Table 17: Proportion and policies for older workers

28 Wellness in the Workplace Survey 2015
For further information on this survey contact:
Stephen SummersEconomist
BusinessNZ
Level 6, Lumley House 3-11 Hunter Street
Wellington 6011New Zealand
P: 04 496 6555F: 04 496 6550
[email protected] www.businessnz.org.nz
© Copyright BusinessNZ 2015
The content may not be copied, distributed, or dealt with in whole or in part without prior consent of BusinessNZ.


