65
Wenatchee River Watershed Temperature Total Maximum Daily Load __________________________ Water Quality Improvement Report July 2007 Publication No. 07-10-045

Wenatchee River Watershed Temperature
Total Maximum Daily Load __________________________
Water Quality Improvement Report
July 2007
Publication No. 07-10-045


Wenatchee River Watershed Temperature Total Maximum Daily Load
__________________________
Water Quality Improvement Report
Prepared by David Schneider and Ryan Anderson
Washington State Department of Ecology Water Quality Program Post Office Box 47600
Olympia, Washington 98504-7600
July 2007
Publication Number 07-10-045

You can print or download this document from our website at: http://www.ecy.wa.gov/biblio/0710045.html
For more information contact:
Department of Ecology Water Quality Program Central Regional Office
15 W Yakima Avenue, Suite 200 Yakima, WA 98902
Telephone: (509) 454-7894
Adams
AsotinBenton
ChelanClallam
Clark
Columbia
Cowlitz
Douglas
Ferry
Franklin Garfield
Grant
GraysHarbor
Island
Jefferson
King
Kitsap
Kittitas
Klickitat
Lewis
Lincoln
Mason
Okanogan
Pacific
PendOreille
Pierce
San Juan
Skagit
Skamania
Snohomish
Spokane
Stevens
Thurston
WahkiakumWallaWalla
Whatcom
Whitman
Yakima
Northwest425-649-7000
Southwest360-407-6300
Eastern509-329-3400
Central509-575-2490
Headquarters (Lacey) 360-407-6000
RegionalOfficelocation
Spokane
Yakima
Lacey
Bellevue
Persons with a hearing loss can call 711 for Washington Relay Service.Persons with a speech disability can call 877-833-6341.
If you need this publication in an alternate format, please call the Water Quality Program at 509-454-7888. Persons with hearing loss can call 711 for Washington Relay Service. Persons with a speech disability can call 877-833-6341,

Wenatchee Watershed Temperature TMDL Page i
Table of Contents
Table of Contents .............................................................................................................................i
List of Tables ..................................................................................................................................ii
List of Figures..................................................................................................................................ii
Executive Summary....................................................................................................................... iii
Acknowledgments ..........................................................................................................................vi
Introduction ..................................................................................................................................1
Background ..................................................................................................................................3
Water Quality and Resource Impairments ....................................................................................11
Seasonal Variation.........................................................................................................................14
Technical Analyses........................................................................................................................15
Load Allocations ...........................................................................................................................21
Wasteload Allocations...................................................................................................................22
Margin of Safety............................................................................................................................23
Summary Implementation Strategy...............................................................................................25
References Cited............................................................................................................................35
Appendix A: Wenatchee River Temperature Total Maximum Daily Load Study.....................A-1
Appendix B: Wenatchee National Forest Water Temperature Total Maximum Daily Load Technical Report ..................................................................................................B-1
Appendix C: Load Allocations for Effective Shade in the Wenatchee River Watershed ..........C-1
Appendix D: Public Participation, Media Coverage ..................................................................D-1
Appendix E: Responsiveness Summary.....................................................................................E-1

Page ii Wenatchee River Watershed Temperature TMDL
List of Tables Table 1: Land cover in the Wenatchee River Watershed .............................................................7
Table 2: 2004 303(d) temperature listings for the Wenatchee River watershed. .......................11
Table 3: Wasteload allocation (WLA) for effluent temperatures for selected NPDES dischargers in the Wenatchee River watershed............................................................23
Table 4: Organization and their contributions to implementation..............................................30
Table C-3: Load allocations for effective shade in Nason Creek, outside USFS lands. ............C-5
Table C-4: Loads allocation by channel class, in the Wenatchee River watershed portion of the Wenatchee National Forest........................................................................................C-8
Table C-5: Allocations (as percent effective shade) for water bodies within the Wenatchee National Forest included on the 1996 and 1998 303(d) lists for water temperature .C-9
Table C-6: Load allocations (as percent effective shade) for water bodies where water temperatures were observed at levels exceeding the 16 C˚ water quality standard in 2001 ...........................................................................................................................C-9
Table C-7: Load allocations for effective shade for miscellaneous perennial streams in the Wenatchee River watershed ....................................................................................C-10
List of Figures Figure 1: Wenatchee River watershed............................................................................................5
Figure 2: Annual average precipitation in the Wenatchee River watershed ..................................6
Figure 3: Daily maximum water temperatures in the mainstem Wenatchee River and its tributaries from July to September 2002. .....................................................................17

Wenatchee Watershed Temperature TMDL Page iii
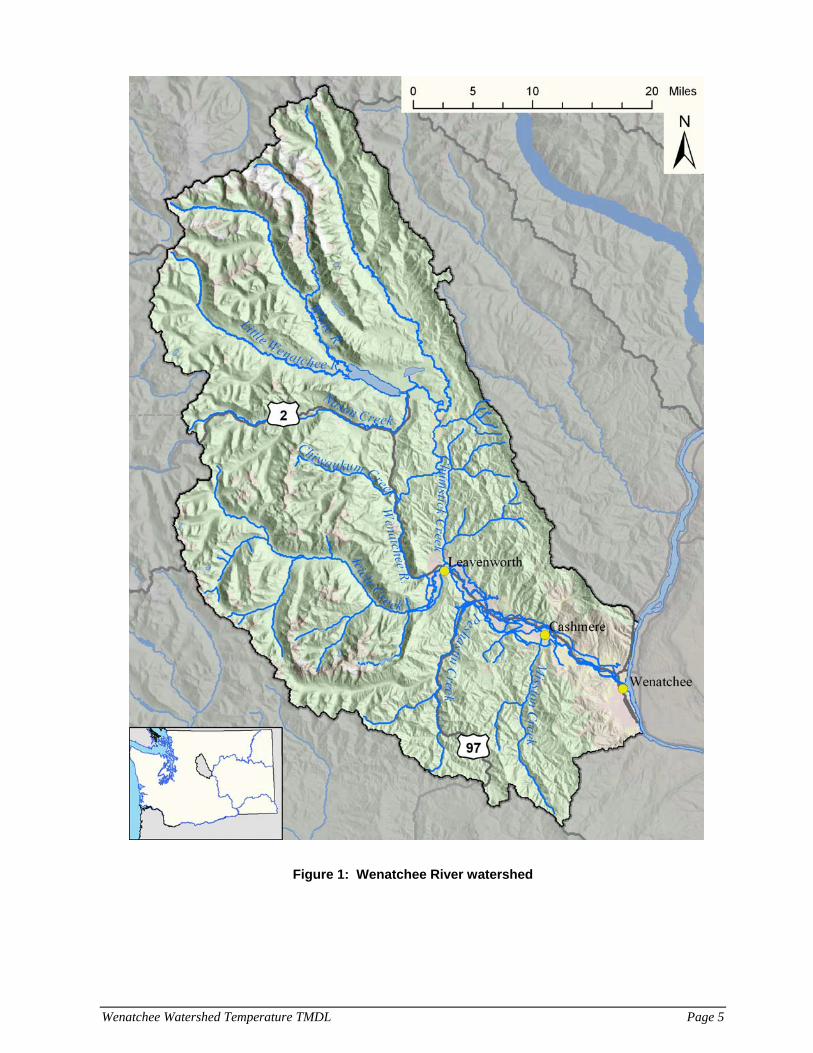
Executive Summary Summer water temperatures of the Wenatchee River and some of its tributaries (Chiwaukum Creek, Icicle Creek, Little Wenatchee River, Nason Creek, Mission Creek, and Peshastin Creek) are warmer than Washington State (the state) water quality standards that are set to protect fish. As a result, these waters are included on the state’s list of water-quality-impaired waters called the 303(d) list. The Washington State Department of Ecology (Ecology) completes evaluations on waters placed on this list and determines pollutant load reductions necessary to bring the waters into compliance with state water quality standards. This total maximum daily load (TMDL) report discusses the temperature loading affecting streams and rivers in the Wenatchee River watershed (Water Resource Inventory Area (WRIA) 45). Based on technical analyses, this document provides targets for reducing heat loading to the Wenatchee River and its tributaries. Actions are identified in the Summary Implementation Strategy section of this document that will reduce heat loading in the Wenatchee River watershed and bring streams and rivers into compliance with the state’s water quality standards for temperature. Implementation of this TMDL will be coordinated with the Wenatchee Watershed Management Plan and its water quality, water quantity, instream flow, and habitat committees to address temperature impairments in the watershed. This TMDL submittal report provides effective shade targets based on the results of two different studies conducted by Ecology. One study was conducted primarily in the Wenatchee National Forest (Whiley and Cleland, 2003). Water quality targets for the Wenatchee National Forest are based on the Whiley and Cleland (2003) Report. The other study was conducted throughout the Wenatchee River Watershed by Cristea and Pelletier (2005). Targets for water temperature improvements in the watershed that lie outside of the Wenatchee National Forest are based on the study by Cristea and Pelletier (2005). Effective shade was used as a surrogate measure of heat flux to fulfill the requirements of Section 303(d) of the Clean Water Act for a temperature TMDL. Effective shade is defined as the fraction of incoming solar shortwave radiation that is blocked by vegetation and topography from reaching the surface of the stream. Wenatchee River watershed The Wenatchee River watershed is located in the central part of Washington State. The Wenatchee River originates at the outflow from Lake Wenatchee. It drains an area of about 1,371 square miles and flows southeast until it meets the Columbia River at the city of Wenatchee. Annual average precipitation throughout the watershed ranges from 150 inches at the crest of the Cascades to 8.5 inches in Wenatchee.

Page iv Wenatchee River Watershed Temperature TMDL
Water quality standards The observed stream temperatures in the Wenatchee River watershed during 2001, 2002, and 2003 showed that current conditions at many locations are warmer than the numeric water quality criteria. At the same time, stream temperatures in other locations were found to be cooler than the numeric criteria. State water quality standards establish: “Temperature shall not exceed 16.0°C for Class AA waters and 18.0°C for Class A waters due to human activities. When natural conditions exceed standards, no temperature increases will be allowed which will raise the receiving water temperature by greater than 0.3°C.” [WAC 173-201A-030(1)] In addition: "Whenever the natural conditions of said waters are of a lower quality than the criteria assigned, the natural conditions shall constitute the water quality criteria [WAC 173-201A-070(2)]." Stream temperature assessment Ecology installed numerous continuous temperature data loggers in the Wenatchee River watershed during the dry seasons of 2002 and 2003 (Figure 3). In addition, the United States Forest Service (USFS) collected data in the Wenatchee National Forest. In general, the warmest temperatures were found at downstream locations in the Wenatchee River, Icicle Creek, and Nason Creek, while cooler temperatures were found in relatively small tributaries or headwater locations. Stream temperature modeling Shade from near-stream vegetation cover, channel morphology, and stream hydrology represent the most important factors that influence stream temperature. Stream temperature modeling predicts reductions in water temperature for theoretical conditions. Modeling can be used to estimate what temperatures would be under either natural or alternative conditions by recognizing the effects of changes in riparian vegetation, improvements in riparian microclimate, and reduced channel widths.
Lower watershed modeling • Model simulations performed at 7-day average 10-year return period (7Q10) critical
flow conditions show that temperature decreases may be attained with future improvements towards a mature riparian vegetation compared with the current conditions.
• Under critical conditions, potential temperature reductions should reduce water
temperatures to below the threshold for fish lethality, 23ºC. However, in some cases, the potential temperature under critical conditions will be greater than the numeric criteria. Potential temperature reductions for average conditions with improvements should be much greater.

Wenatchee Watershed Temperature TMDL Page v
• A buffer of mature riparian vegetation along the banks of rivers and streams, and improvements in microclimate and channel width, are expected to decrease the average daily maximum temperatures.
• Increasing stream flows will also improve temperatures.
Wenatchee National Forest stream modeling • Analysis methods used a stream classification system to estimate effective shade levels
necessary to meet the water quality standard for surface waters throughout the forest.
• Other analysis methods examined site potential shade, or the maximum amount of effective shade provided by late-succession vegetation.
• Due to naturally occurring limitations to vegetative growth, site potential effective
shade levels in some portions of the forest are less that what is needed to achieve the numeric temperature standard.
Recommendations Ecology recommends a series of management activities to reach temperatures that comply with the water quality standards.
• For USFS managed lands in the Wenatchee National Forest, continue implementation of riparian reserves and the maintenance of mature riparian vegetation as established by the Northwest Forest Plan.
• For privately owned forest land, implementation of this TMDL will be accomplished
by compliance with the state forest practice rules, as outlined in the Forests and Fish rules.
• For areas that are not managed in accordance with either the Northwest Forest Plan or
the Forests and Fish Report, such as private non-forest areas, programs to increase riparian vegetation should be developed.
• Instream flows and water withdrawals are managed through regulatory avenues
separate from TMDLs. However, stream temperature is related to instream flow levels, and increases in flow generally result in cooler summer water temperatures.
• In some areas of the watershed, deposition of excessive sediment can cause channel
widening. Land use practices that prevent erosion can minimize this effect.
• Hyporheic exchange flows and groundwater discharges are important to preserve the current temperature regime and reduce maximum daily instream temperatures.
• Regular temperature monitoring is recommended within the Wenatchee River
watershed. Continuously recording water temperature monitors should be deployed

Page vi Wenatchee River Watershed Temperature TMDL
from July through August to capture the critical conditions. At a minimum, the following locations should be sampled:
Wenatchee River near mouth Icicle Creek near mouth Nason Creek near mouth Peshastin Creek near mouth Mission Creek near mouth
• Shade management practices involve the development of site potential vegetation, which requires many years to become established.
• Interim monitoring of summer water temperatures throughout the watershed is
recommended at five year intervals, and periodic monitoring of riparian vegetation is also recommended.
Acknowledgments Many thanks to the participants on the Wenatchee Water Quality Technical Subcommittee (WQTS) and Wenatchee Watershed Planning Unit (WWPU) for their ongoing participation, technical support, wise suggestions, dedication, and commitment to improving water quality and the environment. The Wenatchee River Watershed TMDL for Temperature was developed through the participation and input of numerous stakeholders from the Wenatchee watershed over several years. Many of these stakeholders spent countless hours providing information, reviewing and formulating plan actions, and attending meetings to represent their constituencies.

Wenatchee Watershed Temperature TMDL Page 1
Introduction Section 303(d) of the federal Clean Water Act (CWA) mandates that the state of Washington (state) establish total maximum daily loads (TMDLs) for surface waters that do not meet standards after application of technology-based pollution controls. The U.S. Environmental Protection Agency (EPA) and the Washington State Department of Ecology (Ecology) have issued laws (40 CFR Part 130, RCW 90.48, WAC 173-201A) and developed guidance (EPA, 1991, 1997, 1999, 2001, 2002; Ecology 1991, 1996, 1999, 2002) for establishing TMDLs. Under the CWA, every state has its own water quality standards designed to protect, restore, and preserve water quality. Water quality standards designate characteristic uses of surface waters, such as cold water biota and drinking water supply, and numeric standards, to achieve those uses. When a water body fails to meet water quality standards, the CWA requires that the state: (1) place the water body on a list of “impaired” water bodies and (2) prepare an analysis called a TMDL. Components of this TMDL This TMDL report addresses temperatures in surface waters throughout the Wenatchee River watershed. The recommendations and implementation strategies are intended for not only the stream segments identified as impaired on the 303(d) list, but throughout the watershed. A TMDL determines the loading capacity for a water body, which is the maximum amount of a human-caused degradation (pollution) of water quality that can occur in a water body and still meet the state water quality standards. The TMDL then allocates that load among the various sources. If pollution comes from a discrete source (referred to as a point source) such as an industrial facility’s discharge pipe, that facility’s share of the loading capacity is called a wasteload allocation (WLA). If the pollution comes from a diffuse source (referred to as a nonpoint source) such as farms, or yards and gardens, parking lots and roads, construction sites and storm drains, that share is called a load allocation (LA). The removal of vegetation along streams causes those streams to warm more rapidly and is an example of a diffuse source of pollution that commonly affects compliance with the temperature standards. A TMDL must also consider seasonal variations and include a margin of safety (MOS) that considers any lack of knowledge about the causes of the water quality problem or its loading capacity. The sum of the individual allocations and the MOS must be equal to or less than the loading capacity. The TMDL should also provide reasonable assurance that implementation actions, monitoring, and adaptive management will reasonably achieve water quality standards by established target dates. Adaptive management describes how Ecology and the participating entities will evaluate progress over time and adaptively manage actions to make changes where necessary to achieve water quality standards.

Page 2 Wenatchee Watershed Temperature TMDL
The general purposes of this TMDL are to: • Provide data from stream temperature monitoring throughout the Wenatchee River
watershed. • Provide analyses of the data; identify potential point and non-point sources of
pollution. • Summarize targets for meeting water quality standards. • Fulfill requirements of the federal CWA.
The goal of this TMDL is to ensure that water bodies in the Wenatchee River watershed on the 2004 303(d) list for temperature will reach water quality standards within a reasonable period of time. This TMDL will be implemented in coordination with the Wenatchee Watershed Management Plan (WWMP). A Water Quality Implementation Plan (WQIP) should be completed within one year after the TMDL has been approved by EPA. The WQIP will be based on the information presented in this document. The WQIP will provide a plan for insuring that all shade targets in the watershed will be met by 2068. Development and implementation of the Wenatchee River Watershed Temperature TMDL has been and will continue to be coordinated with the WWMP and its participating entities. The WWMP has been in development since 1999, and was unanimously approved by the Wenatchee Watershed Planning Unit (WWPU) on April 26, 2006. The plan can be downloaded from the following website:
http://www.co.chelan.wa.us/nr/nr_watershed_plan.htm The Wenatchee River Watershed Temperature TMDL is a direct result of the partnership between Ecology and the WWPU’s Water Quality Technical Subcommittee (WQTS). The data, conclusions, and recommendations in this TMDL represent the current evaluation of temperature in the watershed. Ecology will work with groups and communities in the watershed to further the knowledge of temperature problems and solutions, and adaptively manage actions. Conclusions, recommendations, and actions may be refined as new information becomes available and while the WQIP is developed and implemented following approval of this TMDL by EPA.

Wenatchee Watershed Temperature TMDL Page 3
Background The Wenatchee River watershed is located in Chelan County, Washington and encompasses 878,423 acres (1,371 square miles). This watershed is also sometimes referred to as Water Resource Area (WRIA) 45. It is located in the southern part of the county. A map of the watershed is shown in Figure 1. The watershed is bounded on the west by the Cascade Mountians, on the north and east by the Entiat Mountains, and on the south by the Wenatchee Mountains. The local climate is characterized by hot, dry summers and mild to severe winters. Temperature and precipitation amounts (see Figure 2) vary widely in the watershed, depending upon elevation, aspect, and nearness to the mountains. Most of the precipitation occurs as snow during the winter months. Snow depths in the mountains range from 10 to 20 feet and covers the mountain areas from late fall through early summer. Temperatures in the city of Wenatchee range from a January mean of 26.2°F to a July mean of 73.4°F. Summer thunderstorms occur periodically and can result in flash flood conditions in local tributary streams. The Wenatchee River is a tributary to the Columbia River and enters that water body at the city of Wenatchee, 15 miles upstream of the Rock Island Dam. The Wenatchee River is situated over the Chiwaukum graben, which is a lowland developed on top of downdropped sandstone and shale. A graben is an elongated trench bounded by parallel normal faults, which was created when the block that forms the trench floor moved downward relative to the blocks that form the sides. The Chiwaukum graben is bordered by the Leavenworth fault to the west and the Entiat fault to the east (Gresens, 1983). The Wenatchee River flows through this structural feature until it reaches the Columbia River at the city of Wenatchee. Bordering the Chiwaukum graben, there are granitic and metamorphic rocks. During the Pleistocene Epoch, glaciers advanced and retreated over the area. These glaciers deposited significant unconsolidated sediments. There are four types of unconsolidated deposits (USGS, 1977):
1. Lacustrine deposits are silts and clays deposited as lake bottom sediments behind glacial ice and moraine dams.
2. Outwash deposits were created during the advancing and retreating glaciers which deposited sand and gravel in front of the glacier from the glacier meltwater.
3. Till layers are a very dense, poorly sorted mixture of clay, silt, sand, and gravel which were deposited directly beneath the glacial ice.
4. Alluvial deposits were created as these unconsolidated deposits were reworked by the area rivers and streams, and were redeposited to create the uppermost alluvial aquifer which averages approximately 150 feet thick.
There are two major aquifers in the Wenatchee River Watershed: (1) a lower bedrock aquifer, and (2) an overlying unconsolidated alluvial and outwash aquifer (Kimsey, 2005). The predominant water body is the Wenatchee River (53 miles long), which flows in a southeasterly direction from Lake Wenatchee to the Columbia River at the city of Wenatchee.

Page 4 Wenatchee Watershed Temperature TMDL
Streamflow varies during the year, but mean monthly discharge peaks in spring from combined effects of snowmelt and rain on snow events. Most of the flow in the Wenatchee River originates from tributaries in the upper watershed: the White River (25%), Icicle Creek (20%), Nason Creek (18%), the Chiwawa River (15%), and the Little Wenatchee River (15%) (Andonaegui, 2001). Both the White and the Little Wenatchee rivers enter Lake Wenatchee; whereas, the outlet of the lake is the head of the Wenatchee River. Nason Creek enters the river immediately below the lake outlet. The remaining major water bodies in the upper watershed are the Chiwawa River, Chiwaukum Creek, and Icicle Creek. The major water bodies found in the lower portion of the watershed are Chumstick Creek, Peshastin Creek, and Mission Creek. There are numerous other water bodies in the Wenatchee River watershed.
Wenatchee Watershed Temperature TMDL Page 5
Figure 1: Wenatchee River watershed

Page 6 Wenatchee Watershed Temperature TMDL
Figure 2: Annual average precipitation in the Wenatchee River watershed

Wenatchee Watershed Temperature TMDL Page 7
Table 1: Land cover in the Wenatchee River watershed
Area (square miles) Percent of Total
Water 20.2 1.5%
Developed 5.8 0.4%
Barren 94.9 7.1%
Forested upland 930.3 69.4%
Shrub land 108.5 8.1%
Orchard/vineyard/other non-natural 18.8 1.4%
Herbaceous upland 158.1 11.8%
Herbaceous planted/cultivated 2 0.1%
Wetlands 2.3 0.2%
There is a mixture of federal, state, county, and private land ownership throughout the Wenatchee River watershed. Most of the upper subbasin is public land managed by the United States Forest Service (USFS). The USFS managed land in the watershed lies within the Wenatchee National Forest. State Highways 2 and 97 parallel much of the Wenatchee River and Nason Creek, and occupy portions of their floodplains. The incorporated cities designated in the 2000 census are Wenatchee (population 27,856), Cashmere (population 2,965), and Leavenworth (population 2,074). In addition, there are smaller unincorporated towns and communities located along state Highways 2 and 97 (2000 census information). In November 2003, Ecology published the Wenatchee National Forest Temperature Total Maximum Daily Load Technical Report (Whiley and Cleland 2003) (Appendix B). The report provided load capacities, load allocations, and implementation recommendations to restore 303(d) listed water bodies in the Wenatchee National Forest. In August 2005, Ecology published the Wenatchee River Temperature TMDL Study (Cristea and Pelletier 2005) (Appendix A). Stream temperature monitoring in 2002 and 2003 in the Wenatchee River Basin showed that current conditions at many locations were warmer water quality standards.

Page 8 Wenatchee Watershed Temperature TMDL
Applicable Water Quality Standards Through adoption of water quality standards, the state has designated certain characteristic uses to be protected and criteria designed to protect these uses [Chapter 173-201A of the Washington Administrative Code (WAC)]. Standards for this TMDL are based on the state water quality standards adopted in 1997. Ecology adopted new water quality standards in December, 2006 and submitted those revised standards to EPA for approval. If and when the standards are approved, subsequent permit actions (renewals or new permits) and periodic TMDL reviews will be based on the revised standards. This TMDL is designed to address impairments of characteristic uses for listed segments in the Wenatchee River watershed due to exceedences of temperature criteria. The characteristic uses designated for protection in the Wenatchee River watershed are as follows:
“Characteristic uses shall include, but not be limited to, the following: (i) Water supply (domestic, industrial, agricultural).
(ii) Stock watering. (iii) Fish and shellfish:
Salmonid migration, rearing, spawning and harvesting. Other fish migration, rearing, spawning and harvesting. Crustaceans and other shellfish rearing, spawning and harvesting.
(iv) Wildlife habitat. (v) Recreation (primary contact recreation, sport fishing, boating and aesthetic
enjoyment). (vi) Commerce and navigation.”
Under the state’s 1997 water quality standards, the mainstem Wenatchee River and its tributaries are designated Class AA water bodies within USFS managed land boundaries and Class A outside of USFS managed lands. For both classes, “Water quality shall markedly and uniformly exceed the requirements for all or substantially all uses.”
The temperature criteria for Class AA waters: Temperature shall not exceed 16.0°C due to human activities. When natural conditions exceed 16.0°C, no temperature increases will be allowed which will raise the receiving water temperature by greater than 0.3 o C.”
The temperature criteria for Class A waters: Temperature shall not exceed 18.0°C due to human activities. When natural conditions exceed 18.0°C, no temperature increases will be allowed which will raise the receiving water temperature by greater than 0.3 o C.”
The state water quality standards also specifically describe the subject of implementation related to nonpoint sources of pollution:
“Activities which generate nonpoint source pollution shall be conducted so as to comply with the water quality standards. The primary means to be used for requiring compliance

Wenatchee Watershed Temperature TMDL Page 9
with the standards shall be through best management practices required in waste discharge permits, rules, orders, and directives issued by the department for activities which generate non-point source pollution.” [WAC 173-201A-510 (3)(a)]
New water quality standards adopted by the state of Washington but not approved by EPA In December 2006, Ecology adopted significant revisions to the state’s surface water quality standards (Chapter 173-201A WAC). These changes included eliminating the classification system the state had used for decades to designate uses to be protected by water quality criteria (e.g., temperature, dissolved oxygen, turbidity, bacteria). Ecology also revised the numeric temperature criteria that were to be assigned to waters to protect specific types of aquatic life uses (e.g., native char, trout and salmon spawning and rearing, warm water fish habitat). EPA expects to conclude its review of Washington’s rulemaking proceedings within the year 2007. This TMDL must be based on the 1997 version of the state water quality standards, rather than the 2003/2006 version that has not yet been approved by EPA. Sources of further information for the state’s recently adopted water quality standards include:
• The 2006 revisions of the water quality standards can be found online at Ecology’s water quality standards website http://www.ecy.wa.gov/programs/wq/swqs.
• Appendix G shows Ecology’s 2006 use designations for streams in the Wenatchee basin.
• Information on EPA’s findings on the fisheries uses of the Wenatchee basin can be found in map form on EPA’s website: http://yosemite.epa.gov/R10/WATER.NSF/Water+Quality+Standards/WA+WQS+EPA+Disapproval
• The most current information about how the state’s 2003 temperature criteria were developed can be found in a draft discussion paper by Hicks (2002).
Climate change Changes in climate associated with global warming are expected to affect both water quantity and quality in the Pacific Northwest (Casola et al., 2005). Summer streamflows depend on the snowpack stored during the wet season. Studies of the region’s hydrology indicate a declining tendency in snow water storage coupled with earlier spring snowmelt and earlier peak spring streamflows (Hamlet et al., 2005). Factors affecting these changes include climate influences at both annual and decadal scales, and air temperature increases associated with global warming. Increases in air temperatures result in more precipitation falling as rain rather than snow and earlier melting of the winter snowpack. Ten climate change models were used to predict the average rate of climatic warming in the Pacific Northwest (Mote et al., 2005). The average warming rate is expected to be in the range of 0.1-0.6°C (0.2-1.0°F) per decade, with a best estimate of 0.3°C (0.5°F) (Mote et al., 2005). Eight of the ten models predicted proportionately higher summer temperatures, with three

Page 10 Wenatchee Watershed Temperature TMDL
indicating summer temperature increases at least two times higher than winter increases. Summer streamflows are also predicted to decrease as a consequence of global warming (Hamlet and Lettenmaier, 1999). The expected changes coming to our region’s climate highlight the importance of protecting and restoring the mechanisms that help keep stream temperatures cool. Stream temperature improvements obtained by growing mature riparian vegetation corridors along stream banks, reducing channel widths, and enhancing summer baseflows may all help offset the changes expected from global warming – keeping conditions from getting worse. It will take considerable time, however, to reverse those human actions that contribute to excess stream warming. The sooner such restoration actions begin and the more complete they are, the more effective we will be in offsetting some of the detrimental effects on our stream resources. These efforts may not cause streams to meet the numeric temperature criteria everywhere or in all years. However, they will maximize the extent and frequency of healthy temperature conditions, creating long-term and crucial benefits for fish and other aquatic species. As global warming progresses, the thermal regime of the stream itself may change due to reduced summer streamflows and increased air temperatures. The state is writing this TMDL to meet Washington State’s water quality standards based on current and historic patterns of climate. Changes in stream temperature associated with global warming may require further modifications to the human-source allocations at some time in the future. However, the best way to preserve our aquatic resources and to minimize future disturbance to human industry would be to begin now to protect as much of the thermal health of our streams as possible.

Wenatchee Watershed Temperature TMDL Page 11
Water Quality and Resource Impairments In 1996 and 1998, the Wenatchee River, Chiwaukum Creek, Icicle Creek, Little Wenatchee River, Nason Creek, Mission Creek, and Peshastin Creek were included on the state’s 303(d) list of impaired waters due to water quality standard violations for temperature. Both studies used to develop this TMDL identified additional streams in the Wenatchee River watershed that violated numeric temperature standards. These additional exceedances, the 1996 and 1998 listings were included on the 2004 303(d) list. This TMDL addresses all 2004 303(d) listings for temperature by combining the results of technical reports by Whiley and Cleland, (2003) and Cristea and Pelletier (2005). Appendix A and B present these technical reports.
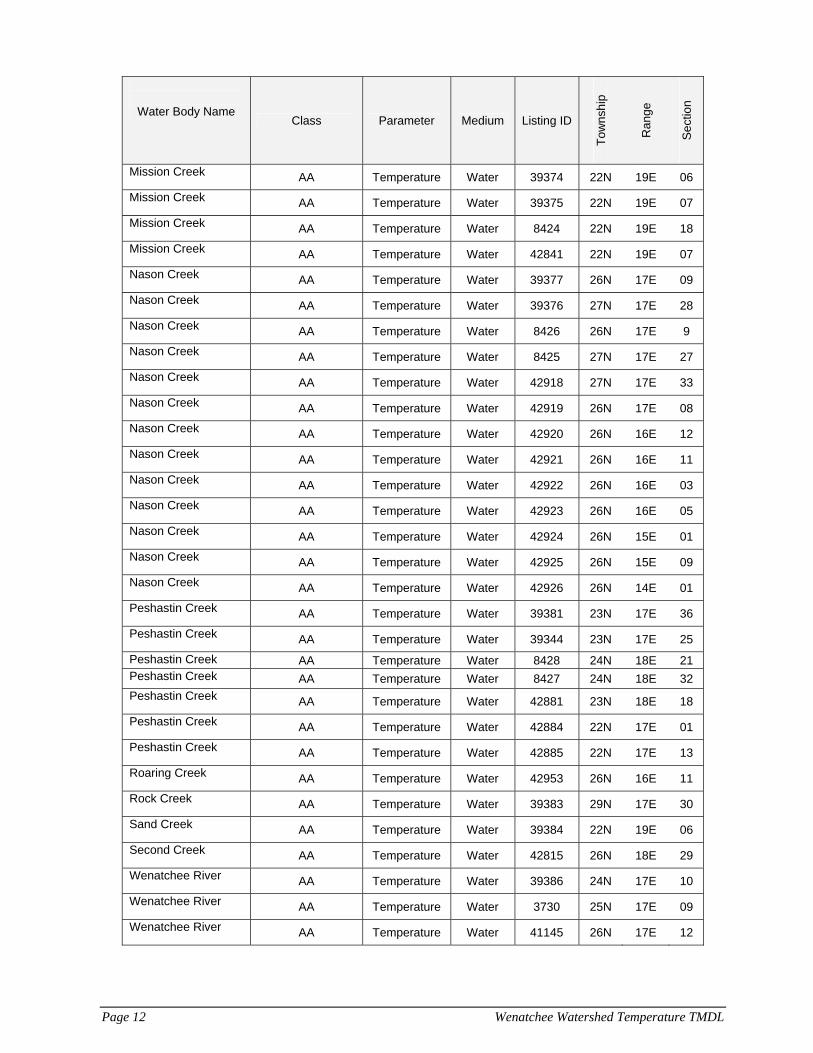
Table 2: 2004 303(d) Temperature listings for the Wenatchee River watershed. Class AA listings within the Wenatchee National Forest are assigned load capacities and load allocations by Whiley and Cleland (2003). Class AA listings outside of the Wenatchee National Forest and Class a listings are assigned loading capacities, load allocations, and waste load allocations by Cristea and Pelletier (2005).
Water Body Name Class Parameter Medium Listing ID
Tow
nshi
p
Ran
ge
Sec
tion
Chiwaukum Creek AA Temperature Water 8409 25N 17E 09
Chiwawa River AA Temperature Water 39357 27N 17E 13
Chiwawa River AA Temperature Water 39359 27N 18E 30
Fish Lake Run AA Temperature Water 42850 27N 17E 27
Icicle Creek AA Temperature Water 39343 24N 17E 27
Icicle Creek AA Temperature Water 42825 24N 17E 13
Icicle Creek AA Temperature Water 42827 24N 17E 28
Icicle Creek AA Temperature Water 42825 24N 16E 24
Icicle Creek AA Temperature Water 42827 24N 16E 11
Little Wenatchee River AA Temperature Water 39364 27N 16E 15
Little Wenatchee River AA Temperature Water 39365 27N 16E 18
Little Wenatchee River AA Temperature Water 39366 27N 15E 11
Little Wenatchee River AA Temperature Water 39370 28N 15E 31
Little Wenatchee River AA Temperature Water 39368 27N 15E 09
Little Wenatchee River AA Temperature Water 39367 27N 15E 10
Little Wenatchee River AA Temperature Water 40764 17N 16E 23
Page 12 Wenatchee Watershed Temperature TMDL
Water Body Name Class Parameter Medium Listing ID
Tow
nshi
p
Ran
ge
Sec
tion
Mission Creek AA Temperature Water 39374 22N 19E 06
Mission Creek AA Temperature Water 39375 22N 19E 07
Mission Creek AA Temperature Water 8424 22N 19E 18
Mission Creek AA Temperature Water 42841 22N 19E 07
Nason Creek AA Temperature Water 39377 26N 17E 09
Nason Creek AA Temperature Water 39376 27N 17E 28
Nason Creek AA Temperature Water 8426 26N 17E 9
Nason Creek AA Temperature Water 8425 27N 17E 27
Nason Creek AA Temperature Water 42918 27N 17E 33
Nason Creek AA Temperature Water 42919 26N 17E 08
Nason Creek AA Temperature Water 42920 26N 16E 12
Nason Creek AA Temperature Water 42921 26N 16E 11
Nason Creek AA Temperature Water 42922 26N 16E 03
Nason Creek AA Temperature Water 42923 26N 16E 05
Nason Creek AA Temperature Water 42924 26N 15E 01
Nason Creek AA Temperature Water 42925 26N 15E 09
Nason Creek AA Temperature Water 42926 26N 14E 01
Peshastin Creek AA Temperature Water 39381 23N 17E 36
Peshastin Creek AA Temperature Water 39344 23N 17E 25
Peshastin Creek AA Temperature Water 8428 24N 18E 21 Peshastin Creek AA Temperature Water 8427 24N 18E 32 Peshastin Creek AA Temperature Water 42881 23N 18E 18
Peshastin Creek AA Temperature Water 42884 22N 17E 01
Peshastin Creek AA Temperature Water 42885 22N 17E 13
Roaring Creek AA Temperature Water 42953 26N 16E 11
Rock Creek AA Temperature Water 39383 29N 17E 30
Sand Creek AA Temperature Water 39384 22N 19E 06
Second Creek AA Temperature Water 42815 26N 18E 29
Wenatchee River AA Temperature Water 39386 24N 17E 10
Wenatchee River AA Temperature Water 3730 25N 17E 09
Wenatchee River AA Temperature Water 41145 26N 17E 12

Wenatchee Watershed Temperature TMDL Page 13
Water Body Name Class Parameter Medium Listing ID
Tow
nshi
p
Ran
ge
Sec
tion
Wenatchee River AA Temperature Water 42861 25N 17E 33
Wenatchee River AA Temperature Water 42862 25N 17E 28
Wenatchee River AA Temperature Water 42865 27N 17E 36
Wenatchee River AA Temperature Water 42866 27N 17E 28
Wenatchee River AA Temperature Water 42871 27N 17E 28
Wenatchee River AA Temperature Water 42977 25N 17E 21
Brender Creek A Temperature Water 11277 23N 19E 05
Chumstick Creek A Temperature Water 42915 25N 18E 07
Chumstick Creek A Temperature Water 42916 26N 18E 30
Highline Canal Return A Temperature Water 42981 23N 20E 29
Icicle Creek A Temperature Water 8415 24N 17E 30
Mission Creek A Temperature Water 11281 23N 19E 05
Mission Creek A Temperature Water 42837 23N 19E 08
Mission Creek A Temperature Water 42838 23N 19E 09
Tronsen Creek A Temperature Water 39385 22N 17E 13
Wenatchee River A Temperature Water 42855 23N 19E 05
Wenatchee River A Temperature Water 41111 23N 19E 11
Wenatchee River A Temperature Water 3729 23N 20E 28
Wenatchee River A Temperature Water 42860 24N 17E 01
Wenatchee River A Temperature Water 41115 24N 18E 08
Wenatchee River A Temperature Water 42858 24N 18E 16
Wenatchee River A Temperature Water 41113 24N 18E 35
Wenatchee River A Temperature Water 3730 25N 17E 09

Page 14 Wenatchee Watershed Temperature TMDL
Seasonal Variation Section 303(d)(1) of the CWA requires that TMDLs “be established at the level necessary to implement the applicable water quality standards with seasonal variations.” The current regulation also directs that determination of “TMDLs shall take into account critical conditions” [40 CFR 130.7(c)(1)]. Finally, Section 303(d)(1)(D) suggests consideration of normal conditions when no critical conditions exist. All of the water bodies in the Wenatchee River watershed demonstrate a seasonal flow regime typical for the east slope of the Cascades, with the highest flows occurring in conjunction with the area’s snowmelt during the spring. Stream flows typically decrease to minimums in early to mid-autumn following dry summer periods. However, Yaksum Creek and Brender Creek flows may increase during the spring and summer due to the addition of irrigation water operational spills from the Icicle and Peshastin Irrigation District canals. Critical stream flows in the watershed are considered as the lowest 7-day average flows with a 2-year recurrence interval (7Q2) and a 10-year recurrence interval (7Q10) during July and August. The 7Q2 stream flows were assumed to represent conditions that would occur during a typical climatic year, and the 7Q10 stream flows were assumed to represent a reasonable worst-case climatic year. Stream temperatures in the Wenatchee River watershed also reflect a seasonal variation. Cooler temperatures occur in the winter, while warmer temperatures are observed in the summer. The highest water temperatures typically occur during mid-August, which corresponds to the highest air temperatures. This period is used as the temperature “critical condition” period for development of the Wenatchee River Watershed Temperature TMDL. In addition, the “critical condition” period for evaluation of solar flux and effective shade was assumed to be August 1 because it is the mid-point of the period when water temperatures are typically at their seasonal peak. This TMDL assumes that waste load allocations and load allocation targets will be met on daily and longer time scales during the critical period. This allows the targets of this TMDL to protect water quality on a daily basis.

Wenatchee Watershed Temperature TMDL Page 15
Technical Analyses Two separate technical reports were used to develop this TMDL in the Wenatchee River watershed: the Wenatchee River Temperature TMDL Technical Report and the Wenatchee National Forest Water Temperature TMDL Technical Report. The former report sets targets for streams and rivers in the Wenatchee River watershed outside of the Wenatchee National, while the latter report addresses only the water bodies in the Wenatchee National Forest. Wenatchee River Temperature TMDL Study (Cristea and Pelletier, 2005) Ecology conducted a study of stream temperature in the Wenatchee River watershed during 2002-2003. A stream temperature model, QUAL2Kw, was used to investigate possible thermal behaviors of the streams for different meteorological, shade, and flow conditions. Effective shade resulting from site potential vegetation was used as a surrogate measure of heat flux to fulfill the requirements of the CWA for a temperature TMDL. Load allocations for effective shade were developed and projected based on site potential, mature riparian vegetation. A network of continuous temperature dataloggers was installed in the Wenatchee River watershed by Ecology. In addition to the dataloggers, a helicopter-mounted thermal infrared radiation (TIR) sensor and color video camera was used to take TIR and visible color images of selected segments of the water bodies within the Wenatchee River watershed to provide a spatially continuous image of surface temperature. An image browser was developed to view the TIR and color video images from 2001, 2002, and 2003. Copies of the browser software and TIR and color imagery from the aerial surveys can be downloaded at the following website:
http://www.ecy.wa.gov/apps/watersheds/temperature/tir/wenatchee/ Long term meteorological data was gathered from the National Oceanic and Atmospheric Administration meteorological station at Leavenworth. The highest daily mean air temperature and the highest 7-day average of daily mean air temperature were selected for each year and were used to determine the median and the 90th percentile conditions. Forty-nine years of data were used for this statistical analysis. To obtain a detailed description of the existing riparian conditions in the Wenatchee River watershed, a combination of Geographic Information Systems (GIS) analysis and aerial photography interpretation was used. A 300-foot width section of each bank of the Wenatchee River was defined and used in the GIS analysis. To increase the accuracy of the image interpretation (riparian vegetation type, height, and density), an additional set of aerial photographs was used: digital photographs acquired during the TIR survey. Field observations of vegetation type, height, and density were also compared against digitized GIS data.

Page 16 Wenatchee Watershed Temperature TMDL
Temperature monitoring showed that water temperatures in excess of Class A or AA water quality standards and the newly adopted 2006 standards are common throughout the watershed. Figure 3 shows the daily maximum water temperatures in the Wenatchee River and its tributaries during 2002. The complete technical report can be read in Appendix A.

Wenatchee Watershed Temperature TMDL Page 17
Figure 3: Daily maximum water temperatures in the mainstem Wenatchee River and its tributaries from July to September 2002.
The QUAL2Kw model (Pelletier and Chapra, 2004; Chapra and Pelletier, 2003) was used to calculate the components of the heat budget and to simulate water temperatures. In general, warmer temperatures were found at downstream locations in the watershed, while cooler temperatures were found in relatively small tributaries or headwater locations. In addition to load allocations, the report recommended implementation and management activities that would help develop site potential shade and improve instream flows, channel width-depth ratios, and hyporheic exchange flows. Additionally, the report recommended utilizing TIR and visible band imagery to prioritize reaches for riparian restoration. Wenatchee National Forest Water Temperature TMDL Technical Report (Whiley and Cleland 2003) Whiley and Cleland (2003) used data collected by the USFS, the Qual2K stream temperature model (Chapra 1997) and the response temperature (J.E. Edinger and Associates) model to calculate load capacities and load allocations for streams in the Wenatchee National Forest in the Wenatchee River watershed. Effective shade is used as a surrogate for heat loading in the Wenatchee National Forest by Whiley and Cleland (2003). The effective shade produced by late-succession, or site potential growth, was estimated for the forest. Site potential vegetation is defined by the maximum tree height and canopy density that can be expected for a particular area. Therefore, the shade produced by site potential vegetation represents the maximum effective shade that can be produced naturally. The site potential shade calculated by Whiley and Cleland (2003) is the load allocation for the Wenatchee National Forest portion of this TMDL. The complete technical report can be read in Appendix B.

Page 18 Wenatchee Watershed Temperature TMDL

Wenatchee Watershed Temperature TMDL Page 19
Loading Capacity Loading capacity is defined as the maximum amount of a pollutant that a water body can receive and still meet water quality standards (40 CFR §130.2(f). The observed stream temperatures in the Wenatchee River watershed during 2001, 2002 and 2003 showed that current conditions at many locations are warmer than the water quality numeric criteria. In addition, many locations were found to be cooler than the temperature numeric criteria. The Wenatchee River Watershed Temperature TMDL uses effective shade as a surrogate measure of heat flux from solar radiation to fulfill the requirements of Section 303(d) of the CWA. Effective shade is defined as the fraction of the potential solar shortwave radiation that is blocked by vegetation and topography before it reaches the stream surface. The definition of effective shade allows for direct measurement of solar radiation loading capacity. The surrogate measure (effective shade) relies on restoring/protecting riparian vegetation to increase shade levels provided by vegetation. Modeling results suggest that in some areas of the watershed it may increase effective shade if practices were put in place that reduced stream bank erosion, stabilized channels, and improved the stream width-depth ratios. Other factors influencing heat flux and water temperature were also considered, including microclimate, channel geometry, groundwater recharge, and instream flow; however, effective shade was determined to have the greatest potential for reducing water temperatures in the watershed. The calibrated QUAL2Kw (Cristea and Pelletier, 2005) and QUAL2k (Whiley and Cleland 2003) models were used to determine the loading capacity for effective shade for streams in the Wenatchee River watershed. Loading capacity was determined based on prediction of water temperatures under typical and extreme flow and climate conditions combined with a range of effective shade conditions. The amount of heat loaded to the Wenatchee River and its tributaries during the critical period under established site potential shade is the loading capacity of these water bodies. Non-USFS lands The lowest 7-day average flow with a 2-year recurrence interval (7Q2) was selected to represent a typical climatic year. The lowest 7-day average flow with a 10-year recurrence interval (7Q10) was selected to represent a worst-case condition for the July-August period. The load allocations and wasteload allocations were based on the 7Q10 condition. Modeling was conducted to predict potential temperature reductions through actions to improve mature riparian vegetation, microclimate, and instream flow. A buffer of mature riparian vegetation providing site potential shade along the banks of the rivers is expected to decrease the average daily maximum temperatures. USFS managed lands Identification of loading capacity targets utilized a landscape stratification and channel classification system developed specifically for this TMDL analysis. The loading capacities
Page 20 Wenatchee Watershed Temperature TMDL
reflect the range variation in geologic setting and associated physical processes that occur across the Wenatchee National Forest. Channel classes were based on three attributes, which include:
• Subsection Mapping Units (SMU) that reflect the geologic setting • Watershed size • Channel morphology
Existing data collected by the USFS was used in a heat budget analysis to determine loading capacity targets. The Response Temperature Model was used for this analysis. The Response Temperature Model allows examination of processes that affect water temperature and can be run in a single reach mode for comparison with actual data. Key factors used in the analysis, which vary by channel class, include:
• Flow • Channel depth • Channel slope • Manning’s n
The analysis process looks at the effective shade that results from the potential natural vegetation for each channel type. The response temperature model compares potential natural vegetation to the effective shade needed to meet the water quality criteria. The effective shade needed to meet the diurnal range target is also considered in the analysis.

Wenatchee Watershed Temperature TMDL Page 21
Load Allocations Effective shade was used as a surrogate measure of heat flux to fulfill the requirements of Section 303(d) of the CWA for this temperature TMDL. Percent effective shade can be linked to specific areas, and thus to actions needed to solve problems that cause water temperature increases. For this reason, shade is used as a surrogate to the thermal load as allowed under EPA regulations (defined as “other appropriate measures” in 40 CFR §130.2(i). Appendix C provides site specific load allocations for effective shade targets throughout the Wenatchee River watershed. It is recognized that portions of many water bodies cannot meet the assigned criteria due to the natural conditions of the water body. When a water body does not meet its assigned criteria due to natural climatic or landscape attributes, the natural conditions constitute the water quality criteria. The standards further state for temperature that: When natural conditions exceed the numeric criteria for the water body, no temperature increases will be allowed which will additionally raise the receiving water temperature by greater than 0.3 o C. For rivers and streams in the Wenatchee River watershed outside the Wenatchee National Forest, the QUAL2Kw temperature modeling for critical conditions established site potential effective shade targets for non-point sources in the watershed (see Appendix A and Appendix C). The natural condition of temperature was approximated by the system potential temperature, which was an evaluation of the combined effect of hypothetical natural conditions of site potential riparian vegetation, microclimate improvements, and improved channel widths. Improved instream flow would also improve stream temperatures. For streams in the Wenatchee National Forest, a channel classification system was used to determine site potential effective shade targets. The channel classification system reflects the range of variation in geologic settings and associated physical processes that occur across the Wenatchee National Forest. Load allocations were based on channel classes within stream sections, drainage areas, channel characteristics, and vegetative groups (see Appendix B and Appendix C). The load allocation for effective shade for all perennial streams in the Wenatchee River watershed is the site potential shade that would occur from mature riparian vegetation. Table C7 in Appendix C can be used to assign effective shade targets based on stream location within the watershed if a specific target was not provided by the other tables in Appendix C. Establishment of mature riparian vegetation is also expected to have a secondary benefit of reducing channel widths and improving microclimate conditions, which will help reduce water temperatures.

Page 22 Wenatchee Watershed Temperature TMDL
Wasteload Allocations The provisions in the water quality standards for natural conditions (WAC 173-201A-070(2)) and the allowable increase in temperature over natural conditions (WAC 173-201A-030(1)(c)(iv) for Class AA and WAC 173-201A-030(2)(c)(iv) for Class A) are the basis of the wasteload allocations in this TMDL. “Whenever the natural conditions of said waters are of a lower quality than the criteria assigned, the natural conditions shall constitute the water quality criteria.” “…When natural conditions exceed 16ºC (in Class AA waters)…, no temperature increases will be allowed which will raise the receiving water temperature by greater than 0.3ºC.” “…When natural conditions exceed 18ºC (in Class A waters)…, no temperature increases will be allowed which will raise the receiving water temperature by greater than 0.3ºC.” The load allocations for the nonpoint sources are considered to be sufficient to attain the water quality standards by resulting in water temperatures that are equivalent to natural conditions. Therefore, the water quality standards allow an increase over natural conditions for the point sources for establishment of the wasteload allocations. Wasteload allocations for the National Pollution Discharge Elimination System (NPDES) discharges were evaluated for the Wenatchee River basin. Maximum temperatures for NPDES effluent discharges (TNPDES) were calculated using the following equation for system potential upstream temperatures greater than or equal to 16ºC (all point sources in this TMDL study discharge to waters that are designated as Class AA) or 18ºC (all point sources discharge to waters that are designated as Class A). Class AA: TNPDES = [16ºC- 0.3 ºC] + [chronic dilution factor] * 0.3ºC Class A: TNPDES = [18ºC – 0.3 ºC] + [chronic dilution factor] * 0.3ºC Maximum effluent temperatures should also be no greater than 33ºC to avoid creating areas in the mixing zone that would cause instantaneous lethality. Table 3 presents the maximum effluent temperatures that would cause an increase of 0.3ºC for various upstream receiving water temperatures for the reported dilution factors. The system potential temperatures upstream from the NPDES dischargers may be greater than 16ºC for Class AA waters or 18ºC for Class A waters and vary depending on the river flow and weather conditions.

Wenatchee Watershed Temperature TMDL Page 23
Table 3: Wasteload allocation (WLA) for effluent temperatures for selected NPDES dischargers in the Wenatchee River watershed.
NPDES Facility Chronic Dilution Factor
Water Quality Standard for
Temperature in Degrees C
Maximum Allowable Effluent
Temperature Wasteload
Allocation in Degrees C
Lake Wenatchee WWTP 214 16 33.0
Stevens Pass WWTP 1 16 16.0
Cashmere WWTP 100 18 33.0
Leavenworth WWTP 37.1 18 28.8
Peshastin WWTP 331.7 18 33.0
Leavenworth National Fish Hatchery 1 18 18.0
Margin of Safety The federal CWA requires that a margin of safety be identified to account for uncertainty when establishing a TMDL. The margin of safety can be placed either implicitly in the use of conservative assumptions, or explicitly as a separate load allocation or an additional target component. In this TMDL, the margin of safety is addressed implicitly, by using conservative assumptions when defining the critical conditions and other conservative assumptions in the modeling analysis. Conservative assumptions used to define critical conditions
• The highest 7-day averages of daily mean air temperatures were used as a worst-case condition for model simulations. • The lowest 7-day average stream flows during July-August with 10-year recurrence intervals (7Q10) were used for the worst-case scenario. • The load allocations are set to the effective shade provided by full mature riparian shade, which are the maximum values achievable in the Wenatchee River watershed.
Additional conservative assumptions Natural conditions, used as the target when natural conditions exceed the numeric standards, were approximated by conservative assumptions of the system potential temperature. System potential temperature assumed effective shade screens resulting from full mature riparian vegetation, microclimate improvements, channel geometry, groundwater recharge, and reduced channel widths.

Page 24 Wenatchee Watershed Temperature TMDL

Wenatchee Watershed Temperature TMDL Page 25
Summary Implementation Strategy Overview The goal of a TMDL is to ensure that an impaired water body attains water quality standards within a reasonable period of time. The Summary Implementation Strategy (SIS) identifies implementation actions and monitoring that should be conducted, and potential implementing entities for this TMDL to reduce temperature inputs and achieve water quality standards. The strategy for success of this TMDL is based upon collective implementation of the actions recommended in the SIS and WQIP. The WQIP will be prepared within one year after the Wenatchee River Watershed Temperature TMDL submittal report has been approved by EPA. The WQIP will describe the specific implementation activities that need to be performed in order to achieve the TMDL targets. The WQIP will provide detail on how, when, and where implementation and monitoring activities should be conducted. Ecology and other entities should provide technical assistance and seek additional funding for these activities and any new activities that may be identified as the body of data grows. Public input should be sought to help prepare the plan. Ecology began working with the WQTS in 2001. At the same time, the WWPU began developing a watershed plan to address water quantity, water quality, habitat, and instream flow issues in the watershed. The WQTS is a subcommittee of the WWPU as well as the TMDL advisory group. This TMDL was developed concurrently with the water quality component of the WWMP. This SIS incorporates actions from the water quality component of the WWMP. Ecology and the USFS will work together to implement projects that reduce temperatures in the Wenatchee River watershed streams and rivers. Ecology also works with the Washington State Department of Natural Resources (DNR) to encourage forest practices that prevent input of pollutants to water bodies, provide stream shade, and implement water quality requirements for timber harvesting activities on state owned and private lands. Ecology is committed to assist DNR in identifying and improving site-specific situations where reduction of shade has the potential for causing damage to public resources. New rules for roads also apply. These include new road construction standards, as well as new standards and a schedule for upgrading existing roads. Under the new rules, roads must provide for better control of road-related sediments, provide better stream-bank stability protection, and meet current Best Management Practices (BMPs). DNR is responsible for oversight of these activities. For private land that is not covered by the Forest and Fish report (i.e., private and state-owned forest not covered by the DNR forest practices HCP), the following regulations affects land-use and management along rivers and streams:
• Shorelines of rivers with annual flows greater than 1,000 cubic feet per second (cfs) and streams with average flows greater than 20 cfs are managed under the Shoreline Management Act; and

Page 26 Wenatchee Watershed Temperature TMDL
• Within municipal boundaries, land management practices next to streams may be
limited if there is a local critical areas ordinance. Outside municipalities, county sensitive areas ordinances may affect such practices as grading or clearing next to a stream, if the activity comes under county review as part of a permit application. There are challenges in the watershed associated with human habitation, existing development, roads, and railroads which may limit potential improvements in some areas. These physical and socio-economic challenges will be considered as implementation actions are developed. Riparian planting will be developed and prioritized in the WQIP based on site potential for effective shade and physical/socio-economic considerations with the participating entities. All riparian planting type projects for this TMDL should be completed by 2018. If this occurs, it is anticipated that site potential shade targets, the load allocations, can be met by 2068. Early implementation activities Activities have already begun to address temperature impairments in the Wenatchee River watershed. These are described below.
Wenatchee River Watershed Action Plan – 1998 In 1995, a committee of 20 people was created by the Chelan County Conservation District (CCCD) that became the Wenatchee River Watershed Steering Committee and a Technical Advisory Committee. These committees developed the Wenatchee River Watershed Action Plan. Its purpose is to implement an effective, coordinated program of actions that will identify, correct, and prevent non-point pollution as well as protect beneficial uses of the water within the Wenatchee River watershed.
The plan was created as a guidance document for individuals, citizen groups, businesses, schools, governmental agencies, tribes, and other entities responsible for protecting and/or restoring water quality in the Wenatchee River watershed from non-point pollution. The primary emphasis of the plan was to provide information, education, technical assistance and, finally, monetary incentives that will ultimately protect the Wenatchee River, its tributaries, associated lakes, and wetlands through specific actions.

Wenatchee Watershed Temperature TMDL Page 27
Ecology TMDL support grant
An Ecology Centennial Clean Water Fund grant was awarded in the fall 2001 to the CCCD and the project was completed in January 2005. The purpose was to allow the CCCD to provide assistance to Ecology in starting the TMDL process and implementation of BMPs in the Wenatchee River watershed.
Increased landowner awareness of water quality issues was accomplished through a variety of means including supporting grass roots efforts to collectively increase the stewardship ethic for the people living in the Wenatchee River watershed. The following specific items were completed:
• The CCCD developed a total of eight newsletters about every four months. Each issue
was sent to approximately 4,000 homes in Chelan County.
• Three display boards were prepared to highlight water quality issues and topics. The displays were exhibited during events where they would have the maximum exposure to the public: Chelan County Fair (1,000 people) and Salmon Festival (10,000). The displays were also exhibited at watershed and Horticultural Association meetings.
• Two flyers were produced and distributed at events where the display was exhibited.
The flyers focused on the TMDL process and explained how BMPs can be implemented to address water quality issues.
• Three direct mailings (once per year) were sent out to residents and businesses in the
Mission, Brender, Yaksum, Chumstick and Peshastin Creek subbasins.
• Three radio interviews were conducted and seven newspaper stories were printed during the project.
• Three presentations to students were used to educate and increase awareness of water
quality problems in the watershed. Presentations were made to the Cashmere High School’s chapter of Future Farmers of America and the Forestry and Outdoor Education Program. A network of monitoring sites was also set up for use by students.
• The CCCD assisted Ecology with water quality monitoring and provided valuable
assistance with various landowners to obtain permission for sampling on their property.
• The CCCD worked closely with the U.S. Department of Agriculture Natural
Resources Conservation Service (NRCS) and its Environmental Quality Incentive Program (EQIP) to apply BMPs to 521 acres. By using Centennial Clean Water Fund grant and EQIP funding, the CCCD developed 25 Conservation Plans and 80 BMPs.
• The CCCD was very involved with the Wenatchee River watershed planning process.
A primary goal of the District under the project was to assist Ecology in incorporating

Page 28 Wenatchee Watershed Temperature TMDL
appropriate actions outlined in the Wenatchee River Watershed Action Plan and TMDL into the Wenatchee Watershed Management Plan.
• The “Kids in the Creek” program was developed out of an earlier watershed planning
grant. Hundreds of students have been through the program. The program recently received a national award as an outstanding environmental education program.
Implementation strategy development
The WQTS and WWPU assisted Ecology with the development of implementation actions for this SIS. The implementation actions below are published in the WWMP. Implementation actions fit into one of three categories:
(1) Actions that are already required by existing programs/regulations (2) Actions that are voluntary to meet TMDL goals (3) Monitoring or adaptive management actions.
Implementation actions The following actions were developed by the WQTS. Implementation action items are cross-referenced with WWMP water quality actions. Implementation action item #1 (WWMP, 7.4.2, QUAL-1) CCCD should continue to oversee and implement recommendations in the Wenatchee River Watershed Action Plan, ensure other entities are also implementing voluntary actions in the Watershed Action Plan, and encourage continued funding of these efforts. Implementation action item #2 (WWMP, 7.4.2, QUAL-3) Ecology should continue to work with the WWPU to assist in the identification of opportunities to fund future projects. Implementation action item #3 (WWMP, 7.4.2, QUAL-4) Encourage the WWPU and its other subcommittees (Water Quantity, Instream Flow, Habitat, and Growth and Land Use) to use the information in the TMDL technical reports and SIS along with their conclusions, recommendations, and actions for a more holistic approach to restoration, preservation, and enhancement of the watershed for all beneficial uses. Implementation action item #4 (WWMP, 7.4.2, QUAL-6) Actions to improve shade near surface waters should be implemented. The WQTS should encourage implementation of a prioritized list of areas and plans for establishing riparian vegetation. Associated monitoring should be planned and implemented over time, as site potential riparian vegetation requires many years to become established. The WQTS should coordinate with the WWPU’s other subcommittee conclusions, recommendations, and actions to reduce water temperatures. Implementation action item #5 (WWMP, 7.4.2, QUAL-7)

Wenatchee Watershed Temperature TMDL Page 29
For USFS managed land, the riparian reserves prescriptions in the Northwest Forest Plan should continue to be maintained for the establishment of site potential riparian vegetation, where appropriate. The USFS is the primary implementing agency in the Wenatchee National Forest. The WQTS and Ecology should coordinate with the USFS. Implementation action item #6 (WWMP, 7.4.2, QUAL-8) For state and privately owned forest land, the riparian vegetation prescriptions in the Forests and Fish Report (Department of Natural Resources, 1999) should be implemented for all perennial streams. Implementation action item #7 (WWMP, 7.4.2, QUAL-9) For areas that are not managed in accordance with either the Northwest Forest Plan or the Forests and Fish Report, voluntary programs to increase and protect riparian vegetation should be developed, such as riparian buffers and conservation easements. Implementation action item #8 (WWMP, 7.4.2, QUAL-10) Stream temperature is often related to the amount of instream flow, and increases in flow generally result in decreases in temperatures. The WQTS should work with the WWPU and watershed entities to encourage projects that have the potential to increase and protect surface and groundwater flows. Implementation action item #9 (WWMP, 7.4.2, QUAL-11) Activities to control potential channel widening processes should be encouraged. Reductions in channel width are expected as mature riparian vegetation is established. Also, activities that reduce sediment runoff to surface waters from upland and channel erosion can affect channel width and temperatures. Implementation action item #10 (WWMP, 7.4.2, QUAL-12) Actions to improve hyporheic exchange flows and groundwater-surface water recharge should be identified and implemented to improve the current temperature regime and reduce maximum daily instream temperatures. Implementation action item #11 (WWMP, 7.4.4, QUAL-13) It is recommended that Ecology continue existing temperature monitoring, and expand the current temperature monitoring program such that it is consistent with flow monitoring actions recommended in the Wenatchee Watershed Plan, WRMS-4a and WRMS-4c.
WRMS-4a: Recommends that Ecology continue to support monitoring at all existing stream gages in the Wenatchee watershed. Ecology and partners must ensure that the gages and streamflow data are well maintained. Updated data should be made available on the Ecology website in a timely manner for all gages managed by Ecology. WRMS-4c: Recommends a new stream gage be established at the existing control point on Icicle Creek. Details will be determined during Phase IV, Implementation (of the Wenatchee Watershed Plan).

Page 30 Wenatchee Watershed Temperature TMDL
Implementation action item #12 (WWMP, 7.4.2, QUAL-15) To determine the effects of management strategies within the Wenatchee River watershed, regular monitoring is recommended. Continuously-recording water temperature monitors should be deployed from July through August to capture the critical conditions. The following locations should be targeted for a minimal sampling program: Wenatchee River near mouth, Icicle Creek near mouth, Nason Creek near mouth, Peshastin Creek near mouth, and Mission Creek near mouth. Monitoring should be conducted associated with BMPs to track progress toward shade and water quality targets. Implementation action item #13 (WWMP, 7.4.2, QUAL-16) Funding assistance should be sought from Ecology through its grants and loans programs to implement actions and ongoing monitoring. Other funding sources should be identified and applications submitted to provide funding for ongoing activities. Implementation action item #14 The WQTS, Ecology, and appropriate entities should work with the Washington State Department of Transportation (WSDOT) to manage paved surface areas near the water bodies covered in this TMDL. Runoff from those areas and the type and extent of vegetation in their right-of-way areas could be significant. The Wenatchee River, Nason Creek and Peshastin Creek all have state highways close to their banks. The management activities in the right-of-way should be informed by the TMDL riparian management strategies. Additionally, the TMDL recommends that as future highway reconstruction projects come up, consideration should be given to alignment changes away from the stream. County and USFS road right-of-ways also abut some of the waters in this watershed. Those road management agencies should include riparian management in collaboration with the TMDL. Implementation action item #15 Ongoing education, outreach, and technical assistance should be provided. Participating entities should coordinate to provide education, outreach, and technical assistance regarding water temperature problems, solutions, and ongoing actions. Implementation activities Table 4 below presents implementation activities, potential contributors of action and relative time frames for implementing the activities. Implementation actions are described in more detail in the WQIP, and are dependent upon funding, cooperative agreements, and other sources of support for implementation.
Table 4: Organization and their contributions to implementation
TMDL Year
Implementation Action Item Potential Contributors
200
7
200
8-18
201
8
202
8
206
8
Complete WQIP Ecology, WQTS and stakeholders
x

Wenatchee Watershed Temperature TMDL Page 31
Implementation Action Item Potential Contributors
200
7
200
8-18
201
8
202
8
206
8
Implement #1 Continue Watershed Action Plan implementation
CCCD, appropriate entities
x x x
Implement #2 Work with WWPU on TMDLs Ecology, WWPU, appropriate entities
x x x x x
Implement #3 Funding projects Ecology, WWPU, funding entities
x x x x x
Implement #4 TMDL, WWPU holistic approach Ecology, WWPU, appropriate entities
x x x x x
Implement #5 Riparian vegetation list
Chelan County, WQTS, WWPU, Ecology, CCCD, NRCS, USFS, DNR, WSDOT, CC, municipalities, x x
Implement #6 Riparian planting, USFS, NWFP
WQTS, WWPU, USFS, Ecology
x x
Implement #7 Riparian planting, DNR WQTS, WWPU, DNR, Ecology
x x
Implement #8 Riparian planting, private lands
WQTS, WWPU, private landowners, Ecology, Chelan County, CCCD x x
Implement #9 Instream flow, temperature
WQTS, WWPU, Ecology, agencies, CC, municipalities, agriculture, irrigation districts, private landowners
x x x x x
Implement #10 Channel width, erosion
WQTS, WWPU, Ecology, agencies, CC, municipalities, agriculture, irrigation districts, private landowners
x x x x
Implement #11 Groundwater-surface water recharge
WQTS, WWPU, Ecology, agencies, CC, municipalities, agriculture, irrigation districts, private landowners
x x x x Implement #12 Temperature monitoring at WWPU stream gages
Ecology, CCNR, CCCD, appropriate entities x x x x
Implement #13 Water storage, temperature
WQTS, WWPU, Ecology, agencies, CC, municipalities, agriculture, irrigation districts, private landowners
x x x x
Implement #14 Monitoring
WQTS, WWPU, Ecology, CCCD, NRCS, schools, agencies
x x x x
Implement #15 Funding Ecology, WWPU, WQTS, agencies, other entities
x x x x

Page 32 Wenatchee Watershed Temperature TMDL
Implementation Action Item Potential Contributors
200
7
200
8-18
201
8
202
8
206
8
Implement #16 WSDOT, County roads
WQTS, Ecology, WSDOT, Chelan County, appropriate entities
x x x x
Implement #17 Education, outreach, and technical assistance
Ecology, WQTS, WWPU, agencies and other entities
x x x x
Evaluate and implement adaptive management changes
WQTS, WWPU, Ecology, CCCD, USFS, DNR, DOT, agencies, CCNR, municipalities, agriculture, irrigation districts, private landowners
x x x x
Monitoring and analysis of TMDL targets every 5 years
Ecology, appropriate entities x x x x
USFS agreements and plans The USFS will complete work that improves the temperature of waters in the Wenatchee National Forest and meet water quality standards. The USFS and Ecology established a joint Memorandum of Agreement (MOA) in 2000, which is currently being updated. The MOA established a process to jointly address water quality issues on USFS lands. The Wenatchee National Forest Water Temperature TMDL Technical Report was developed in 2003 to specifically address temperature listings in the Wenatchee National Forest, (see Appendix B). Additionally, the Northwest Forest Plan, implemented in 1994, will be utilized as a mechanism to improve temperatures. The Northwest Forest Plan was implemented in response to the recognized need to preserve and protect habitat for threatened and endangered species. The Aquatic Conservation Strategy is a component of the NWFP and consists of four program elements: watershed analysis, riparian reserves, restoration on a watershed scale, and key watersheds. TMDLs fit within the framework of the NWFP because watershed analysis on a landscape scale is used to identify ecological processes of significance to maintenance of watershed scale function and process, desired future ecological conditions, and restoration needed to move current condition to that attainable future condition. Riparian reserves are meant to maintain and protect the function and process of stream channels, and floodplains and wetlands. Key watersheds are high quality watersheds crucial for protection of at-risk fish species and for provision of high quality water. A large portion of the Wenatchee River watershed is designated “Key Watersheds.” Basically, the AQS includes every part of a TMDL except the public involvement which is included in the project scale NEPA.

Wenatchee Watershed Temperature TMDL Page 33
Reasonable Assurance Reasonable assurance is required only where point sources exceed the water standards, and therefore non-point sources must be consistently reduced in order to compensate for any such exceedances. Because point sources in the Wenatchee River watershed were found to meet the temperature water quality standards, reasonable assurances are not required. However, NPDES permit mixing zones will continue to require that temperature standards are met for point sources. Additionally, nonpoint source implementation actions identified in this TMDL, funding, ongoing monitoring, and adaptive management can provide reasonable assurance that non point source goals will be achieved within the timeline proposed. Several newspaper articles, press releases and meetings were attended by Ecology staff and members of the WQTS during the development of this report. WQTS members reviewed and commented on the Wenatchee River Temperature Total Maximum Daily Load Study several times during its development. The WQTS reviewed several versions of this report beginning in 2006. A public comment period for review of this report was held from May 23, 2007 through June 22, 2007 Adaptive Management The Wenatchee River Watershed Temperature TMDL is the result of a partnership between the Department of Ecology (Ecology), the WWPU, and the WQTS. The data collection and implementation actions presented in this Water Quality Improvement Report represent the current level of knowledge of river and stream temperatures in the Wenatchee River watershed. It is the understanding of the WQTS that additional studies can be performed to fill data gaps and address unanswered questions, as determined by the WQTS. Conclusions and recommendations currently presented in this TMDL may be revised based on new data as it becomes available. It is also the understanding of the WQTS that any new data gathered from further study can be incorporated in the TMDL process in the WQIP wherein recommendations and management strategies may be refined. This adaptive management approach is acceptable to Ecology, the WWPU, and the WQTS. Ecology will partner with stakeholders (interested parties) in the watershed to conduct studies addressing information gaps (e.g., monitoring). It is Ecology’s responsibility to assure that cleanup is being actively pursued and water standards are achieved. Further monitoring for purposes of the TMDL will be described in the WQIP. Any new science available may be integrated into the implementation of this TMDL if new conclusions and management recommendations result. Management strategies addressing both point and nonpoint pollution sources are subject to this adaptive management approach.
Page 34 Wenatchee Watershed Temperature TMDL
Monitoring Strategy Monitoring is included as part of the implementation strategy to track and evaluate the effectiveness of implementation measures. Ecology, the Chelan County Natural Resources program, the CCCD, and other appropriate entities should continue to work together in ongoing monitoring in the Wenatchee River Watershed. Following the approval of this TMDL by the EPA, Ecology will develop a WQIP for the Wenatchee River watershed. The WQIP will include monitoring to evaluate the effectiveness of implementation actions toward achieving water quality standards for temperature. Monitoring will be conducted, to some extent, every five years, and optimally will be included in the design of all implementation actions. Monitoring will be coordinated with other WWPU committee implementation actions (habitat, instream flow, and water quantity) as well as related actions by other entities in the watershed. Potential Funding Sources Entities are encouraged to apply to Ecology’s Centennial Clean Water Fund, Section 319 Fund, and State Revolving Fund to fund activities. Participants are also strongly encouraged to pursue other funding sources through the WWPU and other entities. The USFS funds restoration activities on lands it administers. The types of restoration activities include road decommissioning, road stabilization and riparian plantings. The types of funds used to complete this work include Emergency Repair for Federally-Owned Roads, Supplemental Emergency Flood, and Appropriated funds.

Wenatchee Watershed Temperature TMDL Page 35
References Cited Casola, J.H., J.E. Kay, A.K. Snover, R.A. Norheim, L.C. Whitely Binder, and the Climate Impacts
Group. Climate Impacts on Washington’s Hydropower, Water Supply, Forests, Fish, and Agriculture. A report prepared for King County (Washington) by the Climate Impacts Group (Center for Science in the Earth System, Joint Institute for the Study of the Atmosphere and Ocean, University of Washington, Seattle).
Chapra, S.C., 1997. Surface Water Quality Modeling. McGraw-Hill Companies, Inc. Chapra, S.C., Pelletier, G.J., 2003. QUAL2K: A Modeling Framework for Simulating River and
Stream Water Quality: Documentation and Users Manual. Civil and Environmental Engineering Dept., Tufts University, Medford, MA ,
Cristea N., Pelletier G. Ecology, 2005 Wenatchee River Temperature Total Maximum Daily Load
Study. Publication Number 05-03-011. Ecology, 2002. Guidance Document for Developing Total Maximum Daily Loads (TMDLs):
Water Cleanup Plans. Publication Number 99-23-WQ. Revision of the original 1999 publication.
Ecology, 1996. Total Maximum Daily Load Development Guidelines. Washington State
Department of Ecology, Olympia, WA. Publication No. 91-e31. www.ecy.wa.gov/biblio/97315.html.
Ecology, 1991. Guidance for Determination and Allocation of Total Maximum Daily Loads
(TMDLs) in Washington State. Washington State Department of Ecology, Olympia, WA. Publication No. 91-e31. www.ecy.wa.gov/biblio/91e31.html.
EPA, 2005. Principles to Consider When Reviewing and Using Natural Conditions Provisions.
EPA Region 10, Office of Water and Watersheds, Natural Conditions Workgroup Report. EPA, 1999. Protocol for developing Total Maximum Daily Loads (TMDLs). Document number
841-B-99-007. U.S. Environmental Protection Agency. EPA, 1997. New policies for Establishing and Implementing Total Maximum Daily Loads
(TMDLs). http://www.epa.gov/OWOW/tmdl/ratepace%201997guid.pdf EPA, 1997. Memorandum of Agreement Between the United States Environmental Protection
Agency and the Washington State Department of Ecology Regarding the Implementation of Section 303(d) of the Federal Clean Water Act.
EPA, 1991. Guidance for Water Quality-based Decisions: The TMDL Process.
U.S. Environmental Protection Agency. EPA 440/4-91-001.

Page 36 Wenatchee Watershed Temperature TMDL
EPA Region 10 TMDL check list for Washington. http://yosemite.epa.gov/r10/water.nsf/6cb1a1df2c49e4968825688200712cb7/85a5f7e5c7384848882569a60062f446!OpenDocument
Hamlet A.F. and D.P. Lettenmaier, 1999. Effects of climate change on hydrology and water resources
in the Columbia River Basin. Journal of the American Water Resources Association, 35(6):1597- 1623.
Hamlet, A.F., P.W. Mote, M. Clark, and D.P. Lettenmaier, 2005. Effects of temperature and
precipitation variability on snowpack trends in the western U.S. Journal of Climate, 18 (21): 4545-4561.
Hicks. M., Ecology, 2002 Evaluating Standards for Protecting Aquatic Life in Washington’s
Surface Water Quality Standards – Temperature Criteria – Draft Discussion Paper and Literature Summary
Kimsey, M., 2005. Ecology Groundwater Data Summary for the Wenatchee River Watershed Total
Maximum Daily Load Study. Publication No. 05-03-018. Pelletier, G.J., Chapra, S.C, 2003 QUAL2Kw: Documentation and User Manual for a Modeling
Framework to Simulate River and Stream Water Quality. Draft Publication. Washington State Department of Ecology, Olympia, WA.
USGS. 1977. Preliminary Map of the Wenatchee 1:100,000 Quadrangle, Washington. U.S.
Geological Survey. Open File Map 77-531. 40 p. Wenatchee River Watershed Steering Committee, 1998. Wenatchee River Watershed Action
Plan – Final. March 1998. Supported by the Chelan County Conservation District and approved by the Washington State Department of Ecology. 107 pp.
Whiley, A.J. and Cleland, B. Ecology, 2003 Wenatchee National Forest Water Temperature
Total Maximum Daily Load Technical Report. Washington State Department of Ecology. Publication Number 03-10-063.
WS, LLC, 2002. Aerial Surveys in the Wenatchee River Basin – Thermal Infrared and Color
Videography. December 12, 2002. Report to the Washington Department of Ecology, Olympia, Washington.

Wenatchee Watershed TMDL for Temperature Page A-1
Appendix A: Wenatchee River Temperature Total
Maximum Daily Load Study
This report is available for downloading at the following website: www.ecy.wa.gov/biblio/0503011.html

Page A- 2 Wenatchee Watershed Temperature TMDL

Wenatchee Watershed TMDL for Temperature Page B-1
Appendix B: Wenatchee National Forest Water
Temperature Total Maximum Daily Load Technical Report
This report is available for downloading at the following website: http://www.ecy.wa.gov/biblio/0310063.html

Page B- 2 Wenatchee Watershed Temperature TMDL

Wenatchee Watershed TMDL for Temperature Page C-1
Appendix C: Load Allocations for Effective Shade in the Wenatchee River Watershed
Table C1. Load allocations for effective shade in the Wenatchee River. Targets are based
on percent effective provided by site potential vegetation and applies to streams outside of United States Forest Service (USFS) managed lands of the Wenatchee National Forest.
Distance from Mouth to Upstream
Segment Boundary (miles)
Distance from Mouth to
Downstream Segment Boundary
(miles)
Load Allocation for
Effective Shade on August 1
(percent)
53.7 53.4 4%
53.4 53.1 11%
53.1 52.8 9%
52.8 52.5 11%
52.5 52.2 9%
52.2 51.9 11%
51.9 51.6 12%
51.6 51.3 10%
51.3 51.0 19%
51.0 50.6 15%
50.6 50.3 13%
50.3 50.0 10%
50.0 49.7 8%
49.7 49.4 7%
49.4 49.1 17%
49.1 48.8 10%
48.8 48.5 7%
48.5 48.2 14%
48.2 47.8 13%
47.8 47.5 16%
47.5 47.2 12%
47.2 46.9 13%
46.9 46.6 13%
46.6 46.3 10%
46.3 46.0 11%
46.0 45.7 21%
45.7 45.4 13%
45.4 45.0 16%
45.0 44.7 15%
44.7 44.4 10%
44.4 44.1 13%

Page C- 2 Wenatchee Watershed TMDL for Temperature
Distance from Mouth to Upstream
Segment Boundary (miles)
Distance from Mouth to
Downstream Segment Boundary
(miles)
Load Allocation for
Effective Shade on August 1
(percent)
44.1 43.8 12%
43.8 43.5 17%
43.5 43.2 10%
43.2 42.9 10%
42.9 42.6 11%
42.6 42.3 8%
42.3 41.9 9%
41.9 41.6 13%
41.6 41.3 4%
41.3 41.0 11%
41.0 40.7 8%
40.7 40.4 6%
40.4 40.1 6%
40.1 39.8 4%
39.8 39.5 8%
39.5 39.1 4%
39.1 38.8 8%
38.8 38.5 3%
38.5 38.2 10%
38.2 37.9 15%
37.9 37.6 18%
37.6 37.3 12%
37.3 37.0 19%
37.0 36.7 5%
36.7 36.4 10%
36.4 36.0 18%
36.0 35.7 12%
35.7 35.4 26%
35.4 35.1 12%
35.1 34.8 31%
34.8 34.5 25%
34.5 34.2 22%
34.2 33.9 20%
33.9 33.6 26%
33.6 33.2 23%
33.2 32.9 17%
32.9 32.6 31%
32.6 32.3 31%
32.3 32.0 28%
32.0 31.7 35%
31.7 31.4 27%
31.4 31.1 18%
31.1 30.8 21%
30.8 30.4 20%
30.4 30.1 28%
30.1 29.8 22%

Wenatchee Watershed TMDL for Temperature Page C-3
Distance from Mouth to Upstream
Segment Boundary (miles)
Distance from Mouth to
Downstream Segment Boundary
(miles)
Load Allocation for
Effective Shade on August 1
(percent)
29.8 29.5 25%
29.5 29.2 42%
29.2 28.9 28%
28.9 28.6 42%
28.6 28.3 24%
28.3 28.0 17%
28.0 27.7 32%
27.7 27.3 18%
27.3 27.0 19%
27.0 26.7 18%
26.7 26.4 26%
26.4 26.1 20%
26.1 25.8 21%
25.8 25.5 7%
25.5 25.2 9%
25.2 24.9 5%
24.9 24.5 5%
24.5 24.2 5%
24.2 23.9 4%
23.9 23.6 6%
23.6 23.3 10%
23.3 23.0 9%
23.0 22.7 6%
22.7 22.4 10%
22.4 22.1 8%
22.1 21.7 5%
21.7 21.4 8%
21.4 21.1 8%
21.1 20.8 6%
20.8 20.5 5%
20.5 20.2 8%
20.2 19.9 6%
19.9 19.6 7%
19.6 19.3 6%
19.3 19.0 4%
19.0 18.6 6%
18.6 18.3 6%
18.3 18.0 9%
18.0 17.7 9%
17.7 17.4 8%
17.4 17.1 12%
17.1 16.8 6%
16.8 16.5 9%
16.5 16.2 7%
16.2 15.8 5%
15.8 15.5 5%

Page C- 4 Wenatchee Watershed TMDL for Temperature
Distance from Mouth to Upstream
Segment Boundary (miles)
Distance from Mouth to
Downstream Segment Boundary
(miles)
Load Allocation for
Effective Shade on August 1
(percent)
15.5 15.2 7%
15.2 14.9 3%
14.9 14.6 8%
14.6 14.3 5%
14.3 14.0 7%
14.0 13.7 4%
13.7 13.4 4%
13.4 13.0 5%
13.0 12.7 4%
12.7 12.4 4%
12.4 12.1 4%
12.1 11.8 4%
11.8 11.5 6%
11.5 11.2 5%
11.2 10.9 4%
10.9 10.6 6%
10.6 10.3 9%
10.3 9.9 5%
9.9 9.6 3%
9.6 9.3 3%
9.3 9.0 3%
9.0 8.7 4%
8.7 8.4 5%
8.4 8.1 8%
8.1 7.8 6%
7.8 7.5 8%
7.5 7.1 6%
7.1 6.8 6%
6.8 6.5 4%
6.5 6.2 8%
6.2 5.9 9%
5.9 5.6 7%
5.6 5.3 3%
5.3 5.0 5%
5.0 4.7 4%
4.7 4.3 3%
4.3 4.0 2%
4.0 3.7 2%
3.7 3.4 2%
3.4 3.1 3%
3.1 2.8 3%
2.8 2.5 4%
2.5 2.2 4%
2.2 1.9 4%
1.9 1.6 3%
1.6 1.2 5%

Wenatchee Watershed TMDL for Temperature Page C-5
Distance from Mouth to Upstream
Segment Boundary (miles)
Distance from Mouth to
Downstream Segment Boundary
(miles)
Load Allocation for
Effective Shade on August 1
(percent)
1.2 0.9 6%
0.9 0.6 6%
0.6 0.3 2%
0.3 0.0 2%
Table C2. Load allocations for effective shade in Icicle Creek, outside USFS lands. Targets are based on percent effective shade provided by site potential vegetation. These targets apply to streams outside of USFS managed lands of the Wenatchee National Forest.
Distance from Mouth to Upstream
Segment Boundary (miles)
Distance from Mouth to
Downstream Segment Boundary
(miles)
Load Allocation for
Effective Shade on August 1
(percent)
6.6 6.3 41%
6.3 6.0 43%
6.0 5.7 41%
5.7 5.3 36%
5.3 5.0 27%
5.0 4.7 44%
4.7 4.4 25%
4.4 4.1 37%
4.1 3.8 72%
3.8 3.5 72%
3.5 3.2 56%
3.2 2.9 24%
2.9 2.5 33%
2.5 2.2 44%
2.2 1.9 32%
1.9 1.6 26%
1.6 1.3 42%
1.3 1.0 36%
1.0 0.7 23%
0.7 0.4 31% 0.4 0.0 28%
Table C3. Load allocations for effective shade in Nason Creek, outside USFS lands.
Targets are based on percent effective shade provided by site potential vegetation and applies to streams outside of USFS managed lands of the Wenatchee National Forest
Distance from Mouth to Upstream
Segment Boundary (miles)
Distance from Mouth to
Downstream Segment Boundary
(miles)
Load Allocation for
Effective Shade on August 1
(percent)
26.0 25.7 91%
25.7 25.4 97%
25.4 25.1 93%

Page C- 6 Wenatchee Watershed TMDL for Temperature
Distance from Mouth to Upstream
Segment Boundary (miles)
Distance from Mouth to
Downstream Segment Boundary
(miles)
Load Allocation for
Effective Shade on August 1
(percent)
25.1 24.8 94%
24.8 24.5 90%
24.5 24.2 92%
24.2 23.9 79%
23.9 23.5 69%
23.5 23.2 73%
23.2 22.9 76%
22.9 22.6 77%
22.6 22.3 73%
22.3 22.0 82%
22.0 21.7 50%
21.7 21.4 66%
21.4 21.1 61%
21.1 20.8 74%
20.8 20.4 84%
20.4 20.1 83%
20.1 19.8 83%
19.8 19.5 74%
19.5 19.2 68%
19.2 18.9 63%
18.9 18.6 66%
18.6 18.3 70%
18.3 18.0 50%
18.0 17.6 58%
17.6 17.3 88%
17.3 17.0 87%
17.0 16.7 87%
16.7 16.4 87%
16.4 16.1 72%
16.1 15.8 29%
15.8 15.5 36%
15.5 15.2 33%
15.2 14.9 59%
14.9 14.5 17%
14.5 14.2 19%
14.2 13.9 43%
13.9 13.6 71%
13.6 13.3 69%
13.3 13.0 66%
13.0 12.7 32%
12.7 12.4 27%
12.4 12.1 43%
12.1 11.7 48%
11.7 11.4 48%
11.4 11.1 52%
11.1 10.8 34%

Wenatchee Watershed TMDL for Temperature Page C-7
Distance from Mouth to Upstream
Segment Boundary (miles)
Distance from Mouth to
Downstream Segment Boundary
(miles)
Load Allocation for
Effective Shade on August 1
(percent)
10.8 10.5 32%
10.5 10.2 36%
10.2 9.9 19%
9.9 9.6 42%
9.6 9.3 66%
9.3 8.9 45%
8.9 8.6 44%
8.6 8.3 54%
8.3 8.0 65%
8.0 7.7 48%
7.7 7.4 53%
7.4 7.1 58%
7.1 6.8 52%
6.8 6.5 45%
6.5 6.2 55%
6.2 5.8 42%
5.8 5.5 41%
5.5 5.2 40%
5.2 4.9 54%
4.9 4.6 45%
4.6 4.3 35%
4.3 4.0 42%
4.0 3.7 43%
3.7 3.4 48%
3.4 3.0 44%
3.0 2.7 42%
2.7 2.4 56%
2.4 2.1 60%
2.1 1.8 44%
1.8 1.5 59%
1.5 1.2 67%
1.2 0.9 47%
0.9 0.6 53%
0.6 0.2 54%
0.2 0.0 48%

Page C- 8 Wenatchee Watershed TMDL for Temperature
Table C-4: Loads allocation by channel class, in the Wenatchee River watershed portion of the Wenatchee National Forest (adapted from Table 10, Wenatchee National Forest Water Temperature TMDL Technical Report).
Classification Load Allocation (Site Potential) Effective Shade (%)
Flow (cfs)
W:D (wetted)
Group a Group b Group c M242Ca Wenatchee Highlands
Ca-3C 4 30 46 58 67 Ca-4C 8 35 43 55 63 Ca-5C 16 40 39 51 58 Ca-6C 32 45 33 44 51
M242Cd Cle Elum / Lake Wenatchee Mountain Valleys Cd-1A 1 10 48 61 70 Cd-2B 2 15 47 61 69 Cd-5C 16 40 39 51 58 Cd-6C 32 45 33 44 51
M242Cm Wenatchee / Swauk Sandstone Hills Cm-3C 4 30 46 58 67 Cm-4C 8 35 43 55 63 Cm-5C 16 40 39 51 58
M242Cc Cascade Mountain: Non-glaciated Cc-1A 1 10 48 61 70 Cc-2B 2 15 47 61 69 Cc-4C 8 35 43 55 63 Cc-5C 16 40 39 51 58 Cc-6C 32 45 33 44 51

Wenatchee Watershed TMDL for Temperature Page C-9
Table C-5: Allocations (as percent effective shade) for water bodies within the Wenatchee National Forest included on the 1996 and 1998 303(d) lists for water temperature
Water Body 1996 WBID
Township, Range, Section
Stream Classification
Load Allocation Effective
Shade (%) Little Wenatchee
R. WA-45-
4000 27N,16E,15 Ca-5Cc 58
Table C-6: Load allocations (as percent effective shade) for water bodies where water
temperatures were observed at levels exceeding the 16 C˚ water quality standards in 2001
Stream Name
Township, Range, Section
Stream Classification
TMDL Allocation Effective
Shade (%)
Load Allocation Effective
Shade (%) Little
Wenatchee River
27N, 16E, 18 Ca-5Cc 55 58
Little Wenatchee
River. 27N, 15E, 11 Ca-5Cc 55 58
Little Wenatchee
River. 27N, 15E, 10 Ca-5Cc 55 58
Little Wenatchee
River. 28N, 14E, 36 Ca-4Cc 60 63
Little Wenatchee
River. 28N, 13E, 14 Ca-3Cc 65 67
Lake Creek 28N, 15E, 31 Ca-3Cc 65 67 Chiwawa
River 27N, 17E, 13 Cd-6Ca 50 33
Sand Creek 22N, 18E, 1 Cm-3Cb 65 58 East Fork
Mission Creek 22N, 19E, 18 Cm-4Cb 60 55
Devils Gulch 22N, 19E, 18 Cm-3Cb 65 58

Page C- 10 Wenatchee Watershed TMDL for Temperature
Table C-7: Load allocations for effective shade for miscellaneous perennial streams in the Wenatchee River watershed (from the Wenatchee River Temperature TMDL Study)
Effective Shade from Vegetation (percent)
at the Stream Center at Various Stream Aspects (degrees from N)
Daily Average Global Solar Short-Wave Radiation (W/m2) at the Stream Center at Various Stream Aspects (degrees from N)
Bankfull width (ft)
90 and 270 deg aspect
0 and 180 deg aspect
45, 135, 225 and 315
deg aspect 90 and 270 deg aspect
0 and 180 deg aspect
45, 135, 225 and 315
deg aspect
3.3 97.5% 96.6% 96.9% 8 11 10 6.6 97.4% 96.2% 96.6% 8 12 11 9.8 95.8% 92.6% 93.1% 13 23 22
13.1 94.3% 89.3% 90.0% 18 34 31 16.4 92.8% 86.8% 87.6% 22 42 39 19.7 91.0% 83.7% 84.0% 28 51 50 23.0 86.0% 79.7% 79.8% 44 64 63 26.2 80.1% 75.5% 76.0% 62 77 75 29.5 73.4% 71.6% 72.5% 84 89 86 32.8 66.8% 68.5% 69.3% 104 99 96 39.4 57.9% 62.5% 63.3% 132 118 115 45.9 50.3% 57.7% 58.2% 156 133 131 52.5 44.5% 53.6% 53.8% 174 145 145 59.1 40.0% 50.1% 49.9% 188 157 157 65.6 36.4% 46.9% 46.3% 200 167 168 82.0 29.8% 40.4% 38.9% 220 187 192 98.4 25.2% 35.3% 33.3% 235 203 209
114.8 21.9% 31.2% 29.0% 245 216 222 131.2 19.4% 27.8% 25.7% 253 226 233 147.6 17.4% 25.1% 23.0% 259 235 241 164.0 15.8% 22.8% 20.8% 264 242 248 180.4 14.4% 20.8% 19.0% 268 248 254 196.9 13.3% 19.2% 17.5% 272 253 259 213.3 12.3% 17.8% 16.1% 275 257 263 229.7 11.5% 16.6% 15.1% 277 261 266 246.1 10.8% 15.5% 14.0% 279 265 269 262.5 10.1% 14.5% 13.2% 281 268 272 278.9 9.5% 13.7% 12.4% 283 270 274 295.3 9.0% 12.9% 11.8% 285 272 276 311.7 8.6% 12.2% 11.2% 286 274 278 328.1 8.2% 11.6% 10.6% 287 276 280 360.9 7.4% 10.6% 9.7% 289 279 282 393.7 6.8% 9.7% 8.8% 291 282 284 426.5 6.3% 8.9% 8.2% 292 284 286 459.3 5.9% 8.3% 7.6% 293 286 288 492.1 5.5% 7.7% 7.1% 294 287 289 524.9 5.2% 7.2% 6.6% 295 288 290 557.7 4.9% 6.8% 6.2% 296 289 291 590.6 4.6% 6.4% 5.9% 296 290 292 623.4 4.3% 6.0% 5.6% 296 291 293 656.2 4.1% 5.7% 5.3% 297 292 293 689.0 3.9% 5.5% 5.1% 297 292 293

Wenatchee Watershed TMDL for Temperature Page C-11
Effective Shade from Vegetation (percent)
at the Stream Center at Various Stream Aspects (degrees from N)
Daily Average Global Solar Short-Wave Radiation (W/m2) at the Stream Center at Various Stream Aspects (degrees from N)
Bankfull width (ft)
90 and 270 deg aspect
0 and 180 deg aspect
45, 135, 225 and 315
deg aspect 90 and 270 deg aspect
0 and 180 deg aspect
45, 135, 225 and 315
deg aspect
721.8 3.8% 5.2% 4.8% 297 292 294 754.6 3.6% 5.0% 4.6% 297 293 294 787.4 3.4% 4.8% 4.4% 298 293 295 820.2 3.3% 4.6% 4.2% 298 294 295 853.0 3.2% 4.4% 4.1% 298 295 296 885.8 3.1% 4.2% 3.9% 299 295 296 918.6 3.0% 4.1% 3.8% 299 295 296 984.3 2.8% 3.8% 3.5% 300 296 297

Page C- 12 Wenatchee Watershed TMDL for Temperature

Wenatchee Watershed TMDL for Temperature Page D-1
Appendix D: Public Participation, Media Coverage
Ecology began working with the WWPU and the WQTS in 2001. Since that time, numerous activities have taken place involving public participation and media coverage. Associated news articles, news releases, and public notice advertisements are available upon request.

Wenatchee Watershed TMDL for Temperature-Draft Page D-2

Wenatchee Watershed TMDL for Temperature Page E-1
Appendix E: Responsiveness Summary The public comment period for this TMDL was open from May 23, 2007 through June 22, 2007. Ecology received one comment during the public comment period. It is presented below along with Ecology’s response. How are global warming impacts on water temperatures addressed in our efforts to provide ideal water temperature for wildlife in the local watershed? Ecology added a section to this report titled “Climate Change”. The text of this section begins on page 8.


![The Wenatchee daily world (Wenatchee, Wash.) 1905-12-21 [p ] · 2017-12-19 · WENATCHEE DAILY WORLD VOLUME I.?NO. 148. WENATCHEE, WASHINGTON, THURSDAY DECEMBER 21, 1905 FIVE CENTS](https://static.documents.pub/doc/80x56/5e73fee8a5ab0e10fd262838/the-wenatchee-daily-world-wenatchee-wash-1905-12-21-p-2017-12-19-wenatchee.jpg)


