99
WEST VIRGINIA TEACHERS DEFINED CONTRIBUTION PLAN QUARTERLY INVESTMENT REVIEW September 30, 2014

WEST VIRGINIA TEACHERS DEFINED CONTRIBUTION PLAN
QUARTERLY INVESTMENT REVIEW September 30, 2014
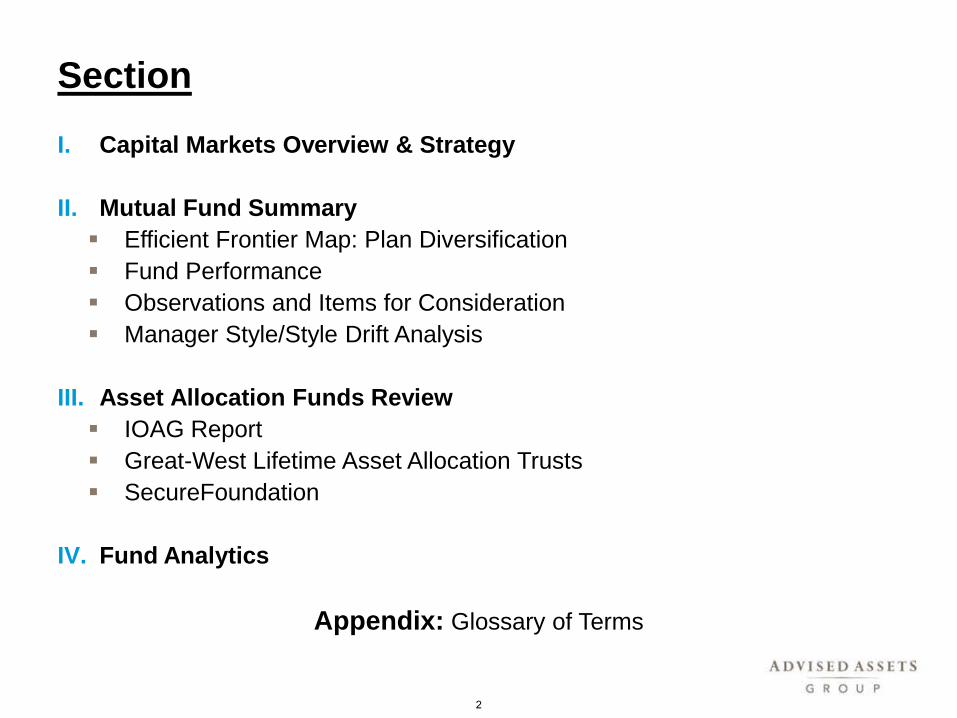
Section
I. Capital Markets Overview & Strategy
II. Mutual Fund Summary Efficient Frontier Map: Plan Diversification Fund Performance Observations and Items for Consideration Manager Style/Style Drift Analysis
III. Asset Allocation Funds Review IOAG Report Great-West Lifetime Asset Allocation Trusts SecureFoundation
IV. Fund Analytics
Appendix: Glossary of Terms
2
Great-West Financial
Capital Markets Overview & Strategy
Third Quarter, 2014

Table of Contents
1. Summary 2. Global Economy 3. U.S. Economy 4. Market Performance & Outlook
CONFIDENTIALITY NOTICE: All material presented is compiled from sources believed to be reliable and current, but accuracy cannot be guaranteed. This publication may contain confidential and proprietary information of GW Capital Management, LLC. Circulation, disclosure, or dissemination of all or any part of this material to any unauthorized persons is prohibited. This perspective was prepared for the Great-West Funds, Inc. Board of Directors only. GW Capital Management, LLC makes no representation or warranties as to the accuracy or merit of this analysis for individual use. Any comments or general market related projections are based on information available at the time of writing and believed to be accurate; are for informational purposes only, are not intended as individual or specific advice, may not represent the opinions of the entire firm and may not be relied upon for future investing.
4

Global Economy
5
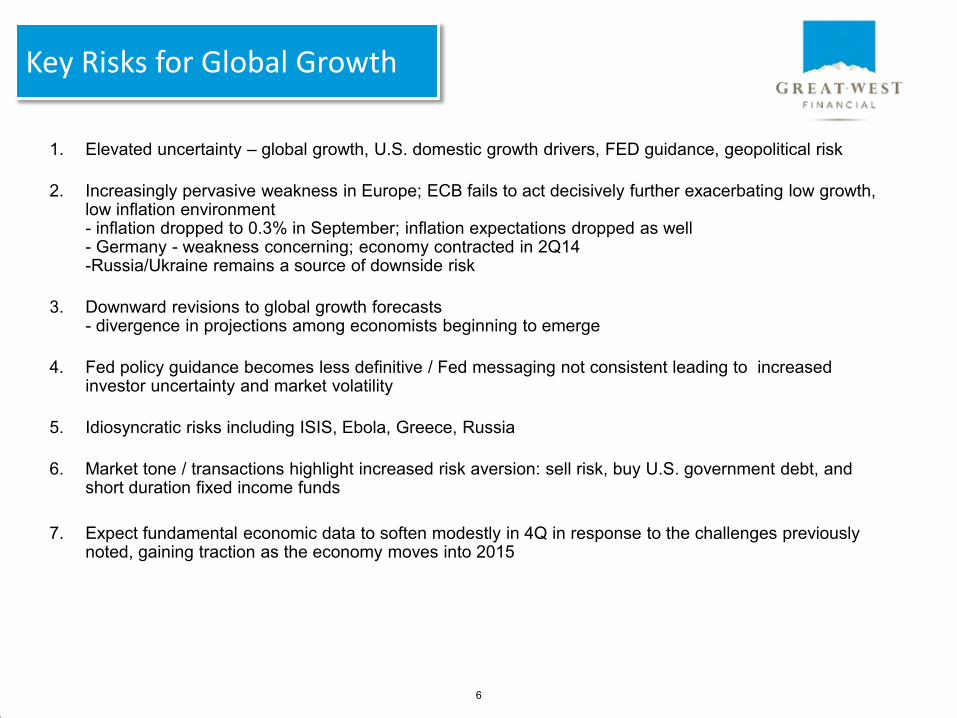
Key Risks for Global Growth
1. Elevated uncertainty – global growth, U.S. domestic growth drivers, FED guidance, geopolitical risk
2. Increasingly pervasive weakness in Europe; ECB fails to act decisively further exacerbating low growth, low inflation environment - inflation dropped to 0.3% in September; inflation expectations dropped as well - Germany - weakness concerning; economy contracted in 2Q14 -Russia/Ukraine remains a source of downside risk
3. Downward revisions to global growth forecasts - divergence in projections among economists beginning to emerge
4. Fed policy guidance becomes less definitive / Fed messaging not consistent leading to increased investor uncertainty and market volatility
5. Idiosyncratic risks including ISIS, Ebola, Greece, Russia
6. Market tone / transactions highlight increased risk aversion: sell risk, buy U.S. government debt, and short duration fixed income funds
7. Expect fundamental economic data to soften modestly in 4Q in response to the challenges previously noted, gaining traction as the economy moves into 2015
6

Global Economy: Current State & Expectations
Source: Citigroup, CIA World Factbook
Global growth concerns: - Eurozone: struggling – ECB strategy discussions include expanding its balance sheet via asset purchases - strong opposition in Germany to reflationary ECB policies; economic activity in Germany slowing - China, and other emerging markets continue to slow - Japan slowing - UK growth ok – consumer spending led - U.S. expansion broader; making modest gains; most recent data are mixed - IMF downgrades global growth projection for 2014 and 2015 to 3.3% and 3.8% from 3.4% and 4.0% respectively - global inflation rates low and generally moving lower - volatility increasing
8.5%
4.0%
14.8%
24.0%
27.7%
-5.0
0.0
5.0
10.0
15.0
20.0
25.0
30.0
-2.5
0.0
2.5
5.0
7.5
10.0
08/65 08/72 08/79 08/86 08/93 08/00 08/07 08/14
(Ann. %)(Ann. %)Global Inflation Rates Canada Left Axis
UK Left Axis
EURO Left Axis
US Rt Axis
China Rt Axis
Japan Rt Axis
-10.00-7.50-5.00-2.500.002.505.007.50
10.0012.5015.0017.5020.00
1965 1973 1981 1989 1997 2005 2013
Real GDP (ann %) China GermanyEuropean Union United KingdomJapan United StatesWorld
7
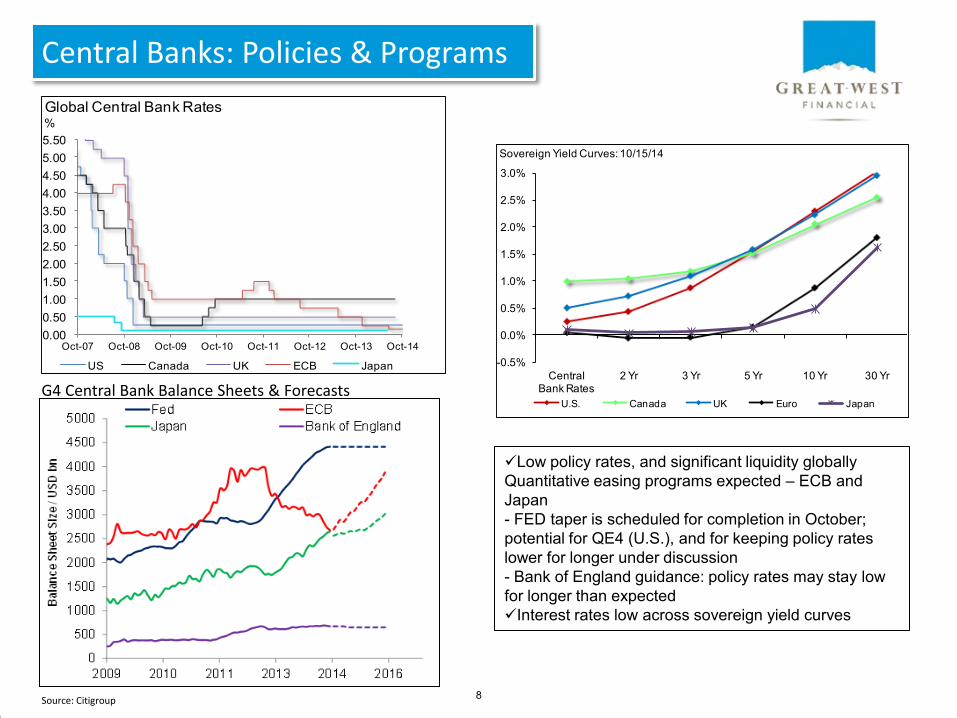
Central Banks: Policies & Programs
G4 Central Bank Balance Sheets & Forecasts
Source: Citigroup
0.000.501.001.502.002.503.003.504.004.505.005.50
Oct-07 Oct-08 Oct-09 Oct-10 Oct-11 Oct-12 Oct-13 Oct-14
%Global Central Bank Rates
US Canada UK ECB Japan -0.5%
0.0%
0.5%
1.0%
1.5%
2.0%
2.5%
3.0%
Central Bank Rates
2 Yr 3 Yr 5 Yr 10 Yr 30 Yr
Sovereign Yield Curves: 10/15/14
U.S. Canada UK Euro Japan
Low policy rates, and significant liquidity globally Quantitative easing programs expected – ECB and Japan - FED taper is scheduled for completion in October; potential for QE4 (U.S.), and for keeping policy rates lower for longer under discussion - Bank of England guidance: policy rates may stay low for longer than expected Interest rates low across sovereign yield curves
8

Regional Leading Economic Indicators
Source: IMF World Economic Outlook
10152025Leading Economic Indicators
35
40
45
50
55
60
65
Aug-12 Dec-12 Apr-13 Aug-13 Dec-13 Apr-14 Aug-14
% change YoYPurchasing Manager's Index
US CANADA
EUROZONE GERMANY
IRELAND UK
CHINA
-30
-20
-10
0
10
20
30
Sep-93 Sep-96 Sep-99 Sep-02 Sep-05 Sep-08 Sep-11 Sep-14
% chge yoy
Index of Leading Economic Indicators
UK Canada Ireland
Germany China Eurozone
U.S.
9

U.S. Economy
10

Quarterly Macroeconomic Summary
2013 Q1 Q2 Q3 10/17/14
Fed Funds (at qtr end) 0.25% 0.25% 0.25% 0.25% 0.25%
5 yr U.S. Treasury Yield (at qtr end) 1.74% 1.72% 1.63% 1.76% 1.42%
10 yr U.S. Treasury Yield (at qtr end) 3.03% 2.72% 2.53% 2.49% 2.19%
Benchmark "A" Intermediate Spread (10yr) (at qtr end) 0.90% 0.86% 0.82% 0.90% 0.98%
S&P 500 (at qtr end) 1,848.36 1,872.34 1,960.23 1,972.29 1,886.76
Operating EPS (at qtr end) $107.3 $118.4 $118.4 $118.4 $118.4E
P/E (at qtr end) 17.23 15.81 16.56 16.66 15.94E
Real GDP (annual) 2.20%
Real GDP (qtr over previous qtr annualized) -2.10% 4.60%
Real Consumer Spending (yoy) 2.70%
Real Consumer Spending (qtr over previous qtr annualized) 1.20% 2.50%
Payroll Employment (ytd) 2,331,000 2,040,000
Unemployment Rate (at qtr end) 6.70% 6.70% 6.10% 5.90% 5.90%
Business Fixed Investment (yoy) 3.00%
Business Fixed Investment (qtr over previous qtr annualized) 1.60% 8.40%
Wage Inflation (ECI yoy) 2.00%
Wage Inflation (ECI qtr over previous qtr annualized) 1.61% 2.83%
CPI (yoy) 1.50%
CPI (qtr over previous qtr annualized) 1.90% 3.00%
Core CPI (yoy) 1.70%
Core CPI (qtr over previous qtr annualized) 1.60% 2.50%
Core PCE Deflator (yoy) 1.34%
Core PCE Deflator (qtr over previous qtr annualized) 1.20% 2.00%
EUR/USD (at qtr end) 1.374 1.377 1.369 1.263 1.276
CAD/USD (at qtr end) 0.941 0.905 0.937 0.893 0.887
Oil (per barrel) (at qtr end) $98.42 $101.58 $105.37 $91.16 $82.75
Gold (per ounce) (at qtr end) $1,205.65 $1,284.00 $1,327.32 $1,208.16 $1,238.32
2014
11

Source: Bloomberg
U.S. Economy: Current State & Expectations
0.1%
2.7%
1.8%
4.5%
3.5%
- 2.1%
4.6%
3.0%E 3.0%E
-2.5%
-1.5%
-0.5%
0.5%
1.5%
2.5%
3.5%
4.5%
5.5%
Dec-12 Mar-13 Jun-13 Sep-13 Dec-13 Mar-14 Jun-14 Sep-14 Dec-14
Real GDP Growth(Qtr/Qtr Annualized)
U.S. growth resumes following 1Q14 ‘stall’ - ok growth, low inflation - domestic demand, consumption and business investment picking up modestly - 3%+ real growth projections for 3Q & 4Q align with job creation of 200k per month; ytd through September jobs added have averaged 226,667/month (2.04 mln) - job creation is relatively broad based; gains in professional and business services, health care, leisure and hospitality, retail trade and construction - inflation contained; price indices and wage pressures generally subdued
1.8%
-0.3%
-2.8%
2.5%
1.6%
2.3% 2.2% 2.3% E
3.0% E
-4.0
-3.0
-2.0
-1.0
0.0
1.0
2.0
3.0
4.0
2007 2008 2009 2010 2011 2012 2013 2014 2015
Real GDP Growth(Annual % Chge )
14.8%
1.7%
-5.0
-2.5
0.0
2.5
5.0
7.5
10.0
12.5
15.0
08/65 08/72 08/79 08/86 08/93 08/00 08/07 08/14
(Ann. %)U.S. Consumer Price Index
12
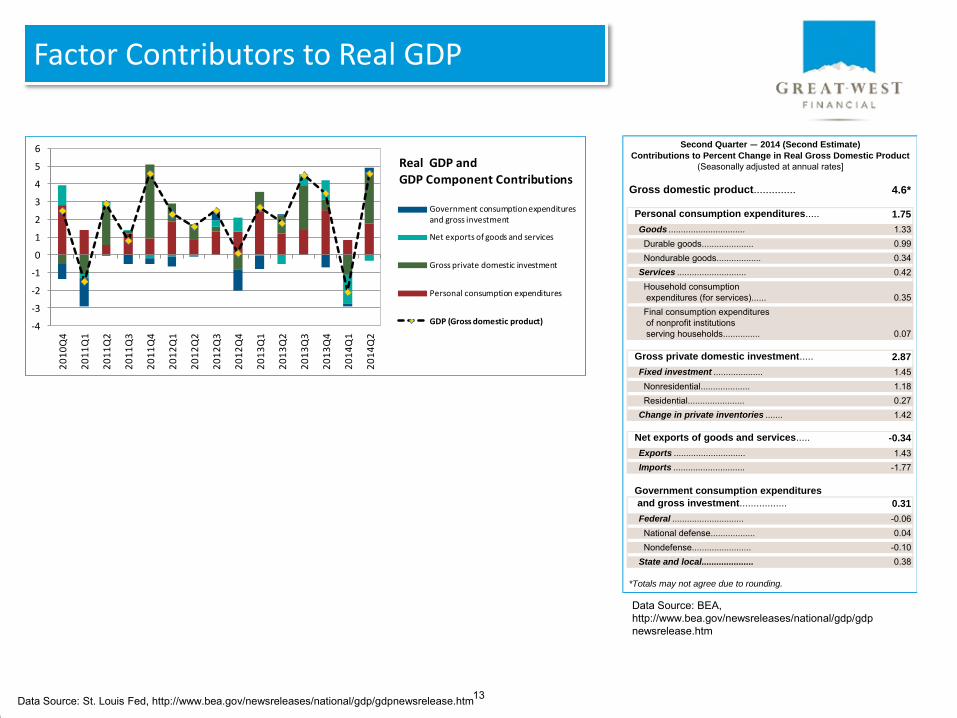
Data Source: St. Louis Fed, http://www.bea.gov/newsreleases/national/gdp/gdpnewsrelease.htm
Data Source: BEA, http://www.bea.gov/newsreleases/national/gdp/gdpnewsrelease.htm
-4
-3
-2
-1
0
1
2
3
4
5
6
20
10
Q4
20
11
Q1
20
11
Q2
20
11
Q3
20
11
Q4
20
12
Q1
20
12
Q2
20
12
Q3
20
12
Q4
20
13
Q1
20
13
Q2
20
13
Q3
20
13
Q4
20
14
Q1
20
14
Q2
Government consumption expenditures and gross investment
Net exports of goods and services
Gross private domestic investment
Personal consumption expenditures
GDP (Gross domestic product)
Real GDP and
GDP Component Contributions Gross domestic product.............. 4.6* Personal consumption expenditures..... 1.75 Goods ............................... 1.33 Durable goods..................... 0.99 Nondurable goods.................. 0.34 Services ............................ 0.42 Household consumption expenditures (for services)...... 0.35 Final consumption expenditures of nonprofit institutions serving households............... 0.07 Gross private domestic investment..... 2.87 Fixed investment .................... 1.45 Nonresidential.................... 1.18 Residential....................... 0.27 Change in private inventories ....... 1.42 Net exports of goods and services..... -0.34 Exports ............................. 1.43 Imports ............................. -1.77 Government consumption expenditures
and gross investment................. 0.31 Federal ............................. -0.06 National defense.................. 0.04 Nondefense........................ -0.10 State and local..................... 0.38
*Totals may not agree due to rounding.
Second Quarter — 2014 (Second Estimate)
Contributions to Percent Change in Real Gross Domestic Product
(Seasonally adjusted at annual rates]
Factor Contributors to Real GDP
13

Money Supply and the Velocity of Money
Velocity of M2
Calculated as the ratio of quarterly nominal GDP to the quarterly average of M2 money stock. The velocity of money is the frequency at which one unit of currency is used to purchase domestically- produced goods and services within a given time period. In other words, it is the number of times one dollar is spent to buy goods and services per unit of time. If the velocity of money is increasing, then more transactions are occurring between individuals in an economy.
Data Source: St. Louis Fed, http://research.stlouisfed.org/fred2/series/M2V and http://research.stlouisfed.org/fred2/series/M2
*M2 includes a broader set of financial assets held principally by households. M2 consists of M1** plus: (1) savings deposits (which include money market deposit accounts, or MMDAs); (2) small-denomination time deposits (time deposits in amounts of less than $100,000); and (3) balances in retail money market mutual funds (MMMFs). Seasonally adjusted M2 is computed by summing savings deposits, small-denomination time deposits, and retail MMMFs, each seasonally adjusted separately, and adding this result to seasonally adjusted M1. **M1 includes funds that are readily accessible for spending. M1 consists of: (1) currency outside the U.S. Treasury, Federal Reserve Banks, and the vaults of depository institutions; (2) traveler's checks of nonbank issuers; (3) demand deposits; and (4) other checkable deposits (OCDs), which consist primarily of negotiable order of withdrawal (NOW) accounts at depository institutions and credit union share draft accounts. Seasonally adjusted M1 is calculated by summing currency, traveler's checks, demand deposits, and OCDs, each seasonally adjusted separately.
Data Source: St. Louis Fed, http://research.stlouisfed.org/fred2/series/M2 and http://research.stlouisfed.org/fred2/series/M1
Data Source: St. Louis Fed, http://research.stlouisfed.org/fred2/series/M2V
1.5
1.6
1.7
1.8
1.9
2
2.1
2.2
2.3
0
2000
4000
6000
8000
10000
12000
14000
1981 1985 1990 1995 2000 2004 2009 2014
Rat
io
Bill
ion
s o
f D
olla
rs
Source: Board of Governors of the Federal Reserve System/Federal Reserve Bank of St. Louis/FRED
M2 Money Stock* and Velocity of M2
M2 Money Stock
Velocity of M2 (Right Axis)
14

Source: Bloomberg , Barclays Live, BLS
U.S.: Interest Rate & Inflation Data
-2.5
-0.5
1.5
3.5
5.5
7.5
9.5
11.5
13.5
15.5
17.5
0.0
2.0
4.0
6.0
8.0
10.0
12.0
14.0
16.0
18.0
Jan-62 Jan-75 Jan-88 Jan-01 Jan-14
PercentP
erce
nt
10 yr. US Treasury vs. CPI
US Treasury - left axis
CPI - rt axis
U.S.
Treasury 10/9/2014
TIPs Inflation
Expectations
Current Real
Returns
1926-2013
Historical Govt
Annual Real
Returns1
3 yr 0.91% 1.3% -0.44% 0.5% (T-Bills)
5 yr 1.56% 1.7% -0.11% 2.3% (Int)
10 yr 2.31% 2.0% 0.35% 2.5% (L.T.)
30 yr 3.05% 2.1% 0.94% 2.5% (L.T.)1 Source: Ibbotson SBBI
1.7%
2.22%
Historical relationship between real yields and inflation isn’t holding up re: FED asset purchases
15

Inflation: Contained
Source: BLS
0
25
50
75
100
125
150
-8.0
-6.0
-4.0
-2.0
0.0
2.0
4.0
6.0
8.0
Dec-99 Nov-02 Oct-05 Sep-08 Aug-11 Jul-14
(% Chge Yr/Yr)
Consumer Conf idence & Spending
Real Consumer Spending - left axis
Confidence - rt axis
10
20
30
40
50
60
70
80
90
100
Sep-00 Sep-02 Sep-04 Sep-06 Sep-08 Sep-10 Sep-12 Sep-14
Index LevelManufacturing Index
Purchasing Manager's Index New OrdersBack Orders Prices
0
2
4
6
8
10
-40.0
-30.0
-20.0
-10.0
0.0
10.0
20.0
1Q00 4Q01 3Q03 2Q05 1Q07 4Q08 3Q10 2Q12 1Q14
Index% chge qoqBusiness Confidence & Spending
Spending - lef t axis CEO Conf idence - rt axis
78.8
65
70
75
80
85
Aug-06 Aug-07 Aug-08 Aug-09 Aug-10 Aug-11 Aug-12 Aug-13 Aug-14
Manufacturing Capacity Utilization
Inflation was at 3.5% the last time capacity utilization was at 79%
Prices paid
Modest demand
16

Source: Bloomberg
-40.0%
-30.0%
-20.0%
-10.0%
0.0%
10.0%
20.0%
30.0%
40.0%
Aug-65 Aug-72 Aug-79 Aug-86 Aug-93 Aug-00 Aug-07 Aug-14
(% chge yoy)Energy Inflation
Inflation: Contained
8.07%
172.33
-20.0%
-15.0%
-10.0%
-5.0%
0.0%
5.0%
10.0%
15.0%
20.0%
100
125
150
175
200
225
Jul-00 Jul-02 Jul-04 Jul-06 Jul-08 Jul-10 Jul-12 Jul-14
Index LevelCase Shiller 20 City Home Price Index
Index Level - left axis YOY % Change - rt axis
Debt-fueled housing bubble
206.4
+0.40%
0.01.02.03.04.05.06.07.08.09.0
10.0
Jan-65 Jan-72 Jan-79 Jan-86 Jan-93 Jan-00 Jan-07 Jan-14
(% chge yoy)US Avg Hourly Earnings
+2.5%
-10.0%
-5.0%
0.0%
5.0%
10.0%
15.0%
20.0%
Aug-65 Aug-72 Aug-79 Aug-86 Aug-93 Aug-00 Aug-07 Aug-14
(% chge yoy)Food Inflation
+2.6%
17

Inflation Expectations: Contained
Percent Percent
Source: Federal Reserve Board 18
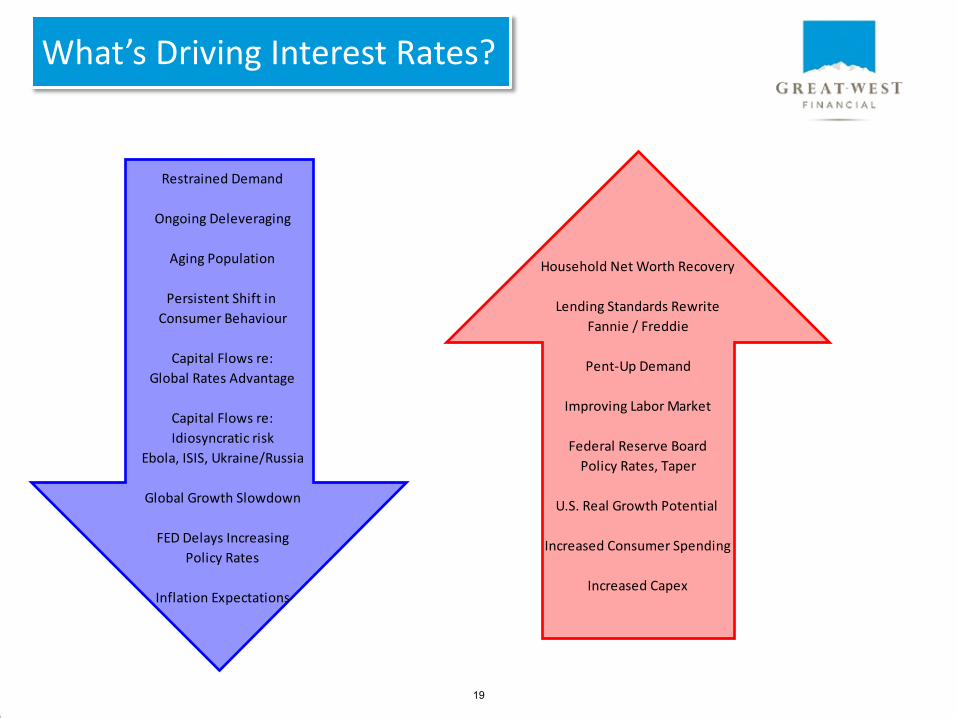
What’s Driving Interest Rates?
Restrained Demand
Ongoing Deleveraging
Aging Population
Persistent Shift in
Consumer Behaviour
Capital Flows re:
Global Rates Advantage
Capital Flows re:
Idiosyncratic risk
Ebola, ISIS, Ukraine/Russia
Global Growth Slowdown
FED Delays Increasing
Policy Rates
Inflation Expectations
Household Net Worth Recovery
Lending Standards Rewrite
Fannie / Freddie
Pent-Up Demand
Improving Labor Market
Federal Reserve Board
Policy Rates, Taper
U.S. Real Growth Potential
Increased Consumer Spending
Increased Capex
19

Current and Forward Rates
Source: Bloomberg
1.63%
3.03%
2.14%
1.50
1.75
2.00
2.25
2.50
2.75
3.00
Dec-12 Jun-13 Dec-13 Jun-14 Dec-14 Jun-15 Dec-15 Jun-16
%
10 year U.S. Treasury Yields
0.25%0.38%
0.82%1.47%
2.22%
2.97%
1.31%
2.01%
2.32%
2.64% 2.82%
3.30%
0.77%
1.74%
3.03%
3.97%
0.00%
0.50%
1.00%
1.50%
2.00%
2.50%
3.00%
3.50%
4.00%
4.50%
Fed Funds 2 Yr 3 Yr 5 Yr 10 Yr 30 Yr
10/13/2014
6 Mo Fwd
12 Mo Fwd
2 Yr Fwd
12/31/2013
Forward Curves
+106 bps
+163 bps
+150 bps +117 bps
+60 bps +33 bps
2.82% E
The expected trajectory of interest rates is modestly upward sloping
Absolute levels of rates remain historically low
20

Consumer Trends
-30.0%
-20.0%
-10.0%
0.0%
10.0%
20.0%
$35,000
$45,000
$55,000
$65,000
$75,000
$85,000
1Q06 4Q06 3Q07 2Q08 1Q09 4Q09 3Q10 2Q11 1Q12 4Q12 3Q13 2Q14
Consumer Net worth
Net Worth (Billions) YoY % Change in Net Worth
Peak to trough (4Q07-1Q09): - 26.1%Peak to current(4Q07-2Q14): +23.5%
0.0%
2.0%
4.0%
6.0%
8.0%
10.0%
0%
25%
50%
75%
100%
125%
Jun-09 Jun-10 Jun-11 Jun-12 Jun-13 Jun-14
(as % of DPI)Household Debt & Savings
Mortgage Debt % of DPI (left axis)Consumer Credit % of DPI (left axis)Total Debt % of DPI (left axis)Savings Rate (right axis)
0
25
50
75
100
125
150
-8.0
-6.0
-4.0
-2.0
0.0
2.0
4.0
6.0
8.0
Dec-99 Nov-02 Oct-05 Sep-08 Aug-11 Jul-14
(% Chge Yr/Yr)
Consumer Conf idence & Spending
Real Consumer Spending - left axis
Confidence - rt axis
Spending remains modest – 5 years into the recovery Consumer behavior has shifted: hesitant to increase debt levels, hesitant to spend = permanent shift?
Income side of the balance sheet critical for household health – improving Credit growth picking up modestly; discretionary bigger ticket items including remodels, autos - positive
Debt service ratio at a historical low - more than 70% of household debt in mortgages; mostly fixed rate
Source: Bloomberg 21

Labor Market Trends
11.8%
5.9%
0
100,000
200,000
300,000
400,000
500,000
600,000
700,000
2.0%
4.0%
6.0%
8.0%
10.0%
12.0%
14.0%
16.0%
18.0%
20.0%
Sep-04 Sep-06 Sep-08 Sep-10 Sep-12 Sep-14
Unemployment & Underemployment Rates, Claims
Underemployment Rate Unemployment Rate Claims - rt axis
164,000
237,000
274,000
84,000
144,000
222,000
203,000
304,000
229,000
267,000
243,000
180,000
248,000
0
50,000
100,000
150,000
200,000
250,000
300,000
350,000
Sep-13 Dec-13 Mar-14 Jun-14 Sep-14
Number of Jobs Created /month
Source: Bloomberg 22

U.S. Housing Market Trends
20 City
Composite
6.75%
-40%
-30%
-20%
-10%
0%
10%
20%
30%
40%
50%
60%
Jul-04 Jul-05 Jul-06 Jul-07 Jul-08 Jul-09 Jul-10 Jul-11 Jul-12 Jul-13 Jul-14
Case Shiller 20 City Indexyoy % chge
Phoenix Los Angeles San Diego San Francisco Denver
Miami Boston Las Vegas New York Composite - 20
5.6 Mln
2.4 Mln
5.4 Months
2
3
4
5
6
7
8
9
10
11
12
1,000
2,000
3,000
4,000
5,000
6,000
7,000
8,000
9,000
Aug-02 Aug-04 Aug-06 Aug-08 Aug-10 Aug-12 Aug-14
(# of Months)(Thousands)Housing: Supply & Demand
Sales - left axis Inventories - left axis # months supply - rt axis
206.38
172.33
8.07%
-20.0%
-15.0%
-10.0%
-5.0%
0.0%
5.0%
10.0%
15.0%
20.0%
100
125
150
175
200
225
Jul-00 Jul-02 Jul-04 Jul-06 Jul-08 Jul-10 Jul-12 Jul-14
Index LevelCase Shiller 20 City Home Price Index
Index Level - lef t axis YOY % Change - rt axis
Housing market current state: 1) Sentiment up & homebuyer traffic up 2) Consumers ‘plan to buy within 6 months’ up 3) Starts / under construction up 4) Lumber prices flat 5) Pent-up demand; sales trending up modestly 6) Mortgage credit remains tight
Source: Bloomberg 23

Source: Bloomberg
Cash on balance sheet remains high at $2 trillion
Spending skewed to M&A activity vs. fixed investment
Rising capacity utilization and increased manufacturing/production will require increased capital outlays = potential for faster GDP growth
3Q14 earnings growth yoy expected to be +9.0% - companies reported to date +5.7%
Business Trends
10
20
30
40
50
60
70
80
90
100
Sep-00 Sep-02 Sep-04 Sep-06 Sep-08 Sep-10 Sep-12 Sep-14
Index LevelManufacturing Index
Purchasing Manager's Index New OrdersBack Orders Prices
0
2
4
6
8
10
-40.0
-30.0
-20.0
-10.0
0.0
10.0
20.0
1Q00 4Q01 3Q03 2Q05 1Q07 4Q08 3Q10 2Q12 1Q14
Index% chge qoqBusiness Confidence & Spending
Spending - lef t axis CEO Conf idence - rt axis
24

Debt, Deficits and Potential Growth: Government
-5.0
-3.0
-1.0
1.0
3.0
5.0
7.0
9.0
11.0
1990 1995 2000 2005 2010 2015 e
% Annual Federal Deficit as a percent of GDP
0.0
10.0
20.0
30.0
40.0
50.0
60.0
70.0
80.0
1990 1995 2000 2005 2010 2015e
%Accumulated Federal Debt held by the public as a percent of GDP
Significant progress since financial crisis and recession Things to think about: 1) defense budget/spending going forward 2) health-care costs / aging population 3) election
Can a highly levered economy grow? - real risk is burden of interest payments = cost of funding - quality of the balance sheet – can it support growth? - ability to allocate resources to support/grow the economy - typically high leverage is a sign of optimism and growth
Source: CIA World Factbook 25

BASEL III
Master Securities Forward Transaction Agreement (MSFTA) Margin account for forward settled Agency MBS transactions between two counterparties
Congressional Legislation: housing finance reform - several bills introduced into congress over the past many years objective: reduce the government’s exposure to the mortgage market Latest bill: Johnson-Crapo - proposal 1) wind down Fannie and Freddie, 2) create a Federal Mortgage Insurance Corporation that would provide the government guarantee and backstop the system, 3) single security for Agency MBS, all outstanding Fannie and Freddie MBS explicitly guaranteed and 4) the private market would hold an equity position in securities. Update: this bill has not yet made it out of the finance committee
FHA / Fannie / Freddie loosen credit underwriting standards
Impact: minimal currently; expect some spread volatility re: BASEL III
Regulatory Environment
26

Capital Markets
9/30/2014
27

Broad Asset Class Returns
The U.S. stock market, as represented by the S&P 500 Index, posted a gain with a 1.13% return for the quarter ending September 2014. International markets fared worse than the U.S. over the quarter, as the MSCI EAFE Index had a return of -5.83%. Investors in the fixed income markets saw gains in both equity and fixed income as the Barclays (Lehman) US Aggregate Bond Index returned 0.17%. For the one-year period ending September 2014 the U.S. stock market had a return of 19.73%, better than the international equity market returns of 4.70%. Broad investment grade bonds had a one-year return of 3.96%. Over the longer-term, five-year horizon the U.S. stock market has bested international stock markets as the S&P 500 and MSCI EAFE have returned an annualized 15.70% and 7.04%, respectively. Fixed income, represented by the Barclays index, had an annualized return of 4.12%. .
Trailing Returns as of September 2014
Ret
urn
-5
0
5
10
15
20
25
YTD 1 quarter 1 year 3 years 5 years 10 years
Calendar Year Returns as of September 2014
-50%
-40%
-30%
-20%
-10%
0%
10%
20%
30%
40%
2013 2012 2011 2010 2009 2008 2007
S&P 500
MSCI EAFE Index
Barclays Capital U.S. Aggregate
Citigroup 3-month T-bill
YTD 1 quarter 1 year 3 years 5 years 10 years
8.34% 1.13% 19.73% 22.99% 15.70% 8.11%
-0.99% -5.83% 4.70% 14.16% 7.04% 6.80%
4.10% 0.17% 3.96% 2.43% 4.12% 4.62%
0.03% 0.01% 0.04% 0.05% 0.08% 1.51%
S&P 500
MSCI EAFE Index
Barclays Capital U.S. Aggregate
Citigroup 3-month T-bill
2013 2012 2011 2010 2009 2008 2007
32.39% 16.00% 2.11% 15.06% 26.46% -37.00% 5.49%
23.29% 17.90% -11.73% 8.21% 32.46% -43.06% 11.63%
-2.02% 4.21% 7.84% 6.54% 5.93% 5.24% 6.97%
0.05% 0.07% 0.08% 0.13% 0.16% 1.80% 4.74%
S&P 500 MSCI EAFE Index Barclays Capital U.S. Aggregate Citigroup 3-month T-bill
28

Calendar Year Returns as of September 2014
-60%
-40%
-20%
0%
20%
40%
60%
80%
2013 2012 2011 2010 2009 2008 2007
Trailing Returns as of September 2014
Ret
urn
-10
-5
0
5
10
15
20
25
30
YTD 1 quarter 1 year 3 years 5 years 10 years
S&P 500 Sector Returns
Consumer Discretionary
Consumer Staples
Energy
Financials
Health Care
Industrials
Information Technology
Materials
Telecommunication Services
Utilities
YTD 1 quarter 1 year 3 years 5 years 10 years
0.15% -0.72% 10.50% 26.64% 21.39% 9.85%6.96% 1.55% 16.19% 18.32% 15.70% 11.04%3.27% -9.22% 11.40% 16.88% 12.31% 11.11%6.01% 0.74% 16.12% 25.85% 11.47% 1.69%
15.54% 4.70% 26.85% 29.41% 20.20% 11.13%1.22% -2.80% 14.55% 25.40% 17.30% 9.01%
11.55% 3.28% 25.21% 21.88% 15.86% 9.94%6.62% -1.58% 17.75% 22.02% 14.17% 9.65%6.63% 2.15% 14.02% 16.17% 14.02% 8.45%
12.37% -4.83% 15.89% 12.87% 12.52% 9.60%
Consumer Discretionary Consumer Staples Energy Financials Health CareIndustrials Information Technology Materials Telecommunication Services Utilities
Consumer Discretionary
Consumer Staples
Energy
Financials
Health Care
Industrials
Information Technology
Materials
Telecommunication Services
Utilities
2013 2012 2011 2010 2009 2008 2007
44.14% 24.79% 3.88% 30.71% 46.74% -37.57% -11.51%27.53% 10.83% 13.95% 14.70% 15.59% -16.54% 14.06%25.73% 4.01% 2.59% 22.09% 18.17% -37.10% 34.25%32.93% 26.37% -14.25% 15.01% 14.51% -49.15% -16.12%43.03% 19.41% 10.74% 6.13% 21.94% -23.55% 7.80%42.13% 16.98% -1.65% 27.69% 22.27% -40.53% 14.92%30.12% 14.35% 0.78% 13.14% 61.95% -42.87% 14.80%25.06% 17.33% -8.57% 25.27% 52.77% -46.79% 25.98%15.05% 18.73% 4.08% 17.71% 17.88% -36.94% 6.66%15.18% 2.18% 19.05% 7.23% 12.61% -28.21% 17.28%
During the quarter ending September 30, 2014 the best-performing U.S. Sector was Health Care with a return of 4.70%, followed by Information Technology and Telecommunication with returns of 3.28% and 2.15%, respectively. The worst-performing sectors were Energy (-9.22%), Utilities (-4.83%), and Industrials (-2.80%). The winningest sector over the last year was Health Care with a one-year return of 26.85%. Information Technology came in second place with a return of 25.21%, and Materials was good enough for third with a one-year return of 17.75%. The sector to avoid over the last twelve months was Consumer Discretionary with a 10.50% return, followed by Energy (11.40%) and Telecommunication (14.02%). Over the last five years through September 30, 2014 Consumer Discretionary with an annualized return of 21.39% lead the way, followed by Health Care (20.20%) and Industrials (17.30%). Of the ten broad economic sectors tracked by the S&P GIC indices, Financials did the worst (11.47%), with Energy (12.31%) and Utilities (12.52%) rounding out the bottom three. 29

Calendar Year Returns as of September 2014
-60%
-40%
-20%
0%
20%
40%
60%
80%
2013 2012 2011 2010 2009 2008 2007
Trailing Returns as of September 2014
Ret
urn
-5
0
5
10
15
20
25
YTD 1 quarter 1 year 3 years 5 years 10 years
Global Returns
S&P 500
MSCI EAFE Index
MSCI Emerging Markets
YTD 1 quarter 1 year 3 years 5 years 10 years
8.34% 1.13% 19.73% 22.99% 15.70% 8.11%
-0.99% -5.83% 4.70% 14.16% 7.04% 6.80%
2.75% -3.36% 4.66% 7.56% 4.76% 11.03%
S&P 500 MSCI EAFE Index MSCI Emerging Markets
S&P 500
MSCI EAFE Index
MSCI Emerging Markets
2013 2012 2011 2010 2009 2008 2007
32.39% 16.00% 2.11% 15.06% 26.46% -37.00% 5.49%
23.29% 17.90% -11.73% 8.21% 32.46% -43.06% 11.63%
-2.27% 18.63% -18.17% 19.20% 79.02% -53.18% 39.78%
The U.S. equity markets had a one-quarter return of 1.13%, whereas the developed international equity markets had a return of -5.83%. The MSCI Emerging Markets Index posted a quarterly return of -3.36%, worse than the U.S.'s S&P 500 Index and better than the MSCI EAFE return. The frequently volatile MSCI Emerging Markets Index had a one-year return of 4.66%, in contrast to the giant market of the U.S. (a one year return of 19.73%) and developed, non-U.S. countries of the MSCI EAFE (one year return of 4.70%). Over the longer-term, five-year window the annualized 15.70% return of US markets bested the markets of other developed, international economies (7.04%) and bested the returns of the world's emerging markets (4.76%). Across the globe international developed markets outperformed emerging markets.
30

Calendar Year Returns as of September 2014
-60%
-40%
-20%
0%
20%
40%
60%
80%
2013 2012 2011 2010 2009 2008 2007
Trailing Returns as of September 2014
Ret
urn
-10
-5
0
5
10
15
20
YTD 1 quarter 1 year 3 years 5 years 10 years
MSCI EAFE Country Returns (Largest Developed Markets)
UNITED KINGDOM
JAPAN
FRANCE
SWITZERLAND
GERMANY
AUSTRALIA
EUROPE ex UK
YTD 1 quarter 1 year 3 years 5 years 10 years
-1.17% -6.05% 6.16% 14.49% 9.31% 6.35%
-1.36% -2.19% 0.93% 9.39% 5.60% 3.96%
-3.36% -8.33% 2.60% 15.92% 4.71% 6.32%
2.95% -4.40% 7.35% 18.43% 11.92% 10.58%
-9.40% -11.17% 2.62% 18.10% 7.88% 9.23%
0.35% -7.92% -0.48% 11.25% 6.59% 10.90%
-1.57% -7.41% 6.48% 17.13% 6.69% 7.73%
MSCI UNITED KINGDOM MSCI JAPAN MSCI FRANCE MSCI SWITZERLANDMSCI GERMANY MSCI AUSTRALIA MSCI EUROPE ex UK
UNITED KINGDOM
JAPAN
FRANCE
SWITZERLAND
GERMANY
AUSTRALIA
EUROPE ex UK
2013 2012 2011 2010 2009 2008 2007
20.71% 15.30% -2.52% 8.80% 43.37% -48.32% 8.39%
27.35% 8.36% -14.19% 15.59% 6.39% -29.11% -4.14%
27.66% 22.82% -16.00% -3.23% 33.26% -42.71% 14.03%
27.56% 21.47% -6.05% 12.86% 26.61% -29.90% 6.06%
32.40% 32.10% -17.45% 9.32% 26.56% -45.50% 35.93%
4.34% 22.30% -10.79% 14.73% 76.77% -49.96% 29.79%
28.74% 22.54% -14.49% 2.44% 33.94% -45.04% 17.46%
Looking at the developed, non-U.S. markets over the most recent quarter, the United Kingdom had a return of -6.05%, superior to the returns of -7.41% across the English Channel. On the other side of the globe the Japanese markets posted negative returns of -2.19%. The UK's one-year return through September 30, 2014 was 6.16% and its five-year average annualized return 9.31%, while for developed Europe (ex-UK) the numbers were 6.48% and 6.69%. Japan's 0.93% one-year return was below its five year average of 5.60%.
31

Calendar Year Returns as of September 2014
-100%
-50%
0%
50%
100%
150%
2013 2012 2011 2010 2009 2008 2007
Trailing Returns as of September 2014
Ret
urn
-20
-10
0
10
20
30
40
YTD 1 quarter 1 year 3 years 5 years 10 years
MSCI Emerging Markets Country Returns (Largest Markets)
CHINA
SOUTH KOREA
TAIWAN
BRAZIL
SOUTH AFRICA
INDIA
RUSSIA
YTD 1 quarter 1 year 3 years 5 years 10 years
1.02% 1.53% 4.86% 11.80% 3.95% 13.03%
-3.28% -7.26% 0.62% 9.04% 7.04% 11.31%
8.22% -3.01% 12.91% 11.67% 8.16% 7.92%
1.23% -8.58% -4.31% -2.33% -4.13% 13.83%
2.59% -6.50% 5.07% 7.16% 7.65% 11.39%
24.71% 2.34% 37.61% 9.02% 4.34% 13.98%
-19.46% -15.07% -19.18% -0.28% -0.12% 4.44%
MSCI CHINA MSCI KOREA MSCI TAIWAN MSCI BRAZIL MSCI SOUTH AFRICA MSCI INDIA MSCI RUSSIA
CHINA
SOUTH KOREA
TAIWAN
BRAZIL
SOUTH AFRICA
INDIA
RUSSIA
2013 2012 2011 2010 2009 2008 2007
3.96% 23.10% -18.24% 4.83% 62.63% -50.83% 66.23%
4.18% 21.48% -11.76% 27.15% 72.06% -55.07% 32.58%
9.77% 17.66% -20.15% 22.73% 80.25% -45.88% 9.13%
-15.79% 0.34% -21.59% 6.81% 128.62% -56.06% 79.99%
-5.78% 19.01% -14.36% 34.21% 57.82% -37.89% 18.14%
-3.83% 25.97% -37.17% 20.95% 102.81% -64.63% 73.11%
1.35% 14.39% -19.30% 19.40% 104.91% -73.83% 24.79%
Among the larger emerging markets countries, the best performing index for the quarter ending September 30, 2014 was the MSCI INDIA with a return of 2.34%. These markets are usually volatile; the three country indexes with the highest the one year returns were MSCI INDIA (37.61%), MSCI TAIWAN (12.91%), and MSCI SOUTH AFRICA (5.07%). If one is an investor who can stomach the volatility, the best five-year returns were posted by MSCI TAIWAN with an annualized rate of return of 8.16%.
32

Calendar Year Returns as of September 2014
-30%
-20%
-10%
0%
10%
20%
30%
40%
50%
60%
2013 2012 2011 2010 2009 2008 2007
Trailing Returns as of September 2014
Ret
urn
-6
-4
-2
0
2
4
6
8
10
12
YTD 1 quarter 1 year 3 years 5 years 10 years
Fixed Income Returns (Issuers)
U.S. Treasury: U.S. TIPS
USBIG Treasury
U.S. Government: Intermediate
Intermediate U.S. High Yield
U.S. Intermediate Credit
Non-USD WorldBIG
U.S. Aggregate
YTD 1 quarter 1 year 3 years 5 years 10 years
3.67% -2.04% 1.59% 1.34% 4.48% 4.64%
2.96% 0.33% 2.22% 1.01% 3.19% 4.20%
1.56% 0.02% 1.14% 0.90% 2.50% 3.68%
3.01% -1.95% 6.64% 10.80% 10.18% 8.01%
3.34% -0.11% 4.04% 4.09% 5.17% 4.88%
-0.18% -5.42% -0.48% 0.32% 1.47% 4.22%
4.10% 0.17% 3.96% 2.43% 4.12% 4.62%
Barclays U.S. Treasury: U.S. TIPS Citigroup USBIG Treasury Barclays U.S. Government: Intermediate Barclays Intermediate U.S. High YieldBarclays U.S. Intermediate Credit Citigroup Non-USD WorldBIG Barclays Capital U.S. Aggregate
U.S. Treasury: U.S. TIPS
USBIG Treasury
U.S. Government: Intermediate
Intermediate U.S. High Yield
U.S. Intermediate Credit
Non-USD WorldBIG
U.S. Aggregate
2013 2012 2011 2010 2009 2008 2007
-8.61% 6.98% 13.56% 6.31% 11.41% -2.35% 11.63%
-2.65% 1.97% 9.61% 5.81% -3.69% 13.89% 9.00%
-1.25% 1.73% 6.08% 4.98% -0.32% 10.43% 8.47%
7.57% 15.19% 4.79% 14.47% 55.73% -25.52% 2.04%
-0.17% 8.10% 5.37% 7.76% 15.93% -2.76% 5.60%
-2.00% 4.14% 4.18% 3.16% 6.84% 6.48% 11.47%
-2.02% 4.21% 7.84% 6.54% 5.93% 5.24% 6.97%
For the quarter ending September 30, 2014, the investment grade bond markets saw TIPS post a return of -2.04%, Treasuries a return of 0.33%, Intermediate Corporates -0.11% and International bonds returning -5.42%. Over the last year Treasuries had a total return of 2.22%. The appreciation-and-income spread versus the Treasury index was -108.35 basis points for Intermediate Government securities, 441.99 bps for Intermediate High Yield, 1.82% for Intermediate Corporates and -2.70% for non-US bonds. The longer term, five-year, total-return differences over the Treasury total return of 3.19% are as follows: -69.28 basis points for Intermediate Government securities, 698.41 bps for Intermediate High Yield, 197.39 for bps Intermediate Corporates and -172.70 bps for non-US bonds.
33

Calendar Year Returns as of September 2014
-40%
-20%
0%
20%
40%
60%
80%
100%
2013 2012 2011 2010 2009 2008 2007
Trailing Returns as of September 2014
Ret
urn
-5
0
5
10
15
YTD 1 quarter 1 year 3 years 5 years 10 years
US Treasury
AAA US Corporate
AA US Corporate
Single-A US Corporate
BBB US Corporate
BB US High Yield
Single-B US High Yield
CCC & Lower US High Yield
YTD 1 quarter 1 year 3 years 5 years 10 years
3.65% 0.43% 2.69% 1.08% 3.26% 4.25%
6.32% 0.70% 6.13% 1.95% 4.32% 4.15%
4.75% 0.29% 5.27% 3.80% 4.89% 4.50%
5.28% 0.13% 6.00% 4.88% 6.01% 4.87%
6.98% -0.10% 8.58% 6.64% 7.77% 6.44%
4.55% -1.36% 7.85% 9.90% 9.92% 7.94%
3.05% -1.88% 6.72% 10.63% 9.75% 7.19%
2.29% -3.57% 6.61% 14.52% 12.36% 9.83%
BofA Merrill Lynch US Treasury BofA Merrill Lynch AAA US Corporate BofA Merrill Lynch AA US Corporate BofA Merrill Lynch Single-A US CorporateBofA Merrill Lynch BBB US Corporate BofA Merrill Lynch BB US High Yield BofA Merrill Lynch Single-B US High Yield BofA Merrill Lynch CCC & Lower US High Yield
US Treasury
AAA US Corporate
AA US Corporate
Single-A US Corporate
BBB US Corporate
BB US High Yield
Single-B US High Yield
CCC & Lower US High Yield
2013 2012 2011 2010 2009 2008 2007
-3.35% 2.16% 9.79% 5.88% -3.72% 13.98% 9.05%
-4.27% 3.97% 9.11% 7.90% -0.65% 4.71% 7.29%
-1.91% 7.44% 6.25% 7.67% 9.14% -0.29% 5.10%
-1.82% 9.82% 7.39% 9.11% 15.92% -7.59% 4.24%
-0.95% 11.98% 8.12% 10.88% 31.42% -11.05% 4.42%
5.19% 14.36% 6.12% 14.93% 45.21% -19.19% 2.20%
7.47% 15.02% 4.65% 13.99% 47.64% -28.02% 3.07%
12.96% 20.26% -1.40% 18.42% 96.79% -38.30% 0.37%
The total return on AAA-rated US corporate debt over the quarter ending September 30, 2014 was 0.70%. The lowest end of the investment grade spectrum, BBB-rated debt, had a quarterly return of -0.10%. Moving to the high-yield portion of the market, BB bonds posted a -1.36% return on the quarter while the debt at highest risk of default (CCC and lower) had a return of -3.57%. For the one-year period AAA-corporates had a return of 6.13% (in contrast to the U.S. Treasury Master index return of 2.69%). The low-end of the investment-grade spectrum did better than the high-end, as BBB-debt had a return of 8.58%. In the non-investment grade market the story was oddly different, as BB-debt had a one-year return of 7.85% and junkiest of the junk had a return of 6.61%. Looking at the five-year time horizon, AAA-corporate debt offered an annualized appreciation-and-income difference of 105.94 basis points versus Treasuries (4.32% vs. 3.26%). Going down the spectrum, BBB's had a return of 7.77% (an annualized difference of 450.85bps), BB's 9.92% (665.52bps), and CCC 12.36% (a percentage difference of 9.10%).
Fixed Income Returns (Quality)
34

Calendar Year Returns as of September 2014
-10%
-5%
0%
5%
10%
15%
20%
25%
2013 2012 2011 2010 2009 2008 2007
Trailing Returns as of September 2014
Ret
urn
0
2
4
6
8
10
12
14
YTD 1 quarter 1 year 3 years 5 years 10 years
3-Month Treasury Bill
USBIG, 1-3 years
USBIG, 3-7 years
USBIG, 7-10 years
USBIG, 10+ years
YTD 1 quarter 1 year 3 years 5 years 10 years
0.03% 0.01% 0.04% 0.05% 0.08% 1.51%
0.75% 0.05% 1.04% 0.98% 1.57% 3.00%
2.75% -0.10% 2.66% 2.27% 3.81% 4.52%
5.90% 0.15% 4.92% 3.73% 6.15% 6.12%
13.09% 1.07% 12.84% 4.67% 8.06% 7.22%
Citigroup 3-Month Treasury Bill Citigroup USBIG, 1-3 years Citigroup USBIG, 3-7 years Citigroup USBIG, 7-10 years Citigroup USBIG, 10+ years
3-Month Treasury Bill
USBIG, 1-3 years
USBIG, 3-7 years
USBIG, 7-10 years
USBIG, 10+ years
2013 2012 2011 2010 2009 2008 2007
0.05% 0.07% 0.08% 0.13% 0.16% 1.80% 4.74%
0.52% 1.31% 1.92% 2.88% 4.63% 4.91% 6.86%
-1.02% 4.03% 6.88% 6.46% 5.26% 6.09% 7.49%
-4.55% 8.48% 12.11% 9.95% 5.12% 10.45% 6.93%
-9.24% 8.86% 22.52% 10.82% 1.87% 9.66% 6.93%
Analyzing the maturity structure of the broad, U.S. investment-grade market gives the following results: The short-end of the curve had quarterly returns of 0.05% in the 1-3 year range, the intermediate range of 3-7 years had a return of -0.10%, while the longer-dated indices of 7-10 year and 10 years-plus had returns of 0.15% and 1.07%, respectively. Over the last one year ending September 30, 2014 the best-performing portion of the yield curve was represented by the Citigroup USBIG Index, 10+ years with a 12.84% total return. The section with the lowest returns was the Citigroup 3-Month Treasury Bill with a return of 0.04%. The best annualized appreciation-and-income return over the last five years came from the Citigroup USBIG Index, 10+ years with a return of 8.06%, the lowest returns were Citigroup 3-Month Treasury Bill with 0.08%.
Fixed Income Returns (Maturity)
35

Corporate Yields & Spreads As of 10/16/14
+54 bps
+607 bps
9.09%
+115 bps
3.15%
0.0
1.0
2.0
3.0
4.0
5.0
6.0
7.0
8.0
9.0
10.0
0
100
200
300
400
500
600
700
Oct-94 Oct-98 Oct-02 Oct-06 Oct-10 Oct-14
Yield %Spread bps
Investment GradeSpread
Yield to Worst
+235 bps
+1833 bps
+424 bps
8.55%
21.83%
0.0
5.0
10.0
15.0
20.0
25.0
0
200
400
600
800
1000
1200
1400
1600
1800
2000
Sep-94 Sep-98 Sep-02 Sep-06 Sep-10 Sep-14
YTW (%)Spread in bps
High Yield
Spread
YTW
+114 bps +115 bps
3.26%
3.15%
2.75
2.85
2.95
3.05
3.15
3.25
3.35
3.45
75
85
95
105
115
125
Dec-13 Feb-14 Mar-14 Apr-14 Jun-14 Jul-14 Aug-14 Oct-14
Yield %Spread bps
Investment Grade
Spread Yield to Worst
Ave Life: 10.7 Duration: 7.2 Quality: Baa3
+382 bps
+532 bps
5.64%6.47%
4.0
4.5
5.0
5.5
6.0
6.5
7.0
325
345
365
385
405
425
445
Dec-13 Feb-14 Apr-14 Jun-14 Aug-14
YTW (%)Spread in bps
High Yield
Spread YTW
Ave Life: 6.5 Duration: 4.4 Quality: B2
36

U.S. Public and Private Placement Bond Issuance
Public Bond Issuance (in billions of USD)
YTD
9/30/14 2013 2012 2011 2010 2009 2008 2007
U.S. Investment Grade Corporates $948 $1,146 $1,114 $874 $846 $1,074 $806 $1,018
CMBS 97 166 103 78 50 24 16 191
Credit Card ABS 30 38 33 11 8 47 58 91
Auto ABS 74 92 95 66 66 66 48 78
Agency MBS 720 1,611 1,734 1,221 1,405 1,754 1,075 1,128
Non-Agency MBS 32.1 14.5 2.0 0.5 0.2 0 8 425
Private Bond Issuance (in billions of USD)
YTD
6/30/14 2013 2012 2011 2010 2009 2008 2007
Private Placements $24.3 $51.9 $54.9 $48.3 $41.0 $26.0 $28.1 $40.3
37

Where are Spreads / Yields Going Next
Nowhere fast based on credit fundamentals & supply/demand imbalance
If U.S. economic activity surprises to the upside more quickly than anticipated and draws the Fed response earlier than expected, anticipate wider spreads
38

2.79
5.62
4.54
1.0
1.5
2.0
2.5
3.0
3.5
4.0
4.5
5.0
5.5
6.0
40
60
80
100
120
140
160
180
200
Oct-12 Jan-13 Apr-13 Jul-13 Oct-13 Jan-14 Apr-14 Jul-14 Oct-14
%BpsDuration Risk of MBS
Eff. Dur.- rt axis Average Spread - left axis YTW % - rt axis
Source: Barclays Live
MBS Spreads
What’s happening as the Fed tapers? Not entirely what we expected…
-
1
2
3
4
5
Jun-08 Jun-09 Jun-10 Jun-11 Jun-12 Jun-13 Jun-14
Federal Reserve Activity(Trillions of Dollars)
Traditional Security HoldingsLong Term Treasury PurchasesFed Agency Debt MBS Purchases
39

Strategy
3Q & 4Q 2014
40

Strategy Summary
Expect real growth to accelerate in the U.S. re: solid underlying fundamentals Headwinds include: Ongoing geopolitical tensions and potential for escalation = capital flight to quality into the U.S. government debt market Fading recovery in Europe Uncertainty relative to stability and potential for demand growth from China Will cause yields to move sideways / potentially trend lower
Yields are trading below fair value relative to historical spread relationship between inflation and real rates Based on GDP inputs and relative strength of fundamental data, in addition to FED’s forward guidance, expect rates to
trend up…eventually. Idiosyncratic risks dominating interest rate moves / market action
Spreads across asset classes are trading tight relative to historical means Supply is strong – corporates, CMBS, but demand is stronger. Spread widening across most asset classes as a result of
risk off trade provides a buying opportunity There are limited asset classes in which to participate which is why the demand / supply imbalance will remain in place and
anchor spreads Despite FED taper, MBS spreads are performing re: less than expected supply and relative value
Corporate health is solid, profits are growing; credit defaults are low
Portfolio positioning is critical with timing of cashflows, and relative value positioning expected to be drivers of incremental
performance Managing portfolios to neutral duration vs. Benchmarks Value is solid in the specified pool space vs. TBA generic pools; roll arb is shrinking as FED participation slows CMO spreads are unattractive Floating rate is an opportunistic purchase Corporate bond spreads have widened, particularly junk bonds. Expect value trade to stay in place Agency CMBS is now a constituent within the Barclays Agg Index = buyer base has grown, additional spread performance
expected to be modest
41

MUTUAL FUND SUMMARY
3Q2014
42

PLAN INVESTMENT OPTIONS
Highest Risk of Principal
Asset Class
International Equity
Small Cap Growth
Small Cap Blend
Small Cap Value
Mid Cap Growth
Mid Cap Blend
Large Cap Growth
Large Cap Blend
Large Cap Value
Balanced/Asset Allocation
High-Yield Bond
Inv Grade Bond
Stable
Lowest Risk of Principal
American Funds EuroPacific
Mutual Global Discovery
Sentinel Small Company
Vanguard Small Cap Index
Heartland Value Plus
American Century Heritage
Scout Mid Cap
Fidelity New Millennium
Vanguard Large Cap Index
Putnam Equity Income
Great-West SecureFoundation Balanced
TIAA-CREF High Yield
PIMCO Total Return
Vanguard Intermediate-Term Bond Index
VALIC Fixed Fund
Target Date Funds:
Great-West Lifetime 2015
Great-West Lifetime 2025
Great-West Lifetime 2035
Great-West Lifetime 2045
Great-West Lifetime 2055
43

MUTUAL FUND PERFORMANCE
Group/Investment
3rd Quarter 2014 1 - Year 3 - Year 5 - Year 10 - Year 5 - Year
Return (Cumulative)
% of Peer Group Beaten
Return (Annualized)
% of Peer Group Beaten
Return (Annualized)
% of Peer Group Beaten
Return (Annualized)
% of Peer Group Beaten
Return (Annualized)
% of Peer Group Beaten
Standard Deviation (Qtr-End)
US OE Foreign Large Blend
American Funds Europacific Growth R5 -4.22 90 6.93 90 14.39 77 7.08 69 8.57 90 15.93
Benchmark 1: US OE Foreign Large Blend -5.62 3.78 13.03 6.14 5.89 16.74
Benchmark 2: MSCI ACWI Ex USA NR USD -5.27 4.77 11.79 6.03 7.06 16.46
US OE World Stock
Franklin Mutual Global Discovery Z -1.92 79 12.12 79 17.70 62 10.66 51 9.85 94 10.85
Benchmark 1: US OE World Stock -3.27 9.79 16.35 9.94 7.17 15.19
Benchmark 2: MSCI World NR USD -2.16 12.20 17.93 10.86 7.12 14.38
US OE Small Growth
Sentinel Small Company I -6.45 33 4.80 71 18.41 25 14.53 45 9.29 64 14.63
Benchmark 1: US OE Small Growth -5.80 2.78 19.82 14.23 7.71 18.23
Benchmark 2: Russell 2000 Growth TR USD -6.13 3.79 21.91 15.51 9.03 19.05
US OE Small Blend
Vanguard Small Cap Index Inv -5.51 79 9.35 89 23.38 78 16.10 83 9.70 89 17.80
Benchmark 1: US OE Small Blend -6.75 5.69 20.93 14.04 7.77 17.78
Benchmark 2: Russell 2000 TR USD -7.36 3.93 21.26 14.29 8.19 18.44
US OE Small Value
Heartland Value Plus Inst -10.32 4 5.55 45 18.27 16 12.92 29 9.01 76 18.81
Benchmark 1: US OE Small Value -7.14 6.19 21.17 13.97 7.81 17.72
Benchmark 2: Russell 2000 Value TR USD -8.58 4.13 20.61 13.02 7.25 18.10
US OE Mid-Cap Growth
American Century Heritage Inv -1.62 66 9.11 42 18.92 33 15.00 51 12.62 100 17.25
Benchmark 1: US OE Mid-Cap Growth -2.30 10.07 19.88 14.54 8.48 16.17
Benchmark 2: Russell Mid Cap Growth TR USD
-0.73 14.43 22.74 17.12 10.24 15.82
44

MUTUAL FUND PERFORMANCE
Group/Investment
3rd Quarter 2014 1 - Year 3 - Year 5 - Year 10 - Year 5 - Year
Return (Cumulative)
% of Peer Group Beaten
Return (Annualized)
% of Peer Group Beaten
Return (Annualized)
% of Peer Group Beaten
Return (Annualized)
% of Peer Group Beaten
Return (Annualized)
% of Peer Group Beaten
Standard Deviation (Qtr-End)
US OE Mid-Cap Blend
Scout Mid Cap -2.61 61 12.54 55 18.67 16 16.65 82 15.33
Benchmark 1: US OE Mid-Cap Blend -3.32 12.25 21.82 14.69 8.53 16.10
Benchmark 2: Russell Mid Cap TR USD -1.66 15.83 23.79 17.19 10.34 15.27
US OE Large Growth
Fidelity® New Millennium -2.21 5 14.71 29 22.05 61 16.06 79 10.59 94 14.38
Benchmark 1: US OE Large Growth 0.68 16.29 21.15 14.30 7.59 14.86
Benchmark 2: Russell 1000 Growth TR USD 1.49 19.15 22.45 16.50 8.94 13.66
US OE Large Blend
Vanguard Large Cap Index Inv 0.89 67 19.03 71 22.81 68 15.58 81 8.34 77 13.37
Benchmark 1: US OE Large Blend -0.10 16.62 21.24 13.75 7.24 13.83
Benchmark 2: S&P 500 TR USD 1.13 19.73 22.99 15.70 8.11 13.20
US OE Large Value
Putnam Equity Income Y -0.57 41 17.74 69 24.53 90 14.86 76 9.45 95 14.48
Benchmark 1: US OE Large Value -0.55 16.23 21.39 13.52 6.84 13.56
Benchmark 2: Russell 1000 Value TR USD -0.19 18.89 23.93 15.26 7.84 13.71
US OE High Yield Bond
TIAA-CREF High-Yield Inst -2.05 47 6.98 77 10.28 56 9.67 62 6.29
Benchmark 1: US OE High Yield Bond -2.02 5.99 9.97 9.30 6.49 6.33
Benchmark 2: Credit Suisse HY USD -1.94 7.08 10.62 10.36 7.98 5.77
US OE Intermediate-Term Bond
PIMCO Total Return Admin -0.42 16 3.04 17 4.30 74 4.81 50 5.73 92 3.61
Vanguard Interm-Term Bond Index Inv -0.02 56 4.29 49 3.19 44 5.52 72 5.36 84 4.53
Benchmark 1: US OE Intermediate-Term Bond -0.09 4.30 3.54 4.78 4.18 2.97
Benchmark 2: Barclays US Agg Bond TR USD 0.17 3.96 2.43 4.12 4.62 2.83
45
MUTUAL FUND PERFORMANCE
Group/Investment
3rd Quarter 2014 1 - Year 3 - Year 5 - Year 10 - Year 5 - Year
Return (Cumulative)
% of Peer Group Beaten
Return (Annualized)
% of Peer Group Beaten
Return (Annualized)
% of Peer Group Beaten
Return (Annualized)
% of Peer Group Beaten
Return (Annualized)
% of Peer Group Beaten
Standard Deviation (Qtr-End)
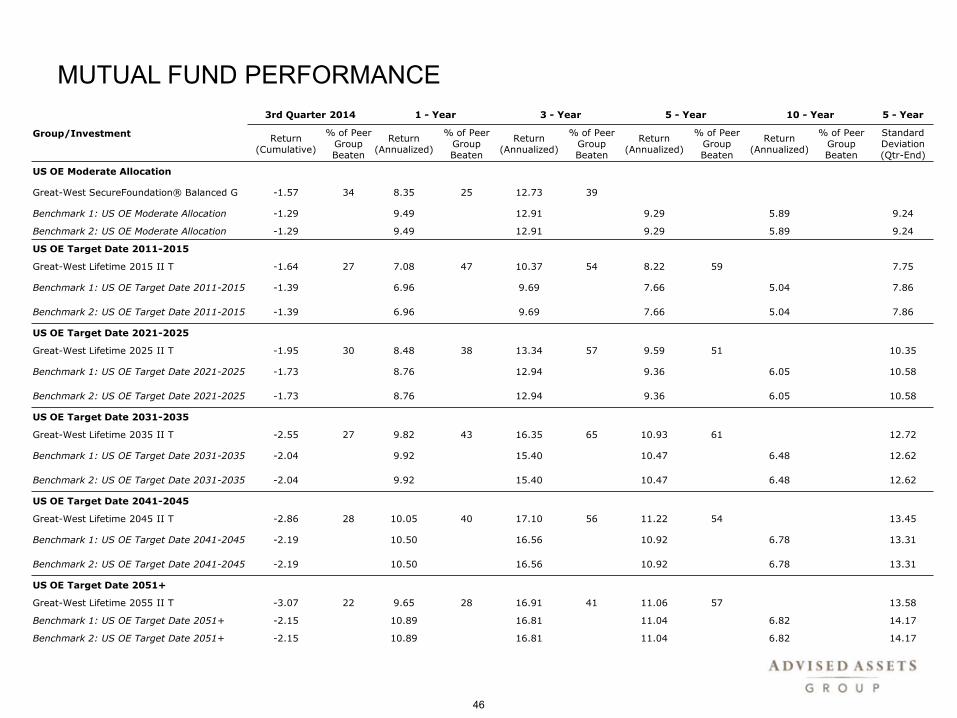
US OE Moderate Allocation
Great-West SecureFoundation® Balanced G -1.57 34 8.35 25 12.73 39
Benchmark 1: US OE Moderate Allocation -1.29 9.49 12.91 9.29 5.89 9.24
Benchmark 2: US OE Moderate Allocation -1.29 9.49 12.91 9.29 5.89 9.24
US OE Target Date 2011-2015
Great-West Lifetime 2015 II T -1.64 27 7.08 47 10.37 54 8.22 59 7.75
Benchmark 1: US OE Target Date 2011-2015 -1.39 6.96 9.69 7.66 5.04 7.86
Benchmark 2: US OE Target Date 2011-2015 -1.39 6.96 9.69 7.66 5.04 7.86
US OE Target Date 2021-2025
Great-West Lifetime 2025 II T -1.95 30 8.48 38 13.34 57 9.59 51 10.35
Benchmark 1: US OE Target Date 2021-2025 -1.73 8.76 12.94 9.36 6.05 10.58
Benchmark 2: US OE Target Date 2021-2025 -1.73 8.76 12.94 9.36 6.05 10.58
US OE Target Date 2031-2035
Great-West Lifetime 2035 II T -2.55 27 9.82 43 16.35 65 10.93 61 12.72
Benchmark 1: US OE Target Date 2031-2035 -2.04 9.92 15.40 10.47 6.48 12.62
Benchmark 2: US OE Target Date 2031-2035 -2.04 9.92 15.40 10.47 6.48 12.62
US OE Target Date 2041-2045
Great-West Lifetime 2045 II T -2.86 28 10.05 40 17.10 56 11.22 54 13.45
Benchmark 1: US OE Target Date 2041-2045 -2.19 10.50 16.56 10.92 6.78 13.31
Benchmark 2: US OE Target Date 2041-2045 -2.19 10.50 16.56 10.92 6.78 13.31
US OE Target Date 2051+
Great-West Lifetime 2055 II T -3.07 22 9.65 28 16.91 41 11.06 57 13.58
Benchmark 1: US OE Target Date 2051+ -2.15 10.89 16.81 11.04 6.82 14.17
Benchmark 2: US OE Target Date 2051+ -2.15 10.89 16.81 11.04 6.82 14.17
46

MUTUAL FUND OBSERVATIONS
Funds Underperforming both 3 & 5 Year Benchmarks
There are currently 2 funds underperforming their benchmarks on both a 3 & 5 year basis.
Sentinel Small Company – The investment seeks growth of capital. The fund invests at least 80% of its net assets in
small-capitalization companies. Small capitalization companies are companies that have, at the time of purchase, market
capitalizations of less than $4 billion. It invests primarily in common stocks of small companies that Sentinel believes are
high quality, have superior business models, solid management teams, sustainable growth potential and are attractively
valued. The fund may invest without limitation in foreign securities, although only where the securities are trading in the U.S.
or Canada and only where trading is denominated in U.S. or Canadian dollars.
On March 31, 2013, Jason Ronovech came on board as lead manager of the fund; he joined existing manager Carole Hersam. Hersam is the most tenured on the fund starting out as an analyst back in 2004 and is familiar with the high quality strategy employed here. Ronovech has previously been both a research analyst and portfolio manager with Paradigm Funds who ran a similar high quality strategy in the small and mid cap space. The co-managers are aided by 2 dedicated analysts to help with research.
The current strategy has not changed with recent portfolio management changes, it is still focused on stocks that are growing nicely but also feature strong returns on capital and competitive advantages. This conservative strategy has the managers look for recurring stable revenue streams in companies that aren't too capital-intensive. They use a disciplined value process and only buy stocks trading below what they estimate their fair market value to be; they also have a disciplined sell process and will only get rid of stocks that exceed their estimated value.
The conservative nature of the strategy has resulted in a fund with a higher average market cap than its small cap growth peers. The fund also tends to lean more toward the blend small cap index rather than growth small cap index. In addition, the fund does not make really dramatic sector bets and the portfolios average price/earnings and price/sales ratios will also tend to be lower than the category and the benchmark.
At the end of the 3rd quarter of 2014, the fund underperformed the Morningstar Small Cap Growth peer group with a return of -6.45% vs. -5.80%. This is the first negative quarter the fund has had this year and in fact it is outperforming the peer group on a year-to-date basis by 3.09%. While it is difficult to access the ability of the managers due to the short time frame the duo has been in charge of the fund; Both Hersam and Ronovech have a lot to prove here to keep investors happy.
47

MUTUAL FUND OBSERVATIONS
Funds Underperforming both 3 & 5 Year Benchmarks
Heartland Value Plus – The investment seeks long-term capital appreciation and modest current income. The fund invests
primarily in a concentrated number (generally 40 to 70) of small-capitalization equity securities selected on a value basis. A
majority of its assets are generally invested in dividend-paying common stocks. It primarily invests in companies with market
capitalizations between $250 million and $4 billion at the time of purchase.
Co-managers Brad Evans and Adam Peck have been at the helm of this fund for over 5 years and have had some
early success during their tenure. The managers apply Heartland's 10-step process to small-cap dividend-paying
stocks, which typically account for 80%-90% of the holdings.
The duo relies on a bottom-up research process that favors stocks with low price/earnings, price/cash flow, and
price/book ratios. Their strategy focuses on small-cap dividend-paying firms that have low price multiples, veteran
management teams, and reasonable debt. In addition, they have a strong sell side discipline (which can cause it to
underperform during market rallies as its managers take profits) and will get out of a company once it hits internal
price targets.
Another distinguishing factor is the managers' comfort with investing down the market-cap range. At the end of the
3rd quarter of 2014, Micro-cap stocks made up over 43% of the portfolio; almost 6 percentage points higher than
the benchmark. While investing in small-and micro-cap companies has risk, Heartland has found that owning
dividend-payers has helped reduce volatility compared to siblings and peers that don't have such a requirement
In the 3rd quarter of 2014, the fund continued the underperformance it experienced in the 2nd quarter. The fund is
once again trailing the Morningstar Small Cap Growth peer group across all recent return periods: year-to-date, 1,
3, & 5 year. The fund is still showing a solid 10 year returns, but that is trending down with recent performance. The
fund won’t always outperform, but has been a solid choice in the past. The fund has an established management
team, a consistent strategy, and a solid long-term track record; still recent performance makes it hard to stay
cautiously optimistic.
48
MUTUAL FUND OBSERVATIONS
Funds Underperforming 3rd Quarter, 1, 3 , 5, or 10 Year Benchmarks
– There were a total of 16 funds that underperformed at least one of their benchmarks in the 3rd quarter:
• Sentinel Small Company I
• Heartland Value Plus
• American Century Heritage - (Outperformed Benchmark 1; Underperformed Benchmark 2)
• Scout Mid Cap - (Outperformed Benchmark 1; Underperformed Benchmark 2)
• Fidelity New Millennium
• Vanguard Large Cap Index - (Outperformed Benchmark 1; Underperformed Benchmark 2)
• Putnam Equity Income Y
• TIAA-CREF High-Yield
• PIMCO Total Return
• Vanguard Intermediate-Term Bond Index
• Great-West SecureFoundation Balanced
• Great-West Lifetime 2015
• Great-West Lifetime 2025
• Great-West Lifetime 2035
• Great-West Lifetime 2045
• Great-West Lifetime 2055
– There were 15 funds that underperformed at least one of their benchmarks on a 1 year basis:
• Franklin Mutual Global Discovery - (Outperformed Benchmark 1; Underperformed Benchmark 2)
• Heartland Value Plus - (Outperformed Benchmark 2; Underperformed Benchmark 1)
• American Century Heritage
• Scout Mid Cap - (Outperformed Benchmark 1; Underperformed Benchmark 2)
• Fidelity New Millennium
• Vanguard Large Cap Index - (Outperformed Benchmark 1; Underperformed Benchmark 2)
• Putnam Equity Income - (Outperformed Benchmark 1; Underperformed Benchmark 2)
• TIAA-CREF High-Yield - (Outperformed Benchmark 1; Underperformed Benchmark 2)
• PIMCO Total Return
• Vanguard Intermediate Term Bond Index
• Great-West SecureFoundation Balanced
• Great-West Lifetime 2025
• Great-West Lifetime 2035
• Great-West Lifetime 2045
• Great-West Lifetime 2055
49

MUTUAL FUND OBSERVATIONS
Funds Underperforming 3rd Quarter, 1, 3 , 5, or 10 Year Benchmarks
– There were 10 funds that underperformed at least one of their benchmarks on a 3 year basis:
• Franklin Mutual Global Discovery Z - (Outperformed Benchmark 1; Underperformed Benchmark 2)
• Sentinel Small Company
• Heartland Value Plus
• American Century Heritage
• Scout Mid Cap
• Fidelity New Millennium - (Outperformed Benchmark 1; Underperformed Benchmark 2)
• Vanguard Large Cap Index - (Outperformed Benchmark 1; Underperformed Benchmark 2)
• TIAA-CREF High-Yield - (Outperformed Benchmark 1; Underperformed Benchmark 2)
• Vanguard Intermediate Term Bond Index - (Outperformed Benchmark 2; Underperformed Benchmark 1)
• Great-West SecureFoundation Balanced Fund
– There were 9 funds that underperformed at least one of their benchmarks on a 5 year basis:
• Franklin Mutual Global Discovery
• Sentinel Small Company - (Outperformed Benchmark 1; Underperformed Benchmark 2)
• Heartland Value Plus
• American Century Heritage - (Outperformed Benchmark 1; Underperformed Benchmark 2)
• Scout Mid Cap - (Outperformed Benchmark 1; Underperformed Benchmark 2)
• Fidelity New Millennium - (Outperformed Benchmark 1; Underperformed Benchmark 2)
• Vanguard Large Cap Index - (Outperformed Benchmark 1; Underperformed Benchmark 2)
• Putnam Equity Income - (Outperformed Benchmark 1; Underperformed Benchmark 2)
• TIAA-CREF High Yield - (Outperformed Benchmark 1; Underperformed Benchmark 2)
– There were no funds that underperformed their benchmarks on a 10 year basis.
50

MANAGER STYLE
Manager Style Graph: Each quadrant of the graph represents one of the four major domestic equity components of the market. From
top left working clockwise the quadrants include Large Value, Large Growth, Small Growth and Small Value.
Active Domestic Equities Zephyr StyleADVISOR: Advised Assets Group LLC
Manager Style
October 2009 - September 2014
Russell 1000 Value Russell 1000 Growth
Russell 2000 Value Russell 2000 Growth
Small
-1
0
1
Large
Value -1 0 1 Growth
Heartland Value Plus Inst
Sentinel Small Company I
Vanguard Small Cap Index Inv
Scout Mid Cap
Putnam Equity Income Y
Vanguard Large Cap Index Inv
American Century Heritage Inv
Fidelity® New Millennium
Russell Generic Corners
51

MANAGER STYLE DRIFT
Manager Style Graph: Each quadrant of the graph represents one of the four major domestic equity components of the market. From
top left working clockwise the quadrants include Large Value, Large Growth, Small Growth and Small Value.
Active Domestic Equities Zephyr StyleADVISOR: Advised Assets Group LLC
Manager Style
October 2009 - September 2014
Russell 1000 Value Russell 1000 Growth
Russell 2000 Value Russell 2000 Growth
Small
-1
0
1
Large
Value -1 0 1 Growth
Heartland Value Plus Inst
Sentinel Small Company I
Vanguard Small Cap Index Inv
Scout Mid Cap
Putnam Equity Income Y
Vanguard Large Cap Index Inv
American Century Heritage Inv
Fidelity® New Millennium
Russell Generic Corners
52

PLAN & ASSET ALLOCATION REPORTS
3Q2014
53

Current performance may be lower or higher than performance data shown. Performance data quoted represents past performance and is not a guarantee or prediction of future results. For
performance data current to the most recent month-end, please visit www.wvteachersdcp.com.
Please consider the investment objectives, risks, fees and expenses carefully before investing. For this and other important information about investments offered through your Plan, you may obtain
mutual fund prospectuses from your registered representative or Plan website. Read them carefully before investing.
For additional fund information, please refer to the Fund Fact Sheet or Prospectus.
Returns as of Month Ending 09/30/2014 Returns as of Quarter Ending 09/30/2014 Calendar Year Returns
INVESTMENT OPTION TickerGross/Net
Expense Ratio 19Inception
Date1
Month YTD1
Year3
Year5
Year10 Year/ Since
Inception3
Month1
Year3
Year5
Year10 Year/ Since
Inception 2013 2012 2011
Guaranteed Lifetime Income
Great-West SF Balanced Trust3,4,7,23 N/A 0.28 / 0.28 06-23-2011 -2.33 4.43 9.96 14.26 N/A 10.15 -1.40 9.96 14.26 N/A 10.15 17.63 13.19 N/A
Blackrock Emerging Markets Index F [3.00%]1,7 N/A 0.18 / 0.18 03-14-2013 -7.43 2.02 3.93 N/A N/A -0.35 * 3.93 N/A N/A -0.35 N/A N/A N/A
Blackrock MidCap Equity Index Fund F [11.00%]7 N/A 0.03 / 0.03 06-16-1997 -4.55 3.23 11.83 22.44 16.39 10.37 -3.98 11.83 22.44 16.39 10.37 33.61 17.86 -1.67
Blackrock EAFE Equity Index Fund F [12.00%]7 N/A 0.10 / 0.10 05-02-2000 -3.85 -1.22 4.43 14.31 6.77 6.50 -5.90 4.43 14.31 6.77 6.50 22.14 18.57 -11.74
Blackrock US Debt Index Fund F [38.00%]7 N/A 0.04 / 0.04 01-03-1992 -0.62 4.29 4.13 2.52 4.19 4.67 0.22 4.13 2.52 4.19 4.67 -1.93 4.27 7.87
Blackrock Russell 2000 Index Fund F [9.00%]7 N/A 0.03 / 0.03 12-31-1997 -6.03 -4.27 4.11 21.48 14.43 8.28 -7.31 4.11 21.48 14.43 8.28 39.11 16.57 -4.14
Blackrock Equity Index Fund F [27.00%]7 N/A 0.02 / 0.02 03-05-1997 -1.40 8.34 19.73 23.02 15.76 8.21 1.13 19.73 23.02 15.76 8.21 32.45 16.04 2.23
Lifetime
Great-West Lifetime 2015 Trust II2,3,4,7,23,24 N/A 0.57 / 0.57 06-23-2011 -2.11 4.61 7.80 11.15 N/A 7.93 -1.20 7.80 11.15 N/A 7.93 9.47 12.68 N/A
Great-West Lifetime 2025 Trust II2,3,4,7,23,24 N/A 0.56 / 0.56 06-23-2011 -2.45 4.76 9.34 14.24 N/A 9.47 -1.43 9.34 14.24 N/A 9.47 14.78 14.93 N/A
Great-West Lifetime 2035 Trust II2,3,4,7,23,24 N/A 0.57 / 0.57 06-23-2011 -2.98 4.58 10.89 17.10 N/A 10.90 -2.00 10.89 17.10 N/A 10.90 20.64 16.71 N/A
Great-West Lifetime 2045 Trust II2,3,4,7,23,24 N/A 0.57 / 0.57 06-23-2011 -3.30 4.24 11.01 17.71 N/A 11.07 -2.40 11.01 17.71 N/A 11.07 22.21 17.17 N/A
Great-West Lifetime 2055 Trust II2,3,4,7,23,24 N/A 0.57 / 0.57 06-23-2011 -3.47 3.97 10.69 17.55 N/A 10.70 -2.57 10.69 17.55 N/A 10.70 21.97 17.29 N/A
International
American Funds EuroPacific Gr R58,21 RERFX 0.54 / 0.54 05-15-2002 -2.90 -0.71 6.93 14.39 7.08 8.57 -4.22 6.93 14.39 7.08 8.57 20.54 19.57 -13.33
Franklin Mutual Global Discovery Z8,21 MDISX 0.98 / 0.98 12-31-1992 -2.17 4.28 12.12 17.70 10.66 9.85 -1.92 12.12 17.70 10.66 9.85 25.64 13.65 -2.68
MSCI EAFE Index1,5,6,14 N/A - / - -3.84 -1.38 4.25 13.65 6.56 6.32 -5.88 4.25 13.65 6.56 6.32 22.78 17.32 -12.14
Small Cap
Heartland Value Plus Inst9,21 HNVIX 0.84 / 0.84 05-01-2008 -7.37 -5.43 5.55 18.27 12.92 9.01 -10.32 5.55 18.27 12.92 9.01 34.54 11.67 -5.07
Sentinel Small Company I9,21 SIGWX 0.81 / 0.81 05-04-2007 -4.21 -1.89 4.80 18.41 14.53 9.29 -6.45 4.80 18.41 14.53 9.29 35.19 11.32 3.31
Vanguard Small-Cap Index Fund - Inv9,21 NAESX 0.24 / 0.24 10-03-1960 -5.31 0.51 9.35 23.38 16.10 9.70 -5.51 9.35 23.38 16.10 9.70 37.62 18.04 -2.80
Russell 2000 Index1,5,6,17 N/A - / - -6.05 -4.41 3.93 21.26 14.29 8.19 -7.36 3.93 21.26 14.29 8.19 38.82 16.35 -4.18
West Virginia Teachers' Defined Contribution Plan - 98977-01
Investment Performance as of 09/30/2014
98977-01 - Investment Options at a Glance
54

Returns as of Month Ending 09/30/2014 Returns as of Quarter Ending 09/30/2014 Calendar Year Returns
INVESTMENT OPTION TickerGross/Net
Expense Ratio 19Inception
Date1
Month YTD1
Year3
Year5
Year10 Year/ Since
Inception3
Month1
Year3
Year5
Year10 Year/ Since
Inception 2013 2012 2011
Mid Cap
American Century Heritage Inv11,21 TWHIX 1.00 / 1.00 11-10-1987 -2.93 2.67 9.11 18.92 15.00 12.62 -1.62 9.11 18.92 15.00 12.62 31.02 16.04 -6.53
Scout Mid Cap11,21 UMBMX 1.07 / 1.07 10-31-2006 -4.24 2.75 12.54 18.67 16.65 11.51 -2.61 12.54 18.67 16.65 11.51 37.68 9.89 0.32
S & P MidCap 400 Index1,5,6,16 N/A - / - -4.55 3.22 11.82 22.43 16.37 10.29 -3.98 11.82 22.43 16.37 10.29 33.50 17.88 -1.73
Large Cap
Fidelity New Millennium21 FMILX 0.91 / 0.91 12-28-1992 -2.51 4.75 14.71 22.05 16.06 10.59 -2.21 14.71 22.05 16.06 10.59 37.19 15.66 2.52
JHancock Large Cap Equity I13,21 JLVIX 0.83 / 0.83 03-01-2001 -1.73 5.34 17.46 23.20 12.93 11.67 0.90 17.46 23.20 12.93 11.67 32.63 20.57 -8.69
Putnam Equity Income Y21,22 PEIYX 0.77 / 0.77 10-01-1998 -1.96 7.60 17.74 24.53 14.86 9.45 -0.57 17.74 24.53 14.86 9.45 31.94 19.31 2.03
Vanguard Large Cap Index Inv21 VLACX 0.24 / 0.24 01-30-2004 -1.60 8.01 19.03 22.81 15.59 8.34 0.89 19.03 22.81 15.59 8.34 32.45 15.94 1.44
S & P 500 Index1,5,6,15 N/A - / - -1.40 8.34 19.73 22.99 15.70 8.11 1.13 19.73 22.99 15.70 8.11 32.39 16.00 2.11
Bond
PIMCO Total Return Admin10,21 PTRAX 0.71 / 0.71 09-08-1994 -0.96 3.14 3.04 4.30 4.81 5.73 -0.42 3.04 4.30 4.81 5.73 -2.17 10.08 3.91
TIAA-CREF High-Yield Inst10,21 TIHYX 0.37 / 0.37 03-31-2006 -2.25 3.20 6.98 10.28 9.67 7.96 -2.05 6.98 10.28 9.67 7.96 6.16 14.35 6.14
Vanguard Interm-Term Bond Index Inv10,21 VBIIX 0.20 / 0.20 03-01-1994 -1.08 4.92 4.29 3.19 5.52 5.36 -0.02 4.29 3.19 5.52 5.36 -3.54 6.91 10.61
Barclays Capital Aggregate Bond Index1,5,6,18 N/A - / - -0.68 4.10 3.96 2.43 4.12 4.62 0.17 3.96 2.43 4.12 4.62 -2.02 4.21 7.84
Current Fixed Rate(s)
VALIC Fixed Annuity Option: 4.50%
UNDERLYING FUND ALLOCATIONS FOR THE GREATWEST TRUST LIFETIME MODERATE
Great-West Lifetime Trust II
UNDERLYING INVESTMENTTicker 2015 2025 2035 2045 2055
American Century Infl-Adj Bd Instl21 AIANX 11.71 5.20 1.04
American Century Large Cap Growth CIT7,21 N/A 3.64 5.08 6.72 6.96 6.52
American Century Mid Cap Value CIT7,21 N/A 2.26 3.14 4.16 4.30 4.04
American Century Short Duration Instl21 ACSUX 5.36 2.38 .48
American Funds American Mutual R621 RMFGX 4.46 6.20 8.22 8.50 7.98
Blackrock EAFE Equity Index Fund F7 N/A 3.67 6.03 9.30 11.08 11.91
Blackrock Emerging Markets Index F7 N/A .87 1.65 2.94 4.00 4.87
West Virginia Teachers' Defined Contribution Plan - 98977-01 (Continued)
98977-01 - Investment Options at a Glance
55
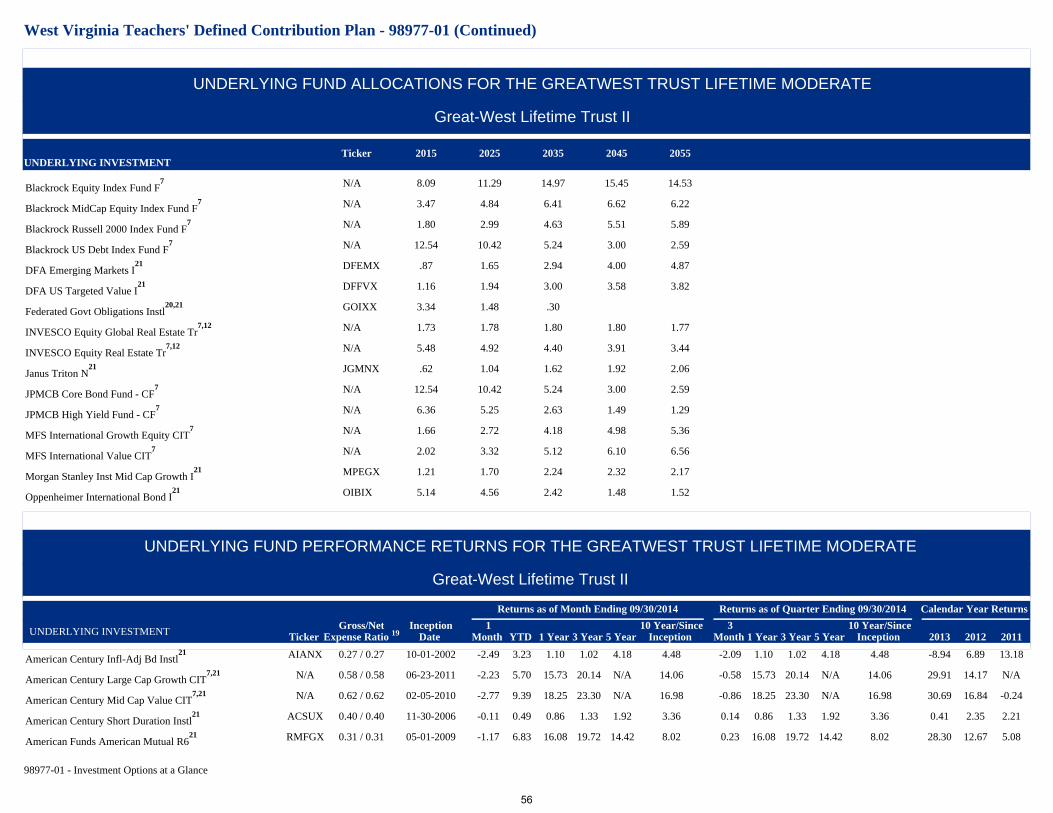
UNDERLYING FUND ALLOCATIONS FOR THE GREATWEST TRUST LIFETIME MODERATE
Great-West Lifetime Trust II
UNDERLYING INVESTMENTTicker 2015 2025 2035 2045 2055
Blackrock Equity Index Fund F7 N/A 8.09 11.29 14.97 15.45 14.53
Blackrock MidCap Equity Index Fund F7 N/A 3.47 4.84 6.41 6.62 6.22
Blackrock Russell 2000 Index Fund F7 N/A 1.80 2.99 4.63 5.51 5.89
Blackrock US Debt Index Fund F7 N/A 12.54 10.42 5.24 3.00 2.59
DFA Emerging Markets I21 DFEMX .87 1.65 2.94 4.00 4.87
DFA US Targeted Value I21 DFFVX 1.16 1.94 3.00 3.58 3.82
Federated Govt Obligations Instl20,21 GOIXX 3.34 1.48 .30
INVESCO Equity Global Real Estate Tr7,12 N/A 1.73 1.78 1.80 1.80 1.77
INVESCO Equity Real Estate Tr7,12 N/A 5.48 4.92 4.40 3.91 3.44
Janus Triton N21 JGMNX .62 1.04 1.62 1.92 2.06
JPMCB Core Bond Fund - CF7 N/A 12.54 10.42 5.24 3.00 2.59
JPMCB High Yield Fund - CF7 N/A 6.36 5.25 2.63 1.49 1.29
MFS International Growth Equity CIT7 N/A 1.66 2.72 4.18 4.98 5.36
MFS International Value CIT7 N/A 2.02 3.32 5.12 6.10 6.56
Morgan Stanley Inst Mid Cap Growth I21 MPEGX 1.21 1.70 2.24 2.32 2.17
Oppenheimer International Bond I21 OIBIX 5.14 4.56 2.42 1.48 1.52
UNDERLYING FUND PERFORMANCE RETURNS FOR THE GREATWEST TRUST LIFETIME MODERATE
Great-West Lifetime Trust II
Returns as of Month Ending 09/30/2014 Returns as of Quarter Ending 09/30/2014 Calendar Year Returns
UNDERLYING INVESTMENT TickerGross/Net
Expense Ratio 19Inception
Date1
Month YTD 1 Year 3 Year 5 Year10 Year/Since
Inception3
Month 1 Year 3 Year 5 Year10 Year/Since
Inception 2013 2012 2011
American Century Infl-Adj Bd Instl21 AIANX 0.27 / 0.27 10-01-2002 -2.49 3.23 1.10 1.02 4.18 4.48 -2.09 1.10 1.02 4.18 4.48 -8.94 6.89 13.18
American Century Large Cap Growth CIT7,21 N/A 0.58 / 0.58 06-23-2011 -2.23 5.70 15.73 20.14 N/A 14.06 -0.58 15.73 20.14 N/A 14.06 29.91 14.17 N/A
American Century Mid Cap Value CIT7,21 N/A 0.62 / 0.62 02-05-2010 -2.77 9.39 18.25 23.30 N/A 16.98 -0.86 18.25 23.30 N/A 16.98 30.69 16.84 -0.24
American Century Short Duration Instl21 ACSUX 0.40 / 0.40 11-30-2006 -0.11 0.49 0.86 1.33 1.92 3.36 0.14 0.86 1.33 1.92 3.36 0.41 2.35 2.21
American Funds American Mutual R621 RMFGX 0.31 / 0.31 05-01-2009 -1.17 6.83 16.08 19.72 14.42 8.02 0.23 16.08 19.72 14.42 8.02 28.30 12.67 5.08
West Virginia Teachers' Defined Contribution Plan - 98977-01 (Continued)
98977-01 - Investment Options at a Glance
56

UNDERLYING FUND PERFORMANCE RETURNS FOR THE GREATWEST TRUST LIFETIME MODERATE
Great-West Lifetime Trust II
Returns as of Month Ending 09/30/2014 Returns as of Quarter Ending 09/30/2014 Calendar Year Returns
UNDERLYING INVESTMENT TickerGross/Net
Expense Ratio 19Inception
Date1
Month YTD 1 Year 3 Year 5 Year10 Year/Since
Inception3
Month 1 Year 3 Year 5 Year10 Year/Since
Inception 2013 2012 2011
Blackrock EAFE Equity Index Fund F7 N/A 0.10 / 0.10 05-02-2000 -3.85 -1.22 4.43 14.31 6.77 6.50 -5.90 4.43 14.31 6.77 6.50 22.14 18.57 -11.74
Blackrock Emerging Markets Index F1,7 N/A 0.18 / 0.18 03-14-2013 -7.43 2.02 3.93 N/A N/A -0.35 * 3.93 N/A N/A -0.35 N/A N/A N/A
Blackrock Equity Index Fund F7 N/A 0.02 / 0.02 03-05-1997 -1.40 8.34 19.73 23.02 15.76 8.21 1.13 19.73 23.02 15.76 8.21 32.45 16.04 2.23
Blackrock MidCap Equity Index Fund F7 N/A 0.03 / 0.03 06-16-1997 -4.55 3.23 11.83 22.44 16.39 10.37 -3.98 11.83 22.44 16.39 10.37 33.61 17.86 -1.67
Blackrock Russell 2000 Index Fund F7 N/A 0.03 / 0.03 12-31-1997 -6.03 -4.27 4.11 21.48 14.43 8.28 -7.31 4.11 21.48 14.43 8.28 39.11 16.57 -4.14
Blackrock US Debt Index Fund F7 N/A 0.04 / 0.04 01-03-1992 -0.62 4.29 4.13 2.52 4.19 4.67 0.22 4.13 2.52 4.19 4.67 -1.93 4.27 7.87
DFA Emerging Markets I21 DFEMX 0.57 / 0.57 04-25-1994 -7.39 2.91 4.82 7.75 5.13 10.96 -3.42 4.82 7.75 5.13 10.96 -3.12 19.16 -17.41
DFA US Targeted Value I21 DFFVX 0.37 / 0.37 02-23-2000 -5.98 -0.87 10.83 25.61 16.15 9.30 -6.10 10.83 25.61 16.15 9.30 43.03 19.19 -6.29
Federated Govt Obligations Instl20,21 GOIXX 0.28 / 0.20 03-30-1990 0.00 0.01 0.01 0.01 0.02 1.61 0.00 0.01 0.01 0.02 1.61 0.01 0.01 0.01
INVESCO Equity Global Real Estate Tr7,12 N/A 0.80 / 0.80 08-01-2006 -6.04 7.43 6.62 15.49 10.21 2.98 -3.97 6.62 15.49 10.21 2.98 2.82 29.65 -6.32
INVESCO Equity Real Estate Tr7,12 N/A 0.75 / 0.75 05-02-1994 -5.70 13.92 13.48 16.28 14.78 9.08 -2.22 13.48 16.28 14.78 9.08 1.80 17.08 8.70
Janus Triton N21 JGMNX 0.68 / 0.68 05-31-2012 -3.34 -0.50 8.61 21.62 17.98 18.91 -3.19 8.61 21.62 17.98 18.91 36.71 16.62 N/A
JPMCB Core Bond Fund - CF7 N/A 0.30 / 0.30 06-23-2011 -0.54 3.80 3.67 2.97 N/A 5.98 0.36 3.67 2.97 N/A 5.98 -1.78 5.90 N/A
JPMCB High Yield Fund - CF7 N/A 0.51 / 0.51 06-23-2011 -2.03 3.03 6.31 10.33 N/A 7.58 -1.87 6.31 10.33 N/A 7.58 N/A N/A N/A
MFS International Growth Equity CIT7 N/A 0.69 / 0.69 06-23-2011 -3.98 -2.71 0.51 12.36 N/A 5.27 -6.48 0.51 12.36 N/A 5.27 14.39 19.98 N/A
MFS International Value CIT7 N/A 0.65 / 0.65 09-20-2010 -2.27 1.54 6.66 16.68 N/A 13.01 -4.11 6.66 16.68 N/A 13.01 28.39 N/A N/A
Morgan Stanley Inst Mid Cap Growth I21 MPEGX 0.71 / 0.71 03-30-1990 -3.99 -1.28 7.25 15.62 14.11 11.01 -1.48 7.25 15.62 14.11 11.01 38.35 9.49 -6.89
Oppenheimer International Bond I21 OIBIX 0.56 / 0.56 01-27-2012 -2.02 1.48 2.32 3.14 3.05 6.43 -2.23 2.32 3.14 3.05 6.43 -3.88 11.29 N/A
These returns and fund operating expenses are expressed as percentages. 3, 5 and 10 Year/Since Inception returns shown are annualized. For 10 Year/Since Inception, if the fund was not in existence for 10 years, returns shown are since
inception. If the fund is less than one year old, returns are not annualized.
Performance returns reflect a deduction for fund operating expenses. Your Plan may also assess an administrative fee which would reduce the performance quoted above.
Funds may impose redemption fees and/or transfer restrictions if assets are held for less than the published holding period. For more information, see the fund#s prospectus and/or disclosure documents.
Investment decisions should not be based solely on the performance data contained herein. Although data is gathered from reliable sources, including but not limited to Morningstar, Inc., the completeness or accuracy of the data shown cannot
be guaranteed.
The Great-West Trusts are offered by Great-West Trust Company, LLC and the investment adviser is Great-West Capital Management, LLC. Core securities, when offered, are offered through GWFS Equities, Inc. and/or other broker dealers.
GWFS Equities, Inc., Member FINRA/SIPC, and Great-West Trust Company, LLC are wholly owned subsidiaries of Great-West Life & Annuity Insurance Company.
Securities, when offered, are offered through GWFS Equities, Inc. , a wholly owned subsidiary of Great-West Life & Annuity Insurance Company. GWFS Equities, Inc., or one or more of its affiliates, may receive a fee from the investment option
provider for providing certain recordkeeping, distribution, and administrative services.
West Virginia Teachers' Defined Contribution Plan - 98977-01 (Continued)
98977-01 - Investment Options at a Glance
57

GWFS Equities, Inc., or one or more of its affiliates, may receive a fee from the investment option provider for providing certain recordkeeping, distribution, and administrative services.
Great-West Financial(R) refers to products and services provided by Great-West Life & Annuity Insurance Company (GWL&A), Corporate Headquarters: Greenwood Village, CO, its subsidiaries and affiliates. The trademarks, logos, service
marks, and design elements used are owned by GWL&A.
Actual fund operating expenses may be less if the fund currently offers a waiver or reimbursement, which is subject to an expiration date.
Plan logos are owned by the plan. All other logos, registered trademarks and service marks are owned by Great-West Life & Annuity Insurance Company.
The West Virginia Consolidated Public Retirement Board logo and its design elements are owned by the West Virginia Consolidated Public Retirement Board. Other than those owned by West Virginia Consolidated Public Retirement Board or
indicated otherwise, the trademarks and service marks and design elements used are owned by Great-West Life & Annuity Insurance Company.1Performance returns were not available at the time of production. Performance returns will be published once the information becomes available.
2A target date fund will gradually shift its emphasis from more aggressive investments to more conservative ones based on its target date (which is the assumed retirement date for an investor).
3Asset allocation funds are generally subject to a fund operating expense at the fund level, as well as prorated fund operating expenses of each underlying fund in which they invest. For more information, please refer to the fund prospectus
and/or disclosure document.4Asset allocation and balanced investment options and models are subject to the risks of the underlying funds, which can be a mix of stocks/stock funds and bonds/bond funds. For more information, see the prospectus and/or disclosure
documents.5A benchmark index is not actively managed, does not have a defined investment objective, and does not incur fees or expenses. Therefore, performance of a fund will generally be less than its benchmark index. You cannot invest directly in a
benchmark index.6Benchmark index returns are supplied by Morningstar, Inc. There may be another benchmark that is more specific to each of the funds listed under the broad asset class. Please refer to the fund's prospectus for more specific information as to
the fund's actual benchmark index.7Collective Trust Fund Option. A ticker symbol is not available for this investment option. A collective fund is not a mutual fund and is exempt from SEC registration. Designed for and exclusively sold to qualified retirement plans and their
participants, the funds are not available to individual retail investors.8Foreign funds involve special risks, including currency fluctuations and political developments.
9Equity securities of small-sized companies may be more volatile than securities of larger, more established companies.
10Compared to higher-rated securities, high yield bond investment options are subject to greater risk, including the risk of default. A bond fund's yield, share price and total return change daily and are based on changes in interest rates, market
conditions, economic and political news, and the quality and maturity of its investments. In general, bond prices fall when interest rates rise and vice versa.11
Equity securities of medium-sized companies may be more volatile than securities of larger, more established companies.12
Real estate securities involve greater risks than other non-diversified investments, including, but not limited to: declining property values, varying economic conditions, changes in zoning laws, or losses from casualty. Real estate securities that
invest in foreign real estate involve additional risk, including currency fluctuations and political developments.13
This investment option is no longer available.14
Copyright Morgan Stanley Capital International, Inc. 2014. All Rights Reserved. Unpublished. PROPRIETARY TO MORGAN STANLEY CAPITAL INTERNATIONAL INC.®15
S&P 500® Index is an unmanaged index considered indicative of the domestic Large-Cap equity market. "Standard & Poor's®", "S&P®", "S&P 500®", and "Standard & Poor's 500®" are registered trademarks of Standard & Poor's Financial
Services LLC ("Standard & Poor's").16
S&P MidCap 400® Index is an unmanaged index considered indicative of the domestic Mid-Cap equity market. "Standard & Poor's®", "S&P®", "S&P 400®", and "Standard & Poor's 400®" are registered trademarks of Standard & Poor's
Financial Services LLC ("Standard & Poor's").17
Russell 2000® Index is a trademark of Russell Investments and is an unmanaged index considered indicative of the domestic Small-Cap equity market.18
Barclays Capital U.S. Aggregate Bond Index is an unmanaged index representative of the broad bond market and is composed of government and corporate bonds, mortgage-backed bonds and asset-backed bonds.19
The net expense ratio is less applicable fee waivers or expense reimbursements the investment adviser and/or administrator may have agreed upon, either voluntary or by contractual agreement; the gross expense ratio is not. Fee waivers and
reimbursements may be modified or terminated at any time. Additional information can be found in the Fund's prospectus and/or other disclosure documents regarding effective dates and/or if waivers or reimbursements are voluntary or by
contractual agreement. Absent waivers or reimbursements, the performance would have been lower.
West Virginia Teachers' Defined Contribution Plan - 98977-01 (Continu
98977-01 - Investment Options at a Glance
58

20The Fund has a Voluntary Expense Ratio Waiver in the amount of .08% which expires on 01-OCT-2015.
21Copyright 2014 Morningstar, Inc. All Rights Reserved. The information contained herein: (1) is proprietary to Morningstar and/or its content providers; (2) may not be copied or distributed; and (3) is not warranted to be accurate, complete or
timely. Neither Morningstar nor its content providers are responsible for any damages or losses arising from any use of this information. Past performance is no guarantee of future results.22
Putnam mutual funds are distributed by Putnam Investments, LLC and managed by Putnam Investment Management, LLC, both of which are affiliates of Great-West Life & Annuity Insurance Company and Great-West Life & Annuity Insurance
Company of New York and their subsidiaries and affiliates.23
The Great-West Trusts are collective trust funds maintained by trustee Great-West Trust Company, LLC and managed by its affiliate, Great-West Capital Management, LLC. The collective trust funds are not mutual funds and are exempt from
SEC registration and applicable securities laws of any state or other jurisdiction. Designed for and exclusively sold to qualified retirement plans and their participants, the funds are not available to individual retail investors. Please see the
Declaration of Trust and Participation Agreement documents for more information.24
The date in a target date fund's name represents an approximate date when an investor is expected to retire (which is assumed to be at age 65) and/or begins withdrawing money. The principal value of the funds is not guaranteed at any time,
including the target date. For more information, please refer to the fund prospectus and/or disclosure document.
West Virginia Teachers' Defined Contribution Plan - 98977-01 (Continued)
98977-01 - Investment Options at a Glance
59

GREAT-WEST LIFETIME ASSET ALLOCATION
TRUSTS
3Q2014
60
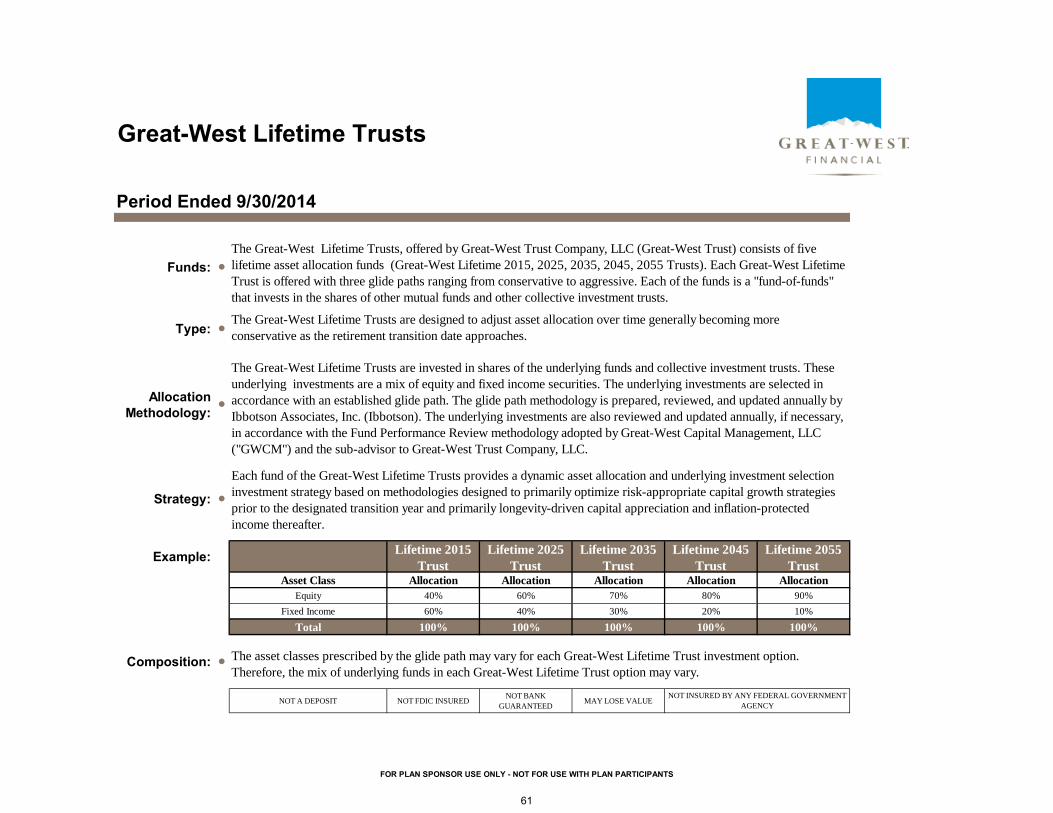
Great-West Lifetime Trusts
Period Ended 9/30/2014
Funds:
Type:
Allocation Methodology:
Strategy:
Example: Lifetime 2015 Trust
Lifetime 2025 Trust
Lifetime 2035 Trust
Lifetime 2045 Trust
Lifetime 2055 Trust
Asset Class Allocation Allocation Allocation Allocation AllocationEquity 40% 60% 70% 80% 90%
Fixed Income 60% 40% 30% 20% 10%
Total 100% 100% 100% 100% 100%
Composition:
NOT A DEPOSIT NOT FDIC INSURED NOT BANK GUARANTEED MAY LOSE VALUE
NOT INSURED BY ANY FEDERAL GOVERNMENT AGENCY
The asset classes prescribed by the glide path may vary for each Great-West Lifetime Trust investment option. Therefore, the mix of underlying funds in each Great-West Lifetime Trust option may vary.
Each fund of the Great-West Lifetime Trusts provides a dynamic asset allocation and underlying investment selection investment strategy based on methodologies designed to primarily optimize risk-appropriate capital growth strategies prior to the designated transition year and primarily longevity-driven capital appreciation and inflation-protected income thereafter.
The Great-West Lifetime Trusts, offered by Great-West Trust Company, LLC (Great-West Trust) consists of five lifetime asset allocation funds (Great-West Lifetime 2015, 2025, 2035, 2045, 2055 Trusts). Each Great-West Lifetime Trust is offered with three glide paths ranging from conservative to aggressive. Each of the funds is a "fund-of-funds" that invests in the shares of other mutual funds and other collective investment trusts.
The Great-West Lifetime Trusts are designed to adjust asset allocation over time generally becoming more conservative as the retirement transition date approaches.
The Great-West Lifetime Trusts are invested in shares of the underlying funds and collective investment trusts. These underlying investments are a mix of equity and fixed income securities. The underlying investments are selected in accordance with an established glide path. The glide path methodology is prepared, reviewed, and updated annually by Ibbotson Associates, Inc. (Ibbotson). The underlying investments are also reviewed and updated annually, if necessary, in accordance with the Fund Performance Review methodology adopted by Great-West Capital Management, LLC ("GWCM") and the sub-advisor to Great-West Trust Company, LLC.
FOR PLAN SPONSOR USE ONLY - NOT FOR USE WITH PLAN PARTICIPANTS
61

Great-West Lifetime TrustsAsset Class Ranges
Equity Fixed Income
Great-West Lifetime 2015 Trust I 30-50% 50-70%Great-West Lifetime 2015 Trust II 40-60% 40-60%Great-West Lifetime 2015 Trust III 50-70% 30-50%Great-West Lifetime 2025 Trust I 45-65% 35-55%
25 45%
The Great-West Lifetime Asset Allocation Trusts will always be invested within the ranges below:
Each of the Great-West Lifetime Trusts' asset allocations adjust from more aggressive to conservative over time. More aggressive Great-West Lifetime Trusts are weighted toward equities while more conservative funds are weighted towards fixed income investments.
Great-West Lifetime 2025 Trust II 55-75% 25-45%Great-West Lifetime 2025 Trust III 70-90% 10-30%Great-West Lifetime 2035 Trust I 60-90% 10-40%Great-West Lifetime 2035 Trust II 70-95% 5-30%Great-West Lifetime 2035 Trust III 80-98% 2-20%Great-West Lifetime 2045 Trust I 65-90% 10-35%Great-West Lifetime 2045 Trust II 75-95% 5-25%Great-West Lifetime 2045 Trust III 85-98% 2-15%Great-West Lifetime 2055 Trust I 65-95% 5-35%Great-West Lifetime 2055 Trust II 75-98% 2-25%Great-West Lifetime 2055 Trust III 85-98% 2-15%
NOT A DEPOSIT NOT FDIC INSURED NOT BANK GUARANTEED MAY LOSE VALUE
Asset allocations (within these ranges) are set on an annual basis and rebalanced back to target allocations monthly.
NOT INSURED BY ANY FEDERAL GOVERNMENT AGENCY
FOR PLAN SPONSOR USE ONLY - NOT FOR USE WITH PLAN PARTICIPANTS
62

Great-West Lifetime 2015 Trust II
Great-West Lifetime 2025 Trust II
Great-West Lifetime 2035 Trust II
Great-West Lifetime 2045 Trust II
Great-West Lifetime 2055 Trust II
International 7.35% 12.07% 18.60% 22.16% 23.83%MFS International Growth Equity CIT 1.66% 2.72% 4.18% 4.98% 5.36%
MFS International Value CIT 2.02% 3.32% 5.12% 6.10% 6.56%Blackrock EAFE Equity Index Fund F 3.67% 6.03% 9.30% 11.08% 11.91%
Alternative International 3.47% 5.08% 7.68% 9.80% 11.51%DFA Emerging Markets I 0.87% 1.65% 2.94% 4.00% 4.87%
Blackrock Emerging Markets Index Fund F 0.87% 1.65% 2.94% 4.00% 4.87%INVESCO Equity Global Real Estate Tr 1.73% 1.78% 1.80% 1.80% 1.77%
Alternative 5.48% 4.92% 4.40% 3.91% 3.44%INVESCO Equity Real Estate Tr 5.48% 4.92% 4.40% 3.91% 3.44%
Small Cap 3.58% 5.97% 9.25% 11.01% 11.77%Janus Triton N 0.62% 1.04% 1.62% 1.92% 2.06%
DFA US Targeted Value I 1.16% 1.94% 3.00% 3.58% 3.82%Blackrock Russell 2000 Index Fund F 1.80% 2.99% 4.63% 5.51% 5.89%
Mid Cap 6.94% 9.68% 12.81% 13.24% 12.43%Morgan Stanley Inst Mid Cap Growth I 1.21% 1.70% 2.24% 2.32% 2.17%American Century Mid Cap Value CIT 2.26% 3.14% 4.16% 4.30% 4.04%
Blackrock MidCap Equity Index Fund F 3.47% 4.84% 6.41% 6.62% 6.22%Large Cap 16.19% 22.57% 29.91% 30.91% 29.03%
American Century Large Cap Growth CIT 3.64% 5.08% 6.72% 6.96% 6.52%American Funds American Mutual R6 4.46% 6.20% 8.22% 8.50% 7.98%
Blackrock Equity Index Fund F 8.09% 11.29% 14.97% 15.45% 14.53%Bond 56.99% 39.71% 17.35% 8.97% 7.99%
Oppenheimer International Bond I 5.14% 4.56% 2.42% 1.48% 1.52%JPMCB High Yield Fund - CF 6.36% 5.25% 2.63% 1.49% 1.29%
American Century Infl-Adj Bond Instl 11.71% 5.20% 1.04% 0.00% 0.00%JPMCB Core Bond Fund - CF 12.54% 10.42% 5.24% 3.00% 2.59%
American Century Short Duration Instl 5.36% 2.38% 0.48% 0.00% 0.00%Federated Govt Obligs Instl 3.34% 1.48% 0.30% 0.00% 0.00%
Blackrock US Debt Index Fund F 12.54% 10.42% 5.24% 3.00% 2.59%
NOT A DEPOSIT NOT FDIC INSURED NOT BANK GUARANTEED MAY LOSE VALUE NOT INSURED BY ANY FEDERAL GOVERNMENT AGENCY
Current Allocations:
Great-West Lifetime Asset Allocation Trust - Moderate Glide PathAsset class ranges are used based on modeling completed in consultation with Ibbotson.
FOR PLAN SPONSOR USE ONLY - NOT FOR USE WITH PLAN PARTICIPANTS
63

SECUREFOUNDATION FUNDS
3Q2014
64

Great-West SecureFoundation Trusts
Period Ended 9/30/2014
Funds:
Type:
Allocation Methodology:
The Great-West SecureFoundation Trusts and the Great-West SecureFoundation Balanced Trust, offered by Great-West Trust Company, LLC ("Great-West Trust"), consist of ten asset allocation options (Great-West SecureFoundation Lifetime 2015, 2020, 2025, 2030, 2035, 2040, 2045, 2050, 2055 and Great-West SecureFoundation Balanced Trust). Each Trust is a "fund-of-funds" that invest in the shares of other mutual funds and collective investment trusts (CITs).
The Great-West SecureFoundation Trusts are designed to adjust asset allocation over time generally becoming more conservative as the retirement transition date approaches. The asset allocation of the Great-West SecureFoundation Balanced Trust will remain relatively consistent over time.
The Great-West SecureFoundation Trusts are invested in shares of the underlying investments. The underlying investments are a mix of equity and fixed income securities. The methodology for the Trusts are prepared, reviewed, and updated annually by Ibbotson Associates, Inc. (Ibbotson). The underlying investments are also reviewed and updated annually, if necessary, in accordance with the Fund Performance Review methodology adopted by Great-West Capital Management, LLC ("GWCM") and Great-West Trust Company, LLC.
Strategy:
\
SecureFoundation Guarantee
Information
Example:Great-West SF Lifetime 2015
Trust
Great-West SF Lifetime 2025
Trust
Great-West SF Lifetime 2035
Trust
Great-West SF Lifetime 2045
Trust
Great-West SF Lifetime 2055
Trust
Great-West SF Balanced Trust
Asset Class Allocation Allocation Allocation Allocation Allocation AllocationEquity 40% 60% 70% 80% 90% 50%
Fixed Income 60% 40% 30% 20% 10% 50%
Total 100% 100% 100% 100% 100% 100%
Composition:
NOT A DEPOSIT NOT FDIC INSURED NOT BANK GUARANTEED MAY LOSE VALUE NOT INSURED BY ANY FEDERAL GOVERNMENT AGENCY
Units of the funds can only be purchased in conjunction with the purchase and acceptance of a Guaranteed Lifetime Withdrawal Benefits (the "Guarantee") issued by Great-West Life & Annuity Insurance Company. The Guarantee is intended to provide a guaranteed income stream for life. The Guarantee goes into effect ten years prior to the date in the name of the applicable fund and also applies to the Orchard Trust SF Balanced Fund. The Guarantee does not guarantee the investment performance of the fund.
The asset classes prescribed by the glidepath may vary for each Great-West SecureFoundation Trust. Therefore, the mix of underlying investment options in each Great-West SecureFoundation Trust option may vary.
Each fund of the Great-West SecureFoundation Trusts provides a dynamic asset allocation and underlying investment selection strategy based on methodologies designed to primarily optimize risk-appropriate capital growth strategies prior to the designated transition year and primarily longevity-driven capital appreciation and inflation-protected income thereafter.
FOR PLAN SPONSOR USE ONLY - NOT FOR USE WITH PLAN PARTICIPANTS
65

Great-West SecureFoundation TrustsAsset Class Ranges
Equity Fixed Income
Great-West SF Lifetime 2015 Trust 50-70% 30-50%
The Great-West SecureFoundation Trusts will always be invested within the ranges below:
Each of the Great-West SecureFoundation Lifetime Trusts adjust from more aggressive to conservative over time. More aggressive Great-West SecureFoundation Lifetime Trusts are weighted toward equities while more conservative funds are weighted towards fixed income investments.
Great-West SF Lifetime 2020 Trust 50-70% 30-50%Great-West SF Lifetime 2025 Trust 55-75% 25-45%Great-West SF Lifetime 2030 Trust 70-90% 10-30%Great-West SF Lifetime 2035 Trust 70-95% 5-30%Great-West SF Lifetime 2040 Trust 70-95% 5-30%Great-West SF Lifetime 2045 Trust 75-95% 5-25%Great-West SF Lifetime 2050 Trust 75-98% 2-25%Great-West SF Lifetime 2055 Trust 75-98% 2-25%
Great-West SF Balanced Trust 50-70% 30-50%
NOT A DEPOSIT NOT FDIC INSURED NOT BANK GUARANTEED MAY LOSE VALUE
Asset allocations (within these ranges) are set on an annual basis and rebalanced back to target allocations monthly.
NOT INSURED BY ANY FEDERAL GOVERNMENT AGENCY
FOR PLAN SPONSOR USE ONLY - NOT FOR USE WITH PLAN PARTICIPANTS
66

Great-West SecureFoundation Trusts
Target Date funds asset class ranges are used based on modeling completed in consultation with Ibbotson.
Great-West SF Lifetime 2015
Great-West SF Lifetime 2020
Great-West SF Lifetime 2025
Great-West SF Lifetime 2030
Great-West SF Lifetime 2035
Blackrock Equity Index Fund F 23.92% 23.92% 25.40% 29.35% 32.33%Blackrock MidCap Equity Index Fund F 10.25% 10.25% 10.88% 12.58% 13.86%
Blackrock Russell 2000 Index Fund F 6.13% 6.13% 6.72% 8.42% 10.00%Blackrock EAFE Equity Index Fund F 13.51% 13.51% 14.74% 18.21% 21.37%
Blackrock Emerging Markets Index Fund F 2.16% 2.16% 2.54% 3.72% 5.08%
Current Allocations:
ac oc e g g a ets de u d 6% 6% 5 % 3 % 5 08%Blackrock US Debt Index Fund F 38.89% 38.89% 35.53% 25.56% 16.49%
Federated Govt Obligs Instl 5.14% 5.14% 4.19% 2.16% 0.87%
Great-West SF Lifetime 2040
Great-West SF Lifetime 2045
Great-West SF Lifetime 2050
Great-West SF Lifetime 2055
Great-West SF Balanced Portfolio
Blackrock Equity Index Fund F 33.45% 32.99% 31.93% 30.76% 27.00%Blackrock MidCap Equity Index Fund F 14.34% 14.13% 13.68% 13.18% 11.00%
Blackrock Russell 2000 Index Fund F 11.13% 11.75% 12.16% 12.49% 9.00%Blackrock EAFE Equity Index Fund F 23.50% 24.54% 25.13% 25.54% 12.00%
Blackrock Emerging Markets Index Fund F 6.42% 7.62% 8.81% 10.03% 3.00%Blackrock US Debt Index Fund F 10.91% 8.97% 8.29% 8.00% 38.00%
Federated Govt Obligs Instl 0.25% 0.00% 0.00% 0.00% 0.00%
NOT A DEPOSIT NOT FDIC INSURED NOT BANK GUARANTEED MAY LOSE VALUE NOT INSURED BY ANY FEDERAL GOVERNMENT AGENCY
FOR PLAN SPONSOR USE ONLY - NOT FOR USE WITH PLAN PARTICIPANTS
67

3. Foreign investments involve special risks, including currency fluctuations and political developments.
4. Specialty funds limit the number of issuers in which they invest and are generally non-diversified.
5. Equity securities of small-sized companies may be more volatile than securities of larger, more established companies.
6. Index funds are not provided an overall rating as their objective is to track their respective index, not to outperform managed funds.
7. An investment in a money market fund, if part of the fund lineup, is not insured or guaranteed by the Federal Deposit Insurance Corporation. Although the fund seeks to preserve the value of your investment at $1.00 per share, it is possible to lose money by investing in the fund.
8. Equity securities of medium-sized companies may be more volatile than securities of larger, more established companies.
9. A bond fund's yield, share price, and total return change daily and are based on changes in interest rates, market conditions, economic and political news, and the quality and maturity of its investments. In general, bond prices fall when interest rates rise, and vice versa.
12. Compared to higher-rated securities, high yield bond investment options are subject to greater risk, including the risk of default.
Disclosures
NOT A DEPOSIT NOT FDIC INSURED NOT BANK GUARANTEED MAY LOSE VALUE
1. Since these are collective investments that invest directly in the Underlying Funds, all risks associated with the eligible Underlying Funds apply to these collective investments. To the extent a collective investment invests more of its assets in one Underlying Fund than another, the collective investment will have greater exposure to the risks of that Underlying Fund.
2. Since the collective investment invests in Underlying Funds, you will bear your proportionate share of expenses of the collective investment and indirectly of the Underlying Funds, resulting in an additional layer of expenses.
10. Equity securities of companies located in emerging markets involve greater risk than investing in more established markets, including currency fluctations, political developments and share illiquidity.
11. Real estate securities involve greater risks than other non-diversified investments, including, but not limited to: declining property values, varying economic conditions, changes in zoning laws, or losses from casualty. Real estate securities that invest in foreign real estate involve additional risk, including currency fluctuations and political developments.
The Great-West Trusts are offered by Great-West Trust Company, LLC.Core securities, when offered, are offered through GWFS Equities, Inc. and/or other broker dealers. GWFS Equities, Inc., Member FINRA/SIPC is a wholly owned subsidiary of Great-West Life & Annuity Insurance Company.
Great-West FinancialSM refers to products and services provided by Great-West Life & Annuity Insurance Company (GWL&A), Corporate Headquarters: Greenwood Village, CO; Great-West Life & Annuity Insurance Company of New York, Home Office: White Plains, NY; its subsidiaries and affiliates including Great-West Trust Company and Great-West Capital Management, LLC. Ibbotson Associates, Inc., is a registered investment adviser and a subsidiary of Morningstar, Inc. Ibbotson Associates and Morningstar are not affiliated with Great-West Trust Company, LLC, its parent company Great-West Life & Annuity Insurance Company, or any other affiliated companies and/or subsidiaries. 09/2013 (PT #180540)
NOT INSURED BY ANY FEDERAL GOVERNMENT AGENCY
FOR PLAN SPONSOR USE ONLY - NOT FOR USE WITH PLAN PARTICIPANTS
68

FUND ANALYTICS
3Q2014
69
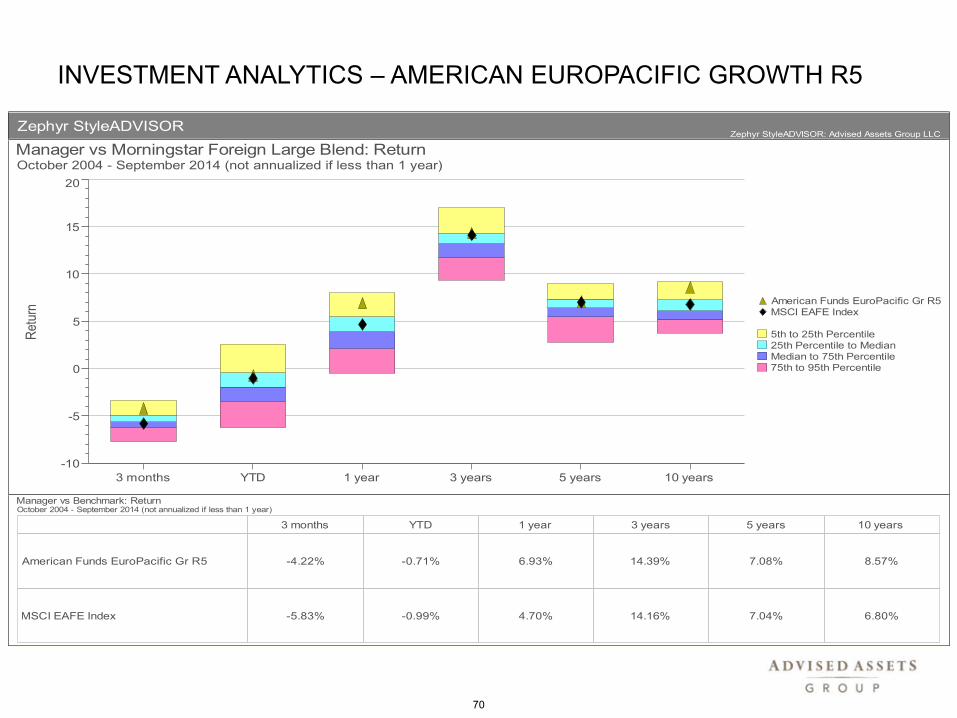
INVESTMENT ANALYTICS – AMERICAN EUROPACIFIC GROWTH R5
Zephyr StyleADVISORZephyr StyleADVISOR: Advised Assets Group LLC
Manager vs Morningstar Foreign Large Blend: ReturnOctober 2004 - September 2014 (not annualized if less than 1 year)
Ret
urn
-10
-5
0
5
10
15
20
3 months YTD 1 year 3 years 5 years 10 years
American Funds EuroPacific Gr R5MSCI EAFE Index
5th to 25th Percentile25th Percentile to MedianMedian to 75th Percentile75th to 95th Percentile
Manager vs Benchmark: ReturnOctober 2004 - September 2014 (not annualized if less than 1 year)
American Funds EuroPacific Gr R5
MSCI EAFE Index
3 months YTD 1 year 3 years 5 years 10 years
-4.22% -0.71% 6.93% 14.39% 7.08% 8.57%
-5.83% -0.99% 4.70% 14.16% 7.04% 6.80%
70

INVESTMENT ANALYTICS – AMERICAN EUROPACIFIC GROWTH R5
Risk AnalysisZephyr StyleADVISOR: Advised Assets Group LLC
Manager StyleOctober 2009 - September 2014 (36-Month Moving Windows, Computed Monthly)
MSCI THE WORLD INDEX VALUE MSCI THE WORLD INDEX GROWTH
MSCI EM (EMERGING MARKETS) VALUE MSCI EM (EMERGING MARKETS) GROWTH
Emerging
-1
0
1
Developed
Value -1 0 1 Growth
American Funds EuroPacific Gr R5
MSCI World Style Indexes
Risk / ReturnOctober 2009 - September 2014 (Single Computation)
Ret
urn
0%
1%
2%
3%
4%
5%
6%
7%
8%
Standard Deviation
0% 2% 4% 6% 8% 10% 12% 14% 16% 18%
American Funds EuroPacific Gr R5
Market Benchmark:
MSCI EAFE Index
Upside / DownsideOctober 2009 - September 2014 (Single Computation)
Ups
ide%
90
92
94
96
98
100
102
104
106
108
110
Downside%
90 92 94 96 98 100 102 104 106 108 110
American Funds EuroPacific Gr R5
MSCI EAFE Index
Calendar Year ReturnAs of September 2014
American Funds EuroPacific Gr R5
MSCI EAFE Index
-15%
-10%
-5%
0%
5%
10%
15%
20%
25%
YTD 2013 2012 2011 2010
Portfolio StatisticsOctober 2009 - September 2014: Summary Statistics
American Funds EuroPacific Gr R5
MSCI EAFE Index
CumulativeReturn
Alphavs.
Market
Alphavs.
Style
Betavs.
Market
Betavs.
Style
R-Squaredvs.
Market
R-Squaredvs.
Style
SharpeRatio
StandardDeviation
40.77% 0.45% -8.37% 0.94 1.06 95.34% 82.06% 0.44 15.93%
40.52% 0.00% -8.26% 1.00 1.07 100.00% 76.22% 0.42 16.60%
71

INVESTMENT ANALYTICS – FRANKLIN MUTUAL GLOBAL DISCOVERY Z
Zephyr StyleADVISORZephyr StyleADVISOR: Advised Assets Group LLC
Manager vs Morningstar World Stock: ReturnOctober 2004 - September 2014 (not annualized if less than 1 year)
Ret
urn
-10
-5
0
5
10
15
20
25
3 months YTD 1 year 3 years 5 years 10 years
Mutual Global Discovery ZMSCI World Index
5th to 25th Percentile25th Percentile to MedianMedian to 75th Percentile75th to 95th Percentile
Manager vs Benchmark: ReturnOctober 2004 - September 2014 (not annualized if less than 1 year)
Mutual Global Discovery Z
MSCI World Index
3 months YTD 1 year 3 years 5 years 10 years
-1.92% 4.28% 12.12% 17.70% 10.66% 9.85%
-2.05% 4.33% 12.80% 18.60% 11.47% 7.71%
72

INVESTMENT ANALYTICS – FRANKLIN MUTUAL GLOBAL DISCOVERY Z
Risk AnalysisZephyr StyleADVISOR: Advised Assets Group LLC
Manager StyleOctober 2009 - September 2014 (36-Month Moving Windows, Computed Monthly)
MSCI THE WORLD INDEX VALUE MSCI THE WORLD INDEX GROWTH
MSCI EM (EMERGING MARKETS) VALUE MSCI EM (EMERGING MARKETS) GROWTH
Emerging
-1
0
1
Developed
Value -1 0 1 Growth
Mutual Global Discovery Z
MSCI World Style Indexes
Risk / ReturnOctober 2009 - September 2014 (Single Computation)
Ret
urn
0%
2%
4%
6%
8%
10%
12%
Standard Deviation
0% 2% 4% 6% 8% 10% 12% 14%
Mutual Global Discovery Z
Market Benchmark:
MSCI World Index
Upside / DownsideOctober 2009 - September 2014 (Single Computation)
Ups
ide%
70
80
90
100
110
120
130
Downside%
70 80 90 100 110 120 130
Mutual Global Discovery Z
MSCI World Index
Calendar Year ReturnAs of September 2014
Mutual Global Discovery Z
MSCI World Index
-5%
0%
5%
10%
15%
20%
25%
30%
YTD 2013 2012 2011 2010
Portfolio StatisticsOctober 2009 - September 2014: Summary Statistics
Mutual Global Discovery Z
MSCI World Index
CumulativeReturn
Alphavs.
Market
Alphavs.
Style
Betavs.
Market
Betavs.
Style
R-Squaredvs.
Market
R-Squaredvs.
Style
SharpeRatio
StandardDeviation
65.95% 2.13% 2.15% 0.73 1.00 92.04% 92.69% 0.98 10.85%
72.14% 0.00% -0.02% 1.00 1.00 100.00% 100.00% 0.79 14.36%
73
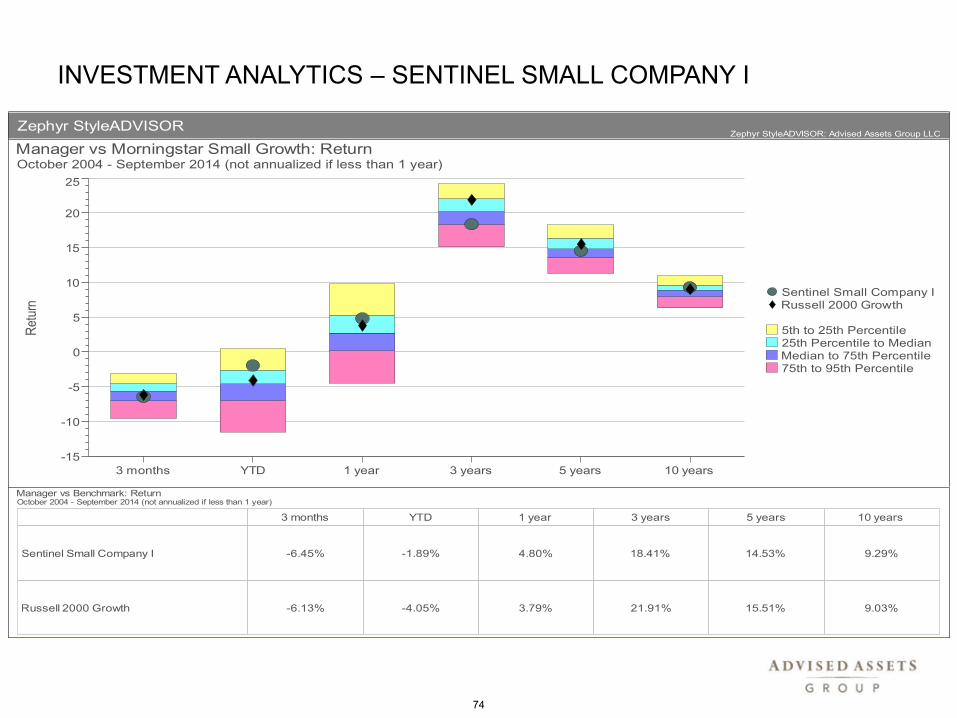
INVESTMENT ANALYTICS – SENTINEL SMALL COMPANY I
Zephyr StyleADVISORZephyr StyleADVISOR: Advised Assets Group LLC
Manager vs Morningstar Small Growth: ReturnOctober 2004 - September 2014 (not annualized if less than 1 year)
Ret
urn
-15
-10
-5
0
5
10
15
20
25
3 months YTD 1 year 3 years 5 years 10 years
Sentinel Small Company IRussell 2000 Growth
5th to 25th Percentile25th Percentile to MedianMedian to 75th Percentile75th to 95th Percentile
Manager vs Benchmark: ReturnOctober 2004 - September 2014 (not annualized if less than 1 year)
Sentinel Small Company I
Russell 2000 Growth
3 months YTD 1 year 3 years 5 years 10 years
-6.45% -1.89% 4.80% 18.41% 14.53% 9.29%
-6.13% -4.05% 3.79% 21.91% 15.51% 9.03%
74

INVESTMENT ANALYTICS – SENTINEL SMALL COMPANY I
Risk AnalysisZephyr StyleADVISOR: Advised Assets Group LLC
Manager StyleOctober 2009 - September 2014 (36-Month Moving Windows, Computed Monthly)
Russell 1000 Value Russell 1000 Growth
Russell 2000 Value Russell 2000 Growth
Small
-1
0
1
Large
Value -1 0 1 Growth
Sentinel Small Company I
Russell Generic Corners
Risk / ReturnOctober 2009 - September 2014 (Single Computation)
Ret
urn
0%
2%
4%
6%
8%
10%
12%
14%
16%
Standard Deviation
0% 2% 4% 6% 8% 10% 12% 14% 16% 18% 20%
Sentinel Small Company I
Market Benchmark:
Russell 2000 Growth
Upside / DownsideOctober 2009 - September 2014 (Single Computation)
Ups
ide%
70
80
90
100
110
120
130
Downside%
70 80 90 100 110 120 130
Sentinel Small Company I
Russell 2000 Growth
Calendar Year ReturnAs of September 2014
Sentinel Small Company I
Russell 2000 Growth
0%
10%
20%
30%
40%
50%
YTD 2013 2012 2011 2010
Portfolio StatisticsOctober 2009 - September 2014: Summary Statistics
Sentinel Small Company I
Russell 2000 Growth
CumulativeReturn
Alphavs.
Market
Alphavs.
Style
Betavs.
Market
Betavs.
Style
R-Squaredvs.
Market
R-Squaredvs.
Style
SharpeRatio
StandardDeviation
97.06% 2.64% 0.98% 0.74 1.00 93.52% 95.45% 0.99 14.62%
105.65% 0.00% 0.00% 1.00 1.00 100.00% 100.00% 0.81 19.05%
75

INVESTMENT ANALYTICS – HEARTLAND VALUE PLUS INST
Zephyr StyleADVISORZephyr StyleADVISOR: Advised Assets Group LLC
Manager vs Morningstar Small Value: ReturnOctober 2004 - September 2014 (not annualized if less than 1 year)
Ret
urn
-10
-5
0
5
10
15
20
25
30
3 months YTD 1 year 3 years 5 years 10 years
Heartland Value Plus InstRussell 2000 Value
5th to 25th Percentile25th Percentile to MedianMedian to 75th Percentile75th to 95th Percentile
Manager vs Benchmark: ReturnOctober 2004 - September 2014 (not annualized if less than 1 year)
Heartland Value Plus Inst
Russell 2000 Value
3 months YTD 1 year 3 years 5 years 10 years
-10.32% -5.43% 5.55% 18.27% 12.92% 9.01%
-8.58% -4.74% 4.12% 20.61% 13.02% 7.25%
76

INVESTMENT ANALYTICS – HEARTLAND VALUE PLUS INST
Risk AnalysisZephyr StyleADVISOR: Advised Assets Group LLC
Manager StyleOctober 2009 - September 2014 (36-Month Moving Windows, Computed Monthly)
Russell 1000 Value Russell 1000 Growth
Russell 2000 Value Russell 2000 Growth
Small
-1
0
1
Large
Value -1 0 1 Growth
Heartland Value Plus Inst
Russell Generic Corners
Risk / ReturnOctober 2009 - September 2014 (Single Computation)
Ret
urn
0%
2%
4%
6%
8%
10%
12%
14%
Standard Deviation
0% 2% 4% 6% 8% 10% 12% 14% 16% 18% 20%
Heartland Value Plus Inst
Market Benchmark:
Russell 2000 Value
Upside / DownsideOctober 2009 - September 2014 (Single Computation)
Ups
ide%
96
98
100
102
104
Downside%
96 98 100 102 104
Heartland Value Plus Inst
Russell 2000 Value
Calendar Year ReturnAs of September 2014
Heartland Value Plus Inst
Russell 2000 Value
-5%
0%
5%
10%
15%
20%
25%
30%
35%
YTD 2013 2012 2011 2010
Portfolio StatisticsOctober 2009 - September 2014: Summary Statistics
Heartland Value Plus Inst
Russell 2000 Value
CumulativeReturn
Alphavs.
Market
Alphavs.
Style
Betavs.
Market
Betavs.
Style
R-Squaredvs.
Market
R-Squaredvs.
Style
SharpeRatio
StandardDeviation
83.60% 0.01% -1.00% 1.00 1.03 93.01% 93.64% 0.68 18.81%
84.45% 0.00% 0.00% 1.00 1.00 100.00% 100.00% 0.72 18.10%
77

INVESTMENT ANALYTICS – AMERICAN CENTURY HERITAGE INV
Zephyr StyleADVISORZephyr StyleADVISOR: Advised Assets Group LLC
Manager vs Morningstar Mid-Cap Growth: ReturnOctober 2004 - September 2014 (not annualized if less than 1 year)
Ret
urn
-5
0
5
10
15
20
25
3 months YTD 1 year 3 years 5 years 10 years
American Century Heritage InvRussell Midcap Growth
5th to 25th Percentile25th Percentile to MedianMedian to 75th Percentile75th to 95th Percentile
Manager vs Benchmark: ReturnOctober 2004 - September 2014 (not annualized if less than 1 year)
American Century Heritage Inv
Russell Midcap Growth
3 months YTD 1 year 3 years 5 years 10 years
-1.62% 2.67% 9.11% 18.92% 15.00% 12.62%
-0.73% 5.73% 14.43% 22.74% 17.12% 10.24%
78
INVESTMENT ANALYTICS – AMERICAN CENTURY HERITAGE INV
Risk AnalysisZephyr StyleADVISOR: Advised Assets Group LLC
Manager StyleOctober 2009 - September 2014 (36-Month Moving Windows, Computed Monthly)
Russell 1000 Value Russell 1000 Growth
Russell 2000 Value Russell 2000 Growth
Small
-1
0
1
Large
Value -1 0 1 Growth
American Century Heritage Inv
Russell Generic Corners
Risk / ReturnOctober 2009 - September 2014 (Single Computation)
Ret
urn
0%
2%
4%
6%
8%
10%
12%
14%
16%
18%
Standard Deviation
0% 2% 4% 6% 8% 10% 12% 14% 16% 18%
American Century Heritage Inv
Market Benchmark:
Russell Midcap Grow th
Upside / DownsideOctober 2009 - September 2014 (Single Computation)
Ups
ide%
85
90
95
100
105
110
115
Downside%
85 90 95 100 105 110 115
American Century Heritage Inv
Russell Midcap Grow th
Calendar Year ReturnAs of September 2014
American Century Heritage Inv
Russell Midcap Grow th
-10%
0%
10%
20%
30%
40%
YTD 2013 2012 2011 2010
Portfolio StatisticsOctober 2009 - September 2014: Summary Statistics
American Century Heritage Inv
Russell Midcap Growth
CumulativeReturn
Alphavs.
Market
Alphavs.
Style
Betavs.
Market
Betavs.
Style
R-Squaredvs.
Market
R-Squaredvs.
Style
SharpeRatio
StandardDeviation
101.10% -2.63% -1.43% 1.06 1.03 94.66% 92.51% 0.86 17.25%
120.41% 0.00% 0.82% 1.00 1.00 100.00% 97.85% 1.08 15.82%
79

INVESTMENT ANALYTICS – SCOUT MID CAP
Zephyr StyleADVISORZephyr StyleADVISOR: Advised Assets Group LLC
Manager vs Morningstar Mid-Cap Blend: ReturnNovember 2006 - September 2014 (not annualized if less than 1 year)
Ret
urn
-5
0
5
10
15
20
25
30
3 months YTD 1 year 3 years 5 years
Scout Mid CapRussell Midcap
5th to 25th Percentile25th Percentile to MedianMedian to 75th Percentile75th to 95th Percentile
Manager vs Benchmark: ReturnNovember 2006 - September 2014 (not annualized if less than 1 year)
Scout Mid Cap
Russell Midcap
3 months YTD 1 year 3 years 5 years
-2.61% 2.75% 12.54% 18.67% 16.65%
-1.66% 6.87% 15.83% 23.79% 17.19%
80
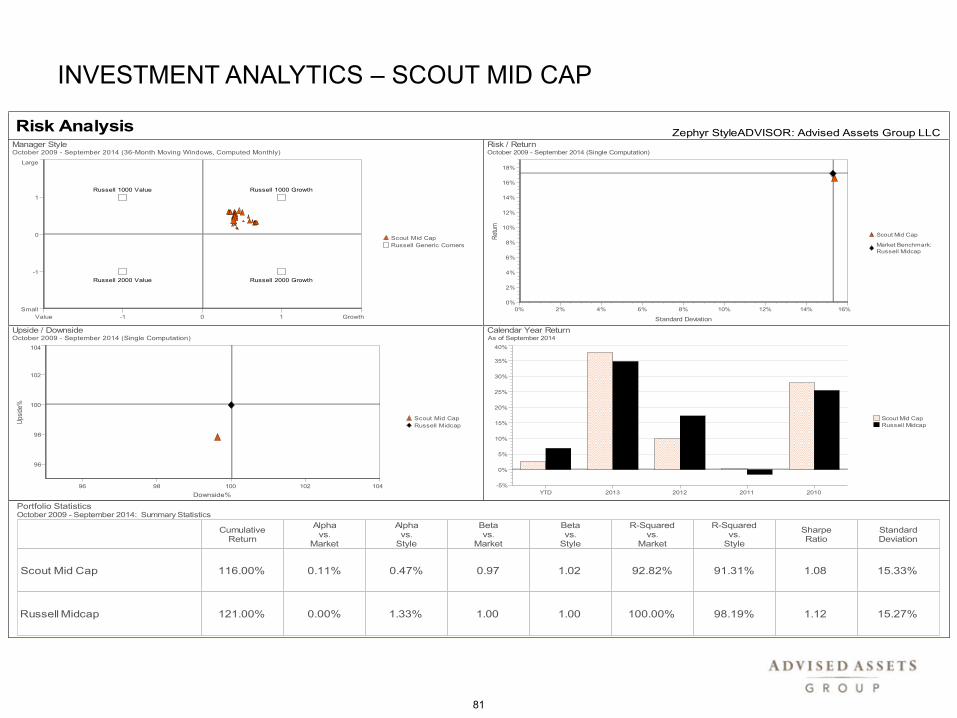
INVESTMENT ANALYTICS – SCOUT MID CAP
Risk AnalysisZephyr StyleADVISOR: Advised Assets Group LLC
Manager StyleOctober 2009 - September 2014 (36-Month Moving Windows, Computed Monthly)
Russell 1000 Value Russell 1000 Growth
Russell 2000 Value Russell 2000 Growth
Small
-1
0
1
Large
Value -1 0 1 Growth
Scout Mid Cap
Russell Generic Corners
Risk / ReturnOctober 2009 - September 2014 (Single Computation)
Ret
urn
0%
2%
4%
6%
8%
10%
12%
14%
16%
18%
Standard Deviation
0% 2% 4% 6% 8% 10% 12% 14% 16%
Scout Mid Cap
Market Benchmark:
Russell Midcap
Upside / DownsideOctober 2009 - September 2014 (Single Computation)
Ups
ide%
96
98
100
102
104
Downside%
96 98 100 102 104
Scout Mid Cap
Russell Midcap
Calendar Year ReturnAs of September 2014
Scout Mid Cap
Russell Midcap
-5%
0%
5%
10%
15%
20%
25%
30%
35%
40%
YTD 2013 2012 2011 2010
Portfolio StatisticsOctober 2009 - September 2014: Summary Statistics
Scout Mid Cap
Russell Midcap
CumulativeReturn
Alphavs.
Market
Alphavs.
Style
Betavs.
Market
Betavs.
Style
R-Squaredvs.
Market
R-Squaredvs.
Style
SharpeRatio
StandardDeviation
116.00% 0.11% 0.47% 0.97 1.02 92.82% 91.31% 1.08 15.33%
121.00% 0.00% 1.33% 1.00 1.00 100.00% 98.19% 1.12 15.27%
81

INVESTMENT ANALYTICS – FIDELITY NEW MILLENNUM
Zephyr StyleADVISORZephyr StyleADVISOR: Advised Assets Group LLC
Manager vs Morningstar Large Growth: ReturnOctober 2004 - September 2014 (not annualized if less than 1 year)
Ret
urn
-5
0
5
10
15
20
25
3 months YTD 1 year 3 years 5 years 10 years
Fidelity® New MillenniumRussell 1000 Growth
5th to 25th Percentile25th Percentile to MedianMedian to 75th Percentile75th to 95th Percentile
Manager vs Benchmark: ReturnOctober 2004 - September 2014 (not annualized if less than 1 year)
Fidelity® New Millennium
Russell 1000 Growth
3 months YTD 1 year 3 years 5 years 10 years
-2.21% 4.75% 14.71% 22.05% 16.06% 10.59%
1.49% 7.89% 19.15% 22.45% 16.50% 8.94%
82

INVESTMENT ANALYTICS – FIDELITY NEW MILLENNUM
Risk AnalysisZephyr StyleADVISOR: Advised Assets Group LLC
Manager StyleOctober 2009 - September 2014 (36-Month Moving Windows, Computed Monthly)
Russell 1000 Value Russell 1000 Growth
Russell 2000 Value Russell 2000 Growth
Small
-1
0
1
Large
Value -1 0 1 Growth
Fidelity® New Millennium
Russell Generic Corners
Risk / ReturnOctober 2009 - September 2014 (Single Computation)
Ret
urn
0%
2%
4%
6%
8%
10%
12%
14%
16%
18%
Standard Deviation
0% 2% 4% 6% 8% 10% 12% 14% 16%
Fidelity® New Millennium
Market Benchmark:
Russell 1000 Growth
Upside / DownsideOctober 2009 - September 2014 (Single Computation)
Ups
ide%
94
96
98
100
102
104
106
Downside%
94 96 98 100 102 104 106
Fidelity® New Millennium
Russell 1000 Growth
Calendar Year ReturnAs of September 2014
Fidelity® New Millennium
Russell 1000 Growth
0%
5%
10%
15%
20%
25%
30%
35%
40%
YTD 2013 2012 2011 2010
Portfolio StatisticsOctober 2009 - September 2014: Summary Statistics
Fidelity® New Millennium
Russell 1000 Growth
CumulativeReturn
Alphavs.
Market
Alphavs.
Style
Betavs.
Market
Betavs.
Style
R-Squaredvs.
Market
R-Squaredvs.
Style
SharpeRatio
StandardDeviation
110.55% -0.31% 1.44% 1.00 1.01 90.53% 95.25% 1.11 14.38%
114.63% 0.00% 0.00% 1.00 1.00 100.00% 100.00% 1.20 13.66%
83

INVESTMENT ANALYTICS – PUTNAM EQUITY INCOME Y
Zephyr StyleADVISORZephyr StyleADVISOR: Advised Assets Group LLC
Manager vs Morningstar Large Value: ReturnOctober 2004 - September 2014 (not annualized if less than 1 year)
Ret
urn
-5
0
5
10
15
20
25
30
3 months YTD 1 year 3 years 5 years 10 years
Putnam Equity Income YRussell 1000 Value
5th to 25th Percentile25th Percentile to MedianMedian to 75th Percentile75th to 95th Percentile
Manager vs Benchmark: ReturnOctober 2004 - September 2014 (not annualized if less than 1 year)
Putnam Equity Income Y
Russell 1000 Value
3 months YTD 1 year 3 years 5 years 10 years
-0.57% 7.60% 17.74% 24.53% 14.86% 9.45%
-0.19% 8.07% 18.89% 23.93% 15.26% 7.84%
84

INVESTMENT ANALYTICS – PUTNAM EQUITY INCOME Y
Risk AnalysisZephyr StyleADVISOR: Advised Assets Group LLC
Manager StyleOctober 2009 - September 2014 (36-Month Moving Windows, Computed Monthly)
Russell 1000 Value Russell 1000 Growth
Russell 2000 Value Russell 2000 Growth
Small
-1
0
1
Large
Value -1 0 1 Growth
Putnam Equity Income Y
Russell Generic Corners
Risk / ReturnOctober 2009 - September 2014 (Single Computation)
Ret
urn
0%
2%
4%
6%
8%
10%
12%
14%
16%
Standard Deviation
0% 2% 4% 6% 8% 10% 12% 14% 16%
Putnam Equity Income Y
Market Benchmark:
Russell 1000 Value
Upside / DownsideOctober 2009 - September 2014 (Single Computation)
Ups
ide%
96
97
98
99
100
101
102
103
104
Downside%
96 97 98 99 100 101 102 103 104
Putnam Equity Income Y
Russell 1000 Value
Calendar Year ReturnAs of September 2014
Putnam Equity Income Y
Russell 1000 Value
0%
5%
10%
15%
20%
25%
30%
35%
YTD 2013 2012 2011 2010
Portfolio StatisticsOctober 2009 - September 2014: Summary Statistics
Putnam Equity Income Y
Russell 1000 Value
CumulativeReturn
Alphavs.
Market
Alphavs.
Style
Betavs.
Market
Betavs.
Style
R-Squaredvs.
Market
R-Squaredvs.
Style
SharpeRatio
StandardDeviation
99.91% -0.84% -0.83% 1.04 1.03 96.75% 96.98% 1.02 14.48%
103.38% 0.00% 0.00% 1.00 1.00 100.00% 100.00% 1.11 13.71%
85

INVESTMENT ANALYTICS – PIMCO TOTAL RETURN ADMIN
Zephyr StyleADVISORZephyr StyleADVISOR: Advised Assets Group LLC
Manager vs Morningstar Intermediate-Term Bond: ReturnOctober 2004 - September 2014 (not annualized if less than 1 year)
Ret
urn
-1
0
1
2
3
4
5
6
7
3 months YTD 1 year 3 years 5 years 10 years
PIMCO Total Return AdminBarclays Capital U.S. Aggregate
5th to 25th Percentile25th Percentile to Median
Median to 75th Percentile75th to 95th Percentile
Manager vs Benchmark: ReturnOctober 2004 - September 2014 (not annualized if less than 1 year)
PIMCO Total Return Admin
Barclays Capital U.S. Aggregate
3 months YTD 1 year 3 years 5 years 10 years
-0.42% 3.14% 3.04% 4.30% 4.81% 5.73%
0.17% 4.10% 3.96% 2.43% 4.12% 4.62%
86
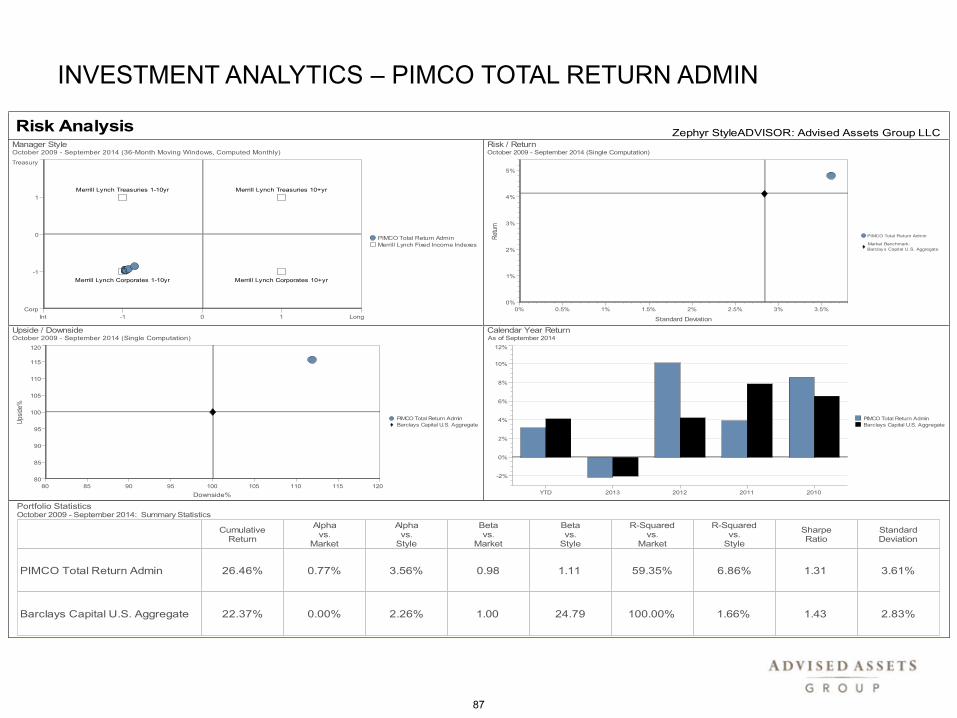
INVESTMENT ANALYTICS – PIMCO TOTAL RETURN ADMIN
Risk AnalysisZephyr StyleADVISOR: Advised Assets Group LLC
Manager StyleOctober 2009 - September 2014 (36-Month Moving Windows, Computed Monthly)
Merrill Lynch Treasuries 1-10yr Merrill Lynch Treasuries 10+yr
Merrill Lynch Corporates 1-10yr Merrill Lynch Corporates 10+yr
Corp
-1
0
1
Treasury
Int -1 0 1 Long
PIMCO Total Return Admin
Merrill Lynch Fixed Income Indexes
Risk / ReturnOctober 2009 - September 2014 (Single Computation)
Ret
urn
0%
1%
2%
3%
4%
5%
Standard Deviation
0% 0.5% 1% 1.5% 2% 2.5% 3% 3.5%
PIMCO Total Return Admin
Market Benchmark:
Barclay s Capital U.S. Aggregate
Upside / DownsideOctober 2009 - September 2014 (Single Computation)
Ups
ide%
80
85
90
95
100
105
110
115
120
Downside%
80 85 90 95 100 105 110 115 120
PIMCO Total Return Admin
Barclays Capital U.S. Aggregate
Calendar Year ReturnAs of September 2014
PIMCO Total Return Admin
Barclays Capital U.S. Aggregate
-2%
0%
2%
4%
6%
8%
10%
12%
YTD 2013 2012 2011 2010
Portfolio StatisticsOctober 2009 - September 2014: Summary Statistics
PIMCO Total Return Admin
Barclays Capital U.S. Aggregate
CumulativeReturn
Alphavs.
Market
Alphavs.
Style
Betavs.
Market
Betavs.
Style
R-Squaredvs.
Market
R-Squaredvs.
Style
SharpeRatio
StandardDeviation
26.46% 0.77% 3.56% 0.98 1.11 59.35% 6.86% 1.31 3.61%
22.37% 0.00% 2.26% 1.00 24.79 100.00% 1.66% 1.43 2.83%
87

INVESTMENT ANALYTICS – TIAA-CREF HIGH-YIELD INSTL
Zephyr StyleADVISORZephyr StyleADVISOR: Advised Assets Group LLC
Manager vs Morningstar High Yield Bond: ReturnApril 2006 - September 2014 (not annualized if less than 1 year)
Ret
urn
-4
-2
0
2
4
6
8
10
12
14
3 months YTD 1 year 3 years 5 years
TIAA-CREF High-Yield Inst
Credit Suisse High Yield Index
5th to 25th Percentile25th Percentile to Median
Median to 75th Percentile
75th to 95th Percentile
Manager vs Benchmark: ReturnApril 2006 - September 2014 (not annualized if less than 1 year)
TIAA-CREF High-Yield Inst
Credit Suisse High Yield Index
3 months YTD 1 year 3 years 5 years
-2.05% 3.20% 6.98% 10.28% 9.67%
-1.94% 3.50% 7.06% 10.61% 10.35%
88
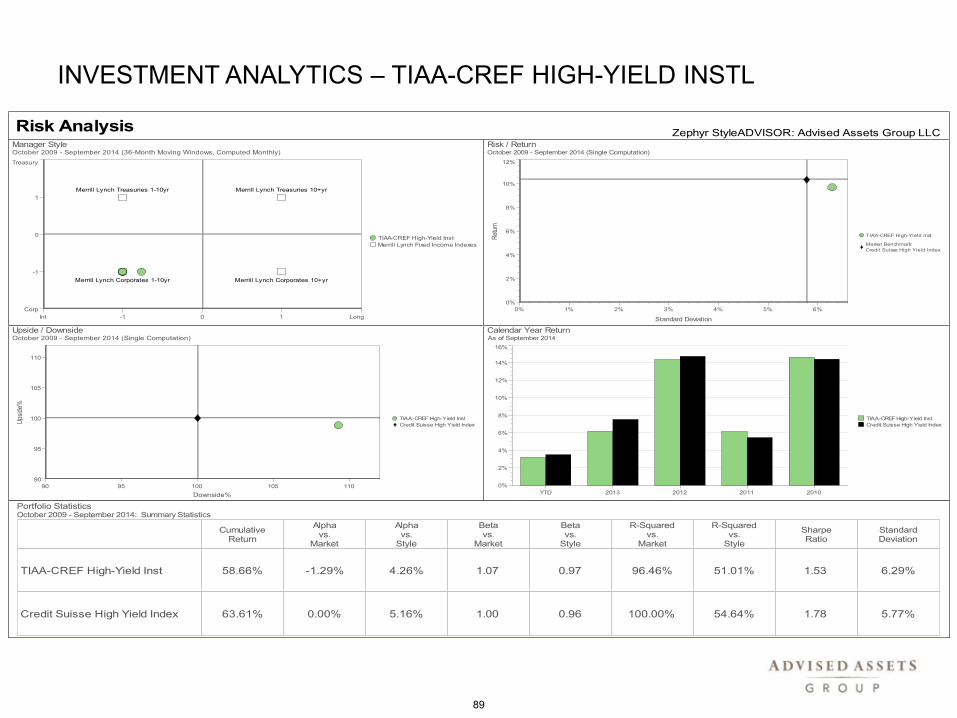
INVESTMENT ANALYTICS – TIAA-CREF HIGH-YIELD INSTL
Risk AnalysisZephyr StyleADVISOR: Advised Assets Group LLC
Manager StyleOctober 2009 - September 2014 (36-Month Moving Windows, Computed Monthly)
Merrill Lynch Treasuries 1-10yr Merrill Lynch Treasuries 10+yr
Merrill Lynch Corporates 1-10yr Merrill Lynch Corporates 10+yr
Corp
-1
0
1
Treasury
Int -1 0 1 Long
TIAA-CREF High-Yield Inst
Merrill Lynch Fixed Income Indexes
Risk / ReturnOctober 2009 - September 2014 (Single Computation)
Ret
urn
0%
2%
4%
6%
8%
10%
12%
Standard Deviation
0% 1% 2% 3% 4% 5% 6%
TIAA-CREF High-Yield Inst
Market Benchmark:
Credit Suisse High Yield Index
Upside / DownsideOctober 2009 - September 2014 (Single Computation)
Ups
ide%
90
95
100
105
110
Downside%
90 95 100 105 110
TIAA-CREF High-Yield Inst
Credit Suisse High Yield Index
Calendar Year ReturnAs of September 2014
TIAA-CREF High-Yield Inst
Credit Suisse High Yield Index
0%
2%
4%
6%
8%
10%
12%
14%
16%
YTD 2013 2012 2011 2010
Portfolio StatisticsOctober 2009 - September 2014: Summary Statistics
TIAA-CREF High-Yield Inst
Credit Suisse High Yield Index
CumulativeReturn
Alphavs.
Market
Alphavs.
Style
Betavs.
Market
Betavs.
Style
R-Squaredvs.
Market
R-Squaredvs.
Style
SharpeRatio
StandardDeviation
58.66% -1.29% 4.26% 1.07 0.97 96.46% 51.01% 1.53 6.29%
63.61% 0.00% 5.16% 1.00 0.96 100.00% 54.64% 1.78 5.77%
89

GLOSSARY
3Q2014
90

Glossary
G - 1
12b-1 Fee The maximum annual charge deducted from fund assets to pay for distribution and marketing costs. Although usually set on a percentage basis, this amount will occasionally be a flatfigure.
Actively managed fund A fund manager buys and sells securities attempting to outperform the market as a whole.
Adjustable Bonds A bond whose coupon is reset periodically—usually every six months to three years. At the reset date, the coupon is set equal to some base index, such as the one-yearconstant Treasury rate, plus a spread (or margin). When interest rates are falling, these bonds do better than an in-year Treasury, but when interest rates rise, they can lag Treasury yields.
Aggressive Growth (Objective) Funds that seek rapid growth of capital and that may invest in emerging market growth companies without specifying a market capitalization range. They ofteninvest in small or emerging growth companies and are more likely than other funds to invest in IPO's or in companies with high price/earnings and price/book ratios. They may use such investmenttechniques as heavy sector concentrations, leveraging, and short-selling.
Alpha A measure of the difference between a fund’s actual returns and its expected performance, given its level of risk as measured by beta. A positive alpha figure indicates the fund hasperformed better than its beta would predict. In contrast, a negative alpha indicates the fund’s underperformance, given the expectations established by the fund’s beta.
Annual Returns Total returns calculated on a calendar-year basis. The annual return for a fund will be the same as its trailing 12-month total return only at year-end.
Annualized Returns Returns for periods longer than one year are expressed as "annualized returns." This is equivalent to the compound rate of return which, over a certain period of time, wouldproduce a fund’s total return over that same period.
Asset Allocation (Objective) Income and capital appreciation are dual goals for funds in this objective. Managers often use a flexible combination of stocks, bonds, and cash. Managers may shiftassets based on analysis of business-cycle trends.
Average Credit Quality Gives a snapshot of the portfolio’s overall credit quality. It is an average of each bond’s credit rating, adjusted for its relative weighting in the portfolio.
Average Effective Duration A measure of a fund's interest-rate sensitivity--the longer a fund's duration, the more sensitive the fund is to shifts in interest rates. Duration is determined by aformula that includes coupon rates and bond maturities. Small coupons tend to increase duration, while shorter maturities and higher coupons shorten duration. The relationship between fundswith different durations is straightforward: A fund with a duration of 10 years is twice as volatile as a fund with a five-year duration.
Average Effective Maturity Used for taxable fixed-income funds only, this figure takes into consideration all mortgage prepayments, puts, and adjustable coupons; it does not, however, accountfor call provisions. The number listed is a weighted average of all the maturities of the bonds in the portfolio, computed by weighing each maturity date (the date the security comes due) by themarket value of the security.
Balanced (Objective) Funds that seek both income and capital appreciation by investing in a generally fixed combination of stocks and bonds. These funds generally hold a minimum of 25% oftheir assets in fixed-income securities at all times.
Basis Point One-hundredth of a percentage point. For example, 50 basis points equals .50%.
Beta A measure of a fund’s sensitivity to market movements. The beta of the market is 1.00 by definition. Beta is calculated by comparing a fund’s excess return over Treasury bills to themarket's excess return over Treasury bills, so a beta of 1.10 shows that the fund has performed 10% better than its benchmark index in up markets and 10% worse in down markets, assuming allother factors remain constant. Conversely, a beta of 0.85 indicates that the fund’s excess return is expected to perform 15% worse than the market’s excess return during up markets and 15%better during down markets.
Bonds Interest-bearing certificates of indebtedness or IOUs. While bonds' rates of return remain fixed, bond prices change in relation to interest rates — when interest rates go up, bond prices godown, and vice versa. However, bond funds are variable funds and fluctuate with market conditions.
Bond funds Contrary to individual bonds, which offer a guaranteed rate of return, bond funds are variable funds and their returns may rise or fall depending on market conditions. Funds with 70%or more of their assets invested in bonds are classified as Bond Funds. Bond funds are divided into two main groups: Taxable Bond and Municipal Bond. Taxable Bond Fund categories includethe following: Long-Term Government, Intermediate-Term Government, Short-Term Government, Long-Term Bond, Intermediate-Term Bond, Short-Term Bond, Ultrashort-Bond, International-Bond, High-Yield Bond, Emerging-Markets Bond and Multisector Bond.
Breakpoint The investment amount at which investors in a load fund qualify for a discount on the fund’s sales charges.

Glossary
G - 2
Broker A firm or individual that acts as an intermediary between a buyer and a seller of securities, thereby earning a commission on the transaction. Unlike a broker-dealer, a broker does not ownthe securities that he or she sells.
Callable Bond A bond that can be repaid early, at the issuer’s discretion. A callable bond allows an issuer to refinance debt at a lower rate, should interest rates drop below the coupon rate on thebond. If interest rates have dropped significantly since the date of issue, a callable bond will trade as though its maturity were shortened to the call date, which is the earliest time at which the bondcan be redeemed.
Capital Appreciation The taxable income generated when a security is sold. The amount of appreciation is measured by subtracting the purchase price from the sale price.
Capital Gains Taxable income generated only when a security is sold. This figure is calculated by subtracting the purchase price from the sale price. Under IRS regulations, funds must distribute98% of their capital gains each year to avoid paying taxes on them. Shareholders pay taxes on these distributions, even if the gains are reinvested. Further capital gains can be generated byselling shares in a fund for more than the original purchase price.
Capitalization The total dollar value of all stock issued by a company. Small-cap stocks are issued by companies with market cap less than $1 billion. Mid-cap stocks are issued by medium-sizedcompanies with market cap anywhere from $1 billion to $5 billion. Large-cap stocks include companies with market cap greater than $5 billion.
CMOs Collateralized mortgage obligations are derivative securities, created by chopping up mortgage pass-throughs or whole loans into various slices in order to redistribute the cash flows (bothprincipal and interest payments) from the underlying bonds. The CMO group, except for adjustable-rate mortgage funds, includes PACs (planned amortization class bonds), floating- and inverse-floating-rate CMOs, and accrual or Z-tranche bonds, among other varieties.Consumer Price Index (CPI) This index measures the changes in prices of goods and services purchased by urban households. Many pension and employment contracts are tied to changes inconsumer prices, as protection against inflation and reduced purchasing power.
Corporate Bond--General (Objective) Funds that seek income by investing in fixed-income securities. Funds with this objective may hold a variety of issues, including but not limited togovernment bonds, high-quality corporates, mortgages, asset-backeds, bank loans and junk bonds.
Corporate Bond--High Quality (Objective) Offerings that seek income by investing at least 65% of their assets in corporate debt securities rated A or higher. They generally maintain averageratings of AA or better.
Corporate Bond--High Yield (Objective) Funds that seek income by generally investing 65% or more of their assets in bonds rated below BBB. The price of these issues is generally affectedmore by the condition of the issuing company (similar to a stock) than by the interest-rate fluctuation that usually causes bond prices to move up and down.
Current income Results when a stock pays a dividend or a bond makes an interest payment. This is the value of your investment increased. With current income, you get a fairly stable pattern ofincome — which generally means reduced volatility. (Stock dividends must be declared, and are not predictable.)
Diversification Spreading your money over many different types of investments. Contrary to putting all your eggs in one basket, diversification can help protect your savings because when oneinvestment is doing poorly, another may be doing well. This does not guarantee against loss of value in your investments.
Dividends The distribution of earnings to stockholders by a company. Dividends are usually paid out from current earnings.
Domestic equity funds are placed in a category based on the style and size of the stocks they typically own. The style and size parameters are based on the divisions used in the investmentstyle box: Value, Blend, or Growth style and Small, Medium, or Large median market capitalization.
Domestic Hybrid Category Used for funds with stock holdings of greater than 20% but less than 70% of the portfolio.
Dow Jones Industrial Average Computed by summing the prices of the stocks of 30 companies and then dividing that total by an adjusted value--one which has been adjusted over the years toaccount for the effects of stock splits on the prices of the 30 companies. Dividends are reinvested to reflect the actual performance of the underlying securities.
Duration A time measure of a bond’s interest-rate sensitivity, based on the weighted average of the time periods over which a bond’s cash flows accrue to the bondholder. Time periods areweighted by multiplying by the present value of its cash flow divided by the bond’s price. (A bond’s cash flows consist of coupon payments and repayment of capital). A bond’s duration will almostalways be shorter than its maturity, with the exception of zero-coupon bonds, for which maturity and duration are equal.
Equity-Income (Objective) Funds that are expected to pursue current income by investing at least 65% of their assets in dividend-paying equity securities.

Glossary
G - 3
Equity style box is a matrix that shows a fund’s investment style. Nine boxes represent two variables: the size of the companies invested in (small-cap, mid-cap, large-cap), and whether a fund isgrowth, value, or blend oriented. Morningstar recalculates the style of each fund on a monthly basis. The equity style box is shown below (areas are shaded according to risk — the darker thearea, the higher the risk associated with the investment).
Value Blend Growth
1 2 3 Large
4 5 6 Medium
7 8 9 Small
Excess Returns A component found in Morningstar Return, Morningstar Risk, and the Morningstar Rating. This figure is calculated by subtracting the monthly returns of the three-month Treasury-bill from the monthly returns of the fund during the same time period.
Exchange-Traded Funds (ETFs) are not mutual funds in the traditional sense; rather, they are hybrid instruments combining aspects of common stocks and mutual funds and offering many thebenefits of both. ETFs are products that trade like stocks. They mimic stock indexes and are passively managed just like an index fund. Because ETFs trade throughout the day just like a stock,investors have the ability to choose the timing and know the price of the transaction.
Expense Ratio The percentage of fund assets paid for operating expenses and management fees, including 12b-1 fees, administrative fees, and all other asset-based costs incurred by the fund,except brokerage costs. Fund expenses are reflected in the fund’s NAV . Sales charges are not included in the expense ratio.
FHLMC mortgages The Federal Home Loan Mortgage Commission, a federally-sponsored corporation that packages huge pools of individual mortgages and carves these pools up as mortgage-backed securities. This provides diversification, and consequently lower risk for mortgage investors. Although FHLMC securities are not directly backed by the federal government, it is implicitlyrecognized that the government would step in were there a likelihood that they would default.
Fixed-income style box is similar to the equity style box. Fixed income style boxes represent a bond fund’s investment style. A fixed-income style would be the intersection of its duration (short,intermediate, and long) and the quality of the bonds selected for the portfolio (high, medium, low). Listed below is the matrix using the fixed-income style groupings (again, the darker the shading,the higher the risk).
Short Int. Long
1 2 3 High
4 5 6 Medium
7 8 9 Low
Flagship Fund Not to be confused with the Flagship Family of funds, a flagship fund is typically the oldest of a management company’s funds, or one that boasts the largest number of assets.Such funds often bear the management company’s name.
Foreign Stock Category An international fund having no more than 10% of stocks invested in the United States.
Fund of Funds A fund that specializes in buying shares in other mutual funds rather than individual securities. Quite often this type of fund is not discernible from its name alone, but ratherthrough prospectus wording (i.e.: the fund’s charter).
Geometric Mean Return A compounded and annualized rate of return.
GNMA mortgages These are mortgage pass-through securities issued by the Government National Mortgage Association. These bonds are backed by the full faith and credit of the U.S.government.
Government Bond--General (Objective) Offerings that pursue income by investing in a combination of mortgage-backed securities, Treasuries, and agency securities.

Glossary
G - 4
Government Bond--Mortgage (Objective) Funds that seek income by generally investing at least 65% of their assets in securities backed by mortgages, such as securities issued by theGovernment National Mortgage Association (GNMA), the Federal National Mortgage Association (FNMA), and the Federal Home Loan Mortgage Corporation (FHLMC).
Government Bond--Treasury (Objective) Treasury funds that seek income by generally investing at least 80% of their assets in U.S. Treasury securities.
Growth (Objective) Funds that pursue capital appreciation by investing primarily in equity securities. Current income, if considered at all, is a secondary concern.
Growth and Income (Objective) Growth of capital and current income are near-equal objectives for these funds. Investments are typically selected for both appreciation potential and dividend-paying ability.
Guaranteed Certificate Fund All money deposited into a certificate during a "deposit period" earns a guaranteed rate of return, credited daily until maturity. Backed by the general assets of thecertificate issuer.
High-Yield Bond Category A fund with at least 65% or more of bond assets in bonds rated below BBB.
Index Fund A fund that tracks a particular index and attempts to match returns. While an index typically has a much larger portfolio than a mutual fund, the fund’s management may study theindex’s movements to develop a representative sampling, and match sectors proportionately.
Individual Retirement Account (IRA) A personal retirement plan. Taxes on earnings are deferred until money from the account is withdrawn.
Industrial Cyclicals Sector Includes aerospace and aerospace industries, building supplies, industrial-building products, business equipment, chemicals, machinery (both light and industrial),metals fabrication (iron, steel, coal, and rare metals), paper and packaging, and photo equipment. Some examples of companies in this sector include Boeing, Canon, Caterpillar, Eastman Kodak,Georgia Pacific, Potash, and Sherwin-Williams.
Information Ratio The information ratio is a measure of the consistency of excess return. This value is determined by taking the annualized excess return over a benchmark (style benchmark bydefault) and dividing it by the standard deviation of excess return.
Institutional Fund Any fund that meets one of the following qualifications:a) has the word "institutional" in its name.
b) has a minimum initial purchase of $100,000 or more.
c) states in its prospectus that it is designed for institutional investors or those purchasing on a fiduciary basis.
International Equity Funds with 40% or more of their equity holdings in foreign stocks (on average over three years) are placed in the international equity class. These categories include Europe,Japan, International Hybrid, Latin America, Diversified Pacific, Pacific ex. Japan, Specialty Precious Metals, Diversified Emerging Markets, World Stock, and Foreign Stock. Foreign investmentsinvolve special risks, including currency fluctuations and political developments.
Lehman Brothers 1-3 Year Government Bond Comprised of both the Treasury Bond index (all public obligations of the U.S. Treasury, excluding flower bonds and foreign-targeted issues) andthe Agency Bond Index (all publicly issued debt of U.S. Government agencies and quasi-federal corporations and corporate-debt guaranteed by the U.S. Government). These bonds also musthave maturities of one to three years. The returns published for the index are total returns, which include reinvestment of dividends.
Lehman Brothers Aggregate Index Composed of the Lehman Brothers Govt/Credit Index, the Mortgage-Backed Securities Index, and the Asset-Backed Securities Index. The returns publishedfor the index are total returns, which include reinvestment of dividends.
Lehman Brothers Credit Listed for corporate bond-general and high-quality funds. This index tracks the returns of all publicly issued, fixed-rate, nonconvertible, dollar-denominated, SEC-registered, investment-grade corporate debt. The returns published for the index are total returns, which include reinvestment of dividends.
Lehman Brothers Government Bond Index Listed for government-bond general and Treasury funds. Because it tracks the returns of U.S. Treasuries, agency bonds, and one- to three-year U.S.government obligations, this index is effective for tracking portfolios holding non-mortgage government securities. The returns published for the index are total returns, which include reinvestmentof dividends.
Lehman Brothers Govt/Credit Represents a combination of the Government and Corporate Bond indices. The returns published for the index are total returns, which include reinvestment ofdividends. For more information, view the Lehman Brothers Web site or call 212-526-1000.

Glossary
G - 5
Lehman Brothers Intermediate Government Index Includes those indexes found in the LB Government Index which have a maturity of one to three years. The returns published for the indexare total returns, which include reinvestment of dividends.
Lehman Brothers Intermediate Government/Corporate Index Includes both corporate (publicly-issued, fixed-rate, nonconvertible, investment grade, dollar-denominated, SEC-registered,corporate dept.) and government (Treasury Bond index, Agency Bond index, 1-3 Year Government index, and the 20+-Year treasury) indexes, including bonds with maturities up to ten years. Thereturns published for the index are total returns, which include reinvestment of dividends.
Lehman Brothers Intermediate Treasury This index includes treasury bonds with maturates of at least one year and up to 10 years with an outstanding par value of at least 100 million. Theyinclude fixed-rate debt issues, rated investment grade or higher by Moody’s Investor Services, Standard & Poor’s Corporation, or Fitch Investor’s Service (in that order). Treasuries include allpublic obligations of the U.S. Treasury, excluding flower bonds and foreign-targeted issues. The returns published for the index are total returns, which include reinvestment of dividends.
Lehman Brothers Long Credit Serves as a measure of all public-issued nonconvertible investment-grade corporate debts that have a maturity of 10 years or more. The returns published for theindex are total returns, which include reinvestment of dividends.
Lehman Brothers Long Term Government Index Includes those indexes found in the LB Government index which have a maturity of 10 years or more. The returns published for the index aretotal returns, which include reinvestment of dividends.
Lehman Brothers Mortgage-Backed Securities Includes 15- and 30-year fixed-rate securities backed by mortgage pools of the Government National Mortgage Association (GNMA). The returnspublished for the index are total returns, which include reinvestment of dividends.
Life Cycle These funds are geared toward investors of a certain age or with a specific time horizon for investing. Typically they are grouped together in sets (i.e. conservative, moderate, andaggressive portfolios).
Linear Scale Linear graphs are scaled so that equal vertical distances represent the same absolute dollar value change. A drop from $10,000 to $9,000, for example, is represented in the sameway as a drop from $100,000 to $99,000.
Logarithmic Scale Used for graphs, a scale that reveals percentage changes. A given percentage move takes up the same amount of space as another move of equal percentage. A changefrom 100 to 200, for example, is presented in the same way as a change from 1000 to 2000.
Maturity Short-term bonds mature (or come due) in less than four years. Intermediate-term bonds mature in four to ten years. Long-term bonds mature more than ten years from the date ofpurchase. The longer the term, the higher the risk and the rate of potential return.
Management Fees The management fee is the percentage deducted from fund assets to pay an advisor or subadvisor. Often, as the fund's net assets grow, the percentage deducted formanagement fees decreases. For example, a particular fund may report a management fee of 0.40% on the first $500 million in assets, 0.35% on all assets between $500 million and $1 billion,and 0.30% on assets in excess of $1 billion. Thus, if the fund contains $1.5 billion in total net assets, the advisor scales back its management fees accordingly. Alternatively, the fund may computethe fee as a flat percentage of average net assets. The management fee might also come in the form of a group fee (G), a performance fee (P), or a gross income fee (I). Note: The managementfee is just one (albeit a major) component of a fund's costs. The overall expense ratio is the most useful number for investors. Actual fees are also noted in this section.
Market-Neutral Funds These are funds that attempt to eliminate the risks of the market by holding 50% of assets in long positions in stocks and 50% of assets in short positions. Funds in thisgroup match the characteristics of their long and short portfolios, keeping factors such as price-to-earnings and industry exposure similar. Stock picking, rather than broad market moves, shoulddrive a market-neutral fund's performance.
Median Market Capitalization The median market capitalization of a fund's equity portfolio gives you a measure of the size of the companies in which the fund invests. It is the trimmed mean ofthe market capitalizations of the stocks in the fund’s portfolio.
Modern Portfolio Theory (MPT) Statistics Alpha, beta, and R-squared are modern-portfolio-theory measures of a fund’s relative risk, based on least-squares regression of a fund’s excessreturns on the excess returns of a market index. Standard deviation is not considered an MPT statistic because it is not generated through the same formula or mathematical analysis as the otherthree statistics.
Money market funds Best described as short-term versions of bonds. These relatively low-risk variable funds hold very short-term securities such as U.S. government securities, certificates ofdeposit, cash and cash equivalents. Investments in Money Market funds are neither insured nor guaranteed by the Federal Deposit Insurance Corporation or any other government agency.Although they seek to preserve the value of your investment at $1 per share, it is possible to lose money in Money Market funds.

Glossary
G - 6
Morley Stable Value Index A hypothetical portfolio comprised of a weighted blend of 50% five-year stable value contracts, 30% three-year stable value contracts and 20% 30-day primecommercial paper. The five-year component consists of 60 hypothetical five-year stable value contracts, one purchased at the prior month end's illustrative rate at the beginnning of each monthfor the prior 60 months. The three-year component consists of 36 hypothetical three-year stable value contracts, one purchased at the prior month end's illustrative rate at the beginnning of eachmonth for the prior 36 months.
Morningstar was founded in 1984 to provide investors with useful information for making intelligent, informed investment decisions. The company’s first product, originally named the Mutual FundSourcebook, proved to be innovative in its ability to tap into an underserved market. Soon a demand grew for an even more in-depth and analytical publication, leading to the launch of MorningstarMutual Funds in late 1986.
Morningstar Category identifies funds based on their actual investment styles as measured by their underlying portfolio holdings (portfolio statistics and compositions over the past three years). Ifthe fund is new and has no portfolio, we estimate where it will fall before assigning a more permanent category. When necessary, we may change a category assignment based on currentinformation.
MSCI EAFE Ndtr_D Listed for foreign stock funds (EAFE refers to Europe, Australasia, and Far East). Widely accepted as a benchmark for international stock performance, the EAFE Index is anaggregate of 21 individual country indexes that collectively represent many of the major markets of the world. Ndtr_D indexes are calculated daily and take into account actual dividends reinvesteddaily before withholding taxes, but exclude special tax credits declared by companies. In addition, Ndtr_D indexes subtract withholding taxes retained at the source, for foreigners who do notbenefit from a double taxation treaty. The returns published for the index are total returns, which include reinvestment of dividends.
MSCI Europe Ndtr_D Listed for Europe stock funds. This index measures the performance of stock markets in Austria, Belgium, Denmark, Finland, France, Germany, Italy, the Netherlands,Norway, Spain, Sweden, Switzerland, Ireland, Portugal, and the United Kingdom. Total returns date back to December 1981. Ndtr_D indexes are calculated daily and take into account actualdividends reinvested daily before withholding taxes, but exclude special tax credits declared by companies. In addition, Ndtr_D indexes subtract withholding taxes retained at the source, forforeigners who do not benefit from a double taxation treaty.
MSCI Pacific Ndtr_D Formerly known as MS Pacific, this index is listed for Pacific stock funds and measures the performance of stock markets in Australia, Hong Kong, Japan, New Zealand, andSingapore, and Malaysia. Ndtr_D indexes are calculated daily and take into account actual dividends reinvested daily before withholding taxes, but exclude special tax credits declared bycompanies. In addition, Ndtr_D indexes subtract withholding taxes retained at the source, for foreigners who do not benefit from a double taxation treaty. The returns we publish for the index aretotal returns, which include reinvestment of dividends.
MSCI World Ndtr_D Includes all 23 MSCI developed market countries. Ndtr_D indexes are calculated daily and take into account actual dividends reinvested daily before withholding taxes, butexclude special tax credits declared by companies. In addition, Ndtr_D indexes subtract withholding taxes retained at the source, for foreigners who do not benefit from a double taxation treaty.
Mutual fund An investment option that pools money from many shareholders and invests it in a group of stocks, bonds, or other securities. Also known as an open-end investment managementcompany, mutual funds are securities required to be registered with the SEC.
NASD (National Association of Securities Dealers) A self-regulatory organization for the securities industry with jurisdiction over certain broker-dealers. The NASD enforces broker-dealers’compliance with securities regulations, including the requirement that they maintain sufficient levels of net operating capital. It also conducts market surveillance of the over-the-counter (OTC)securities market.
NAV Stands for net asset value, which is the fund’s share price. Funds compute this value by dividing the total net assets by the total number of shares.
NASDAQ Composite Index Measures the performance of all issues listed in the NASDAQ Stock Market, except for rights, warrants, units, and convertible debentures.
Net Assets The month-end net assets of the mutual fund, recorded in millions of dollars. Net-asset figures are useful in gauging a fund’s size, agility, and popularity. They help determine whethera small company fund, for example, can remain in its investment-objective category if its asset base reaches an ungainly size.
Ndtr_D: Noted for various Morgan Stanley indexes, Ndtr_D indicates that the index is listed in US dollars, with net dividends reinvested. Ndtr_D indexes take into account actual dividends beforewithholding taxes, but excludes special tax credits declared by companies. In addition, Ndtr_D indexes subtract withholding taxes retained at the source, for foreigners who do not benefit from adouble taxation treaty.
NYSE (New York Stock Exchange Composite) Serves as a comprehensive measure of the market trend for the benefit of investors who are concerned with general stock market price movements.The index is a composite of all common stocks listed on the NYSE and four sub-groups--Industrial, Transportation, Utility, and Finance.
Options/Futures/Warrants Options and futures may be used speculatively, to leverage a portfolio, or cautiously, as a hedge against risk.

Glossary
G - 7
OTC (over the counter) A name for a security that is not listed on an exchange. The OTC is the major trading market for all US bonds, as well as many small- and large-capitalization stocks.Whereas non-OTC stocks trade on the floor of actual stock exchanges, OTC issues are traded via telephone and computer networks connecting dealers in stocks and bonds. The dealer may ormay not be a member of a securities exchange, but he or she must be a member of the NASD.
Price/Book Ratio The weighted average of the price/book ratios of all the stocks in a fund’s portfolio. The P/B ratio of a company is calculated by dividing the market price of its stock by thecompany’s per-share book value. Stocks with negative book values are excluded from this calculation. In theory, a high P/B ratio indicates that the price of the stock exceeds the actual worth ofthe company's assets, while a low P/B ratio indicates that the stock is a bargain.
Price/Earnings Ratio The weighted average of the price/earnings ratios of the stocks in a fund’s portfolio. The P/E ratio of a stock is calculated by dividing the current price of the stock by itstrailing 12 months’ earnings per share. In computing the average, Morningstar weights each portfolio holding by the percentage of equity assets it represents, so that larger positions haveproportionately greater influence on the fund’s final P/E.
Price/Cash Flow This represents the weighted average of the price/cash-flow ratios of the stocks in a fund's portfolio. Price/cash-flow represents the amount an investor is willing to pay for adollar generated from a particular company's operations. Price/cash-flow shows the ability of a business to generate cash and acts as a gauge of liquidity and solvency. Because accountingconventions differ among nations, reported earnings (and P/E ratios) may not be comparable across national boundaries. Price/cash-flow attempts to provide an internationally-standard measureof a firm's stock price relative to its financial performance.
Prospectus A fund's formal written statement, generally issued on an annual basis. In this statement the fund sets forth its proposed purposes and goals, and other facts (e.g.: history andinvestment objective) that an investor should know in order to make an informed decision.
Prospectus Objective Indicates a particular fund’s investment goals, based on the wording in a fund's prospectus.
R-Squared Reflects the percentage of a fund’s movements that can be explained by movements in its benchmark index. An R-squared of 100 indicates that all movements of a fund can beexplained by movements in the index. Thus, index funds that invest only in S&P 500 stocks will have an R-squared very close to 100. Conversely, a low R-squared indicates that very few of thefund’s movements can be explained by movements in its benchmark index. An R-squared measure of 35, for example, means that only 35% of the fund’s movements can be explained bymovements in the benchmark index.
Regression A mathematical tool used to study the way that two sets of numbers interact with each other. Regression measures how much of one number's changes might be caused by or linkedto how much another number changes.
Returns Based Style Analysis In 1988, William F. Sharpe, Nobel Laureate and Professor of Finance at Stanford University, wrote an article for the Investment Analyst Review entitled"Determining a Fund's Effective Asset Mix". In this article, he demonstrated that a manager's style could be determined by analyzing portfolio returns, as opposed to holdings. This was donemathematically by comparing the manager's returns to the returns of a number of style indexes. This discovery revolutionized style and performance analysis and provided the basis for theStyleADVISOR suite of software.
Since its debut in 1993, StyleADVISOR has been the style analysis package of choice for the large institutional marketplace. Our client list has grown to include over 250 plan sponsors,consultants, and money managers. They use StyleADVISOR to determine, for themselves, using only monthly or quarterly returns, the style and consistency of managers and funds. They createcustom style benchmarks, do performance, risk-return, upside downside market capture analyses, manager to peer universe comparisons, asset allocation, and much more. StyleADVISOR alsoenables them to perform manager searches, create custom universes, evaluate competitors, and monitor aggregate portfolios.
Risk Basically there are four types of risk: 1) inflation risk means your money may not earn enough in the long run because as prices go up the value of your money goes down; 2) market riskmeans you could lose money because the price of a stock may go down; 3) credit risk means a company or organization that borrowed your money may not be able to pay it back; and 4) interestrate risk means you could lose money because as interest rates go up the value of bond investments goes down.
Risk-Free Rate of Return Three-month T-bills are government-backed short-term investments considered to be risk-free and as good as cash because the maturity is only three months.
Risk/Return Graph The Manager Risk/Return Graph displays the risk/return characteristics of a manager and compares them to a benchmark, universe or other managers. It plots Return on thevertical axis and a Risk Statistic on the horizontal axis.
The chart has crosshairs that provide a basis for comparison by dividing the graph into four quadrants. The crosshairs are centered at either the Market Benchmark, the Style Benchmark or themedian of the Universe, depending on the options you select. A relatively aggressive manager, for example, is likely to fall in the Northeast corner relative to the crosshairs centered at theuniverse median, with both more risk and more return.

Glossary
G - 8
Russell 1000 Consists of the 1000 largest companies within the Russell 3000 index. Also known as the Market-Oriented Index, because it represents the group of stocks from which most activemoney managers choose. The returns published for the index are total returns, which include reinvestment of dividends.
Russell 1000 Growth Market-capitalization weighted index of those firms in the Russell 1000 with higher price-to-book ratios and higher forecasted growth values. The Russell 1000 includes thelargest 1000 firms in the Russell 3000, which represents approximately 98% of the investable US equity market.
Russell 1000 Value Market-capitalization weighted index of those firms in the Russell 1000 with lower price-to-book ratios and lower forecasted growth values. The Russell 1000 includes thelargest 1000 firms in the Russell 3000, which represents approximately 98% of the investable US equity market.
Russell 2000 Consists of the smallest 2000 companies in the Russell 3000 Index, representing approximately 7% of the Russell 3000 total market capitalization. The returns published for theindex are total returns, which include reinvestment of dividends.
Russell 2000 Growth Market-weighted total return index that measures the performance of companies within the Russell 2000 Index having higher price-to-book ratios and higher forecastedgrowth values. The Russell 2000 Index includes the 2000 firms from the Russell 3000 Index with the smallest market capitalizations. The Russell 3000 Index represents 98% of the of theinvestable US equity market.
Russell 2000 Value Market-weighted total return index that measures the performance of companies within the Russell 2000 Index having lower price-to-book ratios and lower forecasted growthvalues. The Russell 2000 Index includes the 2000 firms from the Russell 3000 Index with the smallest market capitalizations. The Russell 3000 Index represents 98% of the of the investable USequity market.
Russell 3000 Composed of the 3000 largest U.S. companies by market capitalization, representing approximately 98% of the U.S. equity market. The returns published for the index are totalreturns, which include reinvestment of dividends.
S&P 500/BARRA Growth Index A subset of the Standard & Poor's 500 Index®. Each year, all the stocks in the S&P 500® are classified as either growth or value. The stocks classified as growthmake up the S&P 500/BARRA Growth Index. In general, growth companies tend to have high price-to-earnings (P/E) ratios, low dividend yields, and above-average earnings growth rates.
S&P 500/BARRA Value Index A subset of the Standard & Poor's 500 Index®. Each year, all the stocks in the S&P 500® are classified as either growth or value. The stocks classified as valuemake up the S&P 500/BARRA Value Index. In general, value companies tend to have low P/E ratios, high dividend yields, and below-average earnings growth rates.
S&P 400 MidCap Index The S&P 400 MidCap Index consists of 400 U.S. companies that have market capitalization from $1 billion to $5 billion. The index includes approximately 312 industrialcompanies, 10 transportation companies, 41 utilities, and 37 financial companies.
S&P 500 Index® Standard & Poor's 500 Index® is a benchmark for the United States stock market. It's a list of the 500 largest publicly traded companies, which include 400 industrial companies,20 transportation companies, 40 utilities, and 40 financial companies.
S&P Small Cap 600 Index The Standard & Poor's SmallCap 600 Index consists of 600 U.S. companies that have market capitalization less than $1 billion. The index includes approximately 499industrial companies, 18 transportation companies, 27 utilities, and 56 financial companies. Equity securities of companies with small market capitalization may be more volatile than securities oflarger, more established companies.
SEC Yield A calculation based on a 30-day period ending on the last of the previous month. It is computed by dividing the net investment income per share earned during the period by themaximum offering price per share on the last day of the period.
Share Classes Shares of the same fund that offer different shareholder rights and obligations, such as different fee and load charges. Common share classes are A (front-end load), B (deferredfees), C (no sales charge and a relatively high annual 12b-1 fee, such as 1.00%). Multi-class funds hold the same investment portfolio for all classes, and differ only in their surrounding feestructure.
Sharpe Ratio A risk-adjusted measure developed by Nobel Laureate William Sharpe. It is calculated by using standard deviation and excess return to determine reward per unit of risk. The higherthe Sharpe Ratio, the better the fund’s historical risk-adjusted performance. The Sharpe ratio is calculated for the past 36-month period by dividing a fund’s annualized excess returns by itsannualized standard deviation.

Glossary
G - 9
Socially Conscious Any fund that invests according to non-economic guidelines. Such funds may make investments based on such issues as environmental responsibility, human rights, orreligious views. A socially conscious fund may take a pro-active stance by selectively investing in, for example, environmentally-friendly companies, or firms with good employee relations. Thisgroup also includes funds that avoid investing in companies involved in promoting alcohol, tobacco, or gambling, or in the defense industry.
Standard Deviation A statistical measurement of dispersion about an average, which, for a mutual fund, depicts how widely the returns varied over a certain period of time. Investors use thestandard deviation of historical performance to try to predict the range of returns that are most likely for a given fund. When a fund has a high standard deviation, the predicted range ofperformance is wide, implying greater volatility.
Stocks Ownership in a company. Stocks are sold by the company and then bought/sold among investors. Risks involved include the company not performing up to expectations or that the price ofyour stock will fall.
Style Benchmark The concept of the style benchmark was first introduced by Nobel Laureate William F. Sharpe in 1988 and referred to as the "Effective Asset Mix". A quadratic optimizer is usedto find a combination of the selected indices that would best track (have the highest correlation to) a given return series. For example, if a domestic equity manager optimization found that aweighted composite of 20% Russell Large Value, 10% Russell Large Growth, 60% Russell Small Value, 5% Russell Small Growth, and 5% T-bills had a 92% R-squared to that manager's returns,it could be said that 92% of this manager's performance may be attributed to his "style". The remaining 8% is unexplained variance due to stock selection, etc.
Tax-deferred earnings You don't have to pay taxes on any earnings in your 401(k) until you withdraw your money. The money in a 401(k) can grow faster than with other types of savings plans,because the earnings you accumulate, if any, are also tax-deferred.
Treynor Ratio The Treynor Ratio is a measure of performance per unit of market risk. It is the portfolio's excess return over the risk-free rate divided by the portfolio's beta to the selectedbenchmark. Also known as the Reward to Volatility Ratio.
Turnover Ratio The turnover rate of a fund is a decent proxy for how frequently a manager trades his or her portfolio. The inverse of a fund's turnover ratio is the average holding period for asecurity in that fund. If a fund consistently showed a 20% turnover ratio, for example, it would suggest that--on average--that fund holds a security for five years before selling it. A fund with a200% turnover ratio pretty much changes its portfolio wholesale every six months.
Upside / Downside Market Capture Graph StyleADVISOR's Upside / Downside Market Capture graph displays the percentage of benchmark movement captured by a manager in both up anddown markets. The graph plots the manager's upside capture ratio (vertical axis) against the downside capture ratio (horizontal axis). The capture ratio is the manager's return divided by thebenchmark's return, or the percentage of the benchmark’s return that was “captured” by the manager. The Upside capture ratio is computed for periods when the market has a positive return.The Downside capture ratio is computed for periods when the market has a negative return.
Variable funds Investments that fluctuate with market conditions. Unlike guaranteed investments, such as bonds or CDs, variable funds don't guarantee a specific rate of return. They do offerpotential for higher earnings in return for higher degree of market risk.
Wilshire 4500 Listed for small-company funds, measures the performance of all U.S. common equity securities excluding the stocks in the S&P 500. The returns published for the index are totalreturns, which include reinvestment of dividends.
Wilshire 5000 Measures the performance of all U.S. common equity securities, and so serves as an index of all stock trades in the United States. The returns published for the index are totalreturns, which include reinvestment of dividends.
World Stock Category An international fund having more than 10% of stocks invested in the US. Also known as global funds. Foreign Investments involve special risks, including currencyfluctuations and political developments.
1996-2001. Morningstar, Inc. All Rights Reserved. The information, data, analyses and opinions contained herein (1) include the confidential and proprietary information of Morningstar, Inc., (2)may not be copied or redistributed, (3) do not constitute investment advice offered by Morningstar, Inc., (4) are provided solely for information purposes and (5) are not warrented to be correct,complete or accurate. Morningstar, Inc. shall not be responsible for any trading decisions, damages or other losses resulting from or related to, this information, data, analyses or opinions or theiruse.


