Western Riverside County Multiple Species Habitat Conservation Plan (MSHCP) Biological Monitoring Program Quino Checkerspot Butterfly (Euphydryas editha quino) Survey Report 2009 23 April 2010
Transcript
Western Riverside County Multiple Species Habitat Conservation Plan (MSHCP)
SAMPLING STATION ESTABLISHMENT...........................................................................................2 SENTINEL SITE VISITS...................................................................................................................7 SURVEY METHODS........................................................................................................................7 PERSONNEL AND TRAINING...........................................................................................................8 VEGETATION SAMPLING ...............................................................................................................9 DATA ANALYSIS .........................................................................................................................10
RECOMMENDATIONS FOR FUTURE SURVEYS...............................................................................23
LITERATURE CITED ...............................................................................................................................25
LIST OF TABLES AND FIGURES Figure 1. Quino checkerspot butterfly sentinel site locations, supplemental survey locations and
supplemental survey results in 2009.. .................................................................................3
Figure 2. Example of plot of sampling stations to survey for Quino checkerspot butterfly in 2009. The center station (red), every station within the second ring around the center station (orange), and every-other station in the fourth ring around the center station (yellow) were preselected for survey.. ..............................................................................................4
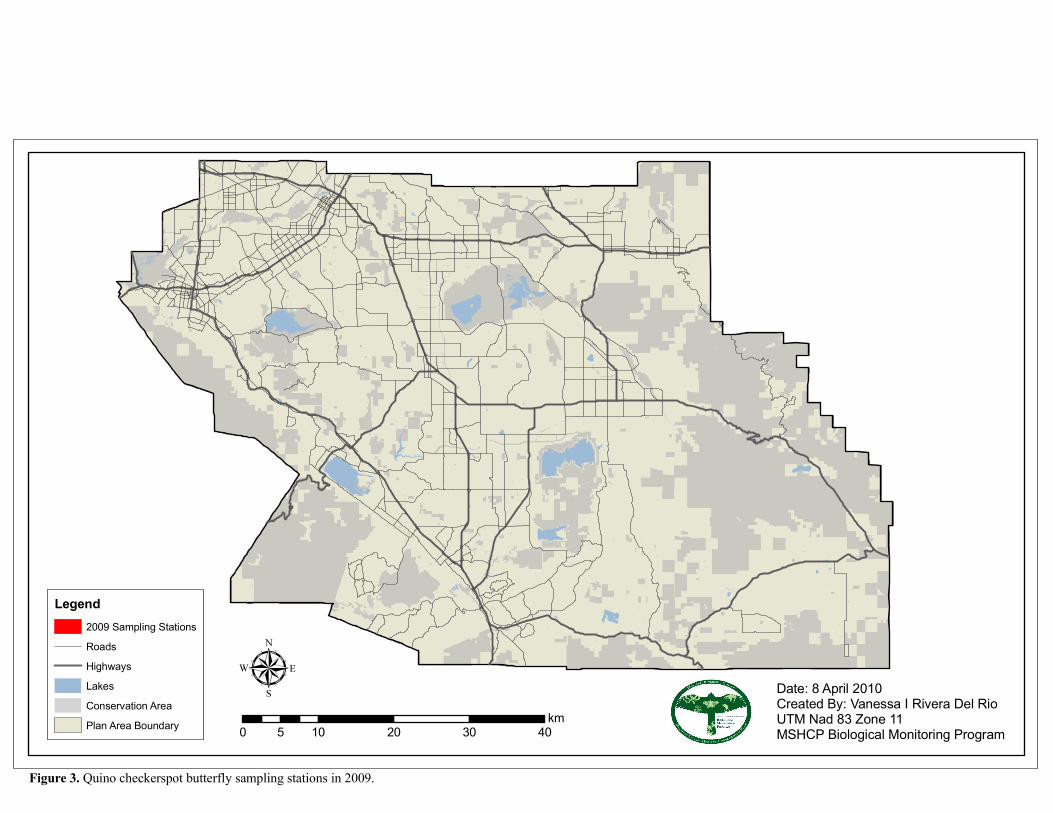
Figure 3. Quino checkerspot butterfly sampling stations in 2009.. ................................................................5
Table 1. Quino checkerspot butterfly sentinel site survey results in 2009....................................................12
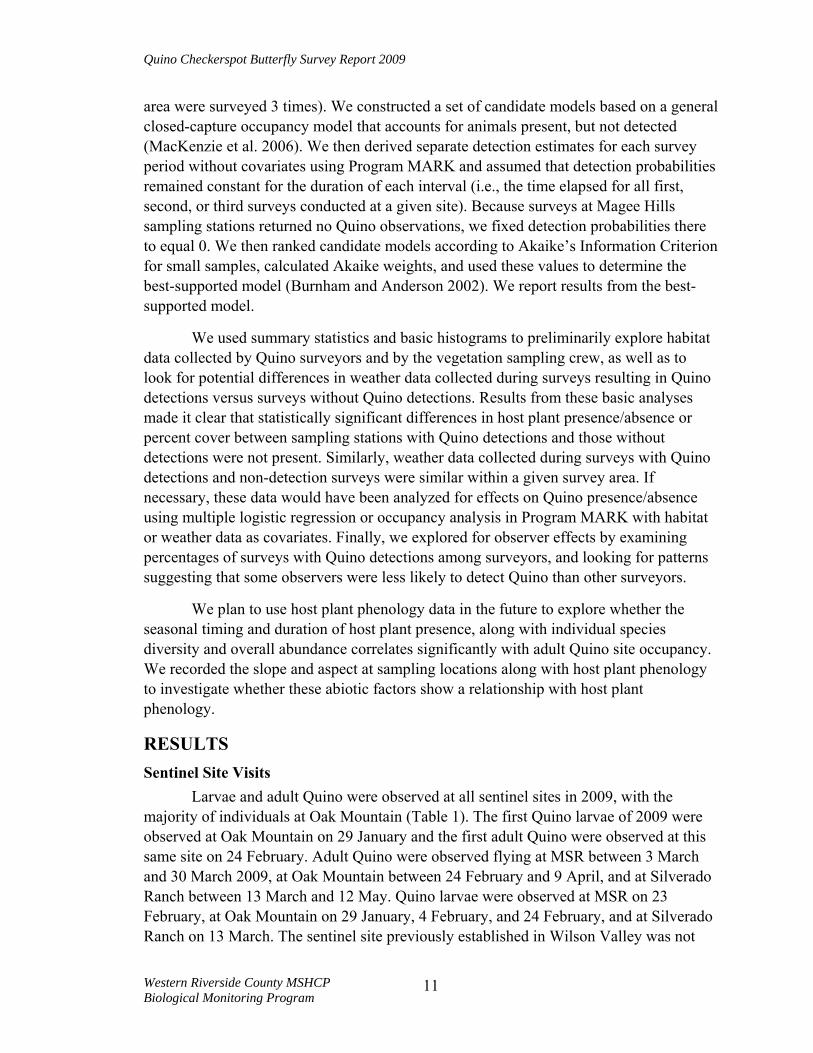
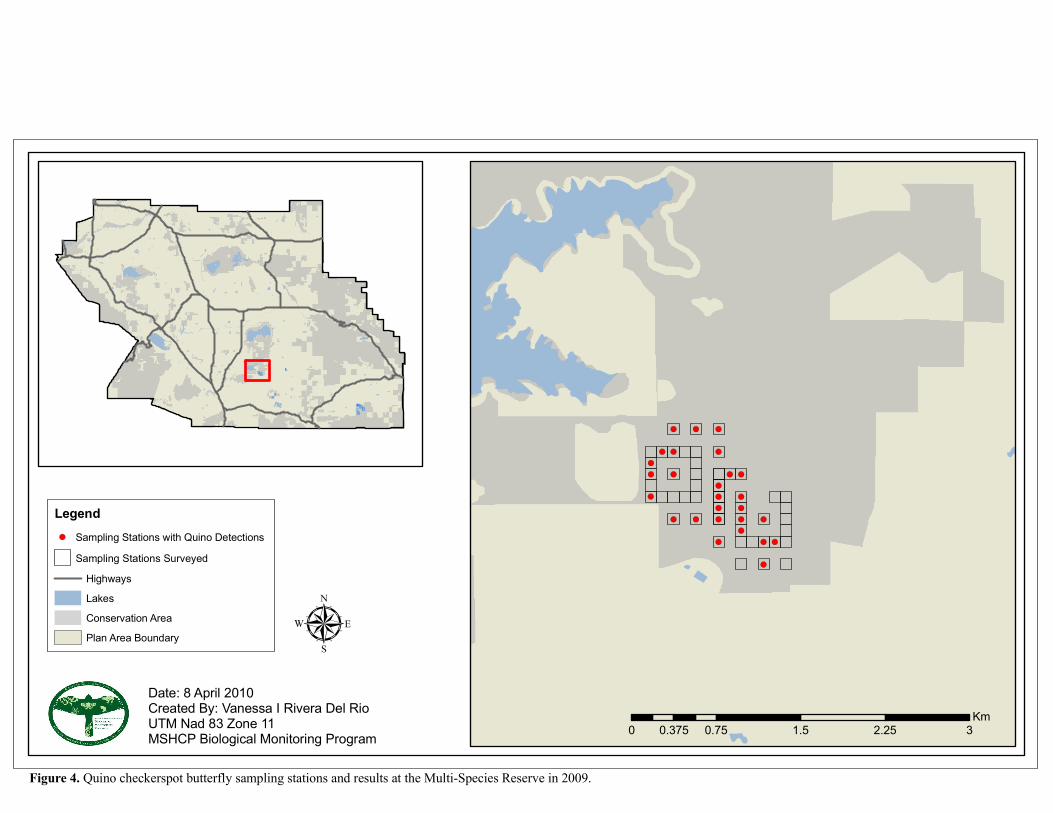
Figure 4. Quino checkerspot butterfly sampling stations and results at the Multi-Species Reserve in 2009. .............................................................................................................................13
Figure 5. Quino checkerspot butterfly sampling stations and results at Oak Mountain in 2009. .................14
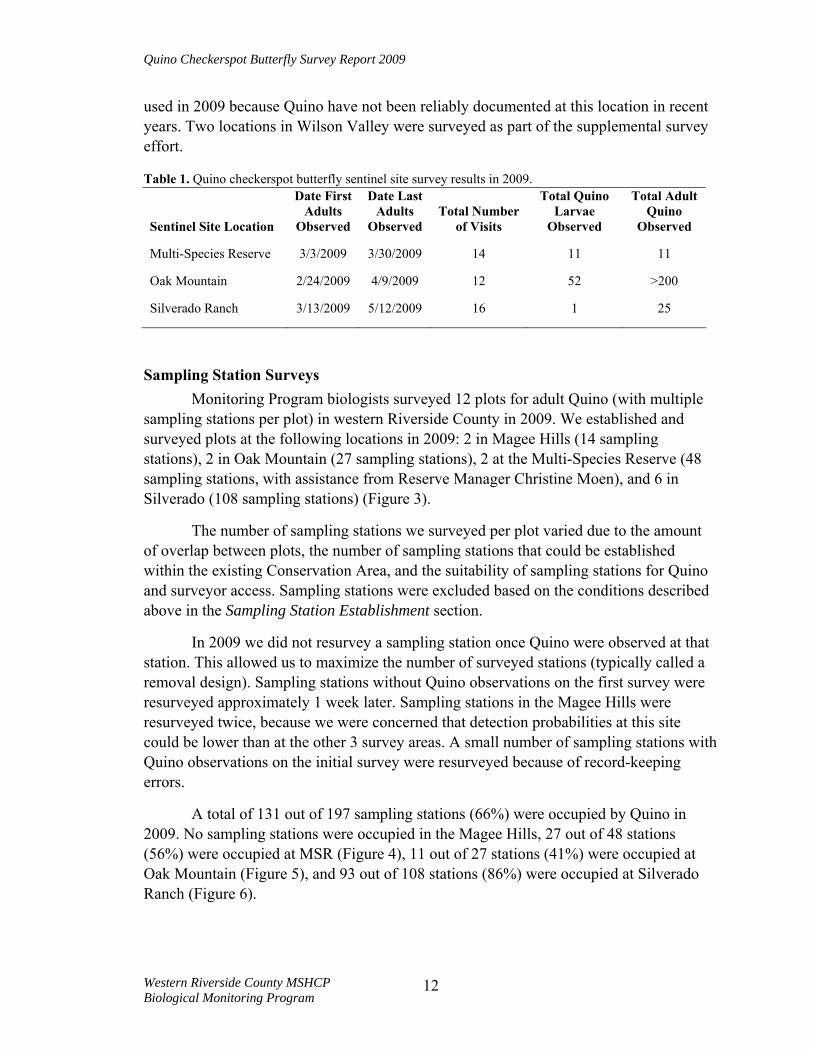
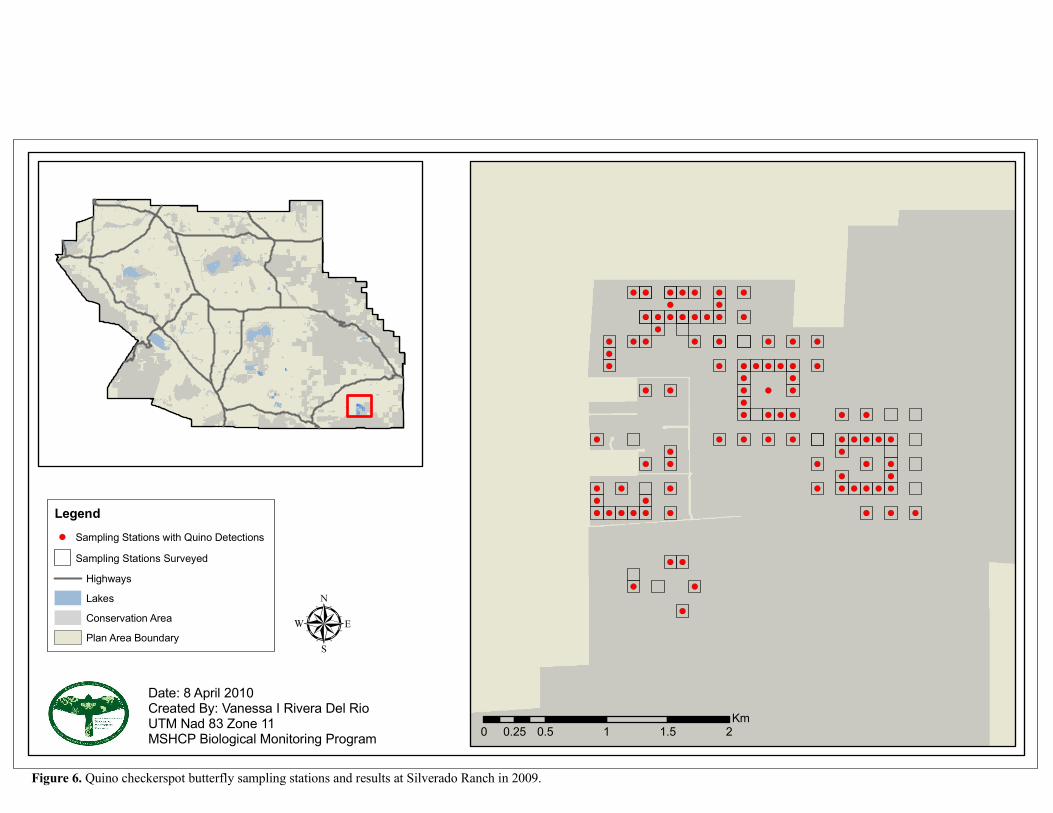
Figure 6. Quino checkerspot butterfly sampling stations and results at Silverado Ranch in 2009. ..............15
Western Riverside County MSHCP Biological Monitoring Program
ii
Quino Checkerspot Butterfly Survey Report 2009
Table 2. 2009 Quino survey results where p = detection probability, SE = standard error, LCI = lower 95% confidence interval, UCI = upper 95% confidence interval, and P* = cumulative detection probability.........................................................................................................................16
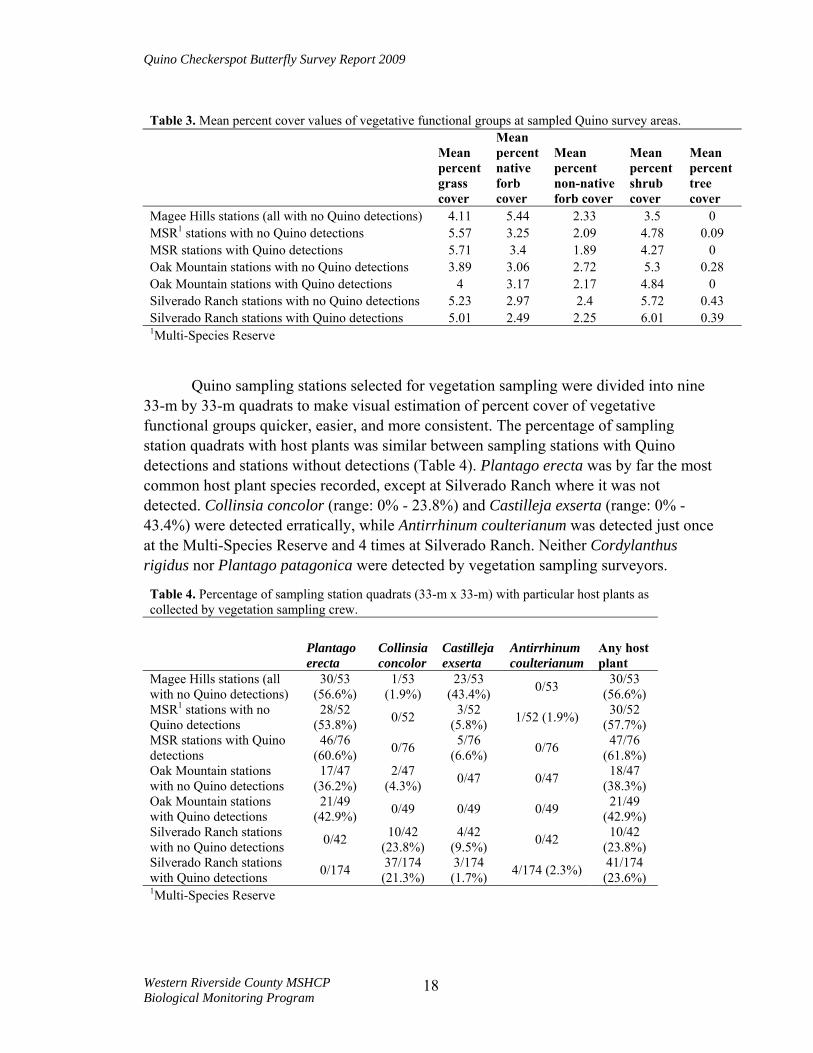
Table 3. Mean percent cover values of vegetation functional groups at sampled Quino survey areas.. .......18
Table 4. Percentage of sampling station quadrats (33-m x 33-m) with host plants as collected by vegetation sampling crew...................................................................................................................18
Table 5. Percentage of Quino sampling stations with host plants recorded during Quino surveys. .............20
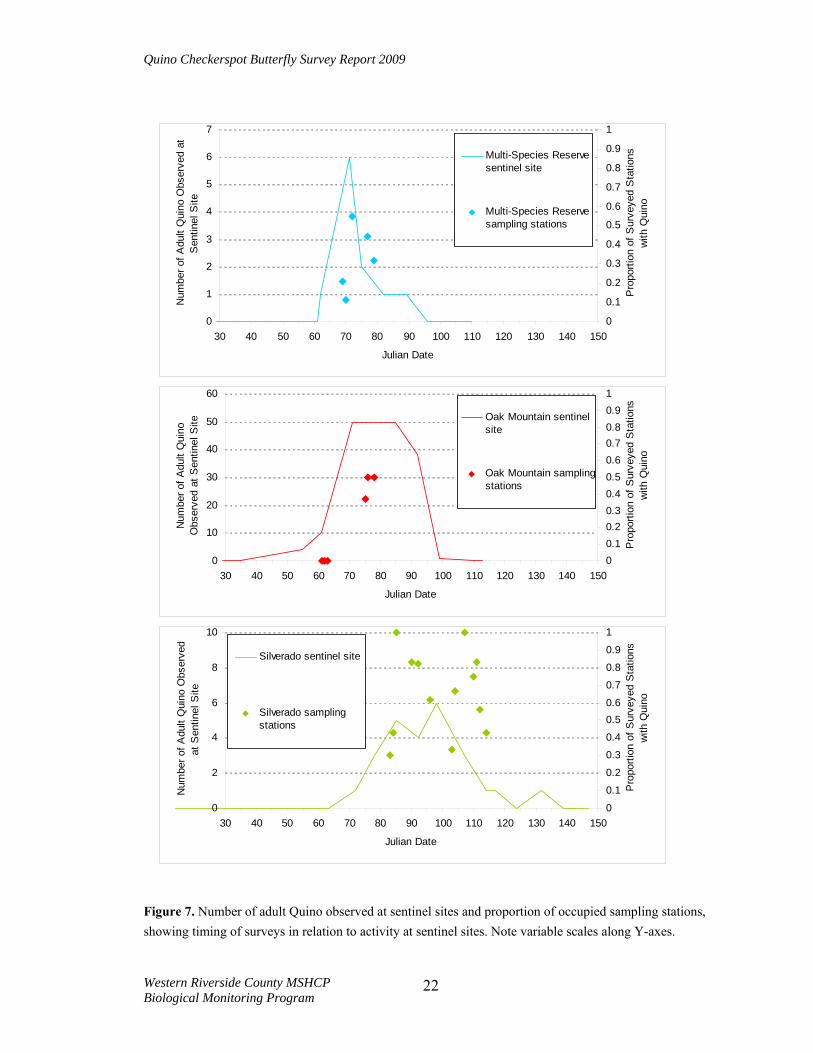
Figure 7. Number of adult Quino observed at sentinel sites and proportion of occupied sampling stations, showing timing of surveys in relation to activity at sentinel sites. Note variable scales along Y-axes .........22
LIST OF APPENDICES
Appendix A. Western Riverside County MSHCP Biological Monitoring Program Quino Checkerspot Butterfly Sentinel Site Survey Protocol, January 2009.....................................................26
Appendix B. Western Riverside County MSHCP Biological Monitoring Program Quino Checkerspot Butterfly Survey Protocol, January 2009..........................................................................31
Appendix C. Western Riverside County MSHCP Biological Monitoring Program Quino Checkerspot Butterfly Habitat Sampling Protocol, April 2009 .............................................................40
Western Riverside County MSHCP Biological Monitoring Program
iii
Quino Checkerspot Butterfly Survey Report 2009
NOTE TO READER:
This report is an account of survey activities conducted by the Biological Monitoring Program for the Western Riverside County Multiple Species Habitat Conservation Plan (MSHCP). The MSHCP was permitted in June 2004. The Monitoring Program monitors the distribution and status of the 146 Covered Species within the Conservation Area to provide information to Permittees, land managers, the public, and the Wildlife Agencies (i.e., the California Department of Fish and Game and the U.S. Fish and Wildlife Service). Monitoring Program activities are guided by the MSHCP species objectives for each Covered Species, the information needs identified in MSHCP Section 5.3 or elsewhere in the document, and the information needs of the Permittees.
MSHCP reserve assembly is ongoing and it is expected to take 20 or more years to assemble the final Conservation Area. The Conservation Area includes lands acquired for conservation under the terms of the MSHCP and other lands that have conservation value in the Plan Area (called public or quasi-public lands in the MSHCP). In this report, the term “Conservation Area” refers to the Conservation Area as understood by the Monitoring Program at the time the surveys were planned and conducted.
We would like to thank and acknowledge the land managers in the MSHCP Plan Area, who in the interest of conservation and stewardship facilitate Monitoring Program activities on the lands for which they are responsible. A list of the lands where data collection activities were conducted in 2009 is included in Section 7.0 of the Western Riverside County Regional Conservation Authority (RCA) Annual Report to the Wildlife Agencies. Partnering organizations and individuals contributing data to our projects are acknowledged in the text of appropriate reports.
While we have made every effort to accurately represent our data and results, it should be recognized that data management and analysis are ongoing activities. Any reader wishing to make further use of the information or data provided in this report should contact the Monitoring Program to ensure that they have access to the best available or most current data.
The primary preparer of this report was 2009 Lead Biologist, Adam Malisch. If there are any questions about the information provided in this report, please contact the Monitoring Program Administrator. If you have questions about the MSHCP, please contact the Executive Director of the RCA. Further information on the MSHCP and the RCA can be found at www.wrc-rca.org.
Contact Information:
Executive Director Western Riverside County MSHCP Western Riverside County Monitoring Program Administrator Regional Conservation Authority c/o Adam Malisch 4080 Lemon Street, 12th Floor 4500 Glenwood Drive, Bldg. C P.O. Box 1667 Riverside, CA 92501 Riverside, CA 92502-1667 Ph: (951) 782-4238 Ph: (951) 955-9700
Western Riverside County MSHCP Biological Monitoring Program
INTRODUCTION The Quino checkerspot butterfly (Euphydryas editha quino; Quino) is federally
listed as endangered and is sparsely distributed within the Western Riverside County MSHCP Plan Area. Species-specific conservation objective 4 for Quino states that “within the MSHCP Conservation Area, Reserve Managers will document the distribution of Quino checkerspot on an annual basis” (Dudek & Associates 2003).
The Biological Monitoring Program began developing a protocol in 2005 to determine the distribution of Quino across the Conservation Area. Additional goals were to estimate the detection probability of adult Quino, to calculate the proportion of area occupied by Quino (MacKenzie et al. 2006), and to gather data regarding Quino resource selection, important distribution covariates, and potentially important covariates affecting detection probability (e.g., temperature, wind speed, etc.). In 2008, we participated in a range-wide survey for adult Quino within 80 m of recent historical (1997-2007) observation locations as part of a U.S. Fish and Wildlife Service (USFWS) survey effort.
In 2009 we expanded upon the 2008 effort by concentrating our survey effort on known occupied areas and their immediate vicinity. We used confirmed adult Quino observations from within the MSHCP Conservation Area from the last 3 years as center-points for concentric circles of 1-ha sampling stations that expanded outward from recently occupied locations. We also gathered vegetation and other potentially important habitat data at surveyed locations with and without Quino detections to better quantify Quino habitat associations. We added an additional component of habitat monitoring in 2009 by collecting data on the phenology of recognized Quino host plants to look at the relationship between timing of host plant senescence and Quino occupancy in future years. Finally, we wanted to give ourselves an opportunity to document Quino at locations with adult Quino observations in the recent, but not immediate past (4 – 10 years ago) and areas adjacent to known occupied habitat. Because of limited time and personnel availability, we did not include these areas in the more intensive overall survey effort, but sent surveyors to search for adult Quino as often as they were available.
The goals and objectives for 2009 Quino surveys were as follows:
Goals and Objectives 1. Continue to monitor locations with recent adult Quino detections, and
determine the fine-scale distribution of Quino at occupied locations.
a. Distribute concentric circles of sampling stations around locations with Quino detections in the last 3 years.
b. Conduct multiple time-constrained surveys for adult Quino within established sampling stations, unless Quino are detected on the first survey.
Western Riverside County MSHCP Biological Monitoring Program
1
Quino Checkerspot Butterfly Survey Report 2009
c. Map surveyed sampling stations and occupied sampling stations to demonstrate distribution of occupied area at a given survey site.
2. Calculate the detection probability of adult Quino during the flight season at sites where Quino were recently detected following an occupancy-design framework (MacKenzie et al. 2006).
3. Gather vegetation and other potentially important habitat data at sampling stations with and without Quino detections to better quantify Quino habitat associations.
4. Opportunistically survey locations with historic Quino observations and areas adjacent to known occupied habitat.
METHODS Sampling Station Establishment
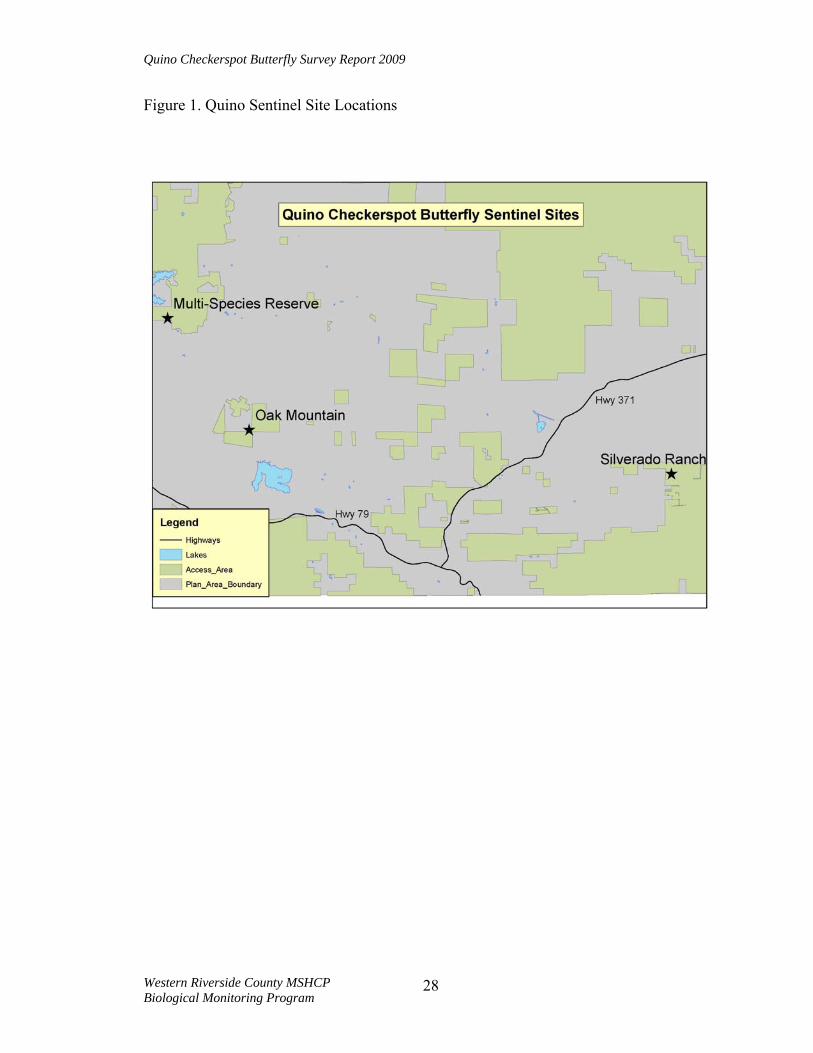
We conducted surveys on 1-ha (100-m x 100-m) sampling stations that expanded outward from recently occupied locations (within the last 3 years) in non-excluded habitat within Quino's range in the Conservation Area . We used weekly surveys of previously established sentinel sites distributed across the known current distribution of Quino in western Riverside County to document the beginning and end of the flight season in a given area, as evidenced by flying adult Quino. Sentinel sites in 2009 were located at the Southwestern Riverside County Multi-Species Reserve (MSR), Oak Mountain, and Silverado Ranch (Figure 1).
We selected sampling station locations based on the presence of recent adult Quino observations. Prior to the field season we used ArcGIS 9.3 (ESRI 2006) to create 1.3-km diameter plots composed of 1-ha sampling stations, centered on Quino observations from within the last 3 years (Figure 2). Plots were 9 sampling stations wide (E/W) and 9 stations tall (N/S). To maximize the number of plots that we could feasibly survey during the flight season, we only surveyed a subset of sampling stations within a given plot. Sampling stations preselected for survey within a plot included: the center station, every station within the second ring around the center station, and every-other station in the fourth ring around the center station (Figure 2). When recent Quino observation locations were close together (within approximately 500 m of each other) causing significant overlap between plots, we excluded observation locations closest to the center of the cluster, until there was little to no overlap between plots. We created 12 plots for surveys in 2009: 2 in the Magee Hills, 2 at MSR, 2 at Oak Mountain, and 6 at Silverado Ranch (Figure 3).
We also conducted supplemental surveys at 8 additional areas during the 2009 Quino flight season. We selected sites for supplemental surveys because they contained apparently suitable habitat and either had records of Quino from 4-10 years ago or were adjacent to known occupied habitat. We conducted supplemental surveys in 2009
Western Riverside County MSHCP Biological Monitoring Program
2
")
")
")
!(
!(!(
!(
!(
!(
!(
!(
!(
Figure 1. Quino checkerspot butterfly sentinel site locations, supplemental survey locations and supplemental survey results in 2009.
Date: 8 April 2010Created By: Vanessa I Rivera Del RioUTM Nad 83 Zone 11MSHCP Biological Monitoring Program
RoadsHighwaysLakesConservation AreaPlan Area Boundary 0 10 20 30 405
km
Quino Checkerspot Butterfly Survey Report 2009
igure 2. Example of plot of sampling stations to survey for Quino checkerspot butterfly in 2009. The center station (red), every station within the second ring around the center station (orange), and every-other F
station in the fourth ring around the center station (yellow) were preselected for survey.
Western Riverside County MSHCP Biological Monitoring Program
4
Figure 3. Quino checkerspot butterfly sampling stations in 2009.
Date: 8 April 2010Created By: Vanessa I Rivera Del RioUTM Nad 83 Zone 11MSHCP Biological Monitoring Program
at 1 or more locations at the following sites: El Sol, Brown Canyon, Horse Creek, MSR, Wilson Valley, Winchester 700A, Winchester 700B, and Winchester 700C (Figure 1). The El Sol, Winchester 700B, and Winchester 700C sites were surveyed because of their close proximity to known Quino populations; all other sites contained historic Quino observations. Supplemental survey sites did not contain sampling stations; we surveyed these areas by navigating to a predetermined location or locations at the site and searching for adult Quino in a methodical manner for approximately 2 hours. If the site contained historic Quino observation locations, we used the coordinates of those locations as the center of the search area. If the site was close to areas known to be occupied by Quino we used the center of the site as the center of the search area, focusing on potentially suitable Quino habitat.
Thirty-three sampling stations were preselected for surveys in each plot. However, we excluded sampling stations with any of the following attributes, even if they were located within otherwise potentially suitable habitat:
• any portion of the sampling station was outside of the current Conservation Area; • there was unsafe topography (e.g., slopes > 40%) or other conditions that made
walking surveys on the sampling station unsafe; • vegetation was so dense that surveying the sampling station in approximately 20
min was not practicable; • there was impenetrable vegetation and/or closed-canopy vegetation covering at
least half of the sampling station (closed-canopy describes vegetation in which the upper portions of the trees or shrubs converge or overlap to the extent that the open space between 2 or more plants is not significantly different than the open space within a single plant);
• the sampling station was vegetated by dense exotic annuals (more than half the sampling station was covered with exotic vegetation at > 60% cover).
We identified preselected sampling stations falling outside the Conservation Area in the office before surveys began, while the remaining decision criteria were evaluated in the field. Surveyors could replace excluded sampling stations with surveys on unassigned sampling stations containing presumed high quality habitat when it was present. Replacement sampling stations had at least 1 (but preferably all 3) of the following characteristics:
• an abundance (patches where the surveyor couldn’t walk without brushing flowers) of Quino nectar plants (any plant with open flowers);
• bare ground ( > 10% cover across the sampling station); • Quino host plant species (Plantago erecta, P. patagonica, Antirrhinum
coulterianum, Cordylanthus rigidus, Castilleja exserta, or Collinsia concolor) (USFWS 2003).
Western Riverside County MSHCP Biological Monitoring Program
6
Quino Checkerspot Butterfly Survey Report 2009
If surveyors observed Quino incidentally while walking between assigned sampling stations, they recorded a waypoint on their handheld GPS. If the surveyor excluded any sampling stations that day, they gave priority for replacement to the sampling station with the incidentally-detected butterfly.
Sentinel Site Visits To determine when to begin surveys in a given area, we monitored previously
established sentinel sites at 3 locations across the Conservation Area known to support populations of Quino. We believe these sites are representative of the currently known distribution of Quino within the MSHCP Conservation Area. Sentinel sites in 2009 were located at the Southwestern Riverside County Multi Species Reserve (MSR), Oak Mountain, and Silverado Ranch (Figure 1). In 2009 we discontinued using the sentinel site previously located in Wilson Valley due to the unreliability of detecting Quino in this area in recent years.
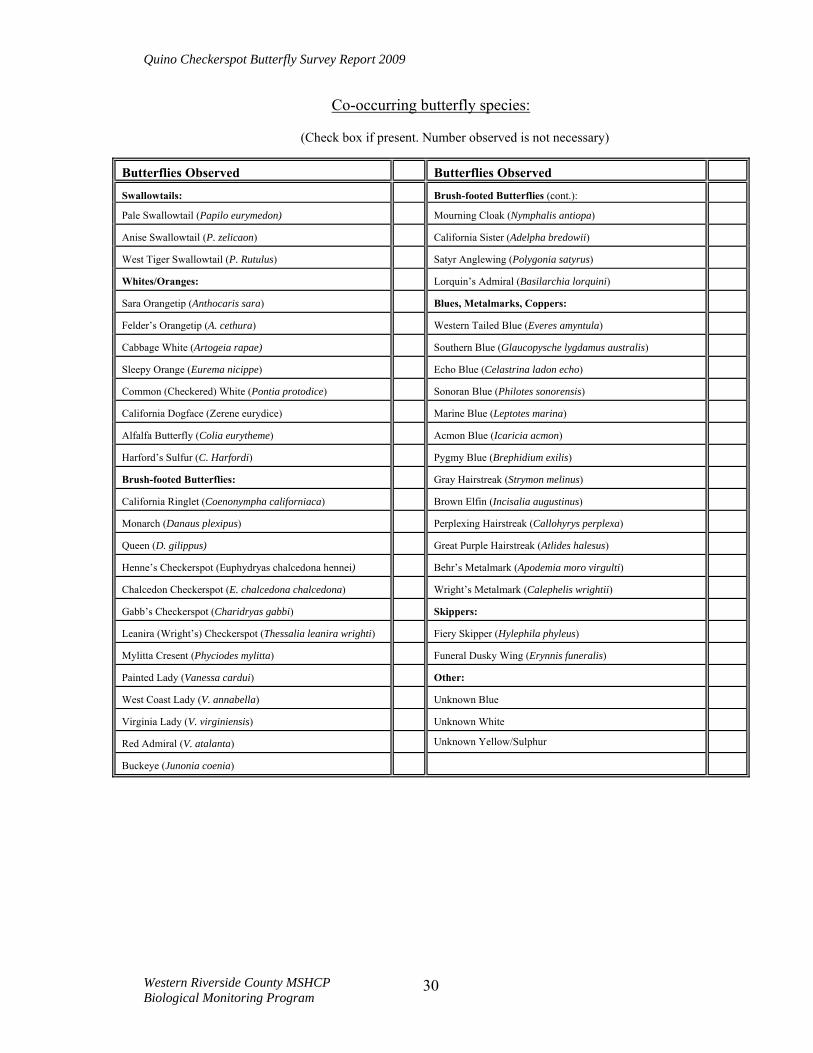
When spring conditions developed (i.e., sunny days with temperatures above 16° C), a trained Monitoring Program biologist visited each sentinel site approximately once per week to monitor the status of Quino at that site. Christine Moen, Multi-Species Reserve Manager, conducted the majority of sentinel site visits at MSR. Observers recorded Quino host plant status on-site, available nectar resources, number of Quino adults and larvae seen, co-occurring butterflies, start and end time, and weather during each sentinel site visit (Appendix A).
When surveyors observed 1 or more adult Quino at a given sentinel site, we initiated Quino surveys in the surrounding areas within 1 week of the observation. Sentinel site visits continued throughout the flight season until no Quino were observed for 2 consecutive visits.
Survey Methods We surveyed each selected 1-ha sampling station multiple times, unless Quino
were detected on the initial visit. If surveyors detected Quino on the initial visit, we recorded the sampling station as occupied and did not survey that station again in 2009. We surveyed sampling stations at MSR, Oak Mountain, and Silverado Ranch twice if no Quino were observed during the initial survey. We surveyed sampling stations located in the Magee Hills 3 times if no Quino were observed on the first or second surveys. We increased the survey effort in the Magee Hills because this site does not have the same long-term history of documented Quino occupancy as the other 3 areas and we were concerned that detection probabilities at this site could be lower than at the other 3 survey areas.
We conducted surveys between the hours of 0930 and 1430, when temperatures in the shade at ground level were > 15.5° C on a clear, sunny day, or > 21° C on an overcast or cloudy day, and sustained wind speeds were < 15 km per hour measured 1.2 - 1.8 m
Western Riverside County MSHCP Biological Monitoring Program
7
Quino Checkerspot Butterfly Survey Report 2009
above ground level. We did not conduct surveys outside of these hours or weather conditions, nor when there was fog or precipitation on-site.
Each surveyor was assigned approximately 10 sampling stations per day, although the actual number of sampling stations surveyed per person per day varied according to station locations, vegetation, and the number of stations that were excluded in the field based on the conditions described above. The sampling stations actually surveyed varied from those assigned according to the sampling station exclusion and inclusion rules.
On the first visit to a preselected sampling station, surveyors used a handheld GPS unit to navigate to the nearest corner of the station and assessed the habitat within the station as best as possible from that vantage point. Surveyors were provided with an aerial map of the sampling station to assist in habitat evaluation. If the station was deemed acceptable, the surveyor began the 20 min survey by recording the sampling station ID, date, survey begin time, temperature, cloud cover category (0, 1-20%, 21-40% 41-60% 61-80% 81-100%), wind speed, and observer name. After recording environmental conditions, surveyors began surveying for adult Quino as they navigated to each corner and the center-point of the station. Surveyors installed pinflags at the corner of each surveyed sampling station to help visualize the boundaries of the station. Surveyors spent 20 min searching the sampling station using meandering transects. Surveyors were instructed to cover the entire sampling station as best as possible, and not to leave the station during the allotted 20 minutes.
Surveyors recorded the number of Quino adults observed within the sampling station and the location coordinates of each Quino observed (or the coordinates of the center of the group if more than 1 Quino was observed within a 10-m diameter circle). Surveyors noted the species of any vegetation on which Quino individuals were observed perched or nectaring. Although detailed habitat data were collected by a separate vegetation sampling crew, Quino surveyors noted the presence of any host plants encountered within the sampling station. Surveyors also recorded co-occurring butterfly species encountered on a butterfly checklist and any butterfly larvae observed.
All pinflags were removed after the final survey, except on sampling stations requiring vegetation sampling. Pinflags on those stations were removed after all necessary data were collected. For a complete description of Quino survey methods in 2009 see Western Riverside County MSHCP Biological Monitoring Program Quino Checkerspot Butterfly Survey Protocol, January 2009 (Appendix B).
Personnel and Training All surveyors passed the USFWS Quino identification exam and observed live
Quino in the field with experienced Quino surveyors before conducting surveys. Biological Monitoring Program personnel were funded by the California Department of Fish and Game or the Regional Conservation Authority; volunteers are noted.
Western Riverside County MSHCP Biological Monitoring Program
8
Quino Checkerspot Butterfly Survey Report 2009
Biologists conducting Quino surveys in 2009 included:
Vegetation Sampling A separate crew collected vegetation and Quino habitat data at selected sampling
stations after surveys were complete. Due to time and personnel limitations we only collected vegetation/habitat data at a subset (approx. 20%) of the surveyed 1-ha sampling stations at each site, dividing effort roughly equally between stations with adult Quino observations and those without observations.
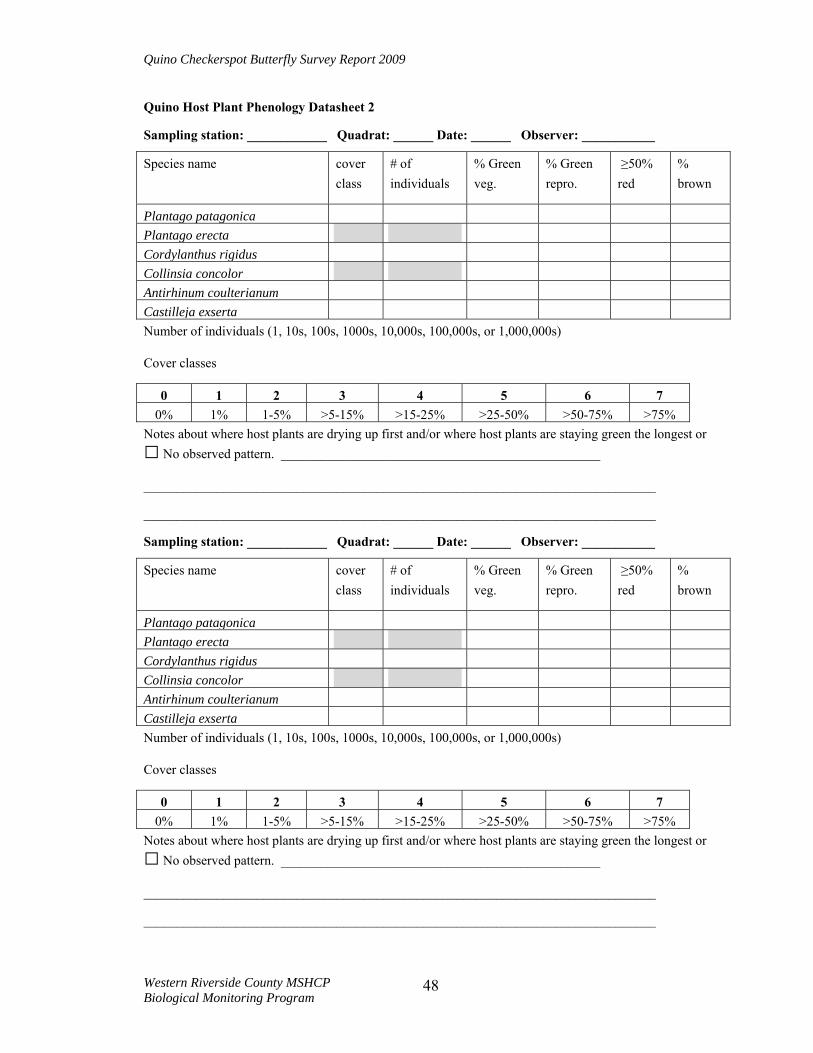
At each 1-ha sampling station, vegetation surveyors collected data in each of nine 33-m x 33-m sampling quadrats. Dividing the larger sampling station into smaller quadrats helped make visual estimation of percent cover of vegetative functional groups quicker, easier, and more consistent. Surveyors visually estimated the amount of cover provided by vegetative functional groups within each quadrat by assigning categorical cover classes (0%, <1%, 1-5%, >5-15%, >15-25%, >25-50%, >50-75%, >75%) to each functional group. We defined functional groups for this effort as: trees, shrubs, non-native forbs, native forbs, and grasses. These estimates give an absolute aerial cover, with each category not to exceed 100%. Surveyors also recorded the scientific names of up to 3 of the most common species within each functional group in the quadrat.
Vegetation surveyors also searched for Quino host plant species (Plantago erecta, Plantago patagonica, Cordylanthus rigidus, Collinsia concolor, Antirhinum coulterianum, and Castilleja exserta) (USFWS 2003) in each quadrat. Surveyors estimated the cover, number of individuals present, and phenological state of each host plant species found. Surveyors assigned a categorical cover class (0%, <1%, 1-5%, >5-15%, >15-25%, >25-50%, >50-75%, >75%) to each host plant species present. Surveyors also estimated the number of individuals present within an order of magnitude (i.e., 1s, 10s, 100s, with a maximum of 1,000,000s). We determined the percent of individuals of each host plant species that were present in each of 4 phenological states (green vegetative, green reproductive, over 50% red, brown). Phenology estimates for each host plant species present summed to 100%. Surveyors also recorded any other general information about the quadrat that may be relevant to Quino, such as dryness, variation in slope and aspect, interesting species diversity, or growth patterns.
Western Riverside County MSHCP Biological Monitoring Program
9
Quino Checkerspot Butterfly Survey Report 2009
Results of habitat surveys were used to identify quadrats with high numbers of Quino host plants (≥ 10,000 Plantago erecta individuals or ≥ 1000 Collinsia concolor individuals). Within each identified quadrat, we calculated slope and aspect in ArcGIS using a USGS digital elevation model with 30 m resolution. We calculated the “northness” of each quadrat, which can be interpreted as a scale from -1.0 to 1.0 in which low values represent xeric south-facing slopes and higher values represent mesic north-facing slopes. A subset of quadrats representing a broad range of northness values in sampling stations with and without Quino detections were selected for longer-term host plant phenology monitoring. In cases where quadrats sampled for habitat data do not represent the full range of northness values at a site, additional quadrats not previously sampled, but with adequate occurrences of Quino host plants, were also selected for host plant phenology monitoring. We limited the number of selected quadrats per site to the maximum number 1 person could survey in 1 day (approx. 8-9 quadrats). We collected habitat data at sites when adult Quino were known to be flying at that site. Surveyors collected host plant phenology data after collection of the initial habitat data and thereafter once per week until all host plants were completely desiccated.
Surveyors visited selected quadrats on a weekly basis to track the phenological progression of host plants through time. On the first visit to the quadrat, surveyors recorded the dominant slope and aspect using a clinometer and declinated compass, as well as recording information about host plant phenology. Surveyors estimated cover classes, number of individuals present, and phenological state of each host species found on subsequent visits until approximately 100% of all host species present were brown, at which point surveys were concluded at these quadrats. We assumed that completely desiccated vegetation was no longer an available food resource for Quino larvae. For a complete description of Quino vegetation and habitat sampling methods in 2009, see Western Riverside County MSHCP Biological Monitoring Program Quino Checkerspot Butterfly Habitat Sampling Protocol, April 2009 (Appendix C).
Data Analysis We stratified the 2009 data by our 4 survey areas and calculated detection
probabilities of adult Quino using Program MARK (White and Burnham 1999). While we did calculate the commonly-associated proportion of area occupied metric (MacKenzie et al. 2006), we do not report these values because these surveys were designed to determine the fine-scale distribution of Quino at relatively few survey sites within the Conservation Area and were not appropriate to scale-up, or extrapolate to a larger area of inference. The incomplete detection history resulting from not surveying every station multiple times resulted in a suboptimal analysis (relatively larger confidence intervals, increased numbers of non-estimable parameters, and a tendency to underestimate detection probabilities), but this is well compensated by the ability to survey more plots.
Before analyzing data, we divided survey results for each of the 4 survey areas into first, second, and third surveys (only sampling stations at the Magee Hills survey
Western Riverside County MSHCP Biological Monitoring Program
10
Quino Checkerspot Butterfly Survey Report 2009
area were surveyed 3 times). We constructed a set of candidate models based on a general closed-capture occupancy model that accounts for animals present, but not detected (MacKenzie et al. 2006). We then derived separate detection estimates for each survey period without covariates using Program MARK and assumed that detection probabilities remained constant for the duration of each interval (i.e., the time elapsed for all first, second, or third surveys conducted at a given site). Because surveys at Magee Hills sampling stations returned no Quino observations, we fixed detection probabilities there to equal 0. We then ranked candidate models according to Akaike’s Information Criterion for small samples, calculated Akaike weights, and used these values to determine the best-supported model (Burnham and Anderson 2002). We report results from the best-supported model.
We used summary statistics and basic histograms to preliminarily explore habitat data collected by Quino surveyors and by the vegetation sampling crew, as well as to look for potential differences in weather data collected during surveys resulting in Quino detections versus surveys without Quino detections. Results from these basic analyses made it clear that statistically significant differences in host plant presence/absence or percent cover between sampling stations with Quino detections and those without detections were not present. Similarly, weather data collected during surveys with Quino detections and non-detection surveys were similar within a given survey area. If necessary, these data would have been analyzed for effects on Quino presence/absence using multiple logistic regression or occupancy analysis in Program MARK with habitat or weather data as covariates. Finally, we explored for observer effects by examining percentages of surveys with Quino detections among surveyors, and looking for patterns suggesting that some observers were less likely to detect Quino than other surveyors.
We plan to use host plant phenology data in the future to explore whether the seasonal timing and duration of host plant presence, along with individual species diversity and overall abundance correlates significantly with adult Quino site occupancy. We recorded the slope and aspect at sampling locations along with host plant phenology to investigate whether these abiotic factors show a relationship with host plant phenology.
RESULTS Sentinel Site Visits
Larvae and adult Quino were observed at all sentinel sites in 2009, with the majority of individuals at Oak Mountain (Table 1). The first Quino larvae of 2009 were observed at Oak Mountain on 29 January and the first adult Quino were observed at this same site on 24 February. Adult Quino were observed flying at MSR between 3 March and 30 March 2009, at Oak Mountain between 24 February and 9 April, and at Silverado Ranch between 13 March and 12 May. Quino larvae were observed at MSR on 23 February, at Oak Mountain on 29 January, 4 February, and 24 February, and at Silverado Ranch on 13 March. The sentinel site previously established in Wilson Valley was not
Western Riverside County MSHCP Biological Monitoring Program
11
Quino Checkerspot Butterfly Survey Report 2009
used in 2009 because Quino have not been reliably documented at this location in recent years. Two locations in Wilson Valley were surveyed as part of the supplemental survey effort.
Table 1. Quino checkerspot butterfly sentinel site survey results in 2009.
Sentinel Site Location
Date First Adults
Observed
Date Last Adults
Observed Total Number
of Visits
Total Quino Larvae
Observed
Total Adult Quino
Observed
Multi-Species Reserve 3/3/2009 3/30/2009 14 11 11
Oak Mountain 2/24/2009 4/9/2009 12 52 >200
Silverado Ranch 3/13/2009 5/12/2009 16 1 25
Sampling Station Surveys Monitoring Program biologists surveyed 12 plots for adult Quino (with multiple
sampling stations per plot) in western Riverside County in 2009. We established and surveyed plots at the following locations in 2009: 2 in Magee Hills (14 sampling stations), 2 in Oak Mountain (27 sampling stations), 2 at the Multi-Species Reserve (48 sampling stations, with assistance from Reserve Manager Christine Moen), and 6 in Silverado (108 sampling stations) (Figure 3).
The number of sampling stations we surveyed per plot varied due to the amount of overlap between plots, the number of sampling stations that could be established within the existing Conservation Area, and the suitability of sampling stations for Quino and surveyor access. Sampling stations were excluded based on the conditions described above in the Sampling Station Establishment section.
In 2009 we did not resurvey a sampling station once Quino were observed at that station. This allowed us to maximize the number of surveyed stations (typically called a removal design). Sampling stations without Quino observations on the first survey were resurveyed approximately 1 week later. Sampling stations in the Magee Hills were resurveyed twice, because we were concerned that detection probabilities at this site could be lower than at the other 3 survey areas. A small number of sampling stations with Quino observations on the initial survey were resurveyed because of record-keeping errors.
A total of 131 out of 197 sampling stations (66%) were occupied by Quino in 2009. No sampling stations were occupied in the Magee Hills, 27 out of 48 stations (56%) were occupied at MSR (Figure 4), 11 out of 27 stations (41%) were occupied at Oak Mountain (Figure 5), and 93 out of 108 stations (86%) were occupied at Silverado Ranch (Figure 6).
Western Riverside County MSHCP Biological Monitoring Program
12
!(
!(
!(
!(
!(
!(
!(
!(
!(
!(
!(
!(
!(
!(
!(
!(
!(
!(
!(
!(
!(
!(
!(
!(
!(
!(
!(
Figure 4. Quino checkerspot butterfly sampling stations and results at the Multi-Species Reserve in 2009.
Date: 8 April 2010Created By: Vanessa I Rivera Del RioUTM Nad 83 Zone 11MSHCP Biological Monitoring Program
µ
Legend!( Sampling Stations with Quino Detections
Sampling Stations SurveyedHighwaysLakesConservation AreaPlan Area Boundary
0 0.75 1.5 2.25 30.375Km
!(
!( !(
!(
!(
!(
!(
!(
!(
!(
!(
Figure 5. Quino checkerspot butterfly sampling stations and results at Oak Mountain in 2009.
Date: 8 April 2010Created By: Vanessa I Rivera Del RioUTM Nad 83 Zone 11MSHCP Biological Monitoring Program
µ
Legend!( Sampling Stations with Quino Detections
Sampling Stations SurveyedHighwaysLakesConservation AreaPlan Area Boundary
0 0.5 1 1.5 20.25Km
!(
!(
!(
!(
!(
!(
!(
!(
!(
!(
!(
!(
!(
!(
!(
!(
!(
!(
!(
!(
!(
!(
!(
!(
!(
!(
!(
!(
!(
!(
!(
!(
!(
!(
!(
!(
!(
!(
!(
!(
!(
!(
!(
!(
!(
!(
!(
!(
!(
!(
!(
!(
!(
!(
!(
!(
!(
!(
!(
!(
!(
!(
!(
!(
!(
!(
!(
!(
!(
!(
!(
!(
!(
!(
!(
!(
!(
!(
!(
!(
!(
!(
!(
!(
!(
!(
!(
!(
!(
!(
!(
!(
!(
Figure 6. Quino checkerspot butterfly sampling stations and results at Silverado Ranch in 2009.
Date: 8 April 2010Created By: Vanessa I Rivera Del RioUTM Nad 83 Zone 11MSHCP Biological Monitoring Program
µ
Legend!( Sampling Stations with Quino Detections
Sampling Stations SurveyedHighwaysLakesConservation AreaPlan Area Boundary
0 0.5 1 1.5 20.25Km
Quino Checkerspot Butterfly Survey Report 2009
Several adult Quino were incidentally observed while walking to and from sampling stations in 2009. All incidental observations were made in areas already known to be occupied by Quino.
The detection probability for adult Quino varied widely among survey areas in 2009 (Table 2). No Quino were observed flying in the Magee Hills, therefore the detection probability for this site is 0, by definition. No sampling stations were occupied during the first round of surveys at Oak Mountain, so the detection probability for these visits was also 0; however the detection probability for the second round of surveys at Oak Mountain increased to 0.45. Detection probabilities for MSR and Silverado Ranch also increased from the first visit to the second visit (0.37 to 0.42, and 0.68 to 0.86, respectively). Cumulative detection probabilities incorporating data from all surveys ranged from 0.45 at Oak Mountain, to 0.63 at MSR, to 0.95 at Silverado Ranch.
Table 2. 2009 Quino survey results where p = detection probability, SE = standard error, LCI = lower 95% confidence interval, UCI = upper 95% confidence interval, and P* = cumulative detection probability. Survey area and visit number p SE LCI UCI P* Magee Hills visit 1 0.000 0.000 0.000 0.000 Magee Hills visit 2 0.000 0.000 0.000 0.000 0.000 Magee Hills visit 3 0.000 0.000 0.000 0.000 0.000 Multi-Species Reserve visit 1 0.369 0.079 0.232 0.532 Multi-Species Reserve visit 2 0.415 0.109 0.227 0.632 0.631 Oak Mountain visit 1 0.000 0.000 0.000 0.000 Oak Mountain visit 2 0.451 0.109 0.258 0.660 0.451 Silverado Ranch visit 1 0.677 0.060 0.550 0.782 Silverado Ranch visit 2 0.857 0.132 0.419 0.980 0.954
Although not reported here for the purposes of brevity, weather data collected during surveys with Quino detections and non-detection surveys were similar, within a given survey area. One exception involved an interesting pattern in Quino observations within the MSR sampling stations. Specifically, surveys on 10 and 11 March 2009 seemed to have relatively poorer results compared to 13 March. Just 5 out of 28 (17.9%) of surveyed sampling stations were occupied at MSR on March 10th and 11th combined, while 11 out of 20 (55.0%) of surveyed stations were occupied during surveys on 13 March at MSR. Different sampling stations were surveyed on these dates, so the observed detection rates could be due to real differences in occupancy among the stations surveyed. However, 13 March was warmer (18.9° C mean temperature recorded) than March 10th and 11th (17.4° C mean temperature); 13 March was slightly less windy than March 10th and 11th (2 mph average wind speed vs. 2.2 mph average); and 13 March was also less cloudy (no cloud cover recorded vs. estimates ranging up to ~50% cloud cover on March 10th and 11th). All of those differences should favor seeing more Quino on 13
Western Riverside County MSHCP Biological Monitoring Program
16
Quino Checkerspot Butterfly Survey Report 2009
March compared to March 10th and 11th. We still observed adult Quino on March 10th and 11th so survey conditions were acceptable, but appear to be less favorable than on the 13th. These results help highlight the importance of conducting multiple surveys of any given location or sampling station as weather conditions can be more or less favorable on any given day.
There were no apparent observer-effects on survey success, as most observers had approximately the same ratio of sampling stations surveyed with detections versus without detections. Two surveyors did not observe any Quino during surveys, but they conducted just 15 total surveys during the first round of surveys at Oak Mountain. Two other surveyors also conducted surveys during the first round of surveys at Oak Mountain and also did not observe any Quino during those surveys, but did observe Quino during subsequent surveys at Oak Mountain and at other locations. Both surveyors who did not observe Quino during 2009 surveys conducted dozens of surveys in 2006 and 2008 and have cumulatively observed hundreds of Quino, suggesting that the negative results they submitted from 2009 surveys were valid and not a result of observer error.
Supplemental Surveys
We detected adult Quino flying at historic locations at MSR, and at the Winchester 700C property (Figure 1). We observed a total of 31 Quino at 18 locations within MSR and 22 Quino at 3 locations at the Winchester 700C property. Documented Quino observations in 2009 at historical locations within MSR were all within 2 km of the consistently occupied sentinel site. Adult Quino were confirmed for the first time known to the Monitoring Program at the Winchester 700C property. The Winchester 700C property is approximately 1 km from Silverado Ranch, which maintains one of the best established populations of Quino within the Plan Area.
Vegetation Sampling We used summary statistics to explore for effects of general vegetation
(functional group percent cover) and host plant data on Quino presence/absence in surveyed sampling stations (Tables 3 – 5). We grouped results by survey area to control for underlying differences in these variables between areas. General vegetation data were collected by a separate vegetation sampling crew; host plant data were collected both by surveyors conducting Quino surveys, and by the vegetation sampling crew. While surveyors collected data at every sampling station, because of the additional time and expertise required, the vegetation sampling crew only collected data at a subset (approx. 20%) of surveyed sampling stations. Although there were some interesting results from vegetation sampling, as discussed below, there were no major differences in the vegetation at sampling stations with Quino detections and those without detections.
Mean percent cover values of vegetative functional groups (grass, native forbs, non-native forbs, shrubs, and trees) were very similar at sampling stations with Quino detections and at stations without detections (Table 3). Overall, grass, native forb, and shrub cover were higher than non-native forb and tree cover across all survey areas.
Western Riverside County MSHCP Biological Monitoring Program
17
Quino Checkerspot Butterfly Survey Report 2009
Table 3. Mean percent cover values of vegetative functional groups at sampled Quino survey areas.
Mean percent grass cover
Mean percent native forb cover
Mean percent non-native forb cover
Mean percent shrub cover
Mean percent tree cover
Magee Hills stations (all with no Quino detections) 4.11 5.44 2.33 3.5 0 MSR1 stations with no Quino detections 5.57 3.25 2.09 4.78 0.09 MSR stations with Quino detections 5.71 3.4 1.89 4.27 0 Oak Mountain stations with no Quino detections 3.89 3.06 2.72 5.3 0.28 Oak Mountain stations with Quino detections 4 3.17 2.17 4.84 0 Silverado Ranch stations with no Quino detections 5.23 2.97 2.4 5.72 0.43 Silverado Ranch stations with Quino detections 5.01 2.49 2.25 6.01 0.39 1Multi-Species Reserve
Quino sampling stations selected for vegetation sampling were divided into nine 33-m by 33-m quadrats to make visual estimation of percent cover of vegetative functional groups quicker, easier, and more consistent. The percentage of sampling station quadrats with host plants was similar between sampling stations with Quino detections and stations without detections (Table 4). Plantago erecta was by far the most common host plant species recorded, except at Silverado Ranch where it was not detected. Collinsia concolor (range: 0% - 23.8%) and Castilleja exserta (range: 0% - 43.4%) were detected erratically, while Antirrhinum coulterianum was detected just once at the Multi-Species Reserve and 4 times at Silverado Ranch. Neither Cordylanthus rigidus nor Plantago patagonica were detected by vegetation sampling surveyors.
Table 4. Percentage of sampling station quadrats (33-m x 33-m) with particular host plants as collected by vegetation sampling crew.
Plantago erecta
Collinsia concolor
Castilleja exserta
Antirrhinum coulterianum
Any host plant
Magee Hills stations (all with no Quino detections)
30/53 (56.6%)
1/53 (1.9%)
23/53 (43.4%) 0/53 30/53
(56.6%) MSR1 stations with no Quino detections
28/52 (53.8%) 0/52 3/52
(5.8%) 1/52 (1.9%) 30/52 (57.7%)
MSR stations with Quino detections
46/76 (60.6%) 0/76 5/76
(6.6%) 0/76 47/76 (61.8%)
Oak Mountain stations with no Quino detections
17/47 (36.2%)
2/47 (4.3%) 0/47 0/47 18/47
(38.3%) Oak Mountain stations with Quino detections
21/49 (42.9%) 0/49 0/49 0/49 21/49
(42.9%) Silverado Ranch stations with no Quino detections 0/42 10/42
(23.8%) 4/42
(9.5%) 0/42 10/42 (23.8%)
Silverado Ranch stations with Quino detections 0/174 37/174
(21.3%) 3/174 (1.7%) 4/174 (2.3%) 41/174
(23.6%) 1Multi-Species Reserve
Western Riverside County MSHCP Biological Monitoring Program
18
Quino Checkerspot Butterfly Survey Report 2009
The percentage of Quino sampling stations with host plants as recorded by Quino surveyors during surveys was also mostly similar between sampling stations with and without Quino detections (Table 5). Plantago erecta was by far the most common host plant encountered, except at Silverado Ranch where it was not detected. Castilleja exserta was detected infrequently at all survey areas. Collinsia concolor, Antirrhinum coulterianum, Cordylanthus rigidus, and P. patagonica were only detected at Silverado Ranch, where they were all uncommon.
The largest differences in the percentage of host plants at sampling stations with and without Quino detections were actually in the opposite direction than expected. For example, while nearly every sampling station without Quino detections at MSR had P. erecta (20/21, 95.2%) just 16 out of 27 sampling stations (59.3%) with Quino at MSR had P. erecta. Similarly, while 8 out of 15 stations (53.3%) without Quino detections at Silverado Ranch had some host plant species present, host plants were observed at just 15 out of 93 stations (16.1%) with Quino at Silverado Ranch.
DISCUSSION The primary goal of the 2009 Quino survey season was to determine the fine-
scale distribution of adult Quino at occupied locations by concentrating efforts at locations with recent Quino detections. Secondary goals were to calculate the detection probability of adult Quino during the flight season at sites where Quino were recently detected, to gather vegetation data at sampling stations with and without Quino detections to better quantify Quino habitat associations, and to opportunistically survey locations with historic Quino observations and areas adjacent to known occupied habitat.
Adult Quino were observed at 3 of 4 survey areas in 2009, with 56% of sampling stations occupied at MSR, 41% of stations occupied at Oak Mountain, 86% of stations occupied at Silverado Ranch, and no Quino observed in the Magee Hills (Figures 4-6). Since we began monitoring Quino’s distribution within the Conservation Area in 2005, the population at Magee Hills has not been as dependably detectable, nor as apparently abundant as those at the other survey sites (although we have never collected abundance data). Therefore it is less concerning that no Quino were observed at this location in 2009 than it would be for any of the other survey areas. Additionally, we know from previous years’ monitoring efforts that locations known to be historically occupied, but lacking observable Quino in a given year can support easily observable Quino populations in subsequent years. We will continue to monitor the Magee Hills location in future years.
Calculated detection probabilities for all survey areas where Quino were observed flying in 2009 rose from the first visit to the second visit, indicating that surveys began before the peak of the flight season. This was especially pronounced at Oak Mountain, where no Quino were seen during the first round of surveys but the detection probability rose to 45% during the second round of surveys. The first adults were seen at the Oak
Western Riverside County MSHCP Biological Monitoring Program
19
Quino Checkerspot Butterfly Survey Report 2009
Table 5. Percentage of Quino sampling stations with particular host plants recorded during Quino surveys.
Plantago erecta
Collinsia concolor
Castileja exserta
Antirrhinum coulterianum
Cordylanthus rigidus
Plantago patagonica
Any host plant
Magee Hills stations (all with no Quino detections) 13/14
(92.8%) 0/14 11/14
(78.6%) 0/14 0/14 0/1413/14
(92.8%)
MSR1 stations with no Quino detections 20/21
(95.2%)
0/21 0/21 0/21 0/21 0/2120/21
(95.2%)
MSR stations with Quino detections 16/27
(59.3%) 0/27 2/27
(7.4%) 0/27 0/27 0/2716/27
(59.3%)
Oak Mountain stations with no Quino detections 11/16
(68.8%) 0/161/16
(6.3%) 0/16 0/16 0/1611/16
(68.8%)
Oak Mountain stations with Quino detections 7/11
(63.6%) 0/112/11
(18.2%) 0/11 0/11 0/118/11
(72.7%)
Silverado Ranch stations with no Quino detections 0/15 2/15
(13.3%) 7/15
(46.7%) 0/15 1/15 (6.7%) 0/158/15
(53.3%)
Silverado Ranch stations with Quino detections 0/93 5/93
(5.4%) 3/93
(3.2%) 1/93 (1.1%) 6/93 (6.5%) 2/93 (2.2%) 15/93
(16.1%) 1Multi-Species Reserve
Western Riverside County MSHCP Biological Monitoring Program
20
Quino Checkerspot Butterfly Survey Report 2009
Mountain sentinel site on 24 February 2009, prompting surveys to begin in the surrounding area. However, just 4 adults were seen on the 24 February visit, compared to over 10 on 2 March, and over 50 by 12 March (Figure 7). The cumulative detection probability at Oak Mountain would almost certainly have increased considerably after another round of surveys and/or shifting the first round of surveys slightly later in the year, closer to the apparent peak of the flight season and height of detectability.
The MSR and second Oak Mountain surveys, although seemingly well-timed, had poorer calculated detection probabilities than at Silverado Ranch. Possible reasons for this difference include relatively lower Quino densities (or less-active individuals) at MSR and Oak Mountain, increased crew proficiency as the field season progressed (Silverado Ranch was surveyed later in the year as Quino consistently emerge later in the year in this area), or differences in survey dates relative to the flight season window at each area (if both rounds of surveys at MSR and Oak Mountain were conducted closer to the ideal peak of the flight season that could increase their detection probabilities relative to Silverado Ranch) (Figure 7).
Although we do not have the data to objectively discriminate between the above possibilities, anecdotal evidence from surveys in recent years suggests that Silverado Ranch has a more even distribution of Quino across a larger area. While MSR and Oak Mountain may have relatively high densities of Quino in 1 or 2 ‘hotspots’, rapidly decreasing densities expanding away from those hotspots could result in decreased detection probabilities as surveys are conducted in locations with fewer Quino to observe, making it relatively easier to miss those individuals in what is actually an occupied sampling area. Silverado Ranch does not appear to have these localized hotspots, but instead may support comparatively higher densities spread over a larger spatial extent. Again, we stress that the above discussion is speculative and based upon general observations from field surveys as opposed to data collected to provide relevant conclusions.
Habitat data collected in 2009 were generally very similar at sampling stations with Quino detections and at stations without detections. Exceptions to this were actually in the opposite direction than expected (and the opposite direction observed in previous years’ data), as higher percentages of sampling stations without detections in some survey areas had recognized host plant species as compared to sampling stations with detections.
While it is very likely that there are important differences in vegetation and habitat conditions at locations occupied by Quino compared to unoccupied locations, our attempt to identify these differences may have suffered from investigating at an incorrect spatial scale. We gathered vegetation data within surveyed 1-ha sampling stations at each of 4 general survey areas. Because stations with Quino detections and those without detections were sometimes adjacent to each other, vegetation data representing stations with and without detections were then collected at adjacent stations, and at stations very close to one another, if not immediately adjacent. Perhaps a better strategy would be to
Western Riverside County MSHCP Biological Monitoring Program
21
Quino Checkerspot Butterfly Survey Report 2009
0
1
2
3
4
5
6
7
30 40 50 60 70 80 90 100 110 120 130 140 150
Julian Date
Num
ber o
f Adu
lt Q
uino
Obs
erve
d at
Sen
tinel
Site
0
0.1
0.2
0.3
0.4
0.5
0.6
0.7
0.8
0.9
1
Pro
porti
on o
f Sur
veye
d S
tatio
nsw
ith Q
uino
Multi-Species Reservesentinel site
Multi-Species Reservesampling stations
0
10
20
30
40
50
60
30 40 50 60 70 80 90 100 110 120 130 140 150
Julian Date
Num
ber o
f Adu
lt Q
uino
O
bser
ved
at S
entin
el S
ite
00.10.20.30.40.50.60.70.80.91
Pro
porti
on o
f Sur
veye
d S
tatio
nsw
ith Q
uino
Oak Mountain sentinelsite
Oak Mountain samplingstations
0
2
4
6
8
10
30 40 50 60 70 80 90 100 110 120 130 140 150
Julian Date
Num
ber o
f Adu
lt Q
uino
Obs
erve
dat
Sen
tinel
Site
0
0.1
0.2
0.3
0.4
0.50.6
0.7
0.8
0.9
1P
ropo
rtion
of S
urve
yed
Sta
tions
with
Qui
noSilverado sentinel site
Silverado samplingstations
Figure 7. Number of adult Quino observed at sentinel sites and proportion of occupied sampling stations, showing timing of surveys in relation to activity at sentinel sites. Note variable scales along Y-axes.
Western Riverside County MSHCP Biological Monitoring Program
22
Quino Checkerspot Butterfly Survey Report 2009
look at the vegetation and habitat conditions at a larger spatial scale (across occupied general survey areas) and compare those conditions with the range of available vegetation types and species assemblages across the Conservation Area.
Vegetation datasets gathered by Quino surveyors during surveys and by the independent vegetation sampling crew each had strengths and weaknesses. Collecting data during surveys ensures that vegetation data are recorded for every sampling station surveyed, which ultimately resulted in Quino surveyors recording more host plant species at some survey areas than the vegetation sampling crew recorded (e.g., Quino surveyors recorded 2 occurrences of Plantago patagonica and 7 occurrences of Cordylanthus rigidus at Silverado Ranch, while the vegetation sampling crew did not detect these species in the subset of sampling stations they surveyed). However, the vegetation sampling crew was able to collect more detailed vegetation information, such as percent cover of vegetative functional groups, which is advantageous when characterizing habitat conditions at surveyed sampling stations. The quality of data collected by the vegetation sampling crew is also potentially superior to that collected by Quino surveyors as the priority for Quino surveyors is observing flying adult Quino, while the priority for the vegetation sampling crew is accurately describing target vegetation variables.
One final issue with vegetation sampling in 2009 was that it was impossible to obtain the desired equal sample sizes of vegetation data from sampling stations with and without detections at all survey areas. Eighty-six percent of surveyed sampling stations were occupied at Silverado Ranch in 2009, thus skewing the available pool of stations available for vegetation sampling. However, similar vegetation sampling results were obtained at all survey areas, including Oak Mountain and MSR where the ratio of sampling stations with and without detections available for vegetation sampling was much closer to equal, suggesting that the inequality at Silverado Ranch was not critically detrimental to the sampling design.
Recommendations for Future Surveys There are 2 informative questions about the status of Quino within the
Conservation Area we can currently address: 1) overall, geographic occurrence of Quino within established reserves, and 2) temporal changes in Quino occurrence at given locations. We will continue to prioritize question #1, until we are confident that we have adequately searched all potentially suitable Quino habitat within MSHCP reserves.
However, gathering data with which to address question #2 is also important. We have observed among-year changes in apparent Quino site-occupancy (e.g., we observed Quino at the Magee Hills site in 2008 but not in 2009). In the near future, if we keep re-surveying the putatively suitable locations (in conjunction with surveys at known-occupied locations), hopefully this will eventually allow us to stratify our sampling based on longer-term occupancy rates, which ideally will also reflect habitat suitability differences among sites.
Western Riverside County MSHCP Biological Monitoring Program
23
Quino Checkerspot Butterfly Survey Report 2009
Survey efforts during the 2010 flight season will depend upon available personnel. Given sufficient staff, we plan to continue with the study design employed in 2009, expanding the intensive survey effort to include the recently documented populations observed as a result of the supplemental surveys in 2009 (location north of the sentinel site at MSR, and Winchester 700C property). The existing plots at MSR, Oak Mountain, and Silverado Ranch will also be expanded to include sampling stations at the edges of the documented distributions at these reserves. If sufficient staff are not available for the intensive study design employed in 2009, we will prioritize continued monitoring of established sentinel sites. Understanding within- and among-year differences in the timing and duration of the Quino flight season will be essential to most efficiently direct future survey efforts. We will also monitor recently occupied locations and areas with apparently suitable habitat or that are adjacent to known occupied habitat with the same supplemental survey effort as employed in 2009.
Vegetation and habitat data collected to date by the Monitoring Program have not been sufficient to develop a statistically-supported model of areas more likely to support Quino populations. Additionally, more research is necessary to determine whether: 1) Quino are very patchily distributed throughout the landscape and do not occupy large patches of suitable habitat, or 2) our understanding of what constitutes suitable habitat is overly inclusive and inaccurate. At this point we are unable to consistently identify variables that are different at locations with Quino detections versus locations without detections. Although speculative, this suggests that there are several areas in western Riverside County that provide suitable habitat conditions for Quino presence, but that are not regularly occupied. There is continuing need for a quantitative multi-year dataset of habitat attributes at locations regularly used by Quino in order to build a well supported model of suitable Quino habitat. Future research should also focus on determining if the currently accepted determinants of Quino habitat suitability are correct, and the most relevant spatial scale at which to characterize habitat in order to classify suitability for Quino. Previous habitat attributes of interest include the presence, abundance, and phenology of host plants, the composition of the vegetation community (e.g., percent cover of vegetative functional groups including native and non-native shrubs, herbs, grasses, and associated amount of bare ground), soil type, slope, aspect, and distance from nearest known area where Quino are known to reproduce regularly. Recently initiated exploration of the effects of host plant phenology should continue, in order to examine the relationship between the timing of host plant senescence and Quino occupancy in future years.
Results from surveys for adult Quino in 2009 suggest that we began surveying before the peak of the flight season at Oak Mountain and MSR but likely conducted surveys during the peak during the second round of surveys. This is in contrast to previous years when we believed that we initiated surveys closer to the peak of the flight season and conducted further rounds of surveys as the season progressed toward completion. The most important factor in terms of detecting Quino is conducting at least 1 survey during the peak of the flight season. However, results from 2009 at both Oak
Western Riverside County MSHCP Biological Monitoring Program
24
Quino Checkerspot Butterfly Survey Report 2009
Mountain and MSR suggest that cumulative detection probabilities and percentages of sampling stations confirmed to be occupied would have increased with an additional round or rounds of surveys.
As a result of conducting surveys for Quino checkerspot butterfly since 2005 we have accumulated meaningful representations of the broad-scale (i.e., Conservation Area-wide) distribution of Quino and the results of surveys in 2009 serve to better delineate the fine-scale (i.e., reserve-level) distribution of Quino at particular survey areas. We are also gaining insight into the relative stability of the various Quino populations within the Conservation Area (i.e., which locations regularly support adult Quino and which locations appear to produce observable Quino only in years with presumably favorable environmental and/or habitat conditions). Continuing to address both the broad-scale and fine-scale distribution of Quino within the Conservation Area will appropriately meet the species-specific objective as described in the species account. We will also continue to work toward better addressing the factors driving the distribution of Quino in order to provide the best possible information to land managers and most efficiently direct future survey efforts.
LITERATURE CITED
Burnham KP, Anderson DR. 2002. Model selection and multimodel inference: a practical information-theoretic approach. 2nd Edition. New York: Springer-Verlag.
Dudek & Associates. 2003. Western Riverside County Multiple Species Habitat Conservation Plan (MSHCP). Final MSHCP, Volumes I and II. Prepared for County of Riverside Transportation and Lands Management Agency. Prepared by Dudek & Associates, Inc. Approved June 17, 2003.
[ESRI] Environmental Systems Research Institute ArcGIS: Release 9.2 [software]. 2006. Redlands (CA): Environmental Systems Research Institute.
MacKenzie D, Nichols J, Royle JA, Pollock KH, Bailey LL, Hines JE. 2006. Occupancy estimation and modeling. San Diego (CA): Elsevier.
[USFWS] U.S. Fish and Wildlife Service. 2003. Recovery Plan for the Quino Checkerspot Butterfly (Euphydryas editha quino). Portland, Oregon. 179 pp.
White GC, Burnham KP. 1999. Program MARK: Survival estimation from populations of marked animals. Bird Study 46 Supplement, 120-138.
Western Riverside County MSHCP Biological Monitoring Program
25
Quino Checkerspot Butterfly Survey Report 2009
Appendix A. Western Riverside County MSHCP Biological Monitoring
Program Quino Checkerspot Butterfly Sentinel Site Survey Protocol,
January 2009
The Biological Monitoring Program’s Quino checkerspot butterfly (Quino) survey
strategy relies on conducting surveys for adult butterflies only after the flight season in a
given year has begun and including surveys during the peak flight season (i.e., the portion
of the flight season when butterflies are most abundant and have the highest detection
probability). To determine when the flight season in a given area has begun, Monitoring
Program biologists visit previously established “sentinel sites” at 3 locations across the
Conservation Area known to support populations of Quino. We believe these sites are
representative of the currently known distribution of Quino within the MSHCP
Conservation Area. Sentinel sites are located at the Southwestern Riverside County
Multi-Species Reserve (MSR), Oak Mountain, and Silverado Ranch (Figure 1).
The primary purpose of sentinel site monitoring is to document adult Quino in
flight in a given area so that larger scale monitoring in nearby areas can be conducted
with the assumption that if Quino are present at a given site, they are flying and available
for detection. Secondary purposes are to determine gross abundance estimates from year-
to-year, and to track Quino habitat conditions on site including host plant distribution and
abundance, and available nectar plants.
METHODS
When spring conditions begin to develop (i.e., sunny days with temperatures
above 16° C), a Monitoring Program biologist visits each sentinel site to assess
vegetation conditions and surveys the site for adult Quino. Quino typically fly first at the
2 westernmost sentinel sites (MSR and Oak Mountain). Unless vegetation conditions or
larvae size indicate that the flight season is several weeks away, surveyors visit each
sentinel site approximately once per week to monitor the status of Quino at those sites.
Observers record Quino host plant status on-site, available nectar resources, number of
Quino larvae and adults seen, co-occurring butterflies, start and end time, and weather
conditions during each sentinel site visit.
Western Riverside County MSHCP Biological Monitoring Program
26
Quino Checkerspot Butterfly Survey Report 2009
Sentinel sites are defined by a single GPS waypoint, but surveyors are expected to
visit several surrounding hilltops or areas with the most appropriate Quino habitat.
Sentinel site surveys occur under the following conditions:
• between the hours of 0930 and 1430
• when temperatures in the shade at ground level are > 15.5 o C on a clear,
sunny day, or > 21 o C on an overcast or cloudy day
• with sustained wind speeds < 15 km per hour measured 1.2 - 1.8 m above
ground level
• no fog or precipitation on-site.
Unless the above conditions preclude a sentinel site survey in a given day, the
surveyor will spend at least 2 hours searching a sentinel site before concluding the survey
with no Quino observations. During the 2 hour survey the surveyor should thoroughly
cover the area immediately surrounding the waypoint for that sentinel site, and should use
their knowledge of Quino ecology to maximize opportunities for detection (e.g., visiting
hilltops, watching other butterflies, scanning vegetation with open flowers). If Quino are
observed, and adequate habitat data are recorded, the surveyor may conclude the survey
before 2 hours have expired. Because Quino is a federally-listed endangered species and
because these sentinel sites represent some of the best remaining sites, surveyors should
be extremely careful to avoid trampling larvae or host plants, disturbing cryptogamic
crusts, or otherwise adversely impacting the resources on site. To the fullest extent
possible, surveyors should use existing roads, trails, and rocks when walking and should
pay extreme caution to where their feet fall. Sentinel site visits can also be made by
partnering organizations or individuals. When this occurs, sufficient communication
should transpire so that no more than 1 total visit per week is made to any given sentinel
site. This will help minimize the impact on sentinel sites.
Sentinel site surveys should continue throughout the flight season until 2
consecutive visits return no Quino observations. This will indicate the approximate end
of the flight season.
Western Riverside County MSHCP Biological Monitoring Program
27
Quino Checkerspot Butterfly Survey Report 2009
Figure 1. Quino Sentinel Site Locations
Western Riverside County MSHCP Biological Monitoring Program
28
Quino Checkerspot Butterfly Survey Report 2009
Quino Checkerspot Butterfly Sentinel Site Survey Datasheet
Host Plant Condition: Green, Flowering or Senesced
Describe plant patch conditions (size of patch(es), height, etc.)
Plantago erecta G F S
Plantago patagonica G F S
Castilleja exserta G F S
Antirrhinum coulterianum G F S
Cordylanthus rigidus G F S
General Habitat Description: ________________________________________________________________________________________________________________________________________________
Photos taken (photo names): ________________________________________________________________________________________________________________________________________________
Western Riverside County MSHCP Biological Monitoring Program
30
Quino Checkerspot Butterfly Survey Report 2009
Appendix B. Western Riverside County MSHCP Biological Monitoring Program Quino Checkerspot Butterfly Survey Protocol, January 2009
INTRODUCTION
For the 2009 Biological Monitoring Program Quino checkerspot butterfly (Quino) survey season we plan to expand upon the range-wide survey effort initiated by the U. S. Fish and Wildlife Service (USFWS) in 2008. We will use confirmed adult Quino observations from within the western Riverside County MSHCP Conservation Area from the last 3 years as center-points for concentric circles of 1 ha sampling stations that will expand outward from the recently occupied locations.
This strategy should allow us to thoroughly monitor known populations while working towards better understanding the extent of each occupied area. Additionally, we hope to continue gathering data to better understand what constitutes suitable habitat for Quino. There are several vegetation, slope, and soil characteristics that are thought to determine what comprises suitable habitat, but surveys in what seems to be appropriate habitat routinely return no Quino observations. Adult butterflies are reasonably conspicuous and detection probabilities calculated in recent years show that if a given sampling station is surveyed multiple times the likelihood of observing at least 1 Quino is relatively high.
Therefore, 2 primary possibilities exist to explain why we observe Quino so rarely in areas that appear to be suitable habitat but that are not known to regularly support Quino populations. Either Quino are very patchily distributed throughout the landscape and do not occupy large patches of suitable habitat, or our understanding of what constitutes suitable habitat is overly inclusive and inaccurate. We hope to better understand the distribution of Quino throughout the landscape by expanding our survey area out from known locations, and to continue to improve our knowledge about what constitutes suitable habitat by continuing to collect habitat data from occupied and presumably unoccupied locations.
Survey Goals:
1. Gather habitat and environmental covariates in areas with Quino detections and those without detections to compare occupied and unoccupied habitat characteristics and refine our understanding of suitable habitat.
2. Locate adult Quino populations on 1 ha sampling stations that are near locations with at least 1 Quino occurrence between 2006 and 2008.
Western Riverside County MSHCP Biological Monitoring Program
31
Quino Checkerspot Butterfly Survey Report 2009
METHODS
Survey Locations: Surveys will be conducted on 1 ha sampling stations that will expand outward from recently occupied locations (within the last 3 years) in non-excluded habitat within the portion of the Conservation Area in the range of the species. In 2009, we plan to survey approximately 15 plots (each with varying numbers of sampling stations as discussed below) within the Western Riverside County MSHCP Conservation Area.
Timing: Weekly surveys of sentinel sites distributed across the known current distribution of Quino in western Riverside County will be used to document the beginning and end of the flight season in a given area, as evidenced by flying adult Quino. Sentinel sites in 2009 will be located at the Western Riverside County Multi-Species Reserve (Lake Skinner), Oak Mountain, and Silverado Ranch.
Each 1 ha sampling station selected for survey will be surveyed twice within 2 weeks unless Quino are detected on the initial visit. If Quino are detected on the initial visit, this will serve as evidence that the sampling station is occupied and it will not be surveyed again in 2009.
Sampling Station Establishment: Sampling stations will be 100 m x 100 m (1 ha) and will be staked with visible markers (pinflags) at the 4 corners at the beginning of the first survey. Sampling station corner markers will be removed at the conclusion of the second survey unless the sampling station has been selected for vegetation sampling (see below).
Sampling station locations were selected based on the presence of recent adult Quino observations. Prior to the field season we used a GIS to create a 1.3 km diameter plot of 1 ha sampling stations, centered on Quino observations from within the last 3 years (Figure 1). Plots are 13 sampling stations wide (E/W) and 13 stations tall (N/S). Only a subset of sampling stations within a given plot will be surveyed. Although there is expected to be some variation based on conditions in the field, sampling stations preselected for survey within a plot will include: the center station, every station within the second ring around the center station, and every-other station in the fourth ring around the center station (Figure 1). If time and personnel availability allow, we will also survey every-other sampling station in the sixth ring around the center station. When recent survey locations were close together (within approximately 500 m of each other) causing significant overlap between plots, the points closest together were excluded and not used as center-points for plots. Thus 15 plots were created for surveys in 2009. An additional plot with reduced extent was centered on an older Quino observation location in Brown Canyon. Only the center sampling station and stations within the second ring around the center station will be surveyed in this plot.
Western Riverside County MSHCP Biological Monitoring Program
32
Quino Checkerspot Butterfly Survey Report 2009
If every preselected sampling station from a given plot is surveyed and no additional stations are added, 33 sampling stations will be surveyed in each plot. However the following sampling stations will be excluded, even when found within otherwise potentially suitable habitat:
• any portion of the sampling station is outside of the current Conservation Area; • there is unsafe topography (e.g., slopes ≥ 40%) or other unsafe conditions for
walking surveys on the sampling station; • vegetation is so dense that surveying the sampling station in approximately 20
min is not practicable; • there is impenetrable vegetation and/or closed-canopy vegetation covering at least
½ of the sampling station (closed-canopy describes vegetation in which the upper portions of the trees or shrubs converge or overlap to the extent that the open space between 2 or more plants is not significantly different than the open space within a single plant);
• the sampling station is vegetated by dense exotic annuals (more than ½ the sampling station is covered with exotic vegetation at > 60% cover).
Surveyors may replace surveys in assigned sampling stations that were excluded with surveys on unassigned sampling stations with good habitat. Care should be taken so that the day’s work effort covers the appropriate area. Replacement sampling stations should have:
• an abundance (patches where you can’t walk without brushing flowers) of Quino nectar plants (any plant with open flowers);
• bare ground ( > 10% cover across the sampling station); • Quino host plant species (Plantago erecta, P. patagonica, Antirrhinum
coulterianum, Cordylanthus rigidus, and Castilleja exserta).
If surveyors observe Quino incidentally while walking between assigned sampling stations, a waypoint will be taken. If the surveyor has excluded sampling stations, they can choose to survey the sampling station with the incidentally detected butterfly.
Note that preselected sampling stations falling outside the Conservation Area will be identified in the office before surveys begin while the remaining decision criteria will be evaluated in the field. Sampling stations will be evaluated by walking to the center-point of the sampling station and visually scanning the area.
Sampling stations with Quino observations will become center-points for future plots (excluding the center sampling station of an original plot). These second-generation plots will be surveyed after originally selected plots within a given area are completed if time and personnel availability allow. The end of the flight season in a given area will be identified by continued monitoring of nearby sentinel sites. If we are not able to survey second-generation plots in 2009, they will be surveyed in 2010.
Western Riverside County MSHCP Biological Monitoring Program
33
Quino Checkerspot Butterfly Survey Report 2009
Survey Methods: Surveys will only be conducted between the hours of 0930 and 1430, when temperatures in the shade at ground level are > 15.5 o C on a clear, sunny day; or > 21 o C on an overcast or cloudy day, and sustained wind speeds are < 15 km per hour measured 1.2 - 1.8 m above ground level. Surveys shall not be conducted outside of these hours or weather conditions, and not when there is fog or precipitation on-site. All surveyors will pass the USFWS Quino identification exam and will have observed live Quino in the field with experienced Quino surveyors before conducting surveys.
Each surveyor will be assigned approximately 12 sampling stations to survey per day, although it is expected that the number of actual sampling stations surveyed per person per day will vary according to station locations, habitat conditions, and the number of sampling stations that are excluded. As stated above, the actual sampling stations surveyed will also vary according to the sampling station exclusion and inclusion rules.
On the first visit to a preselected sampling station surveyors will use a GPS unit to navigate to the nearest corner of the station and will assess the habitat within the plot as best as possible from that vantage point. Surveyors will be provided with an aerial map of the sampling station to assist in habitat evaluation. If a portion of the sampling station is excluded, the excluded portion should be drawn on the sampling station map. If the sampling station is deemed acceptable, the surveyor will place a pinflag at the corner and will begin the survey by recording the sampling station ID, date, survey begin time, temperature, cloud cover category (0, 1-20%, 21-40% 41-60% 61-80% 81-100%), wind speed, and observer name. After recording environmental conditions, surveyors will begin surveying for Quino as they navigate to each corner and the center-point of the station. Surveyors will place pinflags marking the location of each corner and the center-point as they are reached, while maintaining focus on searching for butterflies.
The 4 marked corners and center-point will serve as a guide for staying within the sampling station boundaries. Surveyors will continue to search for Quino on the sampling station until 20 minutes have elapsed since survey time was first recorded. Surveyors are free to search the sampling stations in their own manner, provided the entire sampling station is surveyed within the 20 minute search time and they do not leave the sampling station during the survey. During surveys, surveyors should focus all of their attention within the sampling station. Co-occurring butterfly sightings outside the sampling station should be ignored. Quino observed outside of the sampling station should be recorded as incidental observations. Search times will be monitored using stopwatches or timers.
Surveyors should:
• move carefully to minimize trampling or otherwise harming Quino larvae and their host plants;
• walk slowly and stop occasionally to look around – surveyors standing still are more likely to see a moving butterfly;
Western Riverside County MSHCP Biological Monitoring Program
34
Quino Checkerspot Butterfly Survey Report 2009
• use binoculars to scan the surrounding areas and to help identify butterflies from a distance;
• pay special attention to areas with a high potential for Quino use, such as patches of nectar sources, ridgelines and hilltops, and bare or sparsely vegetated areas between shrubs;
• follow the movements of other butterflies. Quino males are aggressive, can spot other butterflies from a distance, and will chase them.
Surveyors will record the number of Quino adults observed on the sampling station and the location coordinates of each Quino observed. If 2 or more Quino individuals are observed in the same small area (~10 m diameter circle) these can be recorded with the same waypoint, taken near the center of the cluster, but remember to record the number of Quino observed at that location on the datasheet. Quino individuals observed may be photographed if this is possible in a short amount of time; do not chase confirmed Quino around the sampling station to try to get photos. Surveyors will note the species of any vegetation Quino individuals are observed perched or nectaring on. If the species is unknown, collect a sample for identification in the office. Surveyors will also record the coordinates of any incidental observations of Quino larvae. Although detailed habitat data will be collected by a separate crew, surveyors should note the presence of any host plants encountered within the sampling station.
Surveyors will record co-occurring butterfly species encountered on the butterfly checklist. Counts of co-occurring species are unnecessary. If a butterfly is observed that is not Quino, but is not easily identified to species, do not waste time attempting to identify the species – simply record what is known on the space provided on the datasheet (e.g. “Unknown White”, “Unknown Blue”, “Unknown Lady”).
Surveyors will remain vigilant about looking for Quino at all times when not surveying sampling stations (walking to and from stations). The coordinates of all observations outside of sampling stations will be recorded with a GPS, clearly marked as having occurred outside the sampling station. Waypoint locations are to be transferred to the data sheet at the end of the survey day.
All pinflags will be removed after the second survey, except for pinflags on sampling stations requiring covariate habitat data collection, which will be removed after all covariate data has been collected. Covariate habitat data will be recorded on a later date by a separate crew on all sampling stations with Quino observations and on a randomly selected adjacent unoccupied sampling station.
Equipment needed per surveyor
Maps of survey areas Handheld GPS unit
Datasheets Extra batteries
Western Riverside County MSHCP Biological Monitoring Program
35
Quino Checkerspot Butterfly Survey Report 2009
(yellow) is pre-selected for survey.
Pens Stopwatch or timer
Pinflags Binoculars
Pocket weather station (e.g., Kestrel) Digital camera with zoom lens
Data Analysis: Data for all sampling stations surveyed in western Riverside County in 2009 will be combined and used to calculate the proportion of area occupied and detection probability using Program MARK (White and Burnham 1999) or PRESENCE (MacKenzie et al. 2003). Habitat data collected from occupied sampling stations and sampling stations presumed to be unoccupied will be used to help build a model of suitable Quino habitat within the Conservation Area.
Figure 1. Example of plot of sampling stations to survey for Quino checkerpot butterfly in 2009. The center station (red), every station within the second ring around the center station (orange), and every-other station in the fourth ring around the center station
Western Riverside County MSHCP Biological Monitoring Program
36
Quino Checkerspot Butterfly Survey Report 2009
EFERENCES:
. D. Nichols, J. E. Hines, M. Knutson, and A. B. Franklin. 2003.
White, G : Survival estimation from
R
MacKenzie, D. I., JEstimating site occupancy, colonization, and local extinction when a species is detected imperfectly. Ecology 84:2200-2207.
.C. and K. P. Burnham. 1999. Program MARKpopulations of marked animals. Bird Study 46 Supplement, 120-138
Western Riverside County MSHCP Biological Monitoring Program
37
Quino Checkerspot Butterfly Survey Report 2009
Quino Checkerspot Butterfly Survey Form Surveyor ____________Area _______________ Sampling Station____________
Visit#_______ Date ____________ Start Time_______ End Time_________
Western Riverside County MSHCP Biological Monitoring Program
39
Quino Checkerspot Butterfly Survey Report 2009
Appendix C. Western Riverside County MSHCP Biological Monitoring Program Quino Checkerspot Butterfly Habitat Sampling Protocol, April 2009
INTRODUCTION
For the 2009 Biological Monitoring Program Quino checkerspot butterfly (Quino) survey we plan to use confirmed adult Quino observations from within the Western Riverside County MSHCP Conservation Area from the last 3 years as center-points for concentric circles of 1-ha sampling stations that will expand outward from the recently occupied locations. This strategy should allow us to thoroughly monitor known populations while continuing to gather data to better understand what constitutes suitable habitat for Quino. There are several vegetation, slope, and soil characteristics that are thought to determine what comprises suitable Quino habitat, but surveys in what seems to be appropriate habitat (i.e., locations that at least superficially resemble occupied areas) routinely return no Quino observations. We hope to continue to improve our knowledge about what constitutes suitable habitat by collecting habitat data from occupied and unoccupied locations. In addition, we want to track the phenology of Quino host plants to determine if season length is related to Quino distribution in the following year.
Quino Habitat Sampling Goals:
1. Gather habitat data in areas with Quino detections and those without detections to compare occupied and unoccupied habitat characteristics and refine our understanding of suitable habitat. This information may be used to help create models of potentially suitable Quino habitat to direct future survey efforts.
2. Gather habitat data in areas with Quino detections and those without detections to use as covariates in a Quino occupancy analysis (MacKenzie et al 2003).
3. Collect data on the phenology of Quino host plants to look at the relationship between timing of host plant senescence and Quino occupancy in future years.
METHODS
Sampling Locations: Surveys for adult Quino will occur at 4 sites: Southwestern Riverside County Multi-Species Reserve (MSR), Oak Mountain, Magee Hills, and Silverado Ranch (Silverado). Surveyors will collect general habitat data at 10% to 20% of the surveyed 1-ha sampling stations at each site, dividing effort equally between stations occupied by adult Quino and those that are unoccupied. At each 1-ha sampling station, surveyors will collect data in each of nine 33-m x 33-m sampling quadrats. Results of habitat surveys will be used to identify quadrats with high numbers of Quino host plants (≥10,000 Plantago erecta individuals or ≥1000 Collinsia sp. individuals). Within each identified quadrat, slope and aspect will be calculated in ArcGIS from a USGS Digital Elevation Model with 30 m resolution. Northness will be calculated as:
Western Riverside County MSHCP Biological Monitoring Program
40
Quino Checkerspot Butterfly Survey Report 2009
N = cosine(azimuth) x sine(slope). This index provides a scale from -1.0 to 1.0 in which low numbers represent xeric south-facing slopes and higher values represent mesic north-facing slopes. Quadrats for host plant phenology monitoring will be selected from the identified quadrats to represent a broad range of northness values in both occupied and unoccupied sampling stations. In cases where the quadrats sampled for habitat data do not represent the full range of northness values at a site, additional quadrats not previously sampled, but with adequate occurrences of Quino host plants, may also be selected for host plant phenology monitoring. We will select only as many quadrats per site as 1 person can survey in 1 day.
Timing: Surveyors will collect habitat data at a site when adult Quino are flying at that site. Surveyors will collect host plant phenology data after collection of the initial habitat data and thereafter once per week until all host plants are completely desiccated.
Plant identification aids Plant identification aids
Topographic map Topographic map
Datasheets Datasheets
Handheld GPS unit Handheld GPS unit
Declinated compass
Clinometer
Western Riverside County MSHCP Biological Monitoring Program
41
Quino Checkerspot Butterfly Survey Report 2009
Habitat Sampling Methods: Surveyors will be provided with coordinates for the corner points of the nine 33-m x 33-m quadrats that constitute each sampling station. These quadrats are numbered from 1 to 9, starting from the northwest quadrat and continuing from left to right as shown below (Figure 1). Surveyors may want to flag each corner of the quadrat to help with cover estimates as they survey. For each quadrat, surveyors will walk through enough area to collect the necessary data.
Figure 1. Arrangement of the 9 quadrats within a 1-ha sampling station
1 2 3
4 5 6
7 8 9
Surveyors will visually estimate the amount of cover provided by functional groups within each quadrat by assigning a cover class between 0 and 7 to each functional group (Figure 2). Functional groups consist of trees, shrubs, non-native forbs, native forbs, and grasses. These estimates should look at the overall cover provided by each functional group and are not simply the addition of all species in that layer. For example, if a plot has 2 shrubs with 25% and 10% cover and these shrubs overlap for 15% of that cover, 20% cover (cover class 4) would be recorded for the shrub layer instead of 35% (cover class 5). These estimates give an absolute aerial cover, with each category not to exceed 100%. Surveyors will also record the scientific names of up to 3 of the most common species within each functional group in the quadrat.
Figure 2. Cover classes
0 1 2 3 4 5 6 7
0% <1% 1-5% >5-15% >15-25% >25-50% >50-75% >75%
Surveyors will look for the presence of Quino host plant species (Plantago patagonica, Plantago erecta, Cordylanthus rigidus, Collinsia concolor, Antirhinum coulterianum, and Castilleja exserta) (USFWS 2003) in each quadrat. Surveyors will estimate the cover, number of individuals present, and phenology of each host species
Western Riverside County MSHCP Biological Monitoring Program
42
Quino Checkerspot Butterfly Survey Report 2009
found. Surveyors will assign each host species present to a cover class between 1 and 7 (Figure 2). Estimates of the number of individuals will be made as an order of magnitude (i.e., 1s, 10s, 100s, with a maximum of 1,000,000s). Surveyors will determine the percent of the individuals of each host plant that are present in each of 4 phenological states. Green vegetative individuals will have green leaves, stems and possibly flower buds, but no open flowers or fruit. Green reproductive individuals will have green stems and leaves and open flowers and/or fruit. Over 50% red individuals will have at least 50% of their leaves and stems turning red. This is a phenological state that some species, such as Plantago erecta, experience as they become heat-stressed, while other species may transition from green to brown without turning red. Brown individuals have leaves and stems that are mostly to completely brown and possibly turning dry and crispy. Phenology estimates for each host species present should sum to 100%. Surveyors will mark the general location of host species that might be difficult to relocate for any reason (e.g., small number of individuals) on the quadrat map on the datasheet.
Surveyors will record general information about the quadrat that may be relevant to Quino, such as dryness, variation in slope and aspect, interesting species diversity or growth patterns, under “Site description.” This may also be left blank if there is nothing of interest to note.
Host Plant Phenology Methods: Surveyors will visit selected quadrats to assess the phenology of host plants on a weekly basis. Surveyors will search the quadrats for Quino host species and record host plant phenology for all host species present as described above. Surveyors will not record the cover class and number of individuals present for Plantago erecta at MSR, Oak Mountain, and Magee Hills and Collinsia concolor at Silverado because this data was previously recorded during habitat sampling while these species were at or near peak phenology at the listed sites. Quadrats without previous habitat sampling will have these data recorded for all species on the first visit to the quadrat. Surveyors will record the cover class and number of individuals present for all other host species present because these species may have been missed in earlier surveys.
Surveyors will look for and record any patterns that may explain differences in phenology among individuals, looking in particular for patterns related to topography, density of vegetation, soil conditions, and co-occurrence with other species.
On the first visit to the quadrat, surveyors will record the dominant slope and aspect (the direction the majority of the quadrat is facing) using a clinometer and declinated compass. Surveyors will write a description of the topography of the quadrat if the slope and aspect measurements do not adequately describe the quadrat (e.g., due to presence of large hill with slope and aspect in all directions) and/or host species are present only in areas that are different than the dominant topography of the quadrat.
Surveyors will flag patches of host plants other than Plantago erecta at MSR, Oak Mountain, and Magee Hills and Collinsia concolor at Silverado to assist future surveyors in relocating those species. Surveyors will record whether and how many patches are
Western Riverside County MSHCP Biological Monitoring Program
43
Quino Checkerspot Butterfly Survey Report 2009
flagged on a spreadsheet to assist surveyors in future weeks. Surveyors will also record on the spreadsheet when 100% of the individual of all host species present are brown; surveys will no longer be conducted at these quadrats as it is assumed that the host species are no longer an available food resource for Quino larvae.
Data Analysis: The eventual analyses used to investigate habitat data collected will depend upon available sample size. Because the number of occupied sampling stations is unknown, and this result controls the number of habitat samples acquired, data may have to be pooled across a variety of scales (i.e., all habitat data for occupied vs. unoccupied stations across the entire study area, within smaller geographic areas, or within a given plot of sampling stations).
Habitat data will be visually evaluated for differences in potentially important Quino habitat variables using scatterplots and statistically evaluated for significant differences using logistic regression and paired Student’s t-tests. A priori hypotheses to be tested include the following:
• Quino host plants are present more often on occupied sampling stations than on unoccupied sampling stations both individually and as a group;
• the percent cover of Quino host plants is higher on occupied sampling stations than on unoccupied sampling stations both individually and as a group;
• the percent cover of non-native species is lower on occupied sampling stations than on unoccupied sampling stations;
• the percent cover of the functional groups trees, shrubs, non-native forbs, and grasses together as a group is lower on occupied sampling stations than on unoccupied sampling stations;
• the percent cover of shrubs is lower on occupied sampling stations than on unoccupied sampling stations;
• the percent cover of grasses is lower on occupied sampling stations than on unoccupied sampling stations;
• hilltops are present more often on occupied sampling stations than on unoccupied sampling stations.
If there is appropriate sample size, results for all sampling stations with habitat
data will be used as covariates when calculating the proportion of area occupied and detection probability using Program MARK (White and Burnham 1999) or PRESENCE (MacKenzie et al 2003).
Habitat data collected from occupied sampling stations and unoccupied sampling stations may be used in the future to help build a model of potentially suitable Quino habitat within the Conservation Area.
Western Riverside County MSHCP Biological Monitoring Program
44
Quino Checkerspot Butterfly Survey Report 2009
REFERENCES:
MacKenzie, D. I., J. D. Nichols, J. E. Hines, M. Knutson, and A. B. Franklin. 2003. Estimating site occupancy, colonization, and local extinction when a species is detected imperfectly. Ecology 84:2200-2207.
[USFWS] U.S. Fish and Wildlife Service. 2003. Recovery Plan for the Quino Checkerspot Butterfly (Euphydryas editha quino). Portland, Oregon. 179 pp.
White, G.C. and K. P. Burnham. 1999. Program MARK: Survival estimation from populations of marked animals. Bird Study 46 Supplement, 120-138
Western Riverside County MSHCP Biological Monitoring Program
Notes about where host plants are drying up first and/or where host plants are staying green the longest or □ No observed pattern. ________________________________________________
Notes about where host plants are drying up first and/or where host plants are staying green the longest or □ No observed pattern. ________________________________________________