33
by Paul Hiebert and Matthias Sydow WHAT DRIVES RETURNS TO EURO AREA HOUSING? EVIDENCE FROM A DYNAMIC DIVIDEND-DISCOUNT MODEL WORKING PAPER SERIES NO 1019 / MARCH 2009

by Paul Hiebert and Matthias Sydow
What drives returns to euro area housing?
evidence from a dynamic dividend-discount model
Work ing PaPer ser i e sno 1019 / march 2009

WORKING PAPER SER IESNO 1019 / MARCH 2009
This paper can be downloaded without charge fromhttp://www.ecb.europa.eu or from the Social Science Research Network
electronic library at http://ssrn.com/abstract_id=1337450.
In 2009 all ECB publications
feature a motif taken from the
€200 banknote.
WHAT DRIVES RETURNS
TO EURO AREA HOUSING?
EVIDENCE FROM A DYNAMIC
DIVIDEND-DISCOUNT MODEL 1
by Paul Hiebert and Matthias Sydow 2
1 The views expressed in this paper are those of the authors and do not necessarily reflect those of the European Central Bank (ECB). We would
like to give a special thanks to Olli Castren, who provided ideas and input at an early stage essential to this work, as well as Chiara Osbat for
valuable advice on econometric issues. All errors in this paper are, however, the sole responsibility of the authors.
e-mail: [email protected] and [email protected]
2 European Central Bank, Kaiserstrasse 29, D-60311 Frankfurt am Main, Germany;

© European Central Bank, 2009
Address Kaiserstrasse 29 60311 Frankfurt am Main, Germany
Postal address Postfach 16 03 19 60066 Frankfurt am Main, Germany
Telephone +49 69 1344 0
Website http://www.ecb.europa.eu
Fax +49 69 1344 6000
All rights reserved.
Any reproduction, publication and reprint in the form of a different publication, whether printed or produced electronically, in whole or in part, is permitted only with the explicit written authorisation of the ECB or the author(s).
The views expressed in this paper do not necessarily refl ect those of the European Central Bank.
The statement of purpose for the ECB Working Paper Series is available from the ECB website, http://www.ecb.europa.eu/pub/scientific/wps/date/html/index.en.html
ISSN 1725-2806 (online)

3ECB
Working Paper Series No 1019March 2009
Abstract 4
Non-technical summary 5
1 Introduction 7
2 The dividend-discount model of asset pricing applied to house prices 9
2.1 Static version 10
2.2 Dynamic version 11
3 Empirical implementation of the dynamic model using a VAR approach 12
4 Data 15
5 Results from the VAR analysis 18
5.1 Impulse responses 19
5.2 Variance decomposition 20
6 Conclusions 21
References 23
Appendices 25
European Central Bank Working Paper Series 29
CONTENTS

4ECBWorking Paper Series No 1019March 2009
AbstractWe apply a dynamic dividend-discount model to analyse unexpected housing returns in a panel of eight euro area countries which together comprise 90% of euro area GDP. The application of this model allows for a decomposition of house price movements into movements in rent (cash-flow) and expected return news components. The empirical application of the model involves the estimation of a panel vector autoregressive model (VAR) for four variables –excess return to housing, rents, the real interest rate and real disposable per capita income– using quarterly data over the period 1985-2007. This empirical investigation yields two main findings. First, the bulk of the variability of house price movements in the panel of countries analysed can be attributed to movements in the rental yield. Indeed, perturbations to rents appear to result in a one-to-one analogous movement in house prices over the long term once controlling for changes in expected returns. Second, evidence from the dynamic profile of shocks along with the negative co-movement between changing rental yield expectations and changing expected returns on housing assets would suggest that euro area house prices overreact to news.
Keywords: House price, housing rental yield, return decomposition, panel VAR estimation, cash flow news.
JEL Classification: R21, C33, G12.

5ECB
Working Paper Series No 1019March 2009
Non-technical summary
When housing is viewed as an asset, understanding the evolution of houseprices is not unlike understanding that of financial assets, in that changesin valuation derive from news on fundamental determinants, or dividends,and expected returns. One methodology which is based on this notion andwidely applied to understanding movements in financial asset prices (suchas equities or bonds) is the dynamic dividend- discount model pioneeredby Campbell and Shiller (1988a) and Campbell and Shiller (1988b). Thismodel equates unexpected changes in the excess return of an asset over analternative riskless asset to changes in the discounted flow of dividends itprovides along with changes in expected returns.
Housing can, however, be characterised as both an asset and a con-sumption good. Nevertheless, from both perspectives, house prices wouldbe expected to exhibit a long-run relationship with the conceptual analogueof dividends in the above model – in the form of rental yield. From theperspective of housing as an asset, house prices embed information aboutdividends in the form of the flow of future housing services (which can beproxied by the rental yield) in addition to expected returns. From the per-spective of housing as a consumption good, house prices should co-move withrents in the long run given the substitutability between renting and owninga house on aggregate in the absence of frictions or borrowing constraints.
While such a long-run relationship between house prices and the rentalyield may be expected, house prices in the euro area – similar to those inother developed economies – have exhibited considerably stronger growththan witnessed in housing rents over the last decade. The implied deterio-ration of the ratio of the observed house price to contemporaneous observedrent has been the subject of numerous studies. The literature, however,has tended to examine the relationship between house prices and rents ina static variant of the dividend-discount model, whereby expected returnsare assumed to be constant through time. In the dynamic variant of thedividend-discount model, an alternative interpretation is that changes inexpected returns as well as rents could have exerted influence on the evolu-tion of euro area house prices.
This paper uses a dynamic dividend-discount model to decompose euroarea house price developments into cash-flow fundamentals –in the form ofrents– and expected returns. A vector autoregressive (VAR) model, fol-lowing closely the methodology used by Vuolteenaho (2002) to analyse USequity prices, is run for a panel of eight euro area countries (Belgium, Ger-many, Ireland, Spain, France, Italy, the Netherlands and Finland) usingquarterly data over the period 1985-2007. In this framework, real returns tohousing (defined as real house price inflation less the real “risk free” returnon a long-term government bond) are related to dividends from homeown-ership in the form of the real rental yield (proxied by observed real housing

6ECBWorking Paper Series No 1019March 2009
rents), with controls for other important determinants of house prices, suchas real long-term interest rates and real per capita disposable income. Theparameters of the estimated model indicate, not surprisingly, that expectedexcess returns to housing are high when rents over the past period havegenerally been both significant and high, and real interest rates are lowand significant. The empirical investigation, however, focuses on relatingreturns on housing in excess of the risk-free rate of return to two factors:a systematic news component (consisting of shocks to expected cash flowsin the form of rents) and an idiosyncratic news component (consisting ofshocks to expected return news). The results of a variance decompositionof changes in excess returns to housing, as well as a comparative analysisof impulse responses from shocks to rents and expected returns yields twomain findings. First, the bulk of the variability of house price movementsin the panel of countries analysed can be attributed to movements in therental yield. Indeed, perturbations to rents appear to result in a one-to-one analogous movement in house prices over the long term once control-ling for changes in expected returns. That said, while housing returns aredriven mainly by news on country rents, there remains an important but lesssizeable influence of market-wide (or expected-return) variations for houseprices. Second, it appears that changes in rental yield expectations co-movenegatively with changes in expected returns on housing assets, which wouldsuggest in addition to information from the dynamic responses to shocksthat house prices overreact to news. In the context of historically highervolatility in house prices compared with that of rents, stable low-frequencyvariation in expected returns could therefore have contributed to large andpersistent swings in house prices.
There are several caveats to the analysis, notably the role of countryheterogeneity, the possibility that non-market forces influence the flexibilityof house price and rents and their implied substitutability, along with thepossibility of changing institutional factors, structural economic change andstatistical issues that could imply some change in historical or equilibriumrelationships. Nevertheless, the results can be considered as containing anillustrative assessment of the relationship between changing euro area houseprices and changing fundamentals in a dynamic framework when allowingfor changes in expected returns.

7ECB
Working Paper Series No 1019March 2009
1 Introduction
The price of residential housing, which can be characterised as both a con-sumption good and as an asset (or investment good), should bear a closelong-term resemblance to rental yields. In the role of housing as a consump-tion good, the rental yield provides a proxy of the flow of housing servicesaccruing to a homeowner, and in this way is a key influence on the decisionto acquire housing services on a month-by-month basis or as a flow throughoutright purchase. In the role of housing as an asset, house prices not onlyembed information about dividends in the form of the flow of future housingservices, but also regarding expected returns. In this way, understanding thedrivers of house price movements can be intrinsically related to movementsin both rents and expected returns.
In the euro area, house prices have exhibited strong growth in manycountries over the last decades. Such growth has been only partly relatedto movements in “dividends”, in the form of housing rents as measured inconsumer price statistics. As indicated in Figure 1, average annual growthin house prices has exceeded that of the rent component in consumer priceindices over the past 25 years or so in many euro area countries. This couldsuggest that, in many euro area countries, changes in expected returns haveexerted some influence on the evolution of house prices in addition to changesin the expected dividend yield in the form of rents.
Figure 1: Evolution of house prices and rents in selected euro areacountries (average percentage changes over 1985-2007)

8ECBWorking Paper Series No 1019March 2009
One methodology which has been widely applied to understanding move-ments in financial asset prices (such as equities or bonds) is a dividend-discount model. This model essentially postulates that the excess return ofan asset over an alternative riskless asset can be related to the discountedflow of dividends it provides along with changes in expected returns. Mostexisting work analysing house prices using a dividend-discount approach isbased on a static model which, inter alia, does not control for time-varyingchanges in expected returns. Using a static dividend-discount frameworkseveral studies have found that house price to rent ratios stand at elevatedrates in many European countries – see, for instance, Girouard, Kennedy,van den Noord, and Andre (2006), Weeken (2004), and Ayuso, Blanco, andRestoy (2006). Several studies have also analysed the house price rent re-lationship for the United States, including Gallin (2008) and Himmelberg,Mayer, and Sinai (2006). Fewer studies have applied a dynamic applicationof the model, allowing for a dichotomy of house price movements drivenby “fundamental’ movements –or rents– and changes in expected returns.Campbell, Davis, Gallin, and Martin (2008) analyse the US regional houseprice-rent ratio in a dynamic framework, and find that housing premia ac-count for a significant fraction of rent-price ratio volatility at the nationaland local levels, and that covariances between house prices, rents and hous-ing risk premia damp fluctuations in rent-price ratios. Plazzi, Torous, andValkanov (2006) find for commercial real estate prices in the US that varia-tion in commercial real estate prices is largely due to movements in discountrates rather than cash flows, on the basis of a unique measure of rents ac-cruing to owner occupiers.
We apply the dynamic variant of the dividend-discount model to analysechanges in the unexpected returns to euro area residential housing. Specifi-cally, we investigate the relative contribution of rents and expected housingreturns in driving excess returns on housing for a panel of eight large euroarea countries (Belgium, Germany, Ireland, Spain, France, Italy, the Nether-lands and Finland) over the period 1985-2007. Specifically, we implementthe dynamic dividend-discount model as pioneered by Campbell and Shiller(1988a) and Campbell and Shiller (1988b), following closely the method-ology used by Vuolteenaho (2002). The resulting empirical specificationrelates excess returns on house prices to rents, the real interest rate andreal per capita disposable income. The empirical investigation, however,focuses on relating returns on housing in excess of the risk-free rate of re-turn to two factors: a systematic news component (consisting of shocks toexpected cash flows in the form of rents) and an idiosyncratic news com-ponent (consisting of shocks to expected return news). The results of avariance decomposition of changes in excess returns to housing, as well asa comparative analysis of impulse responses from shocks to rents and ex-pected returns yields two main findings. First, the bulk of the variability ofhouse price movements in the panel of countries analysed can be attributed
9ECB
Working Paper Series No 1019March 2009
to movements in the rental yield. Indeed, perturbations to rents appearto result in a one-to-one analogous movement in house prices over the longterm once controlling for changes in expected returns. That said, whilehousing returns are driven mainly by news on country rents, there remainsan important but less sizeable influence of market-wide (or expected-return)variations for house prices. Second, on the basis of both the dynamic profileof shocks along with negative co-movement between changes in rental yieldexpectations and changes in expected returns on housing assets, it wouldappear that house prices overreact to each type of independent news.
The rest of the paper is structured as follows. Section 2 outlines thedividend-discount model applied to house price analysis, both in the com-monly applied static form and in the dynamic form used in this paper.Section 3 then outlines the VAR approach adopted to analyse house pricesin this framework, based on the data outlined in Section 4. The results ofthe VAR analysis, including impulse response analysis and variance decom-position, are contained in Section 5. Lastly, concluding remarks are madein Section 6.
2 The dividend-discount model of asset pricingapplied to house prices
The dividend-discount model of asset pricing has been widely applied to theanalysis of various asset prices. The pioneering work of Campbell and Shiller(1988a) and Campbell and Shiller (1988b) involved the analysis of equities,where a firm’s unexpected stock returns are driven by shocks to expectedcash flows (“cash-flow news”) and/or shocks to discount rates (“expected-return news”). In this setting, a firm’s book-to-market ratio can be tem-porarily high if future cash flows are low and/or future excess stock returnsare high.
The conceptual analogue of this framework applied to the housing marketimplies that unexpected changes in excess returns to housing –or the excessof the house price over the risk-free rate– is driven by shocks to expectedfuture housing service flows (cash flows or, alternatively, dividends in theform of the housing rental yield) and/or shocks to expected future returnsto housing assets. One important assumption underpinning the analysisis that the observable growth rate of rent paid by renters is equal to theunobservable growth rate of rents accruing to owner occupiers.1 Taking this
1In this way, the applicability of rents as a proxy for housing dividends relates im-portantly to the national share of rental accommodation in total housing. Within thecountries analysed, this varies considerably across the euro area – with a relatively highshare of rental accommodation in countries such as Germany, France and the Nether-lands in the range of 43-58% in 2006, contrasting with a relatively low share of rentalaccommodation in countries such as Ireland, Spain and Italy of below 20%.

10ECBWorking Paper Series No 1019March 2009
assumption as given, a return decomposition applied to housing thereforeinvolves breaking down unexpected changes in house prices into changes inthe relevant fundamental (the rental yield) and expected returns (in theform, for instance, of capital gains or losses).
There are several caveats to this approach when applied to housing.First, the model is based on the assumption that households can either freelyrent or own the housing stock, and therefore abstracts from non-market fac-tors or liquidity constraints implying imperfect substitutability between thetwo options. Moreover, the dynamics of rent prices, in particular, mightonly sluggishly adjust to prevailing economic conditions given regulatoryfactors such as rent controls prevalent in several European countries. Sec-ond, many factors outside the purview of this model can also influence theuser cost of home ownership, such as differences in risk, tax benefits, prop-erty taxes, depreciation and maintenance costs –see for instance Girouard,Kennedy, van den Noord, and Andre (2006). Third, data uncertainty is par-ticularly high in measuring house prices given problems in coverage, qualitycontrol and representativeness. Notwithstanding these caveats, we analyseeuro area house price movements in a dynamic dividend-discount frame-work closely aligned to the methodology of Vuolteenaho (2002) (examiningstock markets), Castren, Fitzpatrick, and Sydow (2006) (examining bank-ing returns) and Castren, Osbat, and Sydow (2006) (examining exchangerates). The methodology – first in terms of a static and then a dynamicdividend-discount model – is described below.
2.1 Static version
A static version of the dividend-discount asset pricing approach applied tohousing involves relating house prices to contemporaneous rents, a risk-freerate of return, a housing risk premium over this latter rate and some errorcapturing expected capital gains or losses.
As a starting point, we use the standard identity for the one period grossreturn to an asset, Rt+1,
Rt+1 ≡ Pt+1 + Dt+1
Pt(1)
where P is the real price of housing and D is the flow of fundamentalvalue (rents for the case of housing). Solving forward in a static framework,the house price in period t can be expressed as the present discounted valueof the future stream of dividends or rents, discounted at a constant rate (R):
Pt = Et
[ ∞∑i=1
Dt+i
(1 + R)i
](2)
Assuming that payoffs grow at a constant real rate gives raise to thefamiliar Gordon growth model that is a workhorse model for static asset

11ECB
Working Paper Series No 1019March 2009
pricing exercises. Indeed, this approach has been applied in numerous stud-ies applied to housing. Girouard, Kennedy, van den Noord, and Andre(2006) find that price-rent ratios stand above their their long-run value formost OECD countries. Weeken (2004) relates house prices to net rentals(a proxy for dividends) and estimated the model for UK data, and findsthat lower real interest rates can account for part of the increase of theratio of house prices to net rentals in the UK between 1996 and 2004, butto fully account for the observed increase the housing risk premium wouldneed to have fallen as well. Using a quarterly empirical model based on anasset pricing approach applied to Spain, the UK and the US, Ayuso, Blanco,and Restoy (2006) find evidence that house prices are above their long-termequilibrium, though attribute part of this to other factors. Krainer and Wei(2004) finds for the US that most of the variance in the price-rent ratio hasbeen due to changes in future returns and not to changes in rents. Alsofor the US, Himmelberg, Mayer, and Sinai (2006) calculate the imputedrent on housing based on a measure of user cost of housing, and in compar-ing it to actual rents available in the market find evidence of considerableheterogeneity across US cities.
2.2 Dynamic version
As outlined in Campbell, Davis, Gallin, and Martin (2008), a dynamic ver-sion of the model can provide additional information over and above thestatic version primarily in three ways. First, it yields a time-varying ratherthan fixed housing excess return over the risk-free rate. Second, it explicitlyaccounts for the dynamics of each component of excess returns to housingassets, rather than lumping all future considerations into expected futurecapital gains, as unlike a static analysis it can decompose whether assetprice returns react to changes in agents’ expectations of future dividends orchanges in expectations on future returns. Third, as long as real interestrates and housing premia are stationary, it ties appreciation of house pricesto growth in rents over the long-run in contrast to the static model.
The dynamic dividend-discount model, pioneered by Campbell and Shiller(1988a) and Campbell and Shiller (1988b), involves a log-linear approxima-tion that is tractable even when unexpected returns vary through time,thereby allowing for an analysis of the relative importance of the cash-flow(or intrinsic value) and expected return components as drivers of asset pricereturns. We apply the version contained in Vuolteenaho (2002), who ex-tends the Campbell-Shiller framework by incorporating accounting-basedvariables in a panel estimation framework.
As a starting point, we return to the one-period gross return to housingfollowing the identity in equation (1). Taking the logarithm of this expres-sion, and with lower-case letters denoting variables in logs, we get

12ECBWorking Paper Series No 1019March 2009
rt+1 = log(Pt+1 + Dt+1) − pt (3)
While the exact implied relationship is non-linear, since it involves thelog of the sum of the price and the dividend, Campbell and Shiller (1988a)note that Rt can be well approximated by applying a first-order Taylorexpansion of equation (3), which replaces the above log sum of the priceand the dividend with a weighted sum of the two components along with aconstant as follows:
rt+1 ≈ k + ρpt+1 + (1 − ρ)dt − pt (4)
where ρ is a parameter close to less than unity and k is a constant termand approximation error. Equation (4) now allows for the decomposition ofthe unexpected housing return into a cash-flow and expected return com-ponent. Taking the change in expectations of (4) from t-1 to t, and solvingforward yields
rt − Et−1rt = κ + �Et
∞∑j=0
ρj(Δdt+j) −�Et
∞∑j=0
ρjrt+j (5)
where �Et denotes the change in expectations form t − 1 to t , κ is aconstant term, and a standard transversality condition is imposed. Equa-tion (5) implies that at any point in time, a surprise increase in house pricesmust be associated with an improvement in expected future dividends inthe form of housing services (or rents) or a decrease in required future re-turns. An alternative interpretation is that of permanent (versus transitory)components to revisions in excess house price returns, whereby the currentimpact of a future change creates an equal or opposite movement in houseprices.
3 Empirical implementation of the dynamic modelusing a VAR approach
In order to empirically assess the drivers of excess returns on housing, weobtain quantitative results from a vector autoregressive (VAR) estimation ina panel setting. The exposition below and resulting empirical investigationfollows closely that of Castren, Fitzpatrick, and Sydow (2006), Castren,Osbat, and Sydow (2006), and Vuolteenaho (2002). Below, we outline thepanel VAR used for subsequent analysis.2 A VAR system, in combination
2The decomposition is the same for an estimated single-country VAR or panel VARprovided that homogeneity restrictions on the coefficients of interest hold in the panelsetting. In relation to the latter assumption, we report some country results to illustratethe importance of heterogeneity across euro area countries in Section 5.

13ECB
Working Paper Series No 1019March 2009
with the log-linear asset pricing framework, can be used to calculate theimpact that an innovation in the expected return will have on the houseprices, holding the expected future housing services flow variable constant.This impact is the expected return news component of the unexpected returnon housing. The housing services flow is therefore obtained as a residual.
Defining zit as a k-dimensional vector of variables for each country, or-dered so that the first variable in the system reflects excess returns on hous-ing. A panel VAR can then be represented –exemplified in what follows witha lag length of one for illustrative purposes– in the following way:
zit+1 = Γzit + uit+1 (6)
where uit is serially uncorrelated, with mean 0 and variance Σ, imposingno restrictions on contemporaneous correlation in Σ. For the panel esti-mation, the standard assumption that the coefficient matrix Γ, is constantboth over time and across cross-sectional units is assumed to hold.3 Given aselection vector e1 of appropriate dimensions, the forecast of excess returnson housing (ht) is then:
hit+1+j = e1Γj+1zit (7)
where j represents the length of the forecast horizon. Introducing an ex-pectations operator, one-step forward forecasts over two consecutive periodscan be denoted as follows:
Et [hit+1+j ] = e1′Γj+1zit
Et+1 [hit+1+j ] = e1′Γjzit+1
The expectation error from the above two consecutive one-period aheadforecasts can be represented as:
Et+1 [hit+1+j ] − Et [hit+1+j ] = e1′Γjzit+1 − e′1
(ΓjΓ
)zit ≡ e′1Γ
juit+1 (8)
Generalising this two-period framework to a multi-period framework, i.e.a discounted sum of forecast revisions of returns, assuming a discount factorequal to one, is then given by:
3Given that the panel estimation imposes the usual homogeneity restrictions on theresulting estimates, we also tackle the issue of heterogeneity by examining estimates foran alternative specification excluding Germany, where housing market developments havediffered considerably from the other countries in the panel over the last decade. Theseestimates do not strongly differ from the results of the complete eight country panel.Moreover, results for selected euro area countries with markedly different house priceprofiles are presented in Section 5 to illustrate the potential role of heterogeneity.

14ECBWorking Paper Series No 1019March 2009
(Et+1 − Et)∞∑
j=1
[hit+1+j ] = e′1∞∑
j=1
Γjuit+1 (9)
If the eigenvalues of the companion matrix Γ are inside the unit circle,then the (discounted) sum of revisions in forecast returns is given by:
Nr,t = (Et+1 − Et)∞∑
j=1
[hit+1+j ]
= e′1Γ(I − Γ)−1uit+1 = λ′uit+1 (10)
where λ = e′1Γ (I − Γ)−1 .
The unexpected return can be decomposed as the difference betweencash-flow news (Nrents,t) and expected return news (Nreturn,t). In terms ofthe VAR parameterisation we then get:
e′1uit = Nrents,t − Nreturns,t (11)
The housing services component can be written compactly as:
Nrents,t = e′1uit + Nreturns,t
e′1(I + Γ(I − Γ)−1)uit (12)
In order to construct impulse response functions, we define the innovationin cumulative expected changes in future returns on housing investmentk > 1 periods forward as:
e′1Φ(k) uit = e′1(Γ − Γk+1
)(I − Γ)−1 uit (13)
and the total impulse response as the shock itself plus the cumulativesum above:
e′1Ψ (k)uit = e′1 (I + Φ(k)) uit
= e′1(I +
(Γ − Γk+1
)(I − Γ)−1
)uit (14)
The return decomposition stipulates that the infinite-horizon total im-pulse response is equal to the news on housing services. Indeed, as notedin Vuolteenaho (2002), if returns (on housing) are unpredictable, then ex-pected return news are identically zero and the entire return is due to cash-flow news. In this way, expected return news can be first computed directlyand then cash flow news can be backed out as the sum of unexpected returnand expected return news. In this way, we calculate the impulse response

15ECB
Working Paper Series No 1019March 2009
of returns to an unexpected return, u1t, by setting the return shock arbi-trarily to be equal to 50 basis points while the other elements of the errorvector are set equal to their conditional value given that u1t = 0.50. To cal-culate the impulse response of returns to a 50 basis points cash-flow shockthe normalised sum of squared errors from the VAR is minimised, subject tothe constraint that e′1
(I + Γ (I − Γ)−1
)uit = 0.50. Impulse responses of the
other variables included in the VAR to shocks in expected return news andcash-flow news can be derived similarly, using different selection vectors.
As for the variance decomposition analysis, the two return componentsof equation (5) can be re-defined as news on dividends in the form of housingservices, or rents (N rent), and news on expected returns (N returns):
Nrent,t ≡ �Et
∞∑j=0
ρj(dt+j) + κ, Nreturns,t ≡ �Et
∞∑j=0
ρjrt+j (15)
Since r t-E t−1r t = N rents,t-N returns,t, the unexpected excess return onhousing can be high if either expected future excess returns on housingdecrease and/or expected future housing service flows increase. The unex-pected return variance can be similarly decomposed into three components:
var(rt −Et−1rt) = var(Nreturns,t) + var(Nrents,t)− 2cov(Nreturns,t, Nrents,t)(16)
The variance decomposition in equation (16) can be used to assess em-pirically the relative importance of expected returns and changes in housingservices as drivers of excess returns on housing.
4 Data
We estimate a VAR system on the basis of the empirical framework presentedin the preceding Section using four basic variables: (1) excess returns on realhouse prices, defined as real house prices less the risk-free rate, (2) real hous-ing rents, (3) the risk-free real interest rate and (4) real disposable income.4
Beyond the three basic variables of house prices, rents and the interest rateimplied by a dynamic dividend-discount approach, the income variable isused to augment the regression with a control for housing demand funda-mentals. This can be motivated both on the basis of housing’s role as aconsumption good (as well as an asset), where income is a key variable indetermining consumption of housing, along with income as a proxy for lever-age as a conceptual analogue to the stock-market analysis of Vuolteenaho(2002). Indeed, it can be argued on economic grounds that, over the long
4More detailed information on the data can be found in Appendix A.

16ECBWorking Paper Series No 1019March 2009
term (i.e. a period over which permanent income considerations outweighthe per-period importance of financing conditions), house prices and house-hold disposable income should be closely linked. Beyond such an economicrelationship, income may also have a statistical relationship with rents in-sofar as rental income constitutes an important contributor to disposableincome.
The VAR estimation is based on an equally-weighted balanced panelof eight euro area countries with a weight of over 90% in euro area GDP(Belgium, Germany, Ireland, Spain, France, Italy, the Netherlands and Fin-land). The data are quarterly (and interpolated quarterly), spanning theperiod 1985-2007. The adopted lag length is 4 lags (or one year) and chosenon the basis of the results of Akaike statistical information criteria tests.
Various transformations are made to the data.The house price and riskfree rate data are continuously compounded, and the excess return on hous-ing is computed as the difference between the two series. To constructan appropriate panel for estimation, the excess return series is then cross-sectionally demeaned and normalised by division with its standard deviation.
Descriptive statistics on the above basic four variables, contained in Ta-ble 1 below, indicate that in the euro area, house prices have generallyexhibited strong growth and relatively high volatility with few exceptions.Such a development has contrasted with a lower growth rate and volatilityof housing rents as observed in consumer price statistics, consistent with thepicture presented in Figure 1. A similar picture to house prices in relationto rents is evident when examining income, whereby growth and volatilityof house prices have been higher than per capita disposable income. Thisimplies that unexpected movements in the excess return to housing assetscould play an important role for changes in expected returns to housingassets as well as changes in expected cash flows from rents. In assessingthe relationship between housing, rents and income, changes in the interestrate are important given their role in the discounting of expectations em-bedded in house prices (as asset prices) concerning future income and rentdevelopments.

17ECB
Working Paper Series No 1019March 2009
Table 1. Descriptive statistics for variables included in the VAR analysis%, calculated over the period 1985-2007 based on quarterly data
Mean Std. dev. Min MaxReal house price growthBelgium 5.00 4.22 -6.03 15.07Germany -0.58 2.23 -3.55 5.55Ireland 6.47 6.81 -8.90 26.06Spain 2.97 9.08 -15.63 24.86France 3.93 4.96 -4.98 13.40Italy 3.21 6.78 -9.43 17.84Netherlands 5.44 4.39 -3.88 16.17Finland 2.77 11.34 -21.73 34.89Unweighted country average 3.65 6.23 -9.27 19.23Real rental yield growthBelgium 0.84 1.33 -1.66 3.73Germany 0.34 2.67 -8.95 7.40Ireland 1.19 4.80 -12.98 10.89Spain 1.44 1.87 -5.25 5.07France 1.23 1.26 -2.09 3.66Italy 1.08 2.31 -3.82 14.90Netherlands 1.48 1.73 -2.72 7.74Finland 0.51 3.36 -7.52 10.42Unweighted country average 1.01 2.42 -5.62 7.98Real interest rateBelgium 4.44 1.91 0.33 7.49Germany 4.09 1.49 1.07 7.21Ireland 4.14 2.90 -0.79 10.27Spain 3.96 2.61 -0.57 9.43France 4.39 1.73 1.18 7.33Italy 4.58 2.23 1.16 9.19Netherlands 4.00 1.98 -0.23 7.47Finland 4.89 2.11 2.12 9.66Unweighted country average 4.31 2.12 0.53 8.51Real per capita disposable income growthBelgium 1.68 2.41 -2.95 9.76Germany 2.25 2.61 -1.41 9.21Ireland 4.92 3.07 -0.54 13.76Spain 2.51 1.82 -2.34 5.85France 1.63 1.30 -1.40 3.62Italy 1.85 3.15 -7.04 8.64Netherlands 1.42 2.08 -3.94 5.58Finland 2.06 3.30 -6.82 9.26Unweighted country average 2.29 2.47 -3.30 8.21Note: See Appendix A for more information on data definitions and sources.
18ECBWorking Paper Series No 1019March 2009
5 Results from the VAR analysis
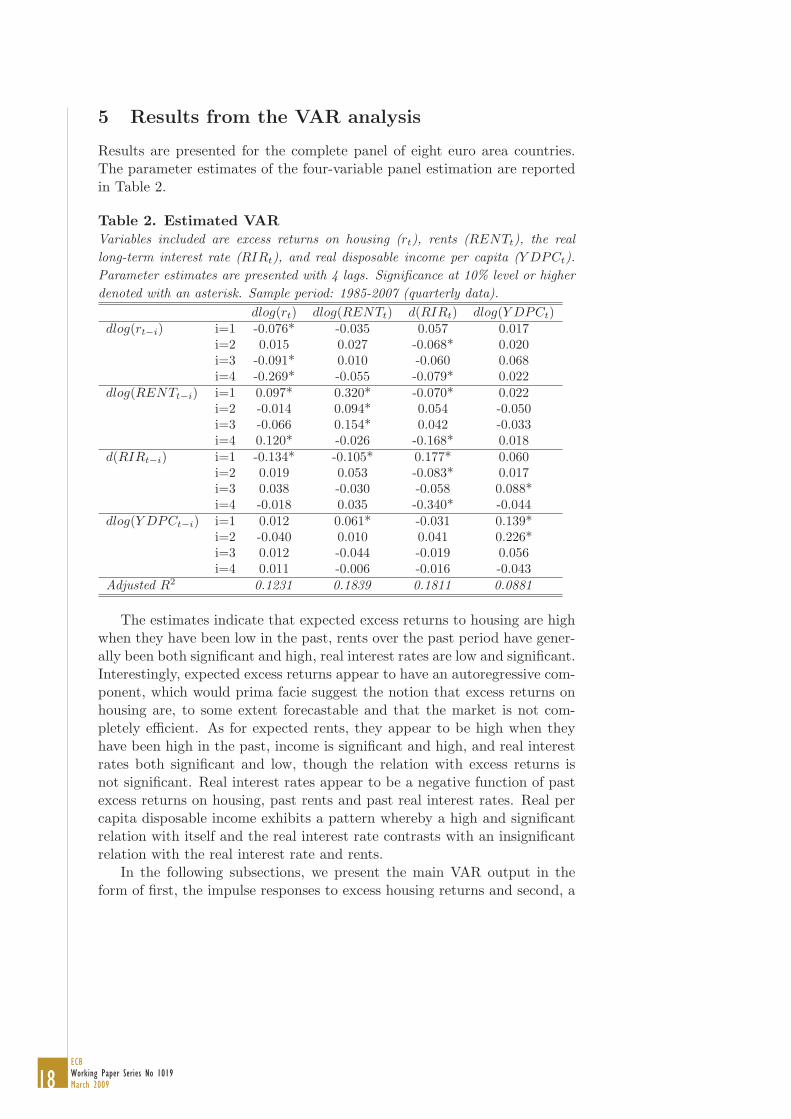
Results are presented for the complete panel of eight euro area countries.The parameter estimates of the four-variable panel estimation are reportedin Table 2.
Table 2. Estimated VARVariables included are excess returns on housing (rt), rents (RENTt), the reallong-term interest rate (RIRt), and real disposable income per capita (Y DPCt).Parameter estimates are presented with 4 lags. Significance at 10% level or higherdenoted with an asterisk. Sample period: 1985-2007 (quarterly data).
dlog(rt) dlog(RENTt) d(RIRt) dlog(Y DPCt)dlog(rt−i) i=1 -0.076* -0.035 0.057 0.017
i=2 0.015 0.027 -0.068* 0.020i=3 -0.091* 0.010 -0.060 0.068i=4 -0.269* -0.055 -0.079* 0.022
dlog(RENTt−i) i=1 0.097* 0.320* -0.070* 0.022i=2 -0.014 0.094* 0.054 -0.050i=3 -0.066 0.154* 0.042 -0.033i=4 0.120* -0.026 -0.168* 0.018
d(RIRt−i) i=1 -0.134* -0.105* 0.177* 0.060i=2 0.019 0.053 -0.083* 0.017i=3 0.038 -0.030 -0.058 0.088*i=4 -0.018 0.035 -0.340* -0.044
dlog(Y DPCt−i) i=1 0.012 0.061* -0.031 0.139*i=2 -0.040 0.010 0.041 0.226*i=3 0.012 -0.044 -0.019 0.056i=4 0.011 -0.006 -0.016 -0.043
Adjusted R2 0.1231 0.1839 0.1811 0.0881
The estimates indicate that expected excess returns to housing are highwhen they have been low in the past, rents over the past period have gener-ally been both significant and high, real interest rates are low and significant.Interestingly, expected excess returns appear to have an autoregressive com-ponent, which would prima facie suggest the notion that excess returns onhousing are, to some extent forecastable and that the market is not com-pletely efficient. As for expected rents, they appear to be high when theyhave been high in the past, income is significant and high, and real interestrates both significant and low, though the relation with excess returns isnot significant. Real interest rates appear to be a negative function of pastexcess returns on housing, past rents and past real interest rates. Real percapita disposable income exhibits a pattern whereby a high and significantrelation with itself and the real interest rate contrasts with an insignificantrelation with the real interest rate and rents.
In the following subsections, we present the main VAR output in theform of first, the impulse responses to excess housing returns and second, a

19ECB
Working Paper Series No 1019March 2009
variance decomposition analysis.
5.1 Impulse Responses
The impulse responses in Figure 2 indicate similar dynamics in the responseof returns to cash flows (rent) and expected returns, but a stronger impactof the latter in magnitude. The cumulative responses of returns for the20 quarters (or 5 years) following each of the 50 basis point shocks appearto show a similar profile of a peak immediately following the shocks, and asubsequent decline over the following years with slight overshooting, followedby a stabilisation at a long-run rate after roughly 2.5 years. For both shocks,the magnitude of the transitory movements is roughly equivalent, at around20-25 basis points.
For the shock to rents (or cash flow), while the initial impact exceedsthe size of the shock, cumulated returns are ultimately exactly equivalent tothe shock to cash flow news, at 50 basis points, keeping the expected returnconstant. One interpretation of this finding is that house prices overreactinitially –consistent with the relatively higher volatility of house prices com-pared with rents noted in Table 1– but then converge back to equilibrium inthe medium term.5 Information scarcity and relative risk could play a roleas well in shaping these dynamics.
For expected return news, the initial impact on cumulative returns ini-tially deviates little from the size of the shock, then converges downward(with minor overshooting) to an eventual permanent impact of around 35basis points. In the end, this indicates that roughly 70% of the shock is per-manent. This suggests some price-momentum and price-reversal patternsnot unlike those exhibited for unexpected returns of stock prices.
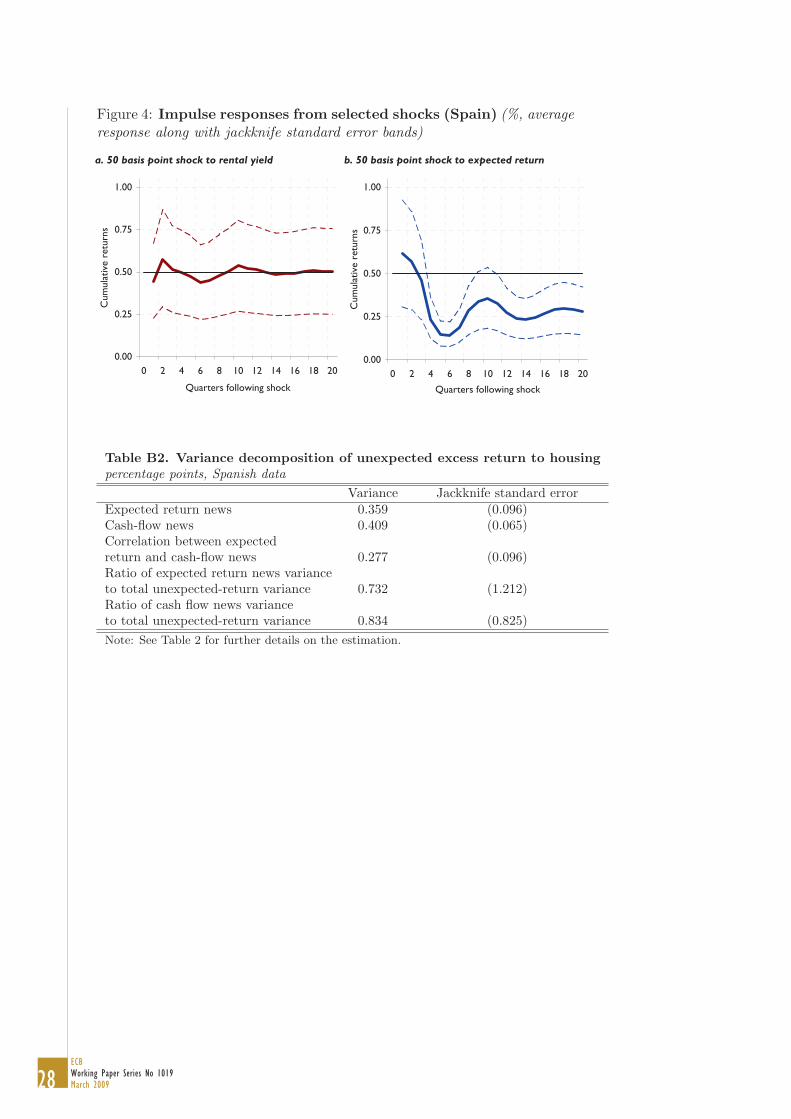
To illustrate the possible role of heterogeneity underlying these aggre-gate results, an alternative specification excluding Germany, where housingmarket developments have differed considerably from the other countries inthe panel over the last decade, do not strongly differ from the results of thecomplete eight country panel. Moreover, to illustrate country heterogeneity,country-specific impulse response functions are presented in Appendix B fortwo large countries from the panel where house price developments havediffered considerably over the last years: Germany and Spain. For Germany(where house prices have been relatively stagnant in recent times) and Spain(where house prices have been relatively buoyant in recent times), the salientfinding of an exact correspondence of cumulated returns to a shock to cashflow news remains, despite some divergences in the dynamic profile. Theshock to expected returns, however, appears to differ across the two coun-tries, with a strong correspondence of expected return shocks to cumulated
5This appears to broadly confirm the finding of Gallin (2008) for the US, who findsusing an error-correction model of house prices and rents that the rent-price ratio is anindicator of valuation in the housing market.

20ECBWorking Paper Series No 1019March 2009
Figure 2: Impulse responses from selected shocks (%, average responsealong with jackknife standard error bands)
housing returns in Germany but not in Spain, as well as relatively strongertransitory dynamics in Spain. This could partly relate to the less volatileunderlying house price movements in Germany relative to Spain reported inTable 1.
5.2 Variance Decomposition
The variance decomposition implied by the model is contained in Table 3,and indicates that movements in cash flows, or rents, are the main driverof movements in housing market returns. While the unadjusted varianceof cash-flow news, in the form of rents, is over four times that of expectedreturns, the cash-flow-news standard deviation, at 68% (variance of 0.466,with standard error of 0.028) is roughly double that of expected-return newsof around 35% (variance of 0.120). The correlation between the two newsseries is negative and sizeable, at −0.296. This negative correlation sug-gests that house prices overreact to each piece of independent news. Theratio of cash flow variance to total unexpected return variance is over 50%.Overall, the results indicate that housing returns are mainly driven by newson rents (or cash flows), though with an important but less sizeable in-fluence of expected-return variation for house prices. Consistent with thehigh volatility of house prices outlined in Table 1, there may be stable low-frequency variation in expected returns that have little effects on one-periodunexpected returns but cause large and persistent swings in house prices.

21ECB
Working Paper Series No 1019March 2009
Table 3. Variance decomposition of unexpected excess return to housingpercentage points
Variance Jackknife standard errorExpected return news 0.120 (0.008)Cash-flow news 0.466 (0.028)Correlation between expectedreturn and cash-flow news -0.296 (0.025)Ratio of expected return news varianceto total unexpected-return variance 0.136 (0.149)Ratio of cash flow news varianceto total unexpected-return variance 0.529 (0.527)Note: See Table 2 for further details on the estimation.
For robustness, alternative estimations are also run both using popula-tion rather than real per capita disposable income as a control variable (giventhe potential importance of demographic movements in the context of theinelasticity of housing in the short term), as well as the sample excludingGermany. The variance decomposition in both cases is almost unchangedwith respect to results in the baseline specification. Additionally, country-specific return decompositions are presented in Appendix B for Germanyand Spain to illustrate the possible role of heterogeneity underlying theseaggregate results. Results indicate a much stronger role for cash-flow newsin explaining movements in housing returns in Germany, and a strong roleof expected returns in driving developments in housing returns in Spain. In-terestingly, however, the correlation between the two news series is positive,suggesting that house prices underreact to each piece of independent newsin contrast to the aggregate results.
6 Conclusions
The application of a standard present-value formula to housing market anal-ysis implies that house price volatility originates from some combination ofcash-flow or expected-return news. This paper investigated this relation-ship for a panel of eight euro area countries using quarterly data over theperiod 1985-2007. Taking rental yields to reflect cash-flow news, and run-ning a vector autoregressive (VAR) model together with the variables excessreturn on housing, the real interest rate and real per capita disposable in-come, the empirical investigation yields two main findings. First, the bulk ofthe variability of house price movements in the panel of countries analysedcan be attributed to movements in the rental yield. Indeed, perturbations torents appear to result in a one-to-one analogous movement in house pricesover the long term once controlling for changes in expected returns. Thatsaid, while housing returns are driven mainly by news on country rents,there remains an important but less sizeable influence of market-wide (orexpected-return) variations for house prices. Second, it appears that changes

22ECBWorking Paper Series No 1019March 2009
in rental yield expectations co-move negatively with changes in expected re-turns on housing assets, which would suggest in addition to information fromthe dynamic responses to shocks that house prices overreact to news. In thecontext of historically higher volatility in house prices compared with thatof rents, stable low-frequency variation in expected returns could thereforehave contributed to large and persistent swings in house prices.
There are several caveats to the analysis, notably the role of country het-erogeneity, the possibility that non-market forces influence both the flexibil-ity of house price and rents and their implied substitutability, along with thepossibility of changing institutional factors, structural economic change andstatistical issues that could imply some change in historical or equilibriumrelationships. Nevertheless, the results can be considered as containing anillustrative assessment of the relationship between changing euro area houseprices and changing fundamentals in a dynamic framework when allowingfor changes in expected returns.

23ECB
Working Paper Series No 1019March 2009
References
Ayuso, J., R. Blanco, and F. Restoy (2006): “House prices and realinterest rates in Spain,” Banco de Espana Documentos Ocasionales. No.0608.
Campbell, J. Y., and R. J. Shiller (1988a): “The dividend-price rastioand expectations of future dividends and discount factors,” Review ofFinancial Studies, 1.
(1988b): “Stock prices, earnings and expected dividends,” Journalof Finance, 43.
Campbell, S. D., M. A. Davis, J. Gallin, and R. F. Martin (2008):“What Moves Housing Markets: A Variance Decomposition of the Rent-Price Ratio,” Mimeo (October).
Castren, O., T. Fitzpatrick, and M. Sydow (2006): “What drives EUbanks’ stock returns? Bank-level evidence using the Dynamic dividend-discount model,” ECB Working Paper No. 677 (September).
Castren, O., C. Osbat, and M. Sydow (2006): “What drives investorsbehaviour in different FX market segments? A VAR-based return decom-position analysis,” ECB Working Paper No. 706 (December).
Fagan, G., J. Henry, and R. Mestre (2005): “An area-wide model(AWM) for the euro area,” Economic Modelling, 22(1).
Gallin, J. (2008): “The Long-Run Relationship Between House Prices andRents,” Real Estate Economics, 36(4), 635–658.
Girouard, N., M. Kennedy, P. van den Noord, and C. Andre (2006):“Recent house price decelopments: The role of fundamentals,” OECDEconomics Department Working Paper No. 475.
Gros, D. (2006): “Bubbles in real estate? A Longer-Term ComparativeAnalysis of Housing Prices in Europe and the US,” CEPS Working Doc-ument No. 239 (February).
Himmelberg, C., C. Mayer, and T. Sinai (2006): “Assessing High HousePrices: Bubbles, Fundamentals, and Misperceptions,” Journal of Eco-nomic Perspectives, 19.
Krainer, J., and C. Wei (2004): “House Prices and Fundamental Value,”FRBSF Economic Letter (October).
Plazzi, A., W. Torous, and R. Valkanov (2006): “Expected Returnsand the Expected Growth in Rents of Commercial Real Estate,” UCLAAnderson Graduate School of Management Paper 13-04 (March).

24ECBWorking Paper Series No 1019March 2009
Vuolteenaho, T. (2002): “What drives firm-level stock returns,” Journalof Finance, 7.
Weeken, O. (2004): “Asset Pricing and the Housing Market,” Bank ofEngland Quarterly Bulletin, Spring 2004.

25ECB
Working Paper Series No 1019March 2009
Appendices
A Data sources
CONSUMER PRICE INFLATION
Definition: Overall Harmonised Index of Consumer Prices (HICP) index(used to deflate nominal variables). Seasonally adjusted using an x11 filter.
Units: Index, 2005=100.
Source: Eurostat and national sources. Series extended back using overallconsumer price inflation data using national sources for Belgium (pre-1991),Germany (pre-1994), Ireland (pre-1988), Spain (pre-1992), France (pre-1990),Italy (pre-1987), Netherlands (pre-1988) and Finland (pre-1987).
HOUSE PRICE
Definition: Residential property price data deflated using consumer priceinflation; existing dwellings (houses and flats, whole country) for Belgium,France, the Netherlands and Finland; all dwellings (new and existing housesand flats, whole country) for Germany, Ireland, Spain and Italy. Data inter-polated to quarterly for Germany and Italy on the basis of a local quadraticprocedure. Level calibrated to price per square metre in capital city in De-cember 2007 and extended back using index. Seasonally adjusted using anx11 filter.
Units: Real price per square metre.
Source: Calculations based on ECB database of national sources (Cen-tral Bank of Belgium/STADIM, Deutsche Bundesbank/BulwienGesa AG,Permanent TSB, Ministerio de Vivienda, Notaires/INSEE, Banca d’Italia,Kadaster, Statistics Finland) and Global Property Guide (price per squaremetre in capital city in December 2007). ECB database extended back usingdata from the Bank for International Settlements (BIS) for Belgium (pre-1988), Ireland (pre-1988), Spain (pre-1995) and the Netherlands (pre-1993).Series extended back using data from Gros (2006) for Germany and France (botpre-1995).
RENTAL YIELD
Definition: HICP component “Actual rentals paid by tenants includingother actual rentals” deflated using the overall HICP index. Level calibratedto price per square metre in capital city in December 2007 and extended backusing index. Seasonally adjusted using an x11 filter.

26ECBWorking Paper Series No 1019March 2009
Units: Real price per square metre.
Source: Eurostat, Global Insight and national sources (index) and GlobalProperty Guide (price per square metre in capital city in December 2007).HICP rents data extended back using consumer price inflation data of rentsfrom national sources for Belgium (pre-1995), Germany (pre-1995), Ire-land (pre-1995), Spain (pre-1995), France (pre-1996), Italy (pre-1995), Nether-lands (pre-1995), and Finland (pre-1995).
INTEREST RATE
Definition: Interest rate on long-term government bonds less annual con-sumer price inflation.
Units: Percent.
Source: OECD Economic Outlook Database and national sources. Seriesextended back using national sources for Belgium (pre-1992), Germany (pre-1991), Ireland (pre-1989), Spain (pre-1993), France (pre-1991), Italy (pre-1988), Netherlands (pre-1989) and Finland (pre-1988).
POPULATION
Definition: Total population.
Units: Thousands of persons.
Source: Eurostat, Global Insight and national data. Data interpolated toquarterly on the basis of a local quadratic procedure. Eurostat series ex-tended back using national sources for Belgium (pre-1995), Germany (pre-1991), Spain (pre-1991) and Portugal (pre-1991). Population data for Ger-many adjusted for unification by imposing the average growth rate observedover the period 1986Q1-1988Q4 on growth rates over the period 1989Q4-1991Q4.
PER CAPITA DISPOSABLE INCOME
Definition: Real disposable income divided by population data. Seasonallyadjusted using an x11 filter.
Units: 2005 euro.
Source: Calculations based on Eurostat, Global Insight and national data,and the Area-Wide Model database of Fagan, Henry, and Mestre (2005).Disposable income extended back using national sources the case of Bel-gium (pre-1995), Germany (pre-1995), Spain (pre-1995), France (pre-1995),Italy (pre-1995), the Netherlands (pre-1997) and Finland (pre-1995). Realdisposable income data interpolated to quarterly for Ireland on the basis ofa local quadratic procedure.

27ECB
Working Paper Series No 1019March 2009
B Results of country VARs for Germany and Spain
Figure 3: Impulse responses from selected shocks (Germany) (%,average response along with jackknife standard error bands)
Table B1. Variance decomposition of unexpected excess return to housingpercentage points, German data
Variance Jackknife standard errorExpected return news 0.031 (0.005)Cash-flow news 0.614 (0.104)Correlation between expectedreturn and cash-flow news 0.089 (0.030)Ratio of expected return news varianceto total unexpected-return variance 0.056 (0.058)Ratio of cash flow news varianceto total unexpected-return variance 1.104 (1.140)Note: See Table 2 for further details on the estimation.
28ECBWorking Paper Series No 1019March 2009
Figure 4: Impulse responses from selected shocks (Spain) (%, averageresponse along with jackknife standard error bands)
Table B2. Variance decomposition of unexpected excess return to housingpercentage points, Spanish data
Variance Jackknife standard errorExpected return news 0.359 (0.096)Cash-flow news 0.409 (0.065)Correlation between expectedreturn and cash-flow news 0.277 (0.096)Ratio of expected return news varianceto total unexpected-return variance 0.732 (1.212)Ratio of cash flow news varianceto total unexpected-return variance 0.834 (0.825)Note: See Table 2 for further details on the estimation.
29ECB
Working Paper Series No 1019March 2009
European Central Bank Working Paper Series
For a complete list of Working Papers published by the ECB, please visit the ECB’s website
(http://www.ecb.europa.eu).
973 “Do China and oil exporters influence major currency configurations?” by M. Fratzscher and A. Mehl,
December 2008.
974 “Institutional features of wage bargaining in 23 European countries, the US and Japan” by P. Du Caju, E. Gautier,
D. Momferatou and M. Ward-Warmedinger, December 2008.
975 “Early estimates of euro area real GDP growth: a bottom up approach from the production side” by E. Hahn
and F. Skudelny, December 2008.
976 “The term structure of interest rates across frequencies” by K. Assenmacher-Wesche and S. Gerlach,
December 2008.
977 “Predictions of short-term rates and the expectations hypothesis of the term structure of interest rates”
by M. Guidolin and D. L. Thornton, December 2008.
978 “Measuring monetary policy expectations from financial market instruments” by M. Joyce, J. Relleen and
S. Sorensen, December 2008.
979 “Futures contract rates as monetary policy forecasts” by G. Ferrero and A. Nobili, December 2008.
980 “Extracting market expectations from yield curves augmented by money market interest rates: the case of Japan”
by T. Nagano and N. Baba, December 2008.
981 “Why the effective price for money exceeds the policy rate in the ECB tenders?” by T. Välimäki,
December 2008.
982 “Modelling short-term interest rate spreads in the euro money market” by N. Cassola and C. Morana,
December 2008.
983 “What explains the spread between the euro overnight rate and the ECB’s policy rate?” by T. Linzert and
S. Schmidt, December 2008.
984 “The daily and policy-relevant liquidity effects” by D. L. Thornton, December 2008.
985 “Portuguese banks in the euro area market for daily funds” by L. Farinha and V. Gaspar, December 2008.
986 “The topology of the federal funds market” by M. L. Bech and E. Atalay, December 2008.
987 “Probability of informed trading on the euro overnight market rate: an update” by J. Idier and S. Nardelli,
December 2008.
988 “The interday and intraday patterns of the overnight market: evidence from an electronic platform”
by R. Beaupain and A. Durré, December 2008.
989 “Modelling loans to non-financial corporations in the euro area” by C. Kok Sørensen, D. Marqués Ibáñez and
C. Rossi, January 2009.
990 “Fiscal policy, housing and stock prices” by A. Afonso and R. M. Sousa, January 2009.
991 “The macroeconomic effects of fiscal policy” by A. Afonso and R. M. Sousa, January 2009.

30ECBWorking Paper Series No 1019March 2009
992 “FDI and productivity convergence in central and eastern Europe: an industry-level investigation”
by M. Bijsterbosch and M. Kolasa, January 2009.
993 “Has emerging Asia decoupled? An analysis of production and trade linkages using the Asian international
input-output table” by G. Pula and T. A. Peltonen, January 2009.
994 “Fiscal sustainability and policy implications for the euro area” by F. Balassone, J. Cunha, G. Langenus, B. Manzke,
J. Pavot, D. Prammer and P. Tommasino, January 2009.
995 “Current account benchmarks for central and eastern Europe: a desperate search?” by M. Ca’ Zorzi, A. Chudik
and A. Dieppe, January 2009.
996 “What drives euro area break-even inflation rates?” by M. Ciccarelli and J. A. García, January 2009.
997 “Financing obstacles and growth: an analysis for euro area non-financial corporations” by C. Coluzzi, A. Ferrando
and C. Martinez-Carrascal, January 2009.
998 “Infinite-dimensional VARs and factor models” by A. Chudik and M. H. Pesaran, January 2009.
999 “Risk-adjusted forecasts of oil prices” by P. Pagano and M. Pisani, January 2009.
1000 “Wealth effects in emerging market economies” by T. A. Peltonen, R. M. Sousa and I. S. Vansteenkiste,
January 2009.
1001 “Identifying the elasticity of substitution with biased technical change” by M. A. León-Ledesma, P. McAdam
and A. Willman, January 2009.
1002 “Assessing portfolio credit risk changes in a sample of EU large and complex banking groups in reaction
to macroeconomic shocks” by O. Castrén, T. Fitzpatrick and M. Sydow, February 2009.
1003 “Real wages over the business cycle: OECD evidence from the time and frequency domains” by J. Messina,
C. Strozzi and J. Turunen, February 2009.
1004 “Characterising the inflation targeting regime in South Korea” by M. Sánchez, February 2009.
1005 “Labor market institutions and macroeconomic volatility in a panel of OECD countries” by F. Rumler and
J. Scharler, February 2009.
1006 “Understanding sectoral differences in downward real wage rigidity: workforce composition, institutions,
technology and competition” by P. Du Caju, C. Fuss and L. Wintr, February 2009.
1007 “Sequential bargaining in a new-Keynesian model with frictional unemployment and staggered wage negotiation”
by G. de Walque, O. Pierrard, H. Sneessens and R. Wouters, February 2009.
1008 “Liquidity (risk) concepts: definitions and interactions” by K. Nikolaou, February 2009.
1009 “Optimal sticky prices under rational inattention” by B. Maćkowiak and M. Wiederholt, February 2009.
K. Moll, February 2009.
1012 “Petrodollars and imports of oil exporting countries” by R. Beck and A. Kamps, February 2009.
1010 “Business cycles in the euro area” by D. Giannone, M. Lenza and L. Reichlin, February 2009.
1011 “The global dimension of inflation – evidence from factor-augmented Phillips curves” by S. Eickmeier and
1013 “Structural breaks, cointegration and the Fisher effect” by A. Beyer, A. A. Haug and B. Dewald, February 2009.

31ECB
Working Paper Series No 1019March 2009
1014 “Asset prices and current account fluctuations in G7 economies” by M. Fratzscher and R. Straub, February 2009.
February 2009.
1016 “When does lumpy factor adjustment matter for aggregate dynamics?” by S. Fahr and F. Yao, March 2009.
1017 “Optimal prediction pools” by J. Geweke and G. Amisano, March 2009.
1018 “Cross-border mergers and acquisitions: financial and institutional forces” by N. Coeurdacier, R. A. De Santis
and A. Aviat, March 2009.
and M. Sydow, March 2009.
1019 “What drives returns to euro area housing? Evidence from a dynamic dividend-discount model” by P. Hiebert
1015 “Inflation forecasting in the new EU Member States” by O. Arratibel, C. Kamps and N. Leiner-Killinger,

by Olli Castren, Trevor Fitzpatrick and Matthias Sydow
Assessing Portfolio Credit risk ChAnges in A sAmPle of eU lArge And ComPlex BAnking groUPs in reACtion to mACroeConomiC shoCks
Work ing PAPer ser i e sno 1002 / f eBrUAry 2009


