46


1
What factors affect the competiveness of power generation
sector in China? An analysis based on game cross-efficiency
Bai-Chen Xie a,b
, Jie Gao a , Shuang Zhang
a,b , ZhongXiang Zhang
a,c,*
a College of Management and Economics, Tianjin University, Tianjin, China
b APEC Sustainable Energy Center, Tianjin University, Tianjin, China
c China Academy of Energy, Environmental and Industrial Economics, Tianjin University, Tianjin,
China
Abstract
China’s unbundling reform in 2002 aimed to introduce competitiveness into the power
industry, especially the generation sector, to improve its operational efficiency. Meanwhile, great
concern about a range of environmental problems and global climate change increasingly calls for
saving energy and abating emissions. Thus, the ability to balance the reduction of carbon
emissions with economic benefits may to a great extent determine the competitiveness of power
generation sector. This study first adopts the game cross-efficiency approach to evaluate the
environmental efficiency of the generation sectors in China’s 30 provinces. It then employs a
system generalized method of moments model to explore the determinants of their performance
while eliminating the associated endogeneity problem. The results of this first study combining the
two methods indicate that efficiency gaps do exist among the regions even though overall
efficiency has been improved. Despite the negative correlation between environmental efficiency
and the thermal power ratio, the power mix should be adjusted gradually. The average firm size
and capacity utilization rates are positive factors boosting the environmental efficiency. The
2
incentive policies for clean energy development should be differentiated across regions according
to their power mix and self-sufficiency ratio.
Keywords: Game cross-efficiency; Data envelopment analysis; Generalized method of moments;
Power industry; Environmental efficiency; China
JEL classifications: Q54; Q55; Q58; Q43; Q48; O13; O44; R11
Address for Correspondence:
ZhongXiang Zhang, Ph.D in Economics
Director, China Academy of Energy, Environmental and Industrial Economics
Distinguished University Professor
College of Management and Economics
Tianjin University
92 Weijin Road
Tianjin 300072
China
Tel: +86 22 87370560
Email: [email protected]

3
1. Introduction
The history of power system reform reveals a process aimed at improving market
mechanisms and building good competition systems. Such reforms not only take place in the
developed world, such as the power reforms in England in the early 1990s (Stagliano, 1997) and
the first pilot reform in California, USA in 1996 (Wiser et al., 1998). Similar reforms are also
undertaken in developing countries, such as Argentina, Brazil, Chile (Rudnick et al., 2005), and
Iran (Arabi et al., 2014). Introducing market-oriented mechanisms has always been the aim of
China's power reforms in recent decades. In the 1980s China began to implement the policy of
“open the industry to the public to raise funds” in the generation sector to overcome the
nationwide power shortage. This led to a trend of establishing joint-stock power companies.1
Later reforms further encouraged foreign companies to invest in the power industry. With the
abolition of the Ministry of Power Industry, the government began to implement the policy of
"separation of government and enterprises" and established the State Power Corporation;
simultaneously, it also encouraged the local governments to be investors in the power industry.
This policy completely broke down the unified management system and the corresponding
management functions were transferred from the Ministry of Power Industry to the national and
local Economic and Trade departments concerned.
In 2002 the State Council issued the unbundling reform of “separating power-generating
plants from grids”. This was the first attempt to establish a market-oriented mechanism and
framed China’s power management system over the following 15 years. By dismantling the
vertically integrated management system into independent companies, this policy aims to develop
1 The first central and local co-funded power plant, Shandong Centennial Power Development Co., Ltd., was
established in Longkou, Shandong province in 1984.

4
a competitive regional or even national wholesale electricity market where power plants would
place bids into the market and gain grid-access priority according to the economic merit. In 2003
the State Power Corporation was dismantled and reorganized into 11 corporations according to the
nature of their business, among which five were generation groups,2 in an effort to intensify the
competition and improve the economic efficiency. To achieve a fair competitive environment, all
of the five generation groups were roughly the same size with an installed capacity of 32 million
kilowatts, with each of them occupying no more than 20% of the regional electricity market. This
guaranteed a basic pattern of equal competition for China’s generation market (Du et al., 2013). At
the same time, more and more generation enterprises, including local enterprises, four national
enterprises,3 and foreign-funded enterprises, were established all over the country. These progress
had broken down the old monopoly on power generation side. Along with the development of the
power market, price mechanism reforms have also been carried out.4
Generally speaking, China’s unbundling reform has accomplished a degree of success in the
generation sector (Duan et al., 2016; Xie et al., 2012; Zhao and Ma, 2013), and it has had
significant positive effects in enhancing the efficiency of fossil-fired power plants (Arabi et al.,
2014; Du et al., 2013; Ghosh and Kathuria, 2016; Meng et al., 2016). Nevertheless, with
significant increase in installed power capacity, the power supply has exceeded demand since
2012 on the whole, especially in the north, northeast, and northwest of China where the wind
resources are abundant but the wind power is frequently curtailed. In this case the provinces with
2 They are Datang Corporation, Huaneng Group, Guodian Corporation, Huadian Corporation, and State Power
Investment Corporation. 3 They are China Resource Power Holdings Co., Ltd., SDIC Power Holdings Co., Ltd., China General Nuclear
Power Corporation, and Guohua Electric Power Company. 4 In 2004 China announced a unified feed-in tariff policy for coal-fired units across the country for the first time,
which was adjusted in accordance with changes in the generation cost. In 2006 China promulgated the "renewable
energy power generation price and cost-sharing management pilot scheme," which defined the tariff and
cost-sharing management approach for the construction of renewable energy power generation projects.

5
excess power supplies have to face fierce competition when they endeavor to export their surplus
power to the importing provinces to increase their efficiency. Both the trend of developing an open,
orderly, and competitive electricity market for further electricity market reform (Meng et al., 2016;
Mou, 2014) and the unbalanced power supply-demand situation show that the electricity sector is
facing increasingly fierce competition. It is necessary to objectively examine the performance of
the generation sector in a competitive environment to improve its efficiency and provide some
guidance on further reform.
To cope with the deterioration of the environment, there is a growing trend in recent years of
incorporating environmental factors when analyzing the operational efficiencies of the generation
sector. Despite the pillar role of the power industry in China’s economy, it also contributes to a
large share of the national carbon emissions. Since the beginning of the 21st century, the
corresponding proportion has remained at a level of over 40% (Yan et al., 2016; Yang and Lin,
2016). To reduce fuel consumption and air pollution, the 12th Five-Year Energy Development Plan
set the power consumption goal for 2015 for the first time, and the power industry came into a
new era of dual control for both generation and carbon emissions. Furthermore, under the joint
China-US climate statement in November 2014, China committed to capping its GHG emissions
around 2030, and to trying to peak early, and increasing the share of non-fossil fuel use to around
20% by 2030.5 These commitments were officially incorporated into China’s Intended Nationally
Determined Contributions submission to the United Nations Framework Convention on Climate
Change Secretariat. In addition, China pledged to reduce the carbon intensity of its economy by
60–65% by 2030 compared to 2005 levels (see Zhang (2017) for further discussion on China’s
5 See “US-China joint announcement on climate change” published by White House in November 2014.

6
2030 commitments).6 Yan et al. (2016) estimated that China’s CO2 emissions would rise to 5596
Mt by 2020 if no effective measures were adopted after 2012, which would run counter to the
national emission reduction commitment. From 2014 the state government officially included the
CO2 emission intensity reduction goals in the regional or industry indexes for the first time.7 As
one of the key industries for emission abatement, the electricity industry has introduced a quota
control mechanism in implementing its development plan and allocating emission shares.8 Under
the circumstance it is essential to supplement the productivity performance with environmental
efficiency in evaluating the development of the generation sector.
This study adopts a data envelopment analysis (DEA) game cross-efficiency model to assess
the environmental performance of the power generation sectors under dual control of generation
and carbon emissions. Considering the differences in fuel quality, energy structure, and technology,
it further explores the determinants affecting the competitiveness of the generation sector.
Although the power plants are operated by the generation groups following the unbundling reform
in 2002, the power generation is determined by the provincial grids where the plants are located.
Moreover, the production plans and emission quotas are all implemented by the provinces, so the
studies of the generation sector in China mainly involve provincial analysis (Lin and Yang, 2014;
Sueyoshi and Yuan, 2015; Zhou et al., 2013). To the best of our knowledge, this is the first attempt
to take the competitiveness into consideration in evaluating the performance of the generation
industry. Other contribution lies in introducing the system generalized method of moments
6 See “Enhanced actions on climate change: China’s intended nationally determined contributions” by
National Development and Reform Commission in June 2015. 7 See the “Carbon dioxide emission reduction per unit of GDP target responsibility assessment approach” issued
by the National Development and Reform Commission in August 2014, in which the provincial CO2 emission
reduction per unit of GDP target is among the most important assessment indicators. 8 The “Greenhouse gas emissions control program during 13th Five Year Plan” by the State Council in November
2016.

7
(SGMM) to eliminate the endogeneity problem among the provincial factors affecting their
performance. The rest of our paper proceeds as follows. Section 2 reviews the related literature.
Section 3 introduces the concept of game cross-efficiency and SGMM. Sections 4 and 5 present
the empirical results and discussions. Section 6 presents our conclusions and puts forward some
policy recommendations.
2. Literature review
DEA is a widely used and effective method to conduct efficiency evaluation due to its
advantages in measuring efficiency for multiple inputs and outputs without assigning weights and
specifying any function form (Cook and Seiford, 2009; Liu et al., 2013; Zhou et al., 2008). A
typical characteristic of the energy and electricity industries is that undesirable outputs, which
causes environmental problems, are produced in addition to desirable outputs. Thus it should
come no surprise that energy and electricity are among the most widely applied DEA areas (Zhou
et al., 2008). With regard to the issues that are combined with environmental problems, the
economic index and environmental index are separated into input and output. If pollution exists in
the output, this output becomes an undesirable output and should be minimized. Generally, the
undesirable output can be solved through function variation and then combined with DEA models.
Sueyoshi et al. (2017) summarized DEA applications from the 1980s to the 2010s, and suggested
that of 185 papers on electricity, 75 ones were combined analyses dealing with various
environmental issues, such as greenhouse gas emissions and waste discharges.
Färe et al. (1996) evaluated the environmental performance of American fossil fuel-fired

8
electric utilities where CO2 emissions are considered in addition to emissions of SO2 and NOx. In
recent years, with the increasing concern about global climate change, CO2 emissions have
become the main and even the only undesirable output in work on the power sector’s
environmental efficiency. These studies can probably be classified into four groups: comparison
between countries and analysis based on a regional, firm, or plant level. In the comparative
analysis between countries, the Organization for Economic Cooperation and Development
(OECD), European Union, and Brazil, Russia, India, and China (BRIC) countries and other
international organizations are common objects of research. For example, Xie et al. (2014)
employed the environmental Malmquist index to measure the environmental efficiency of the
electric power industries in 26 OECD and BRIC countries, and Ewertowska et al. (2016)
combined DEA with life cycle assessment to analyze the environmental performance of the power
sector in 27 top European economies. At the regional level, most of the studies involved the
environmental performance of the provincial power industry and analyses of the regional
differences (Bian et al., 2013; Lin and Yang, 2014; Zhou et al., 2013). At the firm or plant level,
Korhonen and Luptacik (2004) presented the performance of power plants when evaluating
technological and ecological efficiencies. Sueyoshi and Goto (2011) discussed a new non-radial
DEA approach to measure the unified (operational and environmental) efficiency of Japanese
fossil fuel power generation from 2004 to 2008 and made methodological comparisons between
the different DEA models. Arabi et al. (2014) compared the eco-efficiency of different types of
thermal power plants (steam, gas, and combined cycle) in Iran under the background of power
reform; the results showed that restructuring succeeded in improving the power generation
facilities’ performance. Du and Mao (2015) estimated the environmental efficiency of thermal

9
power plants in China using the data from the China Economic Census in 2004 and 2008.
The ultimate aim of efficiency evaluation for the power generation sector is to find the
influencing factors and then put forward targeted measures to improve the performance. Many
DEA studies have advocated a two-step approach where efficiency is estimated in the first step
using linear programming, and then the estimated efficiencies are regressed on explanatory
variables in the second step (Nakano and Managi, 2008). For example, Yang and Pollitt (2009)
analyzed the impact of the calorific value of coal and the unit scale on the environmental
efficiency of power plants. Fleishman et al. (2009) presented the effect of air quality policies on
the efficiency of US power plants. Du and Mao (2015) analyzed the effect of several factors: the
ownership, scale, age, energy consumption structure, subsidy, location, and time trend.
However, the aforementioned literature did not consider the competition in the power industry,
which will influence its performance during the efficiency evaluation by DEA. In reality, the
competition is ubiquitous, especially in the situation where the generation sector is under the
constraints of energy consumption and carbon reduction and the power supply-demand is
imbalanced. At the beginning of plant-grid separation, China was in a power shortage, and
provincial governments were competing for the construction of power generation projects. After
2012, the power supply situation began to ease, especially in the northeast, northwest, and other
regions where wind power curtailment frequently happens, thereby stimulating the construction of
high-voltage transmission networks to export surplus electricity. However, the DEA models used
to estimate environmental performance mainly include the traditional CCR (Charnes, Cooper and
Rhodes) model (Zhou and Ang, 2008), slacks-based measure (Bi et al., 2014), the Malmquist
index (Chen and Golley, 2014; Woo et al., 2015), non-radial DEA (Bian et al., 2013), and DEA

10
cross-efficiency (Liu et al., 2017). None of these models can incorporate competition between
different provincial generation sectors. Wu et al. (2009) and Roboredo et al. (2015) adopted a new
DEA model, game cross-efficiency, which was pioneered by Liang et al. (2008), to measure the
efficiency of decision-making units (DMUs) and rank them in a competitive environment; it has
been proved to be an effective method in this situation. Until now game cross-efficiency has been
mainly applied in studies about sporting events and has never been involved in the studies
regarding the power industry.
Measuring efficiency without considering competition among provinces does not seem to
provide an equitable score for efficiency benchmarking and comparisons. Hence, we adopt the
game cross-efficiency model to measure the environmental performance and give a specific rank
of the generation sectors in a competitive power market. Compared to basic DEA, game
cross-efficiency follows the peer evaluation concept of cross-efficiency in view of the similar
features of the provincial generation sectors. In common with branches, peer evaluation can better
reflect the relative environmental performance among provinces. The efficiency values and
rankings obtained from game cross-efficiency can properly reflect the competitiveness of the
provincial generation sectors. For the determinants analysis the previous studies mainly used Tobit
regression (Fleishman et al., 2009; Zhao et al., 2014; Zhao et al., 2015; Zhou et al., 2013),
neglecting the endogenous problem in the variables when the dependent variables were obtained
from DEA; in particular, the lagged independent variable in the regression model can lead to the
endogenous problem because of the correlation between the independent variable and the error
term (Fan et al., 2015). To avoid this problem, some studies adopted the SGMM estimator in the
second step (Chen and Golley, 2014; Fan et al., 2015). Meanwhile, SGMM is suitable for

11
situations with “small T, large N” panels, meaning few time periods and many individuals
(Roodman, 2006). To the best of our knowledge, this study is the first attempt to adopt game
cross-efficiency approach in the electricity industry. Also, we believe that it is the first time that
SGMM has been used to analyze the determinants of the Chinese generation sector’s
environmental efficiency.
3. Methodology
In this section we first introduce game cross-efficiency, which is used to measure the
environmental efficiency of the generation sector in China, and we then introduce SGMM to
analyze the influence factors.
3.1 The game cross-efficiency method
DEA is a non-parameter linear programming technique that is used to assess the relative
efficiency of DMUs. However, the basic DEA method groups the DMUs into two sets: those that
are efficient and those that are inefficient. This method cannot discriminate further, and it is apt to
benefit itself in the choice of weight (Adler et al., 2002). The decision-makers are often interested
in a complete ranking in order to refine the efficiency, and DEA cross-efficiency is commonly
used among the different ranking methods (Liu et al., 2017). This approach was originated by
Sexton et al. (1986), and further developed by Doyle and Green (1994). They argued that
cross-efficiency is a democratic process with less of the arbitrariness of additional weight
restrictions.

12
Supposing that there are n DMUs, the cross-efficiency method simply calculates the
efficiency score of each DMU n times using the optimal weights evaluated by the n linear
programming and then averages the results to get an average cross-efficiency score. It can avoid
the disadvantages of basic DEA by both self and peer evaluation, whereas the cross-efficiency
score may not be unique. To eliminate the non-uniqueness of cross-efficiency scores, aggressive
and benevolent strategies have been proposed as secondary goals by minimizing or maximizing
other DMU’s efficiency values at a second level. The way the weight is chosen is affected by the
bias of the decision makers, and this will affect the objectivity of the evaluation results to some
extent. In addition, each DMU is not independent but competes with others directly or indirectly
in many cases. Liang et al. (2008) proposed a game cross-efficiency model based on the idea of
cross-efficiency using game theoretic constructs, and it has been proved that this model can get a
unique Nash equilibrium solution.
In a competitive electricity market each provincial generation sector can be treated as a
competitor (i.e. the DMU in a DEA model) with m inputs and s outputs, then
1,2, ,ijx i m and ( 1,2, , )rjy r s represent the i th input and r th output of
1,2, ,jDMU j n . The game cross-efficiency model is given as follows:
1
1 1
1
1 1
. . 0, 1,2, , ,
1,
0,
0, 1,2, , ,
0, 1,2, , .
sd
rj rj
r
m sd d
ij il rj rl
i r
md
ij ij
i
m sd d
d ij id rj rd
i r
d
ij
d
rj
Max y
s t x y l n
x
x y
i m
r s
(1)
where d is a parameter with an initial value given by the average original cross-efficiency of

13
dDMU , and finally it converges to the best (average) game cross-efficiency score;
1 1- 0
m sd d
d ij id rj rdi rx y
ensures that, for each competing jDMU , a multiplier bundle to
optimize the efficiency score for j is determined with the additional constraint that the resulting
score for d should be at or above d ’s estimated best performance. Therefore, this approach can
be regarded as a form of a generalized benevolent approach.
For each jDMU , Model (1) is solved n times, once for each 1,2, ,d n , and for each
d , it holds the constraint 1
1m d
ij ijix
for 1,2, ,jDMU j n . Hence, the game
d-cross-efficiency score for each jDMU can be defined as follows:
1
1
, 1,2, , ,
s d
rj rjrdj m d
ij iji
yd n
x
(2)
where d
rj and d
ij are the optimal weights for 1,2, ,ijx i m and ( 1,2, , )rjy r s ,
respectively, in Model (1). Then the average game cross-efficiency score of jDMU is:
*
1 1
1 n sd
j rj d rj
d r
yn
(3)
In this study we aim to evaluate the whole performance of the generation sector. As well as
the operational performance, it is also necessary to take into account some byproducts that have an
adverse effect on the environment.9 In this case we incorporated undesirable outputs into the
game cross-efficiency model to maximize the reduction of CO2 emissions when maximizing the
power generated. Scheel (2001) summarized the DEA approaches with undesirable outputs and
classified them as direct and indirect approaches. The indirect approaches use a monotone
decreasing function f to transform the values of undesirable outputs into “normal” outputs,
since after transformation increasing the transformed data means decreasing the original
undesirable outputs. We follow the indirect approaches and apply the conversion function
9 This study mainly considers the environmental efficiency of the generation sector under the constraints of carbon
abatement, and so CO2 is treated as the only undesirable output.

14
f U U , where U represents the set of undesirable outputs, then we perform the following
mathematical programming for each jDMU with undesirable outputs:
1 1
1 1 1
1
1 1 1
. . 0, 1,2, , ,
1,
0,
0, 1,2, , ,
0, 1,2, , ,
0, 1,2
qsd d
rj rj kj kj
r k
qm sd d d
ij il rj rl kj kl
i r k
md
ij ij
i
qm sd d d
d ij id rj rd kj kd
i r k
d
ij
d
rj
d
kj
Max y b
s t x y b l n
x
x y b
i m
r s
k
, , .q
(4)
where 1,2,kjb k q represents the k th undesirable outputs of 1,2, ,jDMU j n , and
is the corresponding weighting vector; the other settings are the same as for Model (1). In Model
(4) the transformed undesirable outputs are handled as desirable outputs in the mathematical
programming, and we can find that this treatment is able to achieve the expected results to
minimize the undesirable outputs when maximizing the desirable outputs.
The game d-cross-efficiency of jDMU in this situation can be defined as follows:
1 1
1
, 1,2, , ,
s qd d
rj rj kj kjr k
dj m d
ij iji
y bd n
x
(5)
and the average game cross environmental efficiency score of jDMU is:
* *
1 1 1
1 qn sd d
j rj d rj kj d kj
d r k
y bn
(6)
3.2 Driving factor analysis on SGMM
To avoid unobserved heterogeneity, omitted variable bias, and measurement errors when
using the pooled ordinary least squares and fixed effect method, we use SGMM to analyze the
15
driving factor of environmental efficiency (Zhang et al., 2017). Arellano and Bond (1991) first
proposed the difference GMM (DGMM) estimator, in which the first difference taking the levels
of past values as instruments is used. The SGMM estimator, an improvement of the DGMM
estimator, was developed by Arellano and Bover (1995) and Blundell and Bond (1998). Compared
to DGMM the SGMM allows more instruments to be introduced, thereby significantly improving
the efficiency (Roodman, 2006). SGMM is a dynamic panel regression model that is suitable for
“small T, large N” panels, which aligns nicely with this study of China’s generation sectors with
many provinces but a relatively short span. Meanwhile, the efficiency results achieved from game
cross-efficiency and the explanatory variables might not be strictly exogenous. Thus, the SGMM
is employed to do a second step analysis.
The SGMM model can be specified as follows:
, 0 , 1 , ,i t i t i t i tE E X (7)
, ,i t i i t (8)
where ,i tE represents the environmental efficiency of the i th province in year t, which is
obtained from the game cross-efficiency model, and , 1i tE represents the lagged dependent
variable. The lagged dependent variable is used as an explanatory variable to exclude the history
of the other independent variables so that the results represent the influence in the current period.
,i tX refers to the vector of different environmental explanatory variables, and ,i t is an error
term representing the individual (provincial) influence, including the time-invariant individual
characteristics i and observed specific influence ,i t .
Several tests need to be carried out for SGMM: first, we need to use the Arellano–Bond test
to test whether the residual series autocorrelation exists, and the null hypothesis is that the residual

16
series has no autocorrelation. SGMM is insensitive to first-order autocorrelation, but no significant
second-order autocorrelation in the residual series should be satisfied, because such an
autocorrelation will make the lags of endogenous variables inappropriate instruments. Besides, it
is necessary to test the instrument validity using the Sargan (Sargan, 1958) or Hansen (Hansen,
1982) tests. In this study the two tests are performed simultaneously to ensure the validity of the
results, and their null hypotheses indicate that these instrumental variables are valid.
4. Empirical study
4.1 Data
In this section we adopt game cross-efficiency to calculate the environmental efficiency of
the provincial generation sector from 2003 to 2013. This study includes 30 provinces, and does
not cover Taiwan, Hong Kong, Macao, and Tibet. We selected 2003 as the starting year of the
study since the competitive mechanism was introduced after the reform of the Plant-Grid
Separation in 2002. The non-energy inputs include capital and the labor force. Capital is measured
in terms of the installed generating capacity (Bi et al., 2014; Mou, 2014; Zhou et al., 2013), which
is derived from China’s Electric Power Industry Statistics Compiled. For the labor force, previous
studies usually took the labor force in the power and thermal generation and supply industry as
proxy (Bi et al., 2014; Lin and Yang, 2014). This treatment does not accurately reflect the input of
the labor force in the generation sector. Hence, we collect the annual average of the total number
of employees in the provincial generation sector from the Macro China Industry Database,10
the
10 http://mcid.macrochina.com.cn/.

17
statistical caliber of which is consistent with the rest of the inputs and outputs data. But because
data in this Database ended in 2013, the time span for our research is set to range from 2003 to
2013. The energy input is total energy consumption, which is calculated on standard coal
equivalent and is gathered from the China Energy Statistical Yearbook 2004–2014. Annual net
electricity generated, which is collected from China’s Electric Power Industry Statistics Compiled
2004–2014, is used as the single desirable output. Although some studies have used SO2, NOx, and
soot as undesirable outputs (Bi et al., 2014; Zhou et al., 2013), other studies have mainly been
concerned about carbon emissions, so they have chosen CO2 emissions as the undesirable output
(Du and Mao, 2015; Lin and Yang, 2014; Sueyoshi and Goto, 2011). This study adopts CO2
emissions as the only undesirable output, since our focus is on the performance level under the
pressure for carbon emissions reduction. Because the data for CO2 emissions are not directly
available, so we multiplied the various types of fossil fuels consumed by the power generation
sectors by the corresponding CO2 emission coefficients to get the emission data required; the CO2
emission factors are derived from the IPCC (2006). Table 1 shows the basic statistics of inputs
and outputs indicators.
[Insert Table 1 about here]
4.2 Results
The efficiency scores and statistics of the rankings obtained from the game cross-efficiency
model are shown in Table 2. The results show that this method has an excellent discrimination for
efficiency and can sort the results in a specific order. Meanwhile, Fig. 1 displays the statistical
properties of the environmental efficiency in different provinces, and we can see that the variation
18
range of the efficiency value shrinks at first and then expands and shrinks again. The ceiling of the
environmental efficiency calculated by game cross-efficiency is one; thus, the variation range is
determined by the floor. If we combine the efficiency and electricity supply–demand, we can draw
the conclusion that the efficiency value is relatively high during the periods of power shortage and
vice versa. When the power supply is insufficient, all the provinces must be fully productive to get
a higher level of efficiency, even if the technical level and management level are limited, whereas
the differences in the efficiency across provinces widened. In brief, the game cross-efficiency can
exactly capture the influence of the external situation and reflect the competitiveness of the power
system. It has proved to be an extremely effective method to analyze the efficiency of the power
system in a competitive market.
Of all the 330 samples, 37.2% of the provinces stay at more than 0.9 in terms of
environmental efficiency, and the proportion of provinces that are more than 0.75 reaches 89.7%,
indicating that the efficiencies of the generation sector in most provinces are not very different. As
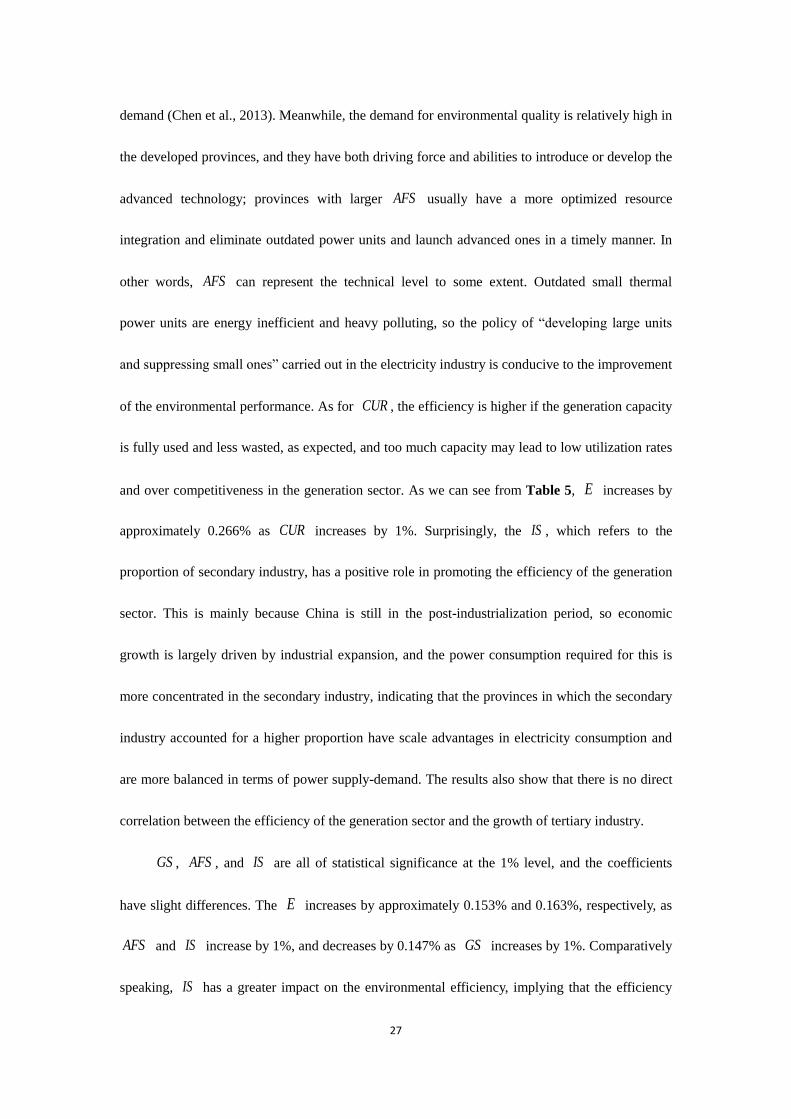
can be seen from Fig. 2, the average environmental efficiency of all provinces changes from 0.838
in 2003 to 0.875 in 2008 before slipping to 0.852 in 2009. Another low point appears in 2012, and
then there is a rise to 0.883 in 2013, showing a rising trend in fluctuations. After the
implementation of the Plant-Grid Separation, the power-generation enterprises had to participate
in the market competition, which mobilized the enthusiasm for production and enhanced the
power efficiency. In addition, the high GDP growth rate of more than 10%, along with the
continuously increasing electricity demand, facilitated the improvement of capacity utilization in
the power industry and further promoted the efficiency of the industry. However, after the
outbreak of the U.S. subprime mortgage crisis, the economies of various countries were generally
19
adversely affected due to economic globalization, and China was no exception. At the end of 2008
economic growth began to decline, and the electricity consumption growth rate dropped from the
previous year’s 14.4% to 5.6%. Despite the introduction of the country's four trillion yuan
economic stimulus plan, China's economic growth was still unavoidably affected, and the
electricity consumption growth rate rapidly declined, so the average production efficiency of the
power industry fell to its lowest value again. With economic growth back on track, the average
efficiency has gradually picked up. However, the average efficiency in 2012 reduces to another
low point. Not surprisingly, the GDP growth rate in 2012 is lower than before. Based on the
aforementioned analysis, we can find that the efficiency values have the same trend as the
economic growth rate with a certain lag.
It is noteworthy that there are outliers below normal levels during 2011 to 2013. Jilin has
abnormal values for these three years, and the abnormal value in 2012 also includes Heilongjiang.
The outliers indicate that the efficiency of each of these provinces has a large gap to the normal
level, and Jilin happens to be the area with the most severe wind power curtailment in these three
years (the specific analysis is given in Section 5.1). Several outliers occurred only after 2011 when
there was an oversupply of electricity. This suggests that an unreasonable allocation of capacity
not only failed to improve efficiency but widened the gap with other provinces. In addition,
technological progress leads to the improvement of the overall efficiency, and this also widens the
gap between the backward provinces and the frontier. In 2005–2008, when the tensions of power
supply had emerged, the distribution of efficiency values is compact even though the lowest value
exceeds 0.7. The first quartiles show an overall increasing trend, and they are over 0.8 in the
research period except for the first two years; the third quartiles remain basically stable and have

20
been fluctuating around 0.92; the medians change very slightly, ranging from 0.86 to 0.89. All of
these three indicators are increasing during 2009–2013 except for 2012. The gap between the first
and third quartiles narrows, indicating that the efficiencies of the provinces are in a convergence
trend, and the differences among the provinces are gradually reducing. This implies that the
corresponding measures, such as eliminating outdated power generation equipment, have achieved
their initial results under the constraints of both energy saving and emission abatement.
[Insert Table 2 about here]
[Insert Fig. 1 about here]
[Insert Fig. 2 about here]
5. Discussions
5.1 Environmental efficiency gaps
In order to reflect the socio-economic development level of different regions more
scientifically and better formulate regional development policies, all the provinces are usually
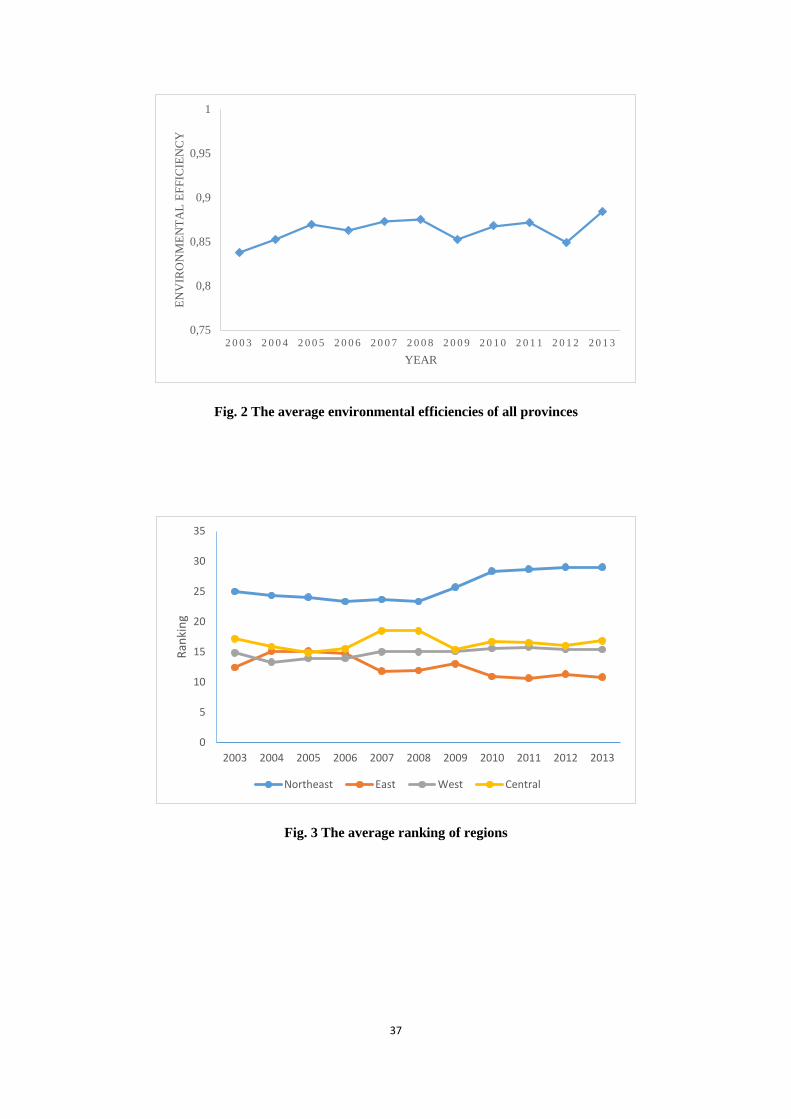
classified into four regions: the eastern, middle, western, and northeastern regions.11 In this study,
in accordance with this regional division, we calculate the average values of the environment
efficiencies and rankings of the provinces in the eastern, middle, western, and northeastern regions
to explore the differences among them (Table 3) and present the average ranking change for
different regions (Fig. 3). Overall, all the statistical data, including the minimum, average, and
11 The eastern region includes: Beijing, Tianjin, Hebei, Shanghai, Jiangsu, Zhejiang, Fujian, Shandong,
Guangdong, and Hainan; Central: Shanxi, Anhui, Jiangxi, Henan, Hubei, and Hunan; Western: Inner Mongolia,
Guangxi, Chongqing, Sichuan, Guizhou, Yunnan, Shaanxi, Gansu, Qinghai, Ningxia, and Xinjiang; Northeast:
Liaoning, Jilin and Heilongjiang.

21
quartile of efficiency values, are the highest in the eastern region, followed by the west and the
middle, and the lowest are in the northeast. This suggests that the generation sectors in the eastern
region have the best environmental performance, with the average efficiency of 0.89 and the
maximum value of over 0.9 in that region. Slightly unexpectedly, the performance of the
generation sectors in the western region is better than that in the middle region, and the worst
environmental performance is in the northeastern region. Even the minimum value of the eastern
region is more than the maximum value of the northeastern region.
[Please Insert Table 3 about here]
[Insert Fig. 3 about here]
The differences in the environmental performance of the generation sectors across regions are
closely related to the level of regional economic development. The eastern region was the first to
carry out the process of reform and opening up and now is the most developed area in China. The
economies of the middle and western regions are relatively backward, but the implementation of
the “Rising of Middle China” and “Great Western development” strategies have promoted the
economic development of the middle and western regions and narrowed the gap between them.
The northeastern region, as the old industrial base, relies heavily on the petroleum and coal
industries. In recent years the traditional heavy industries have suffered from serious
overcapacities, and as they are the main power consumers, the economic downtrend is the most
obvious in the northeastern region. This has resulted in the low efficiency of the generation sector
in that region. The developed regions are in the better position to retrofit outdated capacity and
to innovate and install advanced CO2 emission abatement technologies (Bian et al., 2013). For
example, there are 24 ultra-supercritical thermal power units over 1000 MW that were installed by

22
2013, of which 22 are located in Zhejiang, Shandong, Jiangsu, Guangdong, Tianjin, and other
eastern provinces.12
There are 139 thermal power units with an installed capacity of more than
600 MW in the eastern region, 49 in the western region, 42 in the middle region, and only 14 in
the northeastern region.13
This is why the environmental efficiencies of the eastern provinces,
such as Zhejiang and Jiangsu, have improved in recent years. In addition, the proportion of tertiary
industries tends to be relatively large in the developed areas, and since the electricity consumption
of tertiary industries is much less than that of secondary industries, it has only a slight influence on
the generation sector.
Moreover, the generation structure has large effects on the environmental efficiency.
Hydropower, wind power, and other clean energy does not produce carbon emissions, so the areas
where clean energy accounts for a large proportion of the generation structure usually have a
higher environmental efficiency (Bi et al., 2014; Xie et al., 2012). The economic development of
the western region is close to or even lower than that of the middle region, but the overall
efficiency is slightly higher than that of the middle region, which is due to its more optimized
power structure. Because of its special geographic and climatic conditions, the western region is
abundant in water and wind resources, so the proportion of thermal power is relatively low. Taking
Qinghai as an example, more than 70% of the power generated come from hydropower, which is
rare in China where the energy mix is dominated by coal. Thus, the environmental performance of
Qinghai province has ranked first in the country on several occasions. There are 31 hydropower
plants with an installed capacity of more than 1000 MW in the western region, 9 and 10 in eastern
and middle regions, respectively, and only two in the northeast. A similar situation has occurred in
12 See China’s Electric Power Industry Statistics Compiled 2014. 13 See China Electric Power Yearbook 2014.

23
the eastern region; the proportion of thermal power in Jiangsu has declined due to the promotion
of renewable energy and "green power" since the 11th Five-Year Plan period, which has led to a
very high rise in environmental efficiency after 2008.
[Please Insert Fig. 4 about here]
Furthermore, the power supply and demand situation is a crucial factor affecting the
environmental efficiency of the generation sector. In the provinces with excess power generation,
especially in the years with more frequent instances of wind power curtailment, the efficiency is
generally low (Xie et al., 2012). From the ranking of provinces with high wind power curtailment
rates in recent years (Fig. 4), we can see that almost all the provinces are in a declining trend, and
most provinces have fallen significantly. The environmental efficiency values of the
aforementioned provinces were lower than the national average during the same period except for
only a few provinces in the earlier years. Because of the outbreak of the economic crisis in 2008,
China has implemented a four trillion yuan investment plan, which has stimulated power
investment in most of the provinces, especially wind power investment. However, it is hard for
wind power to provide for peak loads or to be used for heating, so the waste is more serious in
winter when wind resources are abundant; at the same time, the economic downturn caused
industrial electricity consumption to decrease. With the increase in supply and decrease in demand,
it has been difficult to absorb the power generated, which explains the decline in efficiency from
2008 for most of the provinces mentioned previously. A province with a power surplus can only
sell its electricity to large enterprises at a very low price or send it to other provinces; as a result,
the power generation sectors of these provinces are at a disadvantage in a competitive market and
their efficiencies and rankings are lower than others. The environmental efficiency changes

24
resulting from the power supply-demand situation are not only reflected at the provincial level but
also at the national level, which is discussed also in Section 4.2.
5.2 Determinants of environmental efficiency
In Section 5.1 we briefly analyzed the reasons behind the environmental efficiency changes
of the generation sectors. Furthermore, in-depth research is warranted to identify the determinants
of environmental performance, thereby enabling us to put forward some targeted improvement
measures. From the aforementioned analysis it can be concluded that the level of economic
development, the generation structure, and the power supply–demand situation may affect the
overall performance of a power generation sector. In addition, the overall performance may be
influenced by the scale of the generation enterprises and the industrial structure. Accordingly,
some relevant variables are introduced in this section and the detailed explanations are as follows.
Generation structure (GS): in the power industry there are large differences in efficiency
among different modes of electricity generation. China has a coal-dominant energy mix on the
whole, but there are obviously differences in the generation structure between different provinces.
This is a major concern in the studies regarding electricity efficiency (Lin and Yang, 2014; Zhou et
al., 2013).
Regional gross domestic product (RGDP): based on the analysis in Section 5.1 and other
research results (Bi et al., 2014; Zhou et al., 2013), the regional economic development,
represented by regional gross domestic product (RGDP) in this paper, can affect the operational
and environmental efficiency of the power industry. In general, the developed regions have more
advantages in R & D and equipment renewal than the less developed regions.

25
Average firm size (AFS): many studies have advocated the unit scale as an indicator of the
plant level (Du and Mao, 2015; Yang and Pollitt, 2009). In terms of the provincial level, Lin and
Yang (2014) proposed industry concentration as a substitute for the average scale of single
enterprises in the electricity industry, and the higher the industry concentration is, the larger the
average scale of single enterprise is. In this study we adopt a similar concept but we name it the
average firm size.
Capacity utilization rate (CUR): considering the oversupply of electricity and the increasing
generation capacity in recent years, it is essential to explore the impact of capacity utilization on
the competitiveness of the generation sector. We propose the capacity utilization rate to indicate
whether the generation capacity is fully utilized, and the higher it is, the less waste there is in the
installed capacity.
Industry structure (IS): the electricity consumption of the primary, secondary, and tertiary
industries are quite different, especially in the secondary industry that includes a lot of enterprises
with high energy consumption. The electricity consumption will affect the electricity absorption at
the provincial level, which is expected to influence the environmental efficiency of the generation
sector.
The detailed definitions and symbols of the regression variables are shown in Table 4. The
data are collected from China’s Electric Power Industry Statistics Compiled, National Bureau of
Statistics, and Macro China Industry Database.14
[Insert Table 4 about here]
In order to unify the dimension, the aforementioned variables are normalized, and we run the
14
http://data.stats.gov.cn/

26
following regression:
, 0 , 1 1 , 2 , 3 , 4 , 5 , ,i t i t i t i t i t i t i t i i tE E GS RGDP AFS CUR IS (9)
According to Eq. (9) this study estimates the determinants of China’s power industry
environmental efficiency in 30 provinces from 2003 to 2013. The results are shown in Table 5.15
The results of the tests are also reported: the results of the Arellano–Bond test indicate that the
error terms are significantly first-order serial correlated at the 1% level but not second-order serial
correlated, which satisfies the hypothesis of SGMM; both the Sargan and Hansen tests accept the
null hypothesis due to the insignificant P-values at the 10% level, demonstrating that the
instrumental variables are valid; the Wald chi-square test confirms the overall significance of the
regression specification.
[Insert Table 5 about here]
As Table 5 shows, the external factors vary among regions, and they do affect the
environmental efficiency of the generation sector. The coefficient of GS is negative at the 1%
level significantly, implying a negative correlation between the environmental efficiency and GS .
Obviously, the environmental efficiency of the generation sector has a strong relationship with its
energy structure, and thermal power contributes to the main CO2 emissions in the power industry;
thus, the environmental efficiency declines with the increase in the proportion of thermal power.
RGDP , AFS , CUR , and IS have positive relationships with E . E increases by 0.166%
as RGDP increases by 1%. The trend of the energy demand, especially the power demand, is
often consistent with the change in GDP. The more developed provinces have a greater energy
demand, so it is more necessary to improve their electricity efficiency to meet the increased
15 See appendix A for the correlation coefficient matrix.
27
demand (Chen et al., 2013). Meanwhile, the demand for environmental quality is relatively high in
the developed provinces, and they have both driving force and abilities to introduce or develop the
advanced technology; provinces with larger AFS usually have a more optimized resource
integration and eliminate outdated power units and launch advanced ones in a timely manner. In
other words, AFS can represent the technical level to some extent. Outdated small thermal
power units are energy inefficient and heavy polluting, so the policy of “developing large units
and suppressing small ones” carried out in the electricity industry is conducive to the improvement
of the environmental performance. As for CUR , the efficiency is higher if the generation capacity
is fully used and less wasted, as expected, and too much capacity may lead to low utilization rates
and over competitiveness in the generation sector. As we can see from Table 5, E increases by
approximately 0.266% as CUR increases by 1%. Surprisingly, the IS , which refers to the
proportion of secondary industry, has a positive role in promoting the efficiency of the generation
sector. This is mainly because China is still in the post-industrialization period, so economic
growth is largely driven by industrial expansion, and the power consumption required for this is
more concentrated in the secondary industry, indicating that the provinces in which the secondary
industry accounted for a higher proportion have scale advantages in electricity consumption and
are more balanced in terms of power supply-demand. The results also show that there is no direct
correlation between the efficiency of the generation sector and the growth of tertiary industry.
GS , AFS , and IS are all of statistical significance at the 1% level, and the coefficients
have slight differences. The E increases by approximately 0.153% and 0.163%, respectively, as
AFS and IS increase by 1%, and decreases by 0.147% as GS increases by 1%. Comparatively
speaking, IS has a greater impact on the environmental efficiency, implying that the efficiency

28
revealed by the game cross-efficiency model is more affected by the power supply situation than
other factors, and a power surplus always detracts from the operations of low-efficiency provinces.
This is because the provinces with excess power generated do not prevail in the increasingly
competitive electricity market. There is no doubt that an appropriate increase in the proportion of
clean energy generation will improve environmental efficiency, but an overreliance on clean
power may damage the stability of the grids and do harm to the development of the economy.
Remarkably, the coefficient of , 1i tE is significantly negative, indicating the negative
relationship between the environmental efficiencies over two adjacent periods. Due to the
constraints of technical bottlenecks and output growth targets, it is difficult to continuously reduce
a great amount of CO2 emissions in a short time, which make improvement of the environmental
efficiency slow and tortuous (Fan et al., 2015). Meanwhile, phased emission reduction targets may
heavily incentivize the local governments to reduce their emissions in the short term; enterprises
do not have any impetus to carry out sustained emission-reduction activities under the existing
policy.
6. Conclusions and policy suggestions
6.1 Conclusions
This study employs a game cross-efficiency model to measure the environmental efficiency
of China's generation sector. The competitiveness among provinces is considered for the period
from 2003 to 2013. Furthermore, it has adopted the SGMM method to eliminate the endogenous
problem among the provincial factors affecting their performance and to analyze the determinants

29
of environmental efficiency. We reach several conclusions as follows.
Our study shows that incorporating game cross-efficiency with SGMM is an effective
approach to measure the environmental efficiency of the generation industry. The game
cross-efficiency results combining self-evaluation with peer-evaluation performed well in terms of
discrimination and objectiveness. The number of efficient DMUs decreased significantly and the
competitiveness is reflected in the results. In contrast to other regression models, the SGMM may
eliminate the influence of endogenous factors on efficiency. It is foreseeable to indicate that the
competitiveness in the generation sector will be strengthened with the deepening of reforms, and
this approach may gain popularity in not only the generation sector but also the transmission and
distribution sectors.
Even though the efficiency gaps among regions decrease, it is hard to achieve simultaneous
nationwide improvement of environmental efficiency. There is a relatively large amount of room
to promote the efficiency of China’s generation industry. The average environmental efficiencies
were less than 0.88 during 2003–2011; some efficiencies were even lower than 0.6, and there are
abnormal efficiencies below the average during 2011–2013. In addition, the performance of the
generation sector is heavily dependent on the power supply situation. A power shortage always
leads to a smaller gap, whereas a power surplus always makes the operation of low efficiency
provinces worse.
Our results suggest that RGDP , AFS , CUR , and IS are conducive to improving the
environmental efficiency significantly, whereas GS is negatively related to the efficiency. The
power consumption is determined by RGDP and IS to a great extent, which are the main drivers
beyond the power system control for efficiency improvement. The AFS is an important indicator

30
for technology, while CUR reflects the utilization rate of equipment, and these are also driving
forces for performance improvement that the industry may adopt measures to improve. In addition,
the development of clean energy may improve the environmental efficiency of the generation
sector due to its significant contribution in reducing emissions.
6.2 Policy Implications
Based on the aforementioned analysis, we suggest the following measures to improve the
environmental efficiency of the generation sectors.
First, it is urgent to adjust the efficiency evaluation mechanism to improve the environmental
performance of the generation industry. Comparatively, both power system development,
energy-saving, and emissions reduction are long term tasks. It is not advisable to adopt all possible
measures to achieve the goals at the cost of sustainable development. A well-designed power
management mechanism taking long-term and short-term factors as well as regional differences
into consideration may help to achieve the sound development of the generation sector. For the
middle and western areas of underdeveloped economies, favorable policies for investment, as well
as subsidies, are effective measures to accelerate the development of green power, which in turn
may narrow the differences in environmental performance for the generation sectors.
Second, the power mix should be adjusted in step with the technology and local economic
development. The improvement of the generation structure cannot be simplified to monotonically
decrease the thermal power ratio – a balanced and coordinated power system with multiple
generation forms could not only fulfill the power demands but also achieve environmental
efficiency improvement. There is no doubt that it is important to control the thermal power ratio

31
within a reasonable range for newly installed capacity. Of course, this does not mean that the
green power ratio in the power mix should be randomly increased. The incentive policies for clean
energy should be weakened in the power-exporting regions and strengthened in the
power-importing provinces.
Finally, innovation is an effective measure to improve the environmental efficiency of the
generation sector. The average firm size is the main driving factor analyzed in SGMM that the
power industry may be able to improve by its own efforts. The introduction of supercritical and
ultra-supercritical technologies has resulted in an increase of the average firm size in the thermal
power industry and has changed the generation sector fundamentally. On the other hand, stability
is one of the main obstacles hindering clean power development. In general, incentive policies for
research & development may have better effects than subsidies from a long-term perspective.
However, there are also several aspects needing to be improved. For example, this study has
not included other pollutants, such as SO2 and NOx, in examining the environmental efficiency of
the power industry. In addition, we conducted the analysis with the provincial data rather than the
plant level data, which is the actual operator of the generation sectors. Furthermore, the study has
not examined the dynamic efficiency of the power industry. These issues will be studied in future
research.
Acknowledgments
This work is financially supported by the National Natural Science Foundation of China under
grant Nos. 71373172, 71271147, 71431005 and 71373055, the Humanities and Social Science

32
Planning Fund Project of Ministry of Education under grant No. 15YJA790091 and the Ministry
of Housing and Urban-rural Development of China under grant No.11-R1-338.
Appendix A
Table A1.
[Insert Table A1 about here]
References
Adler, N., Friedman, L., Sinuany-Stern, Z., 2002. Review of ranking methods in the data
envelopment analysis context. European Journal of Operational Research 140, 249-265.
Arabi, B., Munisamy, S., Emrouznejad, A., Shadman, F., 2014. Power industry restructuring and
eco-efficiency changes: A new slacks-based model in Malmquist–Luenberger Index measurement.
Energy Policy 68, 132-145.
Arellano, M., Bond, S., 1991. Some tests of specification for panel data: Monte Carlo evidence
and an application to employment equations. Review of Economic studies 58, 277-297.
Arellano, M., Bover, O., 1995. Another look at the instrumental variable estimation of
error-component models. Journal of Econometrics 68, 29-51.
Bi, G.-B., Song, W., Zhou, P., Liang, L., 2014. Does environmental regulation affect energy
efficiency in China's thermal power generation? Empirical evidence from a slacks-based DEA
model. Energy Policy 66, 537-546.
Bian, Y.-W., He, P., Xu, H., 2013. Estimation of potential energy saving and carbon dioxide
emission reduction in China based on an extended non-radial DEA approach. Energy Policy 63,
962-971.
Blundell, R., Bond, S., 1998. Initial conditions and moment restrictions in dynamic panel data
models. Journal of Econometrics 87, 115-143.
Chen, S.-Y., Golley, J., 2014. ‘Green’ productivity growth in China's industrial economy. Energy
Economics 44, 89-98.
Chen, T.-Y., Yeh, T.-L., Lee, Y.-T., 2013. Comparison of Power Plants Efficiency among 73
Countries. Journal of Energy 2013, 1-8.
Cook, W.D., Seiford, L.M., 2009. Data envelopment analysis (DEA) – Thirty years on. European
Journal of Operational Research 192, 1-17.
Doyle, J., Green, R., 1994. Efficiency and cross-efficiency in DEA Derivations meanings and uses.
The Journal of the Operational Research Society 45, 567-578.
Du, L.-M., He, Y.-N., Yan, J.-Y., 2013. The effects of electricity reforms on productivity and

33
efficiency of China's fossil-fired power plants: An empirical analysis. Energy Economics 40,
804-812.
Du, L.-M., Mao, J., 2015. Estimating the environmental efficiency and marginal CO2 abatement
cost of coal-fired power plants in China. Energy Policy 85, 347-356.
Duan, N., Guo, J.-P., Xie, B.-C., 2016. Is there a difference between the energy and CO2 emission
performance for China’s thermal power industry? A bootstrapped directional distance function
approach. Applied Energy 162, 1552-1563.
Ewertowska, A., Galán-Martín, A., Guillén-Gosálbez, G., Gavaldá, J., Jiménez, L., 2016.
Assessment of the environmental efficiency of the electricity mix of the top European economies
via data envelopment analysis. Journal of Cleaner Production 116, 13-22.
Färe, R., Grosskopf, S., Tyteca, D., 1996. An activity analysis model of the environmental
performance of firms — application to fossil-fuel-fired electric utilities. Ecological Economics 18,
161-175.
Fan, M.-T., Shao, S., Yang, L.-L., 2015. Combining global Malmquist–Luenberger index and
generalized method of moments to investigate industrial total factor CO2 emission performance: A
case of Shanghai (China). Energy Policy 79, 189-201.
Fleishman, R., Alexander, R., Bretschneider, S., Popp, D., 2009. Does regulation stimulate
productivity? The effect of air quality policies on the efficiency of US power plants. Energy Policy
37, 4574-4582.
Ghosh, R., Kathuria, V., 2016. The effect of regulatory governance on efficiency of thermal power
generation in India: A stochastic frontier analysis. Energy Policy 89, 11-24.
Hansen, L.P., 1982. Large sample properties of generalized method of moments estimators.
Econometrica 50, 1029–1054.
IPCC, 2006. 2006 IPCC Guidelines for National Grennhouse Gas Inventories, in: Eggleston, S.,
Buendia, L., Miwa, K., Ngara, T., Tanabe, K. (Eds.). Institute for Global Environmental Srategies,
Japan.
Korhonen, P.J., Luptacik, M., 2004. Eco-efficiency analysis of power plants: An extension of data
envelopment analysis. European Journal of Operational Research 154, 437-446.
Liang, L., Wu, J., Cook, W.D., Zhu, J., 2008. The DEA Game Cross-Efficiency Model and Its
Nash Equilibrium. Operations Research 56, 1278-1288.
Lin, B.-Q., Yang, L.-S., 2014. Efficiency effect of changing investment structure on China׳s power
industry. Renewable and Sustainable Energy Reviews 39, 403-411.
Liu, J.S., Lu, L.Y.Y., Lu, W.-M., Lin, B.J.Y., 2013. A survey of DEA applications. Omega 41,
893-902.
Liu, X.-H., Chu, J.-F., Yin, P.-Z., Sun, J.-S., 2017. DEA cross-efficiency evaluation considering
undesirable output and ranking priority: a case study of eco-efficiency analysis of coal-fired power
plants. Journal of Cleaner Production 142, 877-885.
Meng, M., Mander, S., Zhao, X.-L., Niu, D.-X., 2016. Have market-oriented reforms improved the
electricity generation efficiency of China's thermal power industry? An empirical analysis. Energy
114, 734-741.
Mou, D.-G., 2014. Understanding China’s electricity market reform from the perspective of the
coal-fired power disparity. Energy Policy 74, 224-234.
Nakano, M., Managi, S., 2008. Regulatory reforms and productivity: An empirical analysis of the
Japanese electricity industry. Energy Policy 36, 201-209.

34
Roboredo, M.C., Aizemberg, L., Meza, L.A., 2015. The DEA Game Cross Efficiency Model
Applied to the Brazilian Football Championship. Procedia Computer Science 55, 758-763.
Roodman, D., 2006. How to do xtabond2: An Introduction to difference and system GMM in Stata.
Stata Journal 9, 86-136.
Rudnick, H., Barroso, L.A., Skerk, C., Blanco, A., 2005. South American reform lessons - twenty
years of restructuring and reform in Argentina, Brazil, and Chile. IEEE Power and Energy
Magazine 3, 49-59.
Sargan, J.D., 1958. The estimation of economic relationships using instrumental variables.
Econometrica 26, 393-415.
Scheel, H., 2001. Undesirable outputs in efficiency valuations. European Journal of Operational
Research 132, 400-410.
Sexton, T.R., Silkman, R.H., Hogan, A.J., 1986. Data envelopment analysis: critique and
extensions. New Directions for Program Evaluation 1986, 73-105.
Stagliano, V., 1997. Restructuring, the New England way. Electricity Journal 10, 21-27.
Sueyoshi, T., Goto, M., 2011. DEA approach for unified efficiency measurement: Assessment of
Japanese fossil fuel power generation. Energy Economics 33, 292-303.
Sueyoshi, T., Yuan, Y., Goto, M., 2017. A literature study for DEA applied to energy and
environment. Energy Economics 62, 104-124.
Wiser, R., Pickle, S., Goldman, C., 1998. Renewable energy policy and electricity restructuring: a
California case study. Energy Policy 26, 465–475.
Woo, C., Chung, Y., Chun, D., Seo, H., Hong, S., 2015. The static and dynamic environmental
efficiency of renewable energy: A Malmquist index analysis of OECD countries. Renewable and
Sustainable Energy Reviews 47, 367-376.
Wu, J., Liang, L., Chen, Y., 2009. DEA game cross-efficiency approach to Olympic rankings.
Omega 37, 909-918.
Xie, B.-C., Fan, Y., Qu, Q.-Q., 2012. Does generation form influence environmental efficiency
performance? An analysis of China’s power system. Applied Energy 96, 261-271.
Xie, B.-C., Shang, L.-F., Yang, S.-B., Yi, B.-W., 2014. Dynamic environmental efficiency
evaluation of electric power industries: Evidence from OECD (Organization for Economic
Cooperation and Development) and BRIC (Brazil, Russia, India and China) countries. Energy 74,
147-157.
Yan, Q.-Y., Zhang, Q., Zou, X., 2016. Decomposition analysis of carbon dioxide emissions in
China's regional thermal electricity generation, 2000–2020. Energy 112, 788-794.
Yang, H.-L., Pollitt, M., 2009. Incorporating both undesirable outputs and uncontrollable variables
into DEA: The performance of Chinese coal-fired power plants. European Journal of Operational
Research 197, 1095-1105.
Yang, L.-S., Lin, B.-Q., 2016. Carbon dioxide-emission in China׳s power industry: Evidence and
policy implications. Renewable and Sustainable Energy Reviews 60, 258-267.
Zhang, Y.-J., Peng, Y.-L., Ma, C.-Q., Shen, B., 2017. Can environmental innovation facilitate
carbon emissions reduction? Evidence from China. Energy Policy 100, 18-28.
Zhang, Z.X., 2017. Are China's climate commitments in a post-Paris agreement sufficiently
ambitious? Wiley Interdisciplinary Reviews: Climate Change 8.
Zhao, X.-L., Ma, C.-B., 2013. Deregulation, vertical unbundling and the performance of China's
large coal-fired power plants. Energy Economics 40, 474-483.

35
Zhao, X.-L., Yang, R., Ma, Q., 2014. China's total factor energy efficiency of provincial industrial
sectors. Energy 65, 52-61.
Zhao, X.-L., Yin, H.-T., Zhao, Y., 2015. Impact of environmental regulations on the efficiency and
CO2 emissions of power plants in China. Applied Energy 149, 238-247.
Zhou, P., Ang, B.W., 2008. Linear programming models for measuring economy-wide energy
efficiency performance. Energy Policy 36, 2911-2916.
Zhou, P., Ang, B.W., Poh, K.L., 2008. A survey of data envelopment analysis in energy and
environmental studies. European Journal of Operational Research 189, 1-18.
Zhou, Y., Xing, X.-P., Fang, K.-N., Liang, D.-P., Xu, C.-L., 2013. Environmental efficiency
analysis of power industry in China based on an entropy SBM model. Energy Policy 57, 68-75.

36
Fig. 1 Statistic properties of environmental efficiency in China’s generation sector from 2003
to 2013
Note: The box-chart gives the median, first quartile (x0.25) and third quartile (x0.75) of the data
by using the lines in a box in Fig. 1. The interquartile rage (IQR) is calculated by subtracting the
first quartile from the third quartile (x0.75 - x0.25). The smallest, largest and the average values
line inside the figure with symbols.
.6.7
.8.9
1
En
viro
nm
enta
l E
ffic
iency
2003 2004 2005 2006 2007 2008 2009 2010 2011 2012 2013
37
Fig. 2 The average environmental efficiencies of all provinces
Fig. 3 The average ranking of regions
0,75
0,8
0,85
0,9
0,95
1
2 0 0 3 2 0 0 4 2 0 0 5 2 0 0 6 2 0 0 7 2 0 0 8 2 0 0 9 2 0 1 0 2 0 1 1 2 0 1 2 2 0 1 3
EN
VIR
ON
ME
NT
AL
EF
FIC
IEN
CY
YEAR
0
5
10
15
20
25
30
35
2003 2004 2005 2006 2007 2008 2009 2010 2011 2012 2013
Ran
kin
g
Northeast East West Central

38
Fig. 4 The ranking of provinces with high wind power curtailment rate
0
5
10
15
20
25
30
35
2003 2004 2005 2006 2007 2008 2009 2010 2011 2012 2013
Ran
kin
g
Hebei InnerMongolia Liaoning Gansu
Xinjiang Jilin Heilongjiang

39
Table 1 Summary statistics of inputs and outputs
Variable Units Max Min S.D. Mean
Labor P 120395 3020.25 24075.77 34831.89
Installed capacity 104 kW 8598 175.96 1918.604 2661.684
Energy 104 tce 14802.01 142.229 2942.126 3544.792
Power generation 102 MkW h 4405 59.42 880.8375 1185.744
CO2 104 t 39711.12 381.7948 7635.239 9242.663

40
Table 2 Efficiency and ranking of provinces 2003-2013
Province Efficiency (Year) Ranking
2003 2004 2005 2006 2007 2008 2009 2010 2011 2012 2013 Mean Max Min
Beijing 0.777 0.735 0.782 0.78 0.858 0.851 0.835 0.847 0.867 0.814 0.919 20.5 27 13
Tianjin 0.999 0.993 1.000 0.968 0.999 0.965 0.805 0.910 0.940 0.907 0.947 7.1 23 1
Hebei 0.909 0.957 0.935 0.899 0.913 0.878 0.847 0.859 0.841 0.84 0.840 13.7 22 6
Shanghai 0.971 0.977 0.946 0.914 0.943 0.937 0.961 0.972 0.991 0.961 0.924 6 12 2
Jiangsu 0.940 0.954 0.872 0.894 0.957 1.000 1.000 1.000 1.000 1.000 1.000 4.6 11 1
Zhejiang 0.870 0.770 0.785 0.805 0.864 0.870 0.902 0.966 0.954 0.965 0.997 12.6 26 2
Fujian 0.884 0.808 0.906 0.919 0.939 0.908 0.871 0.906 0.925 0.902 0.929 11.6 19 8
Shandong 0.759 0.827 0.845 0.823 0.854 0.881 0.883 0.876 0.823 0.803 0.883 18.5 24 12
Guangdong 0.935 0.859 0.902 0.929 0.941 0.935 0.916 0.945 0.982 0.914 0.883 9.2 17 3
Hainan 0.670 0.639 0.741 0.724 0.801 0.866 0.794 0.858 0.892 0.854 0.958 21.4 30 6
InnerMongolia 0.819 0.880 0.850 0.789 0.786 0.780 0.776 0.750 0.720 0.763 0.807 23.7 28 13
Guangxi 0.964 0.755 0.816 0.878 0.797 0.852 0.866 0.927 0.876 0.836 0.887 16.5 25 4
Chongqing 0.806 0.87 0.857 0.770 0.819 0.804 0.810 0.854 0.818 0.810 0.809 21.5 26 15
Sichuan 0.872 0.875 0.904 0.870 0.855 0.825 0.875 0.944 0.974 0.885 0.982 11.9 22 3
Guizhou 0.870 0.922 0.880 0.877 0.951 0.944 0.968 0.862 0.824 0.899 0.874 12.5 21 3
Yunnan 0.861 0.998 0.910 0.845 0.857 0.899 0.870 0.923 0.936 0.903 0.976 10.7 17 1
Shaanxi 0.806 0.899 0.840 0.838 0.792 0.768 0.747 0.805 0.904 0.883 0.888 19.5 27 12
Gansu 0.859 0.952 0.987 0.987 0.999 0.971 0.890 0.903 0.863 0.806 0.817 11.3 24 2
Qinghai 0.787 0.763 0.906 1.000 0.990 0.990 0.968 0.983 0.966 0.983 0.972 7.5 23 1
Ningxia 0.999 0.996 0.979 1.000 0.998 0.986 0.905 0.844 0.919 0.921 0.950 6.2 21 1
Xinjiang 0.722 0.766 0.829 0.824 0.847 0.868 0.822 0.825 0.819 0.785 0.813 21.9 26 17

41
Province Efficiency(Year) Ranking
2003 2004 2005 2006 2007 2008 2009 2010 2011 2012 2013 Mean Max Min
Shanxi 0.944 0.931 0.935 0.940 0.950 0.919 0.894 0.896 0.851 0.875 0.871 11.3 21 5
Anhui 0.896 0.982 0.884 0.853 0.827 0.835 0.911 0.930 0.975 0.918 0.935 10.7 21 4
Jiangxi 0.710 0.713 0.754 0.818 0.738 0.759 0.707 0.743 0.817 0.818 0.871 25.5 29 19
Henan 0.791 0.762 0.798 0.789 0.801 0.819 0.826 0.813 0.852 0.809 0.875 21.8 24 18
Hubei 0.856 0.934 0.996 0.983 0.961 0.994 0.991 0.985 0.955 0.917 0.936 5.9 16 2
Hunan 0.727 0.802 0.868 0.818 0.792 0.765 0.781 0.804 0.800 0.760 0.839 23.8 27 16
Liaoning 0.829 0.845 0.867 0.888 0.877 0.918 0.840 0.763 0.743 0.729 0.767 19.5 28 11
Jilin 0.624 0.693 0.728 0.711 0.732 0.726 0.656 0.659 0.612 0.580 0.647 29.8 30 29
Heilongjiang 0.673 0.719 0.793 0.759 0.754 0.757 0.655 0.681 0.702 0.622 0.718 28.3 30 25

42
Table 3 Average efficiencies and ranking for regions 2003-2013
Region Min 1st Qu. Middle Mean 3rd Qu. Max
N E R E R E R E R E R E R
East 0.852 10.6 0.871 11.1 0.896 11.9 0.892 12.5 0.911 13.9 0.928 15.1 11
West 0.851 13.3 0.869 14.4 0.879 15 0.875 14.8 0.881 15.4 0.889 15.8 11
Middle 0.821 14.8 0.849 15.7 0.854 16.5 0.857 16.5 0.87 17 0.888 18.5 11
Northeast 0.644 23.3 0.705 23.8 0.717 25 0.735 25.8 0.787 28.5 0.8 29 11
Note: E denotes environmental efficiency and R denotes ranking.
Table 4 Definition of regression variables
Variables Symbols Unit Definition
Environmental
efficiency E
gained from game
cross-efficiency model
Generation structure GS %
thermal power
generation/total power
generation
Region gross domestic
product RGDP 10
2 Million Yuan
region gross domestic
product of each
province
Average firm size AFS 103 Yuan
total fixed-asset
investment/ number of
enterprises
Capacity utilization
rate CUR h/10MW
total generation time/
total installed capacity
Industry structure IS %
the value-added of the
second industry / total
value-added of
industry

43
Table 5 Dynamic panel-data estimation, two-step system GMM
Dependent variables E
Coef. Std. Err.
E_lag1 -0 .602*** 0 .083
GS -0 147*** 0 .046
RGDP 0.166* 0.086
AFS 0 .153*** 0 .058
CUR 0.266** 0 .133
IS 0.163*** 0.061
Constant 1.283*** 0. 102
Diagnostic tests Statistic p value
AR(1) test 2.76 0.006
AR(2) test -1.23 0.220
Wald test 100.93 0.000
Sargan test 2.63 0.268
Hansen test 0.42 0.811
Note: * Denotes statistical significance at the 10% level.
** Denotes statistical significance at the 5% level.
*** Denotes statistical significance at the 1% level.
Table A1 Correlation coefficients among independent variables in Eq.(9)
Variable GS RGDP CUR AFS IS
GS 1.0000
RGDP 0.1660 1.0000
CUR 0.1374 -0.4882 1.0000
AFS 0.1206 0.2355 -0.1853 1.0000
IS 0.1221 0.2811 -0.5269 0.0144 1.0000

č


![Factors tht affect recruitment[ppt]](https://static.documents.pub/doc/80x56/54541a88b1af9f84228b493f/factors-tht-affect-recruitmentppt.jpg)


