35
WHATEVER THE CHALLENGE CPC ANNUAL REPORT 2009

32 H Mourad St., Giza P.O. Box 42 Giza, Egypt
Tel: +(202) 3570 7739 - 3570 7694 Fax: +(202) 3570 7716
www.cpg.com.eg
WH
ATE
VE
R T
HE
CH
ALL
EN
GE
C
PC
AN
NU
AL
RE
PO
RT
2009

Concept and Design Designframe corp www.designframe.netPrinting RAIDY
Overview 1 Highlights 10 Chairman’s Statement 22 Board of Directors 24 Executive Management 26 Financial Review 28

During times of global financial turmoil, any industry can expect to struggle.
Those who have what it takes will not only survive but also thrive.

When one business line is adversely affected, with diversification and strategic integration
we are assured others will fill their gaps.

When strategies and versatility work together we are able to better manage
changing market demands.

When our more than 30-year track record of overcoming challenges is coupled with a magnitude of operational resources

ONLY THEN WE CAN CLAIM THAT WE WILL sTanD soliD
IN ANY TURBULENCE

Having strength in assets enables us to produce more for further growth. We will continue to grow annually.
1999 our total LTA was EGP 330 Million.
2000 we increased our LTA by 5%.
2001 we increased our LTA by 4%.
2002 we increased our LTA by 11% compared to 2001.
2004 we started to grow again and take wider steps with almost 13% increase in LTA.
2005 we had a slow down in growth with only 4% increase in LTA.
330347361402432
1,024
487504893
1,1 341,293
2008 we had a 11% increase compared to 2007.
2009 we had a 14% increase compared to 2008.
2007 we continued growing our LTA by 15%.
Growth in long-Term assets
2003 we increased our LTA by 8%.
2006 our Long-Term Assets received a massive increase of 77%.
1110
1312
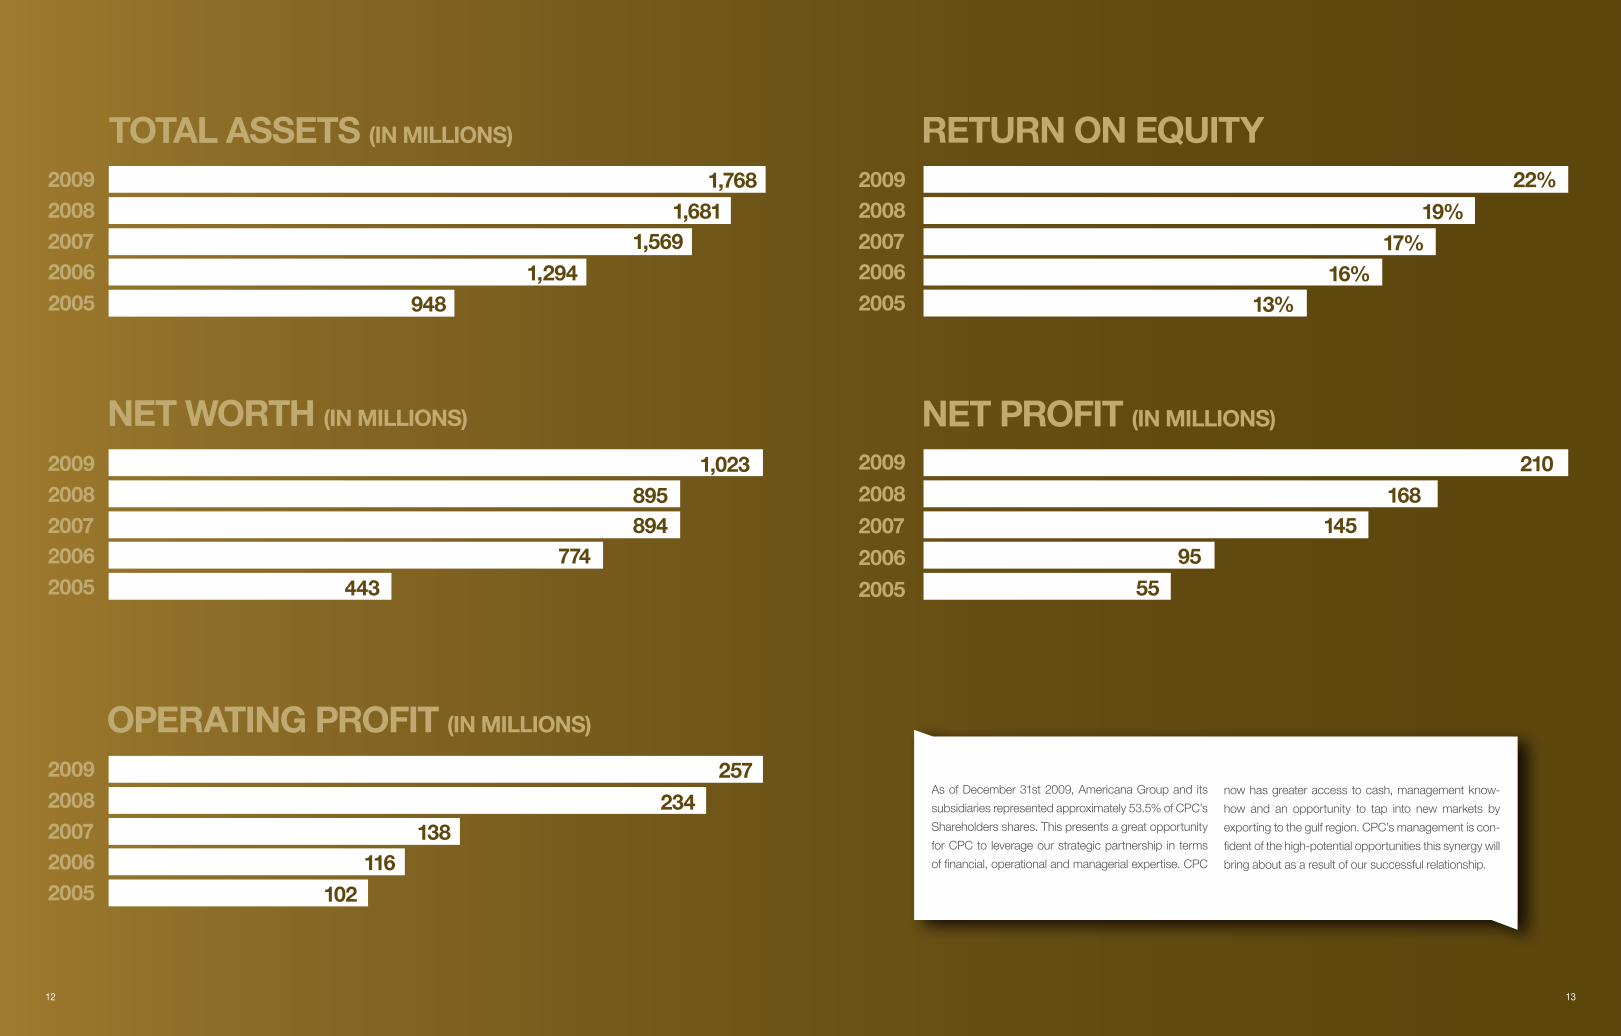
ToTal asseTs (in millions) reTurn on equiTy
As of December 31st 2009, Americana Group and its
subsidiaries represented approximately 53.5% of CPC’s
Shareholders shares. This presents a great opportunity
for CPC to leverage our strategic partnership in terms
of financial, operational and managerial expertise. CPC
now has greater access to cash, management know-
how and an opportunity to tap into new markets by
exporting to the gulf region. CPC’s management is con-
fident of the high-potential opportunities this synergy will
bring about as a result of our successful relationship.
2009
948
2009
2006
1,681
20062007 1,569 20072008
1,294
2008
2005
1,768
2005
oPeraTinG ProFiT (in millions)
2009
200620072008
2005
neT WorTh (in millions)
2005
1,023
2006
8952007 8942008
774
2009
443
neT ProFiT (in millions)
2009
2008
2007
2006
2005
210168
14595
55
257
234138
116102
13%
19%17%
16%
22%

15
ToTal accumulaTeD ProFiT over The lasT 10 years
920,185,000eGP
cPc had a good year during such global financial turmoil and we are
even more confident about our future.
14
1716
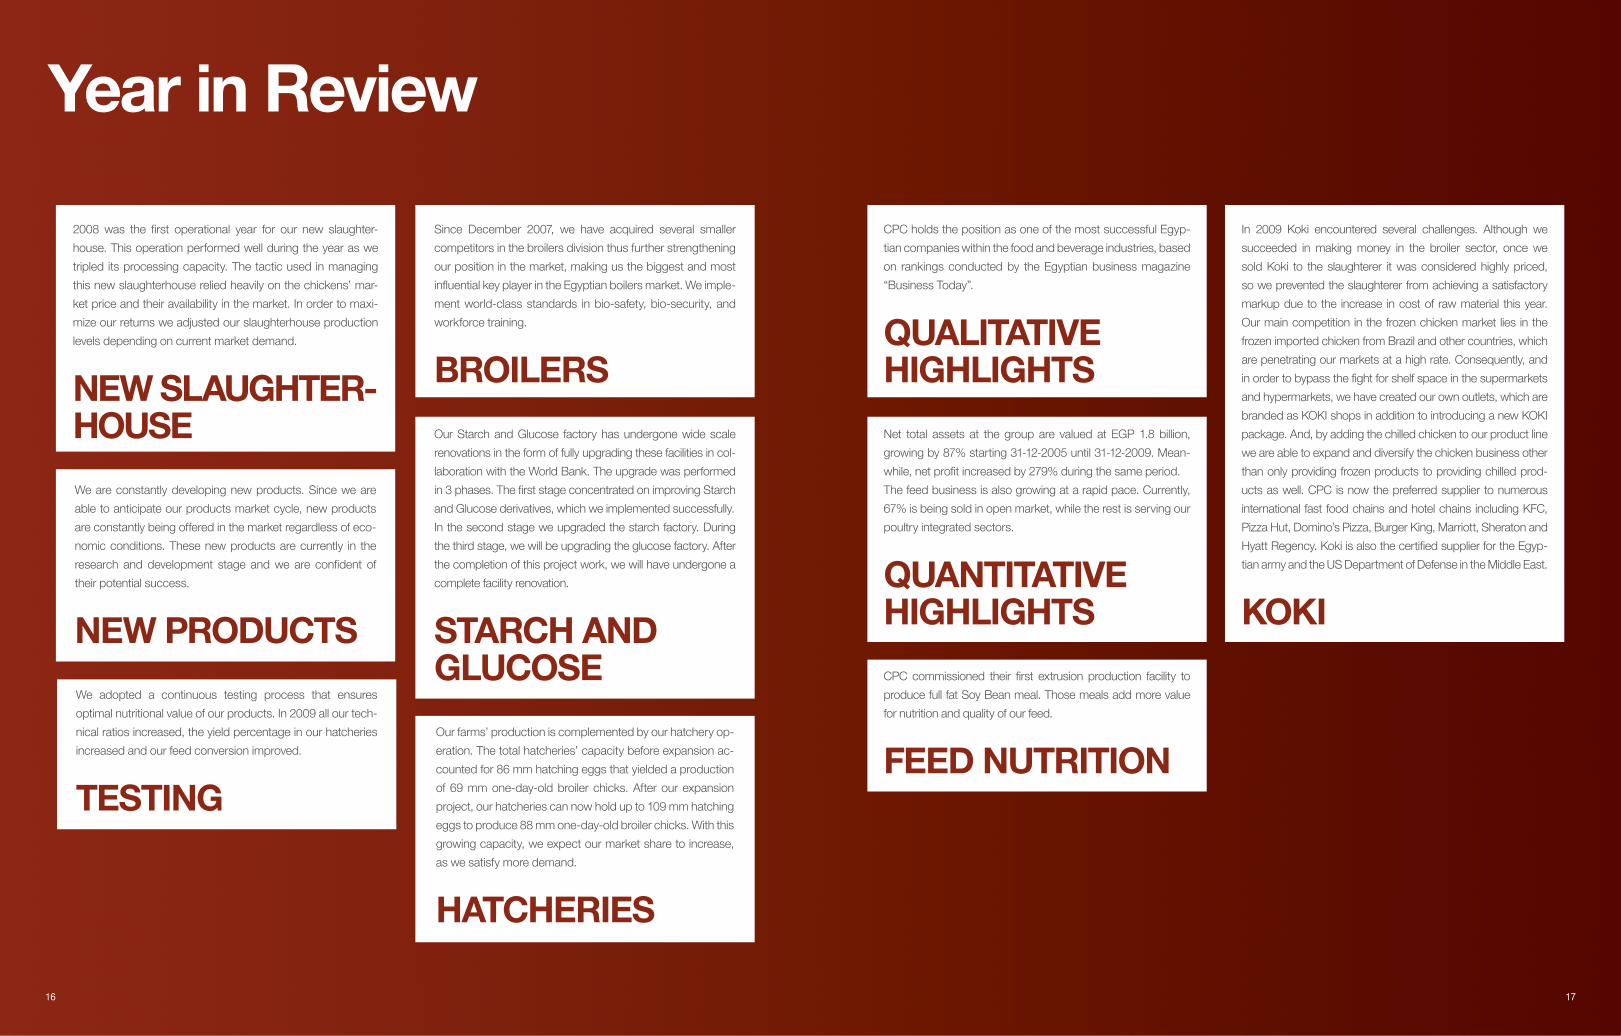
year in review
In 2009 Koki encountered several challenges. Although we
succeeded in making money in the broiler sector, once we
sold Koki to the slaughterer it was considered highly priced,
so we prevented the slaughterer from achieving a satisfactory
markup due to the increase in cost of raw material this year.
Our main competition in the frozen chicken market lies in the
frozen imported chicken from Brazil and other countries, which
are penetrating our markets at a high rate. Consequently, and
in order to bypass the fight for shelf space in the supermarkets
and hypermarkets, we have created our own outlets, which are
branded as KOKI shops in addition to introducing a new KOKI
package. And, by adding the chilled chicken to our product line
we are able to expand and diversify the chicken business other
than only providing frozen products to providing chilled prod-
ucts as well. CPC is now the preferred supplier to numerous
international fast food chains and hotel chains including KFC,
Pizza Hut, Domino’s Pizza, Burger King, Marriott, Sheraton and
Hyatt Regency. Koki is also the certified supplier for the Egyp-
tian army and the US Department of Defense in the Middle East.
KoKi
CPC holds the position as one of the most successful Egyp-
tian companies within the food and beverage industries, based
on rankings conducted by the Egyptian business magazine
“Business Today”.
qualiTaTive hiGhliGhTs
Net total assets at the group are valued at EGP 1.8 billion,
growing by 87% starting 31-12-2005 until 31-12-2009. Mean-
while, net profit increased by 279% during the same period.
The feed business is also growing at a rapid pace. Currently,
67% is being sold in open market, while the rest is serving our
poultry integrated sectors.
quanTiTaTive hiGhliGhTs
CPC commissioned their first extrusion production facility to
produce full fat Soy Bean meal. Those meals add more value
for nutrition and quality of our feed.
FeeD nuTriTion
Since December 2007, we have acquired several smaller
competitors in the broilers division thus further strengthening
our position in the market, making us the biggest and most
influential key player in the Egyptian boilers market. We imple-
ment world-class standards in bio-safety, bio-security, and
workforce training.
Broilers
Our farms’ production is complemented by our hatchery op-
eration. The total hatcheries’ capacity before expansion ac-
counted for 86 mm hatching eggs that yielded a production
of 69 mm one-day-old broiler chicks. After our expansion
project, our hatcheries can now hold up to 109 mm hatching
eggs to produce 88 mm one-day-old broiler chicks. With this
growing capacity, we expect our market share to increase,
as we satisfy more demand.
haTcheries
Our Starch and Glucose factory has undergone wide scale
renovations in the form of fully upgrading these facilities in col-
laboration with the World Bank. The upgrade was performed
in 3 phases. The first stage concentrated on improving Starch
and Glucose derivatives, which we implemented successfully.
In the second stage we upgraded the starch factory. During
the third stage, we will be upgrading the glucose factory. After
the completion of this project work, we will have undergone a
complete facility renovation.
sTarch anD Glucose
2008 was the first operational year for our new slaughter-
house. This operation performed well during the year as we
tripled its processing capacity. The tactic used in managing
this new slaughterhouse relied heavily on the chickens’ mar-
ket price and their availability in the market. In order to maxi-
mize our returns we adjusted our slaughterhouse production
levels depending on current market demand.
neW slauGhTer-house
We are constantly developing new products. Since we are
able to anticipate our products market cycle, new products
are constantly being offered in the market regardless of eco-
nomic conditions. These new products are currently in the
research and development stage and we are confident of
their potential success.
neW ProDucTs
We adopted a continuous testing process that ensures
optimal nutritional value of our products. In 2009 all our tech-
nical ratios increased, the yield percentage in our hatcheries
increased and our feed conversion improved.
TesTinG

inTernal saFeGuarDinGCORPORATE GOvERNANCE
Good corporate governance is the key to a company’s
success. It involves a corporation’s commitment to op-
erating with a strict code of conduct. CPC’s corporate
governance ensures that we are operating with a high
level of integrity.
We adopt policies that emphasize accountability,
fairness and transparency.
This is reflected in having the majority of our board
members as non-executive committee members,
and informing an audit committee that supports the
board in fulfilling its role. The audit committee abides
by a set of policies that represent CPC’s Audit Com-
mittee Charter, one which the committee reviews and
assesses annually.
The audit committee is empowered with the authority
to conduct or authorize investigations into any matters
within its scope of responsibilities. These responsibili-
ties entail reviewing significant accounting and reporting
issues and examine their impact on the financial state-
ments, overseeing the internal and external audit proc-
esses - ensuring that efforts are coordinated and audit
resources are utilized effectively -, verifying company’s
compliance with laws and regulations, as well as other
reporting responsibilities.
In addition to our ongoing concern to increase sharehold-
ers’ value and equity, we commit ourselves to building,
developing and enriching the community where we op-
erate. CPC takes an active role in positively contributing
to the local community by undertaking several initiatives
which aim to improve the community’s well-being and
social welfare. An example of this is El-Saff area located
on the eastern side of the Nile river bank. El-Saff was an
unprivileged area with minimal employment opportunities.
CPC’s newly established operations facilities have re-
vived the economic and industrial development of that
area, offering job opportunities for its residents.
We also work with social institutions such as
orphanages. We offer them many benefits, encourage
them to work in teams and to develop their skills. We col-
laborate with them to produce the uniforms of our work-
ers and employees in laboratories, factories and farms.
Further, CPC has a wide range of educational pro-
grams offering summer training, PHD degree and Mas-
ter’s degree programs and scholarships. Other initiatives
include assisting the Ministry of Agriculture, allowing
them to use CPC’s faculties and farms and finance the
Research & Development activities and projects. We
also collaborate with the Egyptian Ministry of Agriculture
to develop testing farms. CPC plans to continuously
pursue its goal in community development.
aDDinG value To our communiTyCORPORATE SOCIAL RESPONSIBILITY
18 19

21
for the freshest chicken from Koki Shop
Koki shops distribute fresh not frozen chicken, making CPC a pioneer in selling fresh chicken. The product is then processed and sent to the market to guarantee its freshness and nutritional value. There are currently 18 Koki shop outlets, 2 of which are located inside the slaughterhouses in Nobareya & 10th of Ramadan, 15 outlets in Cairo and 1 outlet in Marina, Northern coast for the summer season.
19585Call
20

23
excellence is within our reach, but perfection is still to come; this will need tools that we have and others
that we still have to acquire through hard work.
We aspire that CPC will be able to gain inter-
national recognition and accreditation and fare
about in new orbits higher than the present do-
mestic markets in which we excel many of our
competitors. “I aspire to witness CPC brand
name as a super brand in many countries in Eu-
rope, Middle East and Africa.”
First, I would like to congratulate all of the CPC
family members for their exceptional work and
excellent results they achieved in fiscal year 2009;
because of the hard work and professional man-
agement, CPC has started to reap the benefits of
the managerial and logistic support from its part-
ners and main shareholders’ (AMERICANA). This
was clearly reflected in the remarkable increase in
benefits of last year.
chairman’s statement

2524
Dr. Hans NagelBoard
Member
>>
Mr. Sayed Nassef Board
Member
>>
Mr. Adel Al-AlfiBoard
Member
>>
Mr. Ayman Laz
Board Member
>>
Mr. Ahmed Al Khayat
Vice Chairman & Managing
Director
>>
Eng. Tarek Tawfik
Managing Director
>>
Mr. Moataz Al-AlfiBoard
Member
>>
Professor Mamdouh SharafeldinChairman
>>
Mr.Mahmoud
Al Affifi Board
Member
>>
Board of Directors

2726
Dr. Nabil DarwishGrandparent Division
Managing Director
Mr. Mostafa RashedCairo Poultry
Processing Division Chairman
Mr. Mohamed TahaChief Financial
Officer
Mr. Bas Zuidberg Supply Chain Officer
Dr. Fernando Parra Technical Director
Mr. Ayman RoushdyHR Director
Eng. Basem Aboul Wafa
Projects Director
Mr. Ahmed Al Khayat Vice Chairman &
Managing Director
Eng. Tarek TawfikManaging Director
Mr. Hazem ZayedAsst. Managing
Director – Corporate Finance & Business
Development
Mr. Adel Al-AlfiGeneral Manager
>> >>
>>
>>
>>
>>
>> >>
>>
>>
>>
executive management
2928
auditor’s report
To the shareholders of cairo Poultry company “an egyptian joint stock company”
report on the Financial statements
We have audited the accompanying consolidated financial
statements of Cairo Poultry Company S.A.E, which com-
prise the consolidated balance sheet as at 31 December
2009 , and the related consolidated statements of income,
changes in shareholders’ equity, and cash flow for the year
then ended, and a summary of significant accounting poli-
cies and other explanatory notes.
management’s responsibility for the Financial statements
These consolidated financial statements are the responsibility
of Company’s management. Management is responsible for
the preparation and fair presentation of these consolidated fi-
nancial statements in accordance with the Egyptian Accounting
Standards and in the light of the prevailing Egyptian laws, man-
agement responsibility includes, designing, implementing and
maintaining internal control relevant to the preparation and
fair presentation of consolidated financial statements that are
free from material misstatement, whether due to fraud or error
management responsibility also includes selecting and apply-
ing appropriate accounting policies and making accounting
estimates that are reasonable in the circumstances.
auditor’s responsibility
Our responsibility is to express an opinion on these consoli-
dated financial statements based on our audit. Except as de-
scribed below, We conducted our audit in accordance with
the Egyptian Standards on Auditing and in the light of the
prevailing Egyptian laws. Those standards require that we
comply with ethical requirements and plan and perform the
audit to obtain reasonable assurance whether the consolidat-
ed financial statements are free from material misstatement.
An audit involves performing procedures to obtain audit evi-
dence about the amounts and disclosures in the consolidated
financial statements. The procedures selected depend on
the auditor’s judgment, including the assessment of the risks
of material misstatement of the consolidated financial state-
ments, whether due to fraud or error. In making those risk as-
sessments, the auditor considers internal control relevant to
the entity’s preparation and fair presentation of the consoli-
dated financial statements in order to design audit procedures
that are appropriate in the circumstances, but not for the
purpose of expressing an opinion on the effectiveness of the
entity’s internal control. An audit also includes evaluating the
appropriateness of accounting policies used and the reason-
ableness of accounting estimates made by management, as
well as evaluating the overall presentation of the consolidated
financial statements.
We believe that the audit evidence we have obtained is suf-
ficient and appropriate to provide a basis for our audit opinion
on the consolidated financial statements.
Basis for Qualified Opinion
The consolidated financial statements include assets,
liabilities, revenues and expenses refers to subsidiaries that
were audited by other auditors amounted to L.E 521 175 192,
L.E 193 968 212, L.E 949 379 337 and L.E 781 464 907 with
a percentage of 21.54 %, 19.66 %, 31.02 %, and 28.94 %
KPmG hazem hassanPublic accounts & consultant
nasr abou elabasPublic accountsFinancial review

30 31
respectively to total consolidated assets, liabilities, expenses
and revenues as at 31 December 2009. Against 18.55 %,
16.53 %, 30.12 % and 29.93 % respectively to total consoli-
dated assets, liabilities, expenses and consolidated revenues
as at 31 December 2008, So we couldn’t determine whether
there is an important adjustments to be made of the value of
these assets, liabilities, expenses and revenues recorded in
the consolidated financial statements to be relevant in accor-
dance with Egyptian Accounting Standards.
In our opinion, except for the effects of such adjustments,
if any, as might have been determined to be necessary
had we audited the financial statements of such subsidiary
companies referred to in paragraph above, the consolidated
financial statements referred to above present fairly, in all
material respects, the consolidated financial position of the
group as at 31,December 2009 and the results of its opera-
tions and its cash flows for the financial year then ended, in
accordance with Egyptian Accounting Standards and rel-
evant Egyptian laws and regulations that related to prepare
this consolidated financial statements.
report on other legal and regulatory requirements
The Company maintains proper books of account, which
include all that is required by law and by the statutes of
the Company, the consolidated financial statements are in
agreement thereto.
The financial information included in the Board of
Directors’ report, prepared in accordance with Law No. 159
of 1981 and its executive regulations, is in agreement with
the Company’s books of account.
Cairo, 20 January 2010
KPmG hazem hassanPublic accounts & consultant
nasr abou elabasPublic accounts
cairo Poultry company(An Egyptian Joint Stock Company)Consolidated Statement of financial positionAs at 31 December 2009
The notes from (1) to (38) are an integral part of these consolidated financial statements.
note no. 31/12/2009 le(amended)
31/12/2008 le
non-currenT asseTs Property, Plant and equipment (7) 810 620 162 709 927 510Breeders (8) 59 041 209 47 929 924Plant Wealth (9) 10 479 229 -Projects under construction (10) 100 522 199 118 424 199Other financial investments (11) 1 202 500 1 202 500Investments in associate companies (12) 88 638 353 105 743 568Other investments (13) 213 602 734 141 853 047Payment for purchase of investment (14) 8 540 000 8 540 000Total non-current assets 1 292 646 386 1 133 620 748currenT asseTsInventories (15) 286 623 432 322 887 093Trade receivables & other debit balances (16) 104 201 361 132 241 305Due from related parties (34-1) 68 384 756 53 161 469Other financial investments (17) - 11 388 405Cash and cash equivalent (18) 16 063 534 27 386 971Total current assets 475 273 083 547 065 243currenT liaBiliTiesProvision for Contingency (19) 21 160 530 6 762 390Provision for claims (20) 34 196 287 26 675 336Banks-credit facilities (21) 112 467 144 353 672 896Banks-overdrafts 74 442 790 142 179 057Trade payables & other credit balances (22) 130 778 749 117 430 248Due to related parties (34-2) 4 789 877 3 198 965Long term loans - current portion (25) 37 802 016 63 514 006Total current liabilities 415 637 393 713 432 898Working capital 59 635 690 ( 166 367 655)Total investment 1 352 282 076 967 253 093Financed as follows:shareholDers’ equiTyIssued & paid - up capital (23) 145 152 000 145 152 000Reserves 247 284 332 229 592 791Special reserve- change in value of investments available for sale (24) 134 291 839 62 542 153Revaluation surplus 46 820 572 53 990 980Retained earnings 227 372 608 223 159 511Parent company’s share in profits of treasury stocks sale 196 446 196 446Net profit for the year 205 365 585 163 031 500 Total equity attributable to the shareholders of the parent company 1 006 483 382 877 665 381minority interest 16 214 241 16 730 191 Total shareholders’ equity 1 022 697 623 894 395 572non-currenT liaBiliTiesLong term loans (25) 295 127 774 38 935 279Deferred tax liabilities (26-1) 20 270 890 16 225 864Long term notes payable 9 190 391 14 494 306Deferred sales tax installments 4 990 141 3 202 072Other long term liabilities 5 257 -Total non-current liabilities 329 584 453 72 857 521Total shareholders’ equity and non-current liabilities 1 352 282 076 967 253 093
Chief Financial Officer
Acc/ Mohamed Taha
General manager
Mr. Adel Al-Alfi
managing Director
Eng/ Tarek Tawfik
chairman
Professor/ Mamdouh Abdelwahab Sharafeldin

32 33
cairo Poultry company(An Egyptian Joint Stock Company)Consolidated Income statementfor the financial year ended 31 December, 2009
note no.
The year ended 31/12/2009
le
amendedThe year ended
31/12/2008le
Net sales 1 935 108 702 1 962 315 356
Cost of sales (1 550 109 193) (1 615 775 664)
Gross profit 384 999 509 346 539 692
Selling & distribution expenses (57 635 688) (62 075 029)
General & administrative expenses (27) (50 818 193) (46 817 705)
Other operating expense (28) (44 683 391) (27 881 108)
Board of directors remuneration (898 000) (319 464)
Other operating revenues (29) 25 823 355 25 027 973
Profit from operations 256 787 592 234 474 359
Revenue from investments available for sale 3 494 450 2 409 931
The group’s share in the net profit of associate companies (12) 990 478 5 619 979
Profit from sale of investments available for sale 23 949 185 2 093 626
Finance interest and expense (30) (64 667 544) (56 468 167)
Net profit for the year before income tax 220 554 161 188 129 728
Income tax (6 867 240) (11 423 656)
Deferred tax (26-1) (3 614 033) (9 086 846)
Net profit after income tax 210 072 888 167 619 226
Distributed as followsParent company’s share in profit 205 365 585 163 031 500
Non controlling interest share in profit 4 707 303 (4 587 726)
210 072 888 167 619 226
Earning per share for the year (LE/Share) (36) 2.34 1.79
* The notes from (1) to (38) are an integral part of these consolidated financial statements.
Des
crip
tio
nn
ote
n
o.
sha
re c
apit
al
ler
eser
ves
le
sp
ecia
l res
erve
s ev
alua
tio
n d
iffer
-en
ces
of
avai
lab
le f
or
sale
inve
stm
ents
le
re-
eval
uati
on
surp
lus
le
ret
aine
d
ear
ning
s
le
Par
ent
com
pan
y’s
shar
e in
pro
fits
o
f tr
easu
ry
sto
cks
sale
le
Net
Pro
fit
for
the
year
le
Tota
l le
Bal
ance
as
at 3
1/12
/200
7 7
2 57
6 00
022
6 76
7 21
4 1
63 6
27 7
7053
990
980
216
495
383
196
446
146
333
062
879
986
855
Div
iden
ds
for
the
year
200
7-
2 82
5 57
7-
-7
465
999
-(1
46 3
33 0
62)
(136
041
486
)
Incr
ease
in s
hare
cap
ital
72 5
76 0
00-
--
--
-72
576
000
Ava
ilab
le fo
r sa
le fi
nanc
ial i
nves
tmen
t ev
alua
tion
diff
eren
ces
--
(101
085
617
)-
--
-(1
01 0
85 6
17)
Net
pro
fit fo
r th
e ye
ar-
--
--
-16
3 39
8 97
116
3 39
8 97
1
Bal
ance
as
at 3
1/12
/200
8 b
efor
e am
end
men
t14
5 15
2 00
0 2
29 5
92 7
91 6
2 54
2 15
3 5
3 99
0 98
0 2
23 9
61 3
82 1
96 4
46 1
63 3
98 9
71 8
78 8
34 7
23
Ad
just
men
t-
--
-(8
01 8
71)
-(3
67 4
71)
(1 1
69 3
42)
Bal
ance
as
at 3
1/12
/200
8 (a
fter
am
end
ed)
145
152
000
229
592
791
62
542
153
53
990
980
223
159
511
196
446
163
031
500
877
665
381
Div
iden
ds
for
the
year
200
8-
17
691
541
--
4 2
13 0
97-
(163
031
500
)(1
41 1
26 8
62)
Ava
ilab
le fo
r sa
le fi
nanc
ial i
nves
tmen
t ev
alua
tion
diff
eren
ces
(24)
--
71
749
686
--
--
71
749
686
Re-
eval
uatio
n su
rplu
s-
--
(7 1
70 4
08)
--
-(7
170
408
)
Net
pro
fit fo
r th
e ye
ar-
--
--
- 2
05 3
65 5
85 2
05 3
65 5
85
Bal
ance
as
at 3
1/12
/200
9 1
45 1
52 0
00 2
47 2
84 3
32 1
34 2
91 8
39 4
6 82
0 57
2 2
27 3
72 6
08 1
96 4
46 2
05 3
65 5
851
006
483
382
cai
ro P
oul
try
co
mp
any
(An
Egy
ptia
n Jo
int
Sto
ck C
omp
any)
Con
solid
ated
sta
tem
ents
cha
nges
in s
hare
hold
ers’
eq
uity
(Am
end
ed)
for
the
finan
cial
yea
r en
ded
31
Dec
emb
er, 2
009
* T
hese
ad
just
men
ts r
epre
sent
ed in
the
diff
eren
ce b
etw
een
grou
p’s
sha
re in
the
net
con
solid
ated
ass
ets
and
net
unc
onso
lidat
ed a
sset
s of
the
Egy
ptia
n C
omp
any
for
Sta
rch
&
G
luco
se a
s of
31/
12/2
008.
* T
he n
otes
from
(1) t
o (3
8) a
re a
n in
tegr
al p
art
of t
hese
con
solid
ated
fina
ncia
l sta
tem
ents
.

34 35
note no.
The year ended31/12/2009
le
The year ended31/12/2008
le
cash FloWs From oPeraTinG acTiviTies
Net profit for the year before income tax and minority interest in profits 220 554 161 188 129 728
aDjusTmenTs To reconcile neT ProFiT For The year To neT cash
FloWs From oPeraTinG acTiviTies:
Depreciation of fixed assets (7) 59 962 912 45 852 023
Depreciation of plant wealth 207 649 -
Capital loss 596 215 ( 350 497)
Amortization of breeders (8) 109 547 715 80 970 022
Profits from sale of breeders (7 212 012) ( 5 858 199)
Profits from sale of financial investments (23 949 185) -
Impairment in trade receivables and other debit balances - formed 6 069 618 715 000
Impairment in trade receivables and other debit balances - no longer required (2 344 113) ( 1 854 335)
Impairment in inventories - formed (28) - 23 262 067
Impairment in projects under construction - formed - 1 500 000
The group’s share in the net profits of associates companies ( 990 478) ( 5 619 979)
Provision for Contingencies - formed 14 500 000 -
Provision for Contingencies - no longer required - ( 3 000 000)
Provision of claims - formed (28) 9 105 889 2 087 100
Provision of claims- no longer required ( 200 000) -
Management fees of The Egyptian Company for Starch & Glucose - ( 1 900 000)
Investments revenue (3 494 450) ( 2 409 931)
Credit interests (30) ( 273 051) ( 1 284 531)
Finance interests & expense (30) 66 628 093 58 465 528
448 708 963 378 703 996
chanGes in WorKinG caPiTal
Decrease (increase) in inventories 36 263 661 ( 85 260 436)
Decrease in trade receivables & other debit balances 24 314 439 6 609 451
(Decrease) in trade payables & other credit balances ( 30 784 177) ( 27 943 619)
(Increase) decrease in due from related parties ( 15 223 287) 48 465 268
Increase in due to related parties 1 590 912 2 625 006
Provisions - utilized ( 1 754 432) ( 3 227 207)
Financial interests paid ( 66 628 093) ( 58 465 528)
Net cash flows generated from operating activities 396 487 986 261 506 931
cairo Poultry company(An Egyptian Joint Stock Company)Consolidated Statement of Cash Flowsfor the financial year ended 31 December, 2009
cairo Poultry company(An Egyptian Joint Stock Company)Consolidated Statement of Cash Flowsfor the financial year ended 31 December, 2009
note no.
The year ended31/12/2009
le
The year ended31/12/2008
le
cash FloWs From invesTinG acTiviTies
Proceeds from sale of fixed assets 4 169 740 762 250
Payments for acquisition of fixed assets & projects under constructions ( 158 206 397) ( 248 304 257)
Payments for purchase of Poultry breeders ( 138 505 527) ( 104 737 417)
Proceeds from sale of Poultry breeders 25 058 539 24 708 114
Proceeds from sale of treasury stocks 11 388 405 11 577 346
Proceeds from sale of financial investments 29 260 074 ( 11 624 835)
Payments for purchase of financial investments - ( 14 636 357)
Collected interests 273 051 1 284 531
Collected investments revenue 3 494 450 2 409 931
Dividends received from the associate companies 5 013 337 5 675 735
Net cash flow used in investing activities (218 054 328) (332 884 959)
cash FloWs From FinancinG acTiviTies
Settlements of banks - credit facilities ( 241 205 752) ( 52 596 233)
Proceeds from loans 230 480 505 12 003 987
Decrease in minority interest ( 5 223 253) -
Cash dividends paid for shareholders ( 108 864 000) ( 36 288 000)
Net cash flows used in financing activities (124 812 500) (76 880 246)
net (Decrease) increase in cash & cash equivalents during the year 53 621 158 (148 258 274)
cash and cash equivalents at the beginning of the year (115 393 262) 32 865 012
cash and cash equivalents at the end of the year (18/1) (61 772 104) (115 393 262)
* The notes from (1) to (38) are an integral part of these consolidated financial statements.
36 37
cairo Poultry company Notes to consolidated financial statements for financial year ended 31 December 2009
1- company’s & subsidiaries’ background Cairo Poultry Company – An Egyptian Joint Stock Company – was established in year 1977 according to the provisions of Investment Law No. 230 of 1989.
The Company was registered under the commercial register on 26/7/1977 No. 42444, The Company’s life was extended to be 25 Years starting from 19/7/2002.The Company is a subsidiary to the Kuwait Food Company.Company location : 32 Mourad st. –Giza – Egypt .Chairman of the board Prof. Dr. / Mamdouh Sharafeldin.
The company’s purposeThe Company’s objective is represented in producing, raising chicks and producing life stock fodder, mix preliminary ingredients and producing hatching eggs and participating in similar projects domestically and overseas.
registration in the stock exchangeThe Company is listed in the formal table (1) of Cairo and Alexandria Stock Exchanges.
2- Basis of preparation2-1 statement of complianceThe financial statements have been prepared in accordance with Egyptian Accounting Standards (“EAS”), and in compliance with applicable Egyptian laws and regulations.The financial statements were approved by the Company’s Board of Directors in its meeting held on 17/1/2010 for issuance.
2-2 Basis of measurementThe consolidated financial statements have been prepared on the historical cost basis except for the following:• Semi-Finished production ( Chicks at the fatten station at fair value)• Available for sale investmentsThe methods used to measure fair values are discussed further in note 4.
2-3 Functional and presentation currencyThese consolidated financial statements are presented in Egyptian pound, which is the Company’s and its subsidiaries functional currency.
2-4 use of estimates and judgmentsThe preparation of financial statements in conformity with Egyptian Accounting Standards requires management to make judgments, estimates and assumptions that affect the application of accounting policies and the reported amounts of assets, liabilities, income and expenses. Actual results may differ from these estimates.
Estimates and underlying assumptions are reviewed on an ongoing basis. Revisions to accounting estimates are recognized in the period in which the estimate is revised and in any future periods affected.
Information about significant areas of estimation uncertainty and critical judgments in applying accounting policies that have the most significant effect on the amounts recognized. In the financial statements is included in the following notes:• Note(3-1): Business combination. • Note(7): Property, plant and equipment.• Note(15): Inventories.• Note(16-1): trade receivables and other debit balances.• Note(31): Provisions and Contingent liabilities.• Note(26-1): deferred tax.
3- Significant accounting policiesThe accounting policies set out below have been applied consistently to all periods presented in these consolidated financial statements.
3-1 Basis of consolidationsubsidiary companiesSubsidiaries are those enterprises controlled by the Company. Control exists when the Company has the power, to govern the financial and operating policies of an enterprise so as to obtain benefits from its activities. And when evaluating this power we have to take in consideration the present and possible voting rights in the consolidated financial statements’ date. And the subsidiaries’ financial statements will be consolidated in the consolidated financial statements from the acquisition date till the holding company loses its power.
associatesAssociates are those entities in which the Group has significant influence, but not control, over the financial and operating policies. Associates are accounted for using the equity method. The consolidated financial statements include the Group’s share of the income and expenses of equity accounted investees, after adjustments to align the accounting policies with those of the Group, from the date that significant influence or joint control commences until the date that significant influence or joint control ceases. When the Group’s share of losses exceeds its interest in an equity accounted investee, the carrying amount of that interest (including any long-term investments) is reduced to nil and the recognition of further losses is discontinued except to the extent that the Group has an obligation or has made payments on behalf of the investee.
Transactions eliminated on consolidation Intra-group balances, and any unrealized income and expenses arising from intra-group transactions, are eliminated in preparing the consolidated financial statements. Unrealized gains arising from transactions with equity accounted investees are eliminated against the investment to the extent of the Group’s interest in the investee. Unrealized losses are eliminated in the same way as unrealized gains, but only to the extent that there is no evidence of impairment.
3-2 Foreign currency Foreign currency transactionsTransactions in foreign currencies (other than functional and presentation currency the Egyptian Pound) are translated to the functional currency at exchange rates at the dates of the transactions. Monetary assets and liabilities denominated in foreign currencies at the reporting date are retranslated to the functional currency at the exchange rate at that date. Non-monetary assets and liabilities denominated in foreign currencies that are measured at fair value are retranslated to the functional currency at the exchange rate at the date that the fair value was determined. Foreign currency differences arising on retranslation are recognized in profit or loss, except for differences arising on the retranslation of available-for-sale equity instruments.
3-3 Financial instruments3-3-1 Non-derivative financial instrumentsNon-derivative financial instruments comprise investments in equity and debt securities, trade and other receivables, cash and cash equivalents, loans and borrowings, and trade and other payables.
Non-derivative financial instruments are recognized initially at fair value plus directly attributable transaction costs. Cash and cash equivalents comprise cash balances and call deposits. Bank overdrafts that are repayable on demand and
form an integral part of the Company’s cash management are included as a component of cash and cash equivalents for the purpose of the statement of cash flows.
Accounting for finance income and expense is discussed in note (3-18).
3-3-2 available-for-sale investments Equity securities held for sale are classified as current assets and are recognized at fair value. Gain or loss are recognized in the income statement.Equity securities and certain debt securities are classified as available-for-sale financial assets are measured at fair value (except for investments which are unlisted in stock exchange),gain or loss are directly recognized in equity. When an

38 39
investment is derecognized, the cumulative gain or loss in equity is transferred to income statement except for impairment losses. Equity securities which are unlisted in stock exchange are recognized at cost less impairment.
3-4 Property, plant and equipmenta- recognition and measurementItems of property, plant and equipment are measured at cost less accumulated depreciation and accumulated impairment losses (note: 7).
Cost includes expenditures that are directly attributable to the acquisition of the asset. The cost of self-constructed assets includes the cost of materials and direct labor, any other costs directly attributable to bringing the asset to a working condition for their intended use, and the costs of dismantling and removing the items and restoring the site on which they are located.
When parts of an item of property, plant and equipment have different useful lives, they are accounted for as separate items (major components) of property, plant and equipment.
Purchased software that is integral to the functionality of the related equipment is capitalized as part of that equipment.Borrowing costs related to the acquisition, construction or productions of qualifying assets are recognized in profit or loss as incurred.Gains and losses on disposal of an item of property, plant and equipment are determined by comparing the proceeds from
disposal with the carrying amount of property, plant and equipment and are recognized net within “other income” in profit or loss.
B- subsequent costsThe cost of replacing part of an item of property, plant and equipment is recognized in the carrying amount of the item if it is probable that the future economic benefits embodied within the part will flow to the Company and its cost can be measured reliably. The carrying amount of the replaced part is derecognized. The costs of the day-to-day servicing of property, plant and equipment are recognized in profit or loss as incurred.
c- DepreciationDepreciation is recognized in profit or loss on a straight-line basis over the estimated useful lives of each part of an item of property, plant and equipment. Land is not depreciated. The estimated useful lives for the current and comparative periods are as follows:
3-5 GrantsGranted assets gained by group companies from grantee are recorded after deduction the cost of purchasing till reaches the book value for the assets, the grants are recorded as revenue at consolidated income statement during the estimated life time for the asset with reducing the annual depreciation burden.
3-6 BreedersThe grand Parent Poultry (related to the Misr Grand Parents Company, Cairo Grand Parents Company, Cairo Misr Grand Parents) are recorded at its net book value less the accumulated depreciation at the consolidated balance sheet date. The depreciation is computed according to the average of hatching eggs production during the productive period which is the standard applicable international ratios related to the race that the company acquire (due to the absence of an active market to determine a reliable price).
3-7 Projects under constructionExpenditures incurred on purchasing and constructing fixed assets are initially recorded in projects under construction until the asset is completed and becomes ready for use. Upon the completion of the assets, all related costs are transferred to fixed assets. Projects under construction are measured at cost less accumulated impairment losses (note: 3-14). No depreciation is charged until the project is completed and transferred to fixed assets.
Description estimated useful lives (years)
Buildings & constructions 10 - 40
Machinery and equipment 7 - 14
Motor vehicles & transportation means 5
Tools & equipment 5
Furniture and office equipment 3 - 8
3-8 Plant life stockAll the expenditures of planting olive trees that have been capitalized as fixed assets in the balance sheet under the plant life stock item after reaching the marginal production, and to be depreciated on 50 years according to its nature.
3-9 GoodwillGoodwill is initially measured at its cost , being the excess of the cost of the business combination over the Group’s interest in the net fair value of identifiable assets, liabilities and contingent liabilities. After initial recognition, the group measures acquired goodwill at cost less impairment losses. Recognized goodwill impairment losses are not subsequently reversed.
3-10 inventoriesInventories of raw materials, packing materials and spare parts are measured at the lower of cost and net realizable value. Net realizable value is the estimated selling price, in the ordinary course of business, less the estimated costs of completion and selling expenses.
The cost of inventory determined as follows:Raw materials and packing materials is determined at cost according to first in First out method.Spare parts and supplies at cost are determined according to weighted average method.The work in progress (Chicks in batteries) at fair value determined by career’s specialists after deducting estimated cost of sales, the increase or decrease in fair value are recorded to income statement – if any – according to the sales price weighted to percentage of compilation of the chicks.Finished goods of (Fodders and frozen breeders) are measured at the lower of manufacturing cost or net realizable value. The manufacturing cost comprises raw materials, direct labor, and cost includes an appropriate share of overheads based on normal operating capacity.
3-11 Plant life stock ( land reclamation) All the expenditures of planting olive trees that have not reached the marginal production yet included in the projects in progress until reach that stage are capitalized as fixed assets in the consolidated balance sheet under the plant life stock item.
3-12 Trade receivables and other debit balancesTrade accounts receivable with age from one day to 365 days are recognized by the invoiced value net of an estimate of the uncollectible amount which is made when collection of the full amount is no longer probable. Also, the balance of trade accounts receivable and debtors should be impaired by the determined value of bad debts. Debtors and other debit balances are stated at their nominal value less the impairment in its value.
3-13 creditors and other credit balancesCreditors and other credit balances are stated at their cost.
3-14 impairmentFinancial assetsA financial asset is assessed at each reporting date to determine whether there is any objective evidence that it is impaired. A financial asset is considered to be impaired if objective evidence indicates that one or more events have had a negative effect on the estimated future cash flows of that asset.An impairment loss in respect of a financial asset measured at amortized cost is calculated as the difference between its carrying amount, and the present value of the estimated future cash flows discounted at the original effective interest rate. An impairment loss in respect of an available-for-sale financial asset is calculated by reference to its fair value.Individually significant financial assets are tested for impairment on an individual basis. The remaining financial assets are assessed collectively in groups that share similar credit risk characteristics.All impairment losses are recognized in profit or loss. Any cumulative loss in respect of an available-for-sale financial asset recognized previously in equity is transferred to profit or loss.An impairment loss is reversed if the reversal can be related objectively to an event occurring after the impairment loss was recognized. For financial assets measured at amortized cost and available-for-sale financial assets that are debt securities,

40 41
the reversal is recognized in profit or loss. For available-for-sale financial assets that are equity securities, the reversal is recognized directly in equity.
Non-financial assets The carrying amounts of the Company’s non-financial assets, other than, inventories and deferred tax assets are reviewed at each reporting date to determine whether there is any indication of impairment. If any such indication exists, then the asset’s recoverable amount is estimated. For intangible assets that have indefinite lives or that is not yet available for use.The recoverable amount of an asset or cash-generating unit is the greater of its value in use and its fair value less costs to sell. In assessing value in use, the estimated future cash flows are discounted to their present value using a pre-tax discount rate that reflects current market assessments of the time value of money and the risks specific to the asset. An impairment loss is recognized if the carrying amount of an asset or its cash-generating unit exceeds its estimated recoverable amount. Impairment losses are recognized in profit or loss.An impairment loss is reversed if there has been a change in the estimates used to determine the recoverable amount. An impairment loss is reversed only to the extent that the asset’s carrying amount does not exceed the carrying amount that would have been determined, net of depreciation or amortization, if no impairment loss had been recognized.
3-15 Defined contribution plansThe Company contributes to the government social insurance system for the benefits of its employees according to the social insurance Law No. 79 of 1975 and its amendments, the Company’s contributions are recognized in income statement using the accrual basis of accounting. The company’s obligation in respect of employees’ pensions is confined to the amount of aforementioned contributions.
3-16 ProvisionsA provision is recognized if, as a result of a past event, the Company has a present legal or constructive obligation that can be estimated reliably, and it is probable that an outflow of economic benefits will be required to settle the obligation. Provisions are determined by discounting the expected future cash flows at a pre-tax rate that reflects current market assessments of the time value of money and the risks specific to the liability.
3-17 revenue recognitionRevenue from the sale of goods is measured at the fair value of the consideration received or receivable, net of returns, trade discounts and volume rebates. Revenue is recognized when the significant risks and rewards of ownership have been transferred to the buyer, recovery of the consideration is probable, the associated costs and possible return of goods can be estimated reliably.Investment revenue are recorded when the shareholders have the right of dividends that provided by the associates and available for sale investments at the financial period that dividends are approved by general assembly of the invested companies.
3-18 Finance income and expensesFinance income comprises interest income on funds invested Interest income is recognized as it accrues in profit or loss, using the effective interest method. Finance expenses comprise interest expense on borrowings using the effective interest method. Foreign currency gains and losses are reported on a net basis.
3-19 income taxIncome tax on profit or loss for the year comprises current and deferred tax. Income tax is recognized in the income statement except to the extent that it relates to items recognized directly on equity, in which case it is recognized in equity. Current tax is the expected tax payable on the taxable income for the year, using tax rates enacted or substantially enacted at the balance sheet date, and any adjustment to tax payable in respect of previous years.
3-20 Deferred taxDeferred tax is recognized using the balance sheet method, providing for temporary differences between the carrying amounts of assets and liabilities for financial reporting purposes and the amounts used for taxation purposes. The amount of deferred tax provided is based on the expected manner of realization or settlement of the carrying amount of assets and liabilities,
using tax rates enacted or substantively enacted at the consolidated balance sheet date. A deferred tax asset is recognized only to the extent that it is probable that future taxable profits will be available against which the asset can be utilized. Deferred tax assets are reduced to the extent that it is no longer probable that the related tax benefit will be realized.
3-21 Borrowing costsBorrowings are recognized initially at the proceeds received, net of transaction costs incurred. Borrowings are subsequently stated at amortized cost using the effective interest rate basis; any difference between proceeds (net of transaction costs) and the redemption value is recognized in the income statement over the period of the borrowings.
3-22 segmentation reportsEach sector of the companies’ activity segments considers as a unit that contributes in providing variant products different that the other activities (Activity segments) and each unit have risks and utilities different than the other unit exist on the company according to its activity.
3-23 earnings per shareThe Company presents basic earnings per share (EPS) data for its ordinary shares. Basic EPS is calculated by dividing the profit or loss attributable to ordinary shareholders of the Company by the weighted average number of ordinary shares outstanding during the period.
3-24 legal reserveAccording to the Companies Law requirements and the statutes of the Company, 5% of the annual net profit transferred to a legal reserve until the accumulated reserve reaches 50% of the issued share capital. The reserve is un-distributable; however, it can be used to increase the share capital or to offset losses. If the reserve falls below the defined level (50% of the issued share capital), than the Company is required to resume setting aside 5% of the annual profit until it reaches 50% of the issued share capital.
3-25 Cash flow statementThe cash flow statement is prepared using the indirect method.
3-26 Key sources of estimation uncertaintyimpairment of Trade and other receivables balancesAn estimate of the collectable amount of trade receivables is made when collection of the full amount is no longer probable. This estimation is performed on an individual basis.
At the consolidated financial statements date, gross trade receivables and other debit balances were L.E 154 652 625 and the impairment in trade receivables and other debit balances value was L.E 50 451 269. Any difference between the amounts actually collected, in future periods, and the amounts currently expected to be collected will be recognized in the consolidated income statement.
Write down of inventoriesInventories are held at lower of cost and net realizable value. When inventories become old or obsolete, an estimate is made of their net realizable value. For individually significant amounts this estimation is performed on an individual basis.
At the consolidated financial statement date, gross inventories were L.E 286 623 432, Any difference between the amounts actually realized in future periods and the amounts expected to be recovered will be recognized in the consolidated income statement.
4- Determination of fair valueA number of the Company’s accounting policies and disclosures require the determination of fair value, for both financial and non- financial assets and liabilities. Fair values have been determined for measurement and/or disclosure purposes based on the following methods. Where applicable, further information about the assumptions made in determining fair values is disclosed in the notes concerning that asset or liability.

42 43
4-1 Work in process (chicks in batteries)With fair value determined by specialist opinion.
4-2 available for sale investmentsCurrent available for sale investments are evaluated in active market with its market value.
5- Financial risk management overviewThe Group has exposure to the following risks from its use of financial instruments:• Credit risk• Liquidity risk • Market risk.
This note presents information about the Company’s exposure to each of the above risks, the Company’s objectives, policies and processes for measuring and managing risk, and the Company’s management of capital. Further quantitative disclosures are included throughout these financial statements.
The Board of Directors has overall responsibility for the establishment and oversight of the Company’s risk management framework. The Board is responsible for developing and monitoring the Company’s risk management policies.
The Company’s risk management policies are established to identify and analyze the risks faced by the Company, to set appropriate risk limits and controls, and to monitor risks and adherence to limits. Risk management policies and systems are reviewed regularly to reflect changes in market conditions and the Company’s activities. The Company, through its training and management standards and procedures, aims to develop a disciplined and constructive control environment in which all employees understand their roles and obligations.
The Company’s Board oversees how management monitors compliance with the Company’s risk management policies and procedures, and reviews the adequacy of the risk management framework in relation to the risks faced by the Company. The Company’s Board is assisted in its oversight role by Internal Audit. Internal Audit undertakes both regular and ad hoc reviews of risk management controls and procedures, the results of which are reported to the management.
credit risk Credit risk is the risk of financial loss to the Company if a customer or counterparty to a financial instrument fails to meet its contractual obligations, and arises principally from the Company’s receivables from customers and investment securities.
Trade and other receivablesThe Company’s exposure to credit risk is influenced mainly by the individual characteristics of each customer. The demographics of the Company’s customer base, including the default risk of the industry and country, in which customers operate, has less of an influence on credit risk. Credit risk is considered limited due to the Company’s policy that points to dealing with a different customers sector and changing the Company’s policy to cash sales.
The Board of Directors has established a credit policy under which each new customer is analyzed individually for creditworthiness before the Company’s standard payment and delivery terms and conditions are offered. The Company’s review includes external ratings, when available, and in some cases bank references. Purchase limits are established for each customer, which represents the maximum open amount without requiring approval from the management; these limits are reviewed quarterly. Customers that fail to meet the Company’s benchmark creditworthiness may transact with the Company only on a prepayment basis.
Most of the Company’s customers have been transacting with the Company for many years, and losses have occurred infrequently. In monitoring customer credit risk, customers are grouped according to their credit characteristics, including whether they are an individual or legal entity, whether they are a wholesale, retail or end-user customer, geographic location, industry, aging profile, maturity and existence of previous financial difficulties. Trade and other receivables relate mainly to the Company’s wholesale customers. Customers that are graded as “high risk” are placed on a restricted customer list and monitored by the Management, and future sales are made on a prepayment basis.
Goods are sold subject to retention of title clauses, so that in the event of non-payment the Company may have a secured claim. The Company does not require collateral in respect of trade and other receivables. The Company establishes an
allowance for impairment that represents its estimate of incurred losses in respect of trade and other receivables and investments. The main components of this allowance are a specific loss component that relates to individually significant exposures, and a collective loss component established for groups of similar assets in respect of losses that have been incurred but not yet identified. The collective loss allowance is determined based on historical data that considered an estimation made by the Company related to Receivables, other debit balances and investments.
liquidity riskLiquidity risk is the risk that the Company will not be able to meet its financial obligations as they fall due. The Company’s approach to managing liquidity is to ensure, as far as possible, that it will always have sufficient liquidity to meet its liabilities when due, under both normal and stressed conditions, without incurring unacceptable losses or risking damage to the Company’s reputation.
The Company uses activity-based costing to cost its products and services, which assists it in monitoring cash flow requirements and optimizing its cash return on investments. Typically the company ensures that it has sufficient cash on demand to meet expected operational expenses for a period of 60 days, including the servicing of financial obligations; this excludes the potential impact of extreme circumstances that cannot reasonably be predicted, such as natural disasters. In addition, the Company maintains the following lines of credit: • Credit facility amounted to L.E 112 467 144 the interest incurred is paid at the interest rate between 9% and 10 % for Facilities in Egyptian pound and at the interest rate between 1 % and 2.5% over the Libor rate for US Dollars facilities.
market risk Market risk is the risk that changes in market prices, such as foreign exchange rates, interest rates and equity prices will affect the Company’s income or the value of its holdings of financial instruments. The objective of market risk management is to manage and control market risk exposures within acceptable parameters, while optimizing the return. The Company buys and sells derivatives, and also incurs financial liabilities, in order to manage market risks. All such transactions are carried out within the guidelines set by the Management.
currency riskThe Company is exposed to currency risk on sales, purchases and borrowings that are denominated in a currency other than the respective functional currencies of the Company, primarily the U.S. Dollars (USD).
The Company uses forward exchange contracts to hedge its currency risk, most with a maturity of less than one year from the reporting date. When necessary, forward exchange contracts are rolled over at maturity.
In respect of other monetary assets and liabilities denominated in foreign currencies, the Company ensures that its net exposure is kept to an acceptable level by buying or selling foreign currencies at spot rates when necessary to address short-term imbalances.
interest rate riskThe Company adopts a policy of ensuring that most of its exposure to changes in interest rates on borrowings is on a fixed rate basis.
capital managementThe Board’s policy is to maintain a strong capital base so as to maintain investor, creditor and market confidence and
to sustain future development of the business. The Board of Directors monitors the return on capital, which the Company defines as net operating income divided by total shareholders’ equity, excluding non-redeemable preference shares. The Board of Directors also monitors the level of dividends to ordinary shareholders.
There were no changes in the Group’s approach to capital management during the year. The Company is not subject to externally imposed capital requirements.
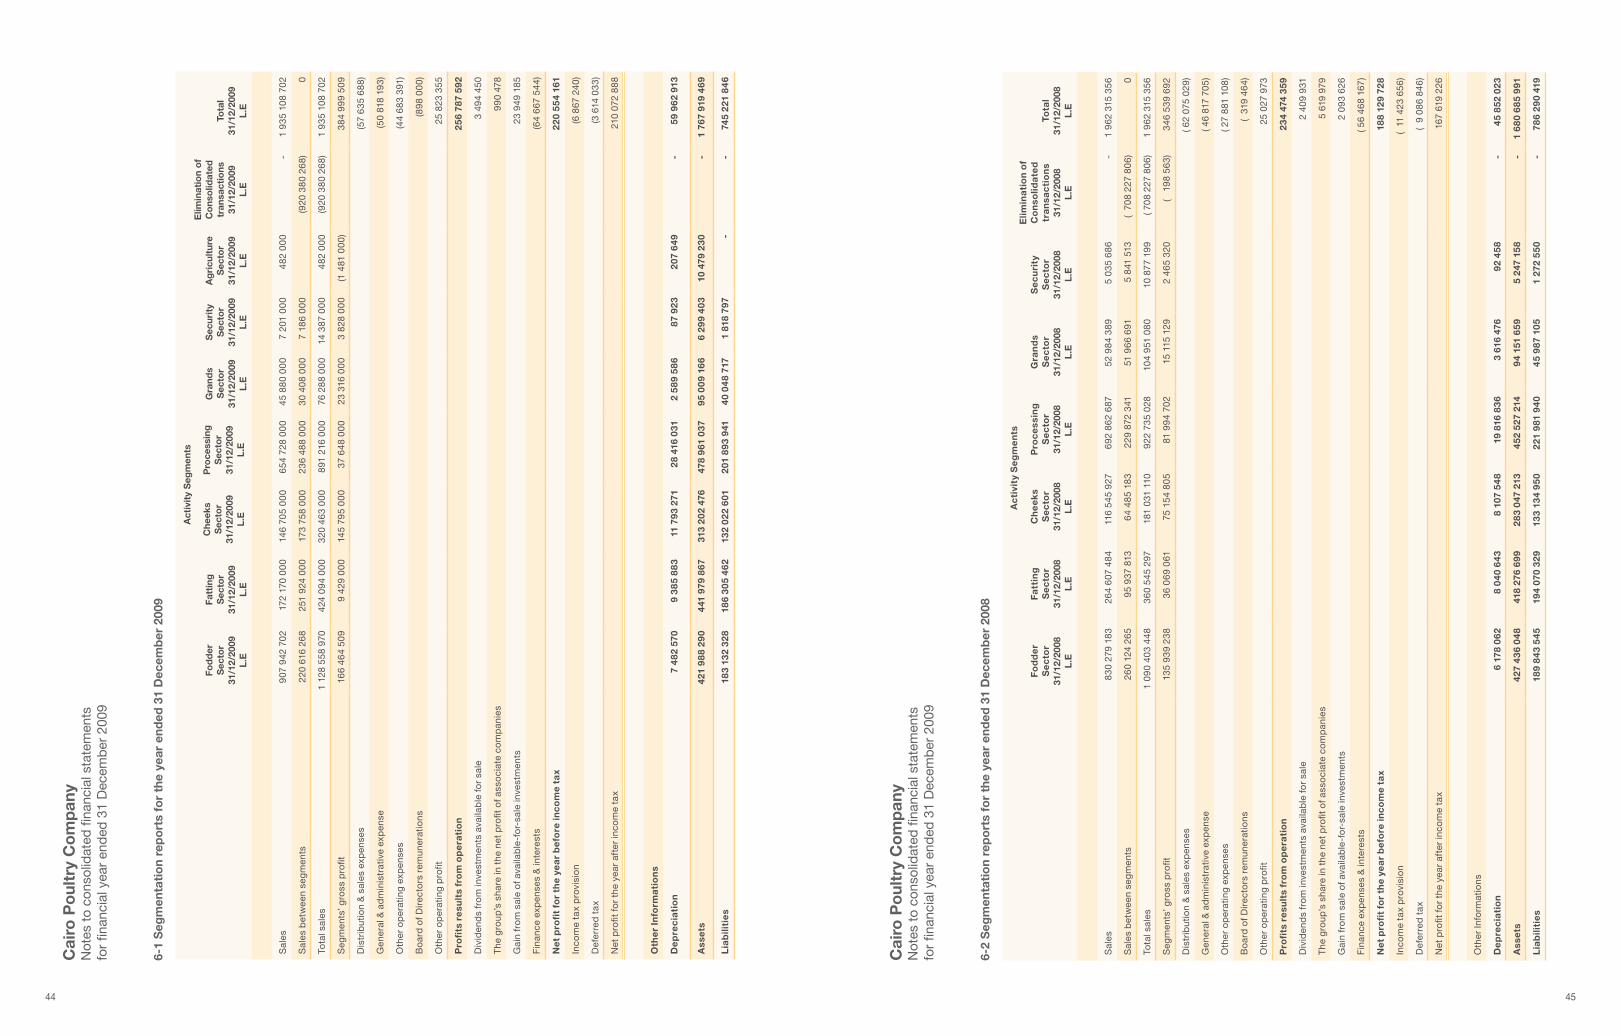
6- segmentation reportsThe segmentation reports was prepared on activity segments basis, the primary report for the activity segments was prepared in accordance with organizational and managerial chart of the company and its subsidiaries. Activities segmentations results include a direct participation unit in each sector activity. The primary report for activity segmentations:A revenue details according to activity segmentations were as follows:
44 45
cai
ro P
oul
try
co
mp
any
N
otes
to
cons
olid
ated
fina
ncia
l sta
tem
ents
fo
r fin
anci
al y
ear
end
ed 3
1 D
ecem
ber
200
9
Fod
der
sec
tor
31/1
2/20
09l.
e
Fatt
ing
sec
tor
31/1
2/20
09l.
e
act
ivit
y s
egm
ents
Gra
nds
sec
tor
31/1
2/20
09l.
e
sec
urit
ys
ecto
r31
/12/
2009
l.e
ag
ricu
ltur
es
ecto
r31
/12/
2009
l.e
elim
inat
ion
of
co
nso
lidat
edtr
ansa
ctio
ns31
/12/
2009
l.e
Tota
l31
/12/
2009
l.e
che
eks
sec
tor
31/1
2/20
09l.
e
Pro
cess
ing
sec
tor
31/1
2/20
09l.
e
Sal
es 9
07 9
42 7
02
172
170
00
0 1
46 7
05 0
00
654
728
00
0 4
5 88
0 0
00
7 2
01 0
00
482
00
0-
1 93
5 10
8 70
2
Sal
es b
etw
een
seg
men
ts 2
20 6
16 2
68
251
924
00
0 1
73 7
58 0
00
236
488
00
0 3
0 40
8 0
00
7 1
86 0
00
(920
380
268
)
0
Tota
l sal
es1
128
558
970
424
094
00
0 3
20 4
63 0
00
891
216
00
0 7
6 28
8 0
00
14
387
00
0 4
82 0
00
(920
380
268
)1
935
108
702
Seg
men
ts’ g
ross
pro
fit 1
66 4
64 5
09
9 4
29 0
00
145
795
00
0 3
7 64
8 0
00
23
316
00
0 3
828
00
0(1
481
00
0) 3
84 9
99
509
Dis
trib
utio
n &
sal
es e
xpen
ses
(57
635
688)
Gen
eral
& a
dm
inis
trat
ive
exp
ense
(50
818
193)
Oth
er o
per
atin
g ex
pen
ses
(44
683
391)
Bo
ard
of D
irec
tors
rem
uner
atio
ns(8
98 0
00)
Oth
er o
per
atin
g p
rofit
25
823
355
Pro
fits
re
sult
s fr
om
op
era
tio
n 2
56 7
87 5
92
Div
iden
ds
fro
m in
vest
men
ts a
vaila
ble
fo
r sa
le 3
494
450
The
gro
up’s
sha
re in
the
net
pro
fit o
f ass
oci
ate
com
pan
ies
99
0 47
8
Gai
n fr
om
sal
e o
f ava
ilab
le-f
or-
sale
inve
stm
ents
23
949
185
Fin
ance
exp
ense
s &
inte
rest
s(6
4 6
67 5
44)
Net
pro
fit
for
the
yea
r b
efo
re in
co
me
tax
220
55
4 16
1
Inco
me
tax
pro
visi
on
(6 8
67 2
40)
Def
erre
d t
ax(3
614
033
)
Net
pro
fit f
or
the
year
aft
er in
com
e ta
x 2
10 0
72 8
88
oth
er
info
rma
tio
ns
De
pre
cia
tio
n 7
482
570
9
38
5 8
83
11
793
271
28
416
031
2 5
89 5
86
87
923
207
649
- 5
9 9
62 9
13
ass
ets
421
98
8 29
0 4
41 9
79 8
67
313
202
476
4
78 9
61 0
37
95
00
9 16
6 6
299
403
1
0 47
9 23
0-
1 76
7 91
9 46
9
lia
bili
tie
s 1
83
132
328
186
305
462
1
32 0
22 6
01
201
893
941
4
0 04
8 71
7 1
818
797
-
- 7
45
221
846
6-1
seg
men
tati
on
rep
ort
s fo
r th
e ye
ar e
nded
31
Dec
emb
er 2
009
Fo
dd
er
se
cto
r31
/12/
2008
l.e
Fatt
ing
se
cto
r31
/12/
2008
l.e
ac
tivi
ty s
eg
me
nts
Gra
nd
ss
ec
tor
31/1
2/20
08l.
e
se
cu
rity
se
cto
r31
/12/
2008
l.e
elim
ina
tio
n o
fc
on
solid
ate
dtr
an
sac
tio
ns
31/1
2/20
08l.
e
Tota
l31
/12/
2008
l.e
ch
eek
ss
ec
tor
31/1
2/20
08l.
e
Pro
ce
ssin
gs
ec
tor
31/1
2/20
08l.
e
Sal
es 8
30 2
79 1
83
264
607
484
1
16 5
45 9
27
692
862
687
5
2 98
4 38
9 5
035
686
-
1 9
62 3
15 3
56
Sal
es b
etw
een
seg
men
ts 2
60 1
24 2
65
95
937
813
64
485
183
229
872
341
5
1 9
66
691
5 8
41 5
13
( 70
8 22
7 80
6)
0
Tota
l sal
es1
09
0 40
3 44
8 3
60 5
45 2
97 1
81 0
31 1
10 9
22 7
35 0
28 1
04 9
51 0
80 1
0 87
7 19
9( 7
08 2
27 8
06)
1 9
62 3
15 3
56
Seg
men
ts’ g
ross
pro
fit 1
35 9
39 2
38 3
6 0
69 0
61
75
154
805
81
994
702
15
115
129
2 4
65 3
20(
198
563
) 3
46 5
39 6
92
Dis
trib
utio
n &
sal
es e
xpen
ses
( 62
075
029)
Gen
eral
& a
dm
inis
trat
ive
exp
ense
( 46
817
705)
Oth
er o
per
atin
g ex
pen
ses
( 27
881
108)
Bo
ard
of D
irec
tors
rem
uner
atio
ns(
319
464)
Oth
er o
per
atin
g p
rofit
25
027
973
Pro
fits
re
sult
s fr
om
op
era
tio
n 2
34
474
359
Div
iden
ds
fro
m in
vest
men
ts a
vaila
ble
fo
r sa
le 2
40
9 93
1
The
gro
up’s
sha
re in
the
net
pro
fit o
f ass
oci
ate
com
pan
ies
5 6
19 9
79
Gai
n fr
om
sal
e o
f ava
ilab
le-f
or-
sale
inve
stm
ents
2 0
93 6
26
Fin
ance
exp
ense
s &
inte
rest
s( 5
6 46
8 16
7)
Net
pro
fit
for
the
yea
r b
efo
re in
co
me
tax
18
8 12
9 72
8
Inco
me
tax
pro
visi
on
( 11
423
656
)
Def
erre
d t
ax(
9 08
6 84
6)
Net
pro
fit f
or
the
year
aft
er in
com
e ta
x 1
67 6
19 2
26
Oth
er In
form
atio
ns
De
pre
cia
tio
n 6
178
062
8
040
64
3 8
107
54
8 1
9 81
6 8
36
3 6
16 4
76
92
45
8-
45
852
023
ass
ets
427
436
04
8 4
18 2
76 6
99
28
3 04
7 21
3 4
52 5
27 2
14
94
151
659
5 2
47 1
58
-1
68
0 6
85
991
lia
bili
tie
s 1
89 8
43
545
1
94 0
70 3
29
133
13
4 95
0 2
21 9
81 9
40
45
987
105
1
272
550
-
78
6 29
0 41
9
cai
ro P
oul
try
co
mp
any
N
otes
to
cons
olid
ated
fina
ncia
l sta
tem
ents
fo
r fin
anci
al y
ear
end
ed 3
1 D
ecem
ber
200
9
6-2
seg
men
tati
on
rep
ort
s fo
r th
e ye
ar e
nded
31
Dec
emb
er 2
008

46 47
7-1 The cost of land – related to New Cairo poultry Company – includes the sum of LE 232 295, L.E 65 000 represents the value of 5 Acres and 7 Karat, 985 square meter respectively. It was registered during this year. Based upon the final measurement of the land area, total area becomes 3 Acres and 7 Karats.
7-2 The following represents the fixed assets items which were purchased through the group companies based on initial selling contracts, the necessary regulatory procedures for registering and transferring its possession under the company’s name are currently under progress :-
leLand 54 604 384Building & Construction 23 209 976
77 814 360
7-3 The machinery and equipment balance includes LE 10 934 739, representing in the cost for acquiring a treatment line for solid wastes purposes (Cairo processing company), this amount was partially financed by the Ministry of Environment (The project of controlling the industrial pollution- financed by the World Bank-). The amount of LE 1 108 279 equal to 20% of total finance represents a non-refundable grant. Based on the accounting policy no. (3-5), the value of this grant was deducted from cost value of the said treatment line.
7-4 The building caption includes the amount of L.E 2 247 812 represents total finance cost capitalized to this caption until the balance sheet date.
7-5 The machinery and equipment caption includes the amount of L.E 2 972 379 represents total finance cost capitalized to this caption until the balance sheet date.
8- Breeders31/12/2009
le31/12/2008
le
costBeginning of the year 272 621 939 196 767 961
Additions for the year 138 505 527 104 737 417
Disposals for the year (Breeders – grand parents & raising expenses)
( 39 193 032) (28 883 439)
At year end 371 934 434 272 621 939
accumulated amortization Beginning of the year 224 692 015 153 755 517
Amortization for the year 109 547 715 80 970 022
Disposals amortization ( 21 346 505) (10 033 524)
At year end 312 893 225 224 692 015
net book value as at 31 December 2009 59 041 209 47 929 924
9- Plant Wealth31/12/2009
le31/12/2008
lecost as at 1 jan 2009Transfer from project for the year 10 686 878 -Cost at 31 December 2009 10 686 878 -less
Wealth amortization 207 649 -Net book value as at 31 December 2009 10 479 229 -
10- Projects under construction31/12/2009
le31/12/2008
le
Buildings & construction in progress 55 115 044 45 502 573Machinery & Equipment under installation 29 642 933 20 155 732Advance payments for fixed assets acquisition 11 629 367 25 711 467L/Cs for purchasing fixed assets 4 134 855 15 824 946Plant life stock – land reclamation - 11 229 481
100 522 199 118 424 199
cai
ro P
oul
try
co
mp
any
N
otes
to
cons
olid
ated
fina
ncia
l sta
tem
ents
fo
r fin
anci
al y
ear
end
ed 3
1 D
ecem
ber
200
9 la
nd
s l
.eB
uild
ing
sl
.e
mac
hin
ery
&e
qu
ipm
en
tl
.e
ve
hic
les
& m
ean
s o
f tr
an
spo
rta
tio
nl
.e
Too
ls a
nd
eq
uip
me
nt
l.e
Furn
itu
re &
offi
ce
sup
plie
sl
.eTo
tal
l.e
Co
st a
s at
1 J
anua
ry 2
008
92
296
848
201
699
466
311
662
014
68
595
255
31
257
764
17
524
380
723
035
727
Ad
diti
ons
dur
ing
the
year
138
885
1
24 2
76 1
18 1
53 3
80 6
32 1
9 68
5 71
3 6
396
369
4 3
37 1
12 3
08 2
14 8
29
Acq
uire
d fi
xed
ass
et 1
3 70
9 33
9 5
981
654
3 6
48 5
85-
19
615
23
128
23
382
321
Dis
po
sals
dur
ing
the
year
-(
27 9
27)
( 9
6 74
3)( 1
103
586
)(
55 2
20)
( 65
966
)( 1
349
442
)
Ba
lan
ce
as
at
31 D
ec
em
be
r 20
08 1
06
145
072
331
929
311
468
594
48
8 8
7 17
7 38
2 3
7 61
8 52
8 2
1 81
8 65
41
053
283
435
Ad
just
men
t-
-(
11
184
)(
28
00
0)-
-(
39 1
84)
Ad
diti
ons
dur
ing
the
year
3
02 6
66
84
859
768
65 5
34 3
05
6
447
391
4
783
828
3
493
561
165
421
519
Dis
po
sals
dur
ing
the
year
-(
3 44
2 9
20)
( 8
249
130
)(
2 22
3 4
75)
( 4
891
905
)(
1 67
8 9
05)
( 20
486
335)
co
st a
s a
t 31
De
ce
mb
er
2009
10
6 44
7 73
8 4
13 3
46 1
59 5
25 8
68 4
79 9
1 37
3 29
8 3
7 51
0 45
1 2
3 63
3 31
01
198
179
435
la
nd
l
.eB
uild
ing
sl
.e
mac
hin
ery
&e
qu
ipm
en
tl
.e
ve
hic
les
& m
ean
s o
f tr
an
spo
rta
tio
nl
.e
Too
ls a
nd
eq
uip
me
nt
l.e
Furn
itu
re &
offi
ce
sup
plie
sl
.eTo
tal
l.e
Acc
umul
ated
dep
reci
atio
n as
at
1/1/
2008
- 5
7 21
3 23
5 1
59 8
19 2
98 4
1 89
8 97
4 2
3 26
7 81
4 1
2 77
0 48
6 2
94 9
69 8
07
Dep
reci
atio
n of
the
yea
r-
8 2
10 2
87 2
4 05
5 27
0 8
850
385
3 1
47 9
27 1
588
154
45
852
023
Dep
reci
atio
n of
acq
uire
d fi
xed
ass
ets
1 4
00
540
2 0
39 4
71-
15
870
15
903
3 4
71 7
84
Dis
po
sals
of t
he y
ear
-(
7 97
9)(
4 20
6)(
838
712)
( 36
232
)(
50 5
60)
( 93
7 68
9)
acc
um
ula
ted
dep
reci
atio
n as
at 3
1/12
/200
8-
66
816
083
185
909
833
49
910
647
26
395
379
14
323
983
343
355
925
Ad
just
men
t-
( 1
1 1
84)
( 2
8 0
00)
--
( 39
184
)
Dep
reci
atio
n of
the
yea
r-
11
256
139
32
450
845
10 6
12 0
26
3
516
481
2
127
421
59
962
912
Dis
po
sals
of t
he y
ear
-( 2
420
969
)(
5 77
7 2
30)
( 1
182
239
)(
4 75
4 3
88)
( 1
585
554
)( 1
5 72
0 38
0)
acc
um
ula
ted
dep
reci
atio
n as
at 3
1/12
/200
9-
75
651
253
212
572
264
59
312
434
25
157
472
14
865
850
387
559
273
net
bo
ok
valu
e a
s a
t 31
/12
/20
09 1
06
447
738
337
694
90
6 3
13 2
96
215
32
060
864
12
352
979
8 7
67 4
60 8
10 6
20 1
62
net
bo
ok
valu
e a
s a
t 31
/12
/20
08 1
06
145
072
265
113
228
282
68
4 65
5 3
7 26
6 73
5 1
1 22
3 14
9 7
494
671
709
927
510
7 -
Pro
per
ty, p
lant
and
eq
uip
men
t

48 49
(*) T
he C
omp
any
Cai
ro F
eed
Ingr
edie
nts
Trad
ing
is t
emp
orar
ily in
activ
e ac
cord
ing
to b
oard
of d
irect
or d
ecis
ion
dat
ed 2
1 Fe
bru
ary
2007
.
co
un
try
of
est
ab
lish
me
nt
nu
mb
er
of
pu
rch
ase
d
sha
res
Pa
rtic
ipa
tio
n p
erc
en
tag
e%
no
min
al
valu
e p
er
sha
rel
e
inve
ste
e n
om
ina
lva
lue
as
at
31/1
2/2
00
9l
e
Pe
rce
nta
ge
pa
idu
p t
ill31
/12
/20
09
%
inve
stm
en
t va
lue
as
at
31/1
2/2
00
9l
e
in
vest
me
nt
va
lue
as
at
31/1
2/2
00
8l
e
a -
inve
stm
en
ts o
f c
air
o p
ou
ltry
co
mp
an
y
(Th
e p
are
nt
co
mp
an
y)
(*)
Cai
ro F
eed
Ing
red
ient
s Tr
adin
gE
gyp
t 4
2 0
00
84 1
00
4 20
0 0
00
251
050
00
0 1
050
00
0
Tota
l4
200
00
0 1
050
00
0 1
050
00
0
B -
inve
stm
en
ts o
f c
air
o m
isr
po
ult
ry g
ran
d
pa
ren
t (s
ub
sid
iary
)
Cai
ro F
eed
Ing
red
ient
s Tr
adin
gE
gyp
t50
05
100
50
00
0 25
12
500
12
500
Wad
i Al -
Nat
ron
for
Ag
ricu
ltura
l Dev
elo
pm
ent
Eg
ypt
501
100
5 0
00
25 1
250
1
250
Wad
i Al -
Nat
ron
for
land
rec
lam
atio
n E
gyp
t50
110
0 5
00
0 25
1 2
50
1 2
50
Cai
ro c
om
pan
y fo
r la
nd r
ecla
mat
ion
Eg
ypt
501
100
5 0
00
25 1
250
1
250
Cai
ro C
om
pan
y fo
r A
gri
cultu
ral D
evel
op
men
tE
gyp
t50
110
0 5
00
0 25
1 2
50
1 2
50
Al -
Fra
fra
for
Ag
ricu
ltura
l dev
elo
pm
ent
Eg
ypt
501
100
5 0
00
25 1
250
1
250
Tota
l 7
5 0
00
18
750
18
750
c-
inve
stm
en
ts in
new
ca
iro
Po
ult
ry c
om
pa
ny
(su
bsi
dia
ry)
Wad
i Al -
Nat
ron
for
land
rec
lam
atio
n E
gyp
t50
110
0 5
00
0 25
1 2
50
1 2
50
Wad
i Al -
Nat
ron
for
Ag
ricu
ltura
l Dev
elo
pm
ent
Eg
ypt
501
100
5 0
00
25 1
250
1
250
Cai
ro c
om
pan
y fo
r la
nd r
ecla
mat
ion
Eg
ypt
501
100
5 0
00
25 1
250
1
250
Cai
ro C
om
pan
y fo
r A
gri
cultu
ral D
evel
op
men
tE
gyp
t50
110
0 5
00
0 25
1 2
50
1 2
50
Al -
Fra
fra
for
Ag
ricu
ltura
l dev
elo
pm
ent
Eg
ypt
501
100
5 0
00
25 1
250
1
250
Tota
l 2
5 0
00
6 2
50 6
250
D-
inve
stm
en
ts o
f c
air
o P
ou
ltry
pro
ce
ssin
g (s
ub
-si
dia
ry)
Cai
ro T
rad
ing
& Im
po
rtin
g C
om
pan
yE
gyp
t51
00
5110
0 5
10 0
00
25 1
27 5
00
127
50
0
Ba
lan
ce
as
at
31/1
2/2
00
9 4
810
00
0 1
202
50
0 1
202
50
0
cai
ro P
oul
try
co
mp
any
N
otes
to
cons
olid
ated
fina
ncia
l sta
tem
ents
fo
r fin
anci
al y
ear
end
ed 3
1 D
ecem
ber
200
9
11-
Oth
er fi
nanc
ial i
nves
tmen
ts
12-
inve
stm
ent
in a
sso
ciat
es
co
un
try
of
est
ab
lish
me
nt
nu
mb
er
of
pu
rch
ase
d
sha
res
Pa
rtic
ipa
tio
n p
erc
en
tag
e%
no
min
al v
alu
e p
er
sha
rel
e
inve
ste
e
no
min
al
valu
e a
s a
t12
/31/
2009
le
Pe
rce
nta
ge
pa
id u
p t
ill12
/31/
2009
%
Th
e va
lue
of
inve
stm
en
t ac
co
rdin
g t
o e
qu
ity
met
ho
d
as
at
12/3
1/20
09l
e
as
at
12/3
1/20
08l
e
Cai
ro C
om
pan
y fo
r S
tarc
h &
Glu
cose
ind
ustr
yE
gyp
t 8
413
533
27.2
310
84
135
330
100
85
741
248
103
402
856
Eg
yptia
n C
om
pan
y fo
r S
tarc
h &
Glu
cose
ind
ustr
y 2
897
105
2 3
40 7
12
Tota
l va
lue
of
inve
stm
en
t in
su
bsi
dia
rie
s a
s a
t
De
ce
mb
er
31, 2
009
88
638
353
105
743
568
cai
ro P
oul
try
co
mp
any
N
otes
to
cons
olid
ated
fina
ncia
l sta
tem
ents
fo
r fin
anci
al y
ear
end
ed 3
1 D
ecem
ber
200
9
Pa
rtic
ipa
tio
n p
erc
en
tag
e%
Fix
ed
ass
ets
le
cu
rre
nt
ass
ets
le
Tota
la
sset
sl
ec
urr
en
tlia
bili
tie
s l
e
lo
ng
te
rmlia
bili
tie
sl
e
Tota
llia
bili
tie
sl
er
eve
nu
es
le
exp
en
ses
le
Pro
fit
for
co
nso
lida
ted
pe
rio
dl
e
Gro
up
sh
are
of
sist
er
co
mp
an
ies
net
pro
fit
le
Dir
ect
par
ticip
atio
n (2
6.01
%),
Ind
irec
t p
artic
ipat
ion
(1.2
2%)
27.2
3 4
27 4
77 0
66 8
7 13
1 14
3 5
14 6
08 2
09
161
968
891
35
665
728
197
634
619
239
295
901
237
253
352
2 0
42 5
49 9
90
478
A b
rief
of
fina
ncia
l sta
tem
ents
of
Eg
ypti
an C
om
pan
y fo
r S
tarc
h &
Glu
cose
ind
ustr
y
* In
vest
men
t in
Cai
ro C
omp
any
for
Sta
rch
and
Glu
cose
Ind
ustr
y w
as c
onsi
der
ed a
s in
vest
men
ts in
ass
ocia
te c
omp
any
as t
hat
com
pan
y is
a s
ubsi
dia
ry fo
r E
gyp
tian
Com
pan
y fo
r S
tarc
h &
Glu
cose
ind
ustr
y.

50 51
na
me
of
the
co
mp
an
y
inve
stm
en
t c
ost
a
t 1/
1/20
09l
eD
isp
osa
ll
e
Tota
l in
vest
me
nt
co
st a
s a
t12
/31/
2009
le
imp
air
me
nt
in t
he
valu
e o
f in
vest
me
nt
as
at
31/1
2/2
009
le
net
bo
ok
va
lue
of
inve
stm
en
t a
s a
t 31
/12
/20
09l
e
inve
stm
en
tsev
alu
ati
on
dif
fere
nc
es
at
31/1
2/2
009
le
net
bo
ok
va
lue
of
inve
stm
en
t a
s a
t 31
/12
/20
08l
e
Ava
ilab
le-f
or-
sale
inve
stm
ents
Fir
st: q
uo
ted
inve
stm
en
ts (w
ith
acti
ve m
ark
et)
Nat
iona
l Dev
elo
pm
ent
Ban
k 9
80 5
29-
980
529
( 41
6 45
5) 5
64 0
74 (
416
455)
495
121
Eg
yptia
n K
uwai
ti H
old
ing
78 3
20 3
66-
78 3
20 3
6613
4 70
8 29
421
3 02
8 66
013
4 70
8 29
414
1 34
7 92
7
se
co
nd
: un
qu
ote
d in
vest
me
nts
The
co
op
erat
ive
Eg
yptia
n p
rod
uctiv
e so
ciet
y fo
r th
e ow
ners
of
fod
der
fac
tori
es in
Kal
youb
ia 1
0 0
00
- 1
0 0
00
- 1
0 0
00
10
00
0
Mo
der
n E
gyp
t Tr
ansp
ort
Co
mp
any
1 42
8 0
00
-1
428
00
0(1
428
00
0)-
-
80
738
895
-8
0 73
8 89
513
2 86
3 83
921
3 60
2 73
4 1
34 2
91 8
3914
1 85
3 04
8
na
me
of
the
co
mp
an
yc
ou
ntr
y o
fe
sta
blis
hm
en
t
nu
mb
er
of
pu
rch
ase
d s
ha
res
Pa
rtic
ipa
tio
n p
erc
en
tag
e%
no
min
al
valu
e p
er
sha
rel
ec
urr
en
cy
Fair
va
lue
12/3
1/20
09l
e
inve
ste
e n
om
ina
l va
lue
pe
r sh
are
at
31/1
2/2
009
le
Pe
rce
nta
ge
pa
id%
Ava
ilab
le-f
or-
sale
inve
stm
ents
Fir
st: q
uo
ted
inve
stm
en
ts (w
ith
acti
ve m
ark
et)
Nat
iona
l Dev
elo
pm
ent
Ban
kE
gyp
t 9
5 76
8-
10LE
5.89
980
529
10
0
Eg
yptia
n K
uwai
ti H
old
ing
Eg
ypt
19 7
59 9
593.
350.
25U
.S.$
1.97
10
0
se
co
nd
: un
qu
ote
d in
vest
me
nts
The
co
op
erat
ive
Eg
yptia
n p
rod
uctiv
e so
ciet
y fo
r th
e ow
ners
of
fod
der
fac
tori
es in
Kal
youb
iaE
gyp
t 1
00
0-
10
LE 1
0 1
0 0
00
10
0
Mo
der
n E
gyp
t Tr
ansp
ort
Co
mp
any
Eg
ypt
4 2
00
- 1
00
LE-
420
00
0 1
00
1 41
0 52
9
13-
oth
er in
vest
men
ts
oth
er in
vest
men
ts -
co
ntin
ued
cai
ro P
oul
try
co
mp
any
N
otes
to
cons
olid
ated
fina
ncia
l sta
tem
ents
fo
r fin
anci
al y
ear
end
ed 3
1 D
ecem
ber
200
9
14- Payments for purchase investments in subsidiaries investments in subsidiaries
investments in available-for-sale companies31/12/2009
le31/12/2008
le
Payments under the purchase of Almadina Co. and Altalaea Co. - Sole proprietorship – the possession of these companies had not been transferred under the buyer company (Cairo Breeds Processing – Subsidiary) until the consolidated balance sheet date.
8 540 000 8 540 000
8 540 000 8 540 000
15- inventory
31/12/2009le
31/12/2008le
Raw materials 88 506 269 122 330 275
Spare parts & supplies 54 881 071 42 125 165
Packing material 11 910 353 9 845 637
Work in process 29 356 026 52 242 625
Finished goods 91 074 514 90 083 002
275 728 233 316 626 704
L.C’s for purchasing raw materials & supplies 850 919 32 022 456
Consignment goods with others 3 327 371 -
Goods in transit 6 716 909 -
Write down of inventory - (25 762 067)
286 623 432 322 887 093
16- Trade receivables and other debit balances16-1
31/12/2009le
31/12/2008le
Trade receivables 91 101 239 97 551 107Impairment in trade receivables (49 642 406) (46 075 388)
41 458 833 51 475 719Notes receivable 8 717 458 15 188 469
50 176 291 66 664 188Suppliers – advance payments 20 588 740 29 713 658Tax Authority – withholding tax 16 101 574 13 240 260Other debit balances 11 063 136 12 491 428Accrued revenues 1 522 885 1 993 103Prepaid expenses 3 395 322 6 559 923L/G’s margin 325 073 1 265 668Deposits with others 1 081 023 673 598Employees imprests 56 450 410 049Customs authority 699 730 -
54 833 933 66 347 687Impairment in debtors & other debit balances (808 863) (770 570)
104 201 361 132 241 305

52 53
16-2 impairment in receivables
31/12/2009le
31/12/2008le
Balance at beginning of the year 46 075 388 48 117 549
Formed during the year 6 069 618 660 000
Provisions no longer required ( 2 344 113) (1 854 335)
Utilized during the year (158 487) (847 826)
Balance at the year end 49 642 406 46 075 388
17- other Financial investments
31/12/2009le
31/12/2008le
Treasury bills - 11 374 728
Investment fund certificates of the CIB Bank - 13 677
- 11 388 405
18- cash at Banks & on hand
31/12/2009le
31/12/2008le
Banks - time deposits * 2 125 198 6 191 558
Banks - current accounts 9 513 471 19 254 172
Checks under collection 3 392 848 601 176
Cash on hand 1 032 017 1 340 065
16 063 534 27 386 971
* Banks – time deposits represents in banks deposits at banks that is not exceed three months period.
18-1 For the purpose of preparing the cash flow statement the item cash & cash equivalents represented as follows:
31/12/2009le
31/12/2008le
Cash at banks & on hands 16 063 534 27 386 971
less:
Overdraft (74 442 790) (142 179 057)
Checks under collection (3 392 848) (601 176)
(61 772 104) (115 393 262)
19- Provision for contingencyThis item is represented in the amounted of LE 21 160 530 at 31/12/2009 against (L.E 6 762 390 at 31/12/2008) in the provision formed to encounter the current crisis resulted from the birds flu.
20- Provision for claims
31/12/2009le
31/12/2008le
Balance at the beginning of the year 26 675 336 27 815 440
Formed during the year 9 105 889 2 087 100
Transfer from credit balance 267 634 -
Used during the year (1 652 572) (3 227 204)
Not longer required for the year (200 000) -
Balance at year end 34 196 287 26 675 336
21- Banks – credit FacilitiesThis item amounting to L.E 112 467 144 (against to L.E 353 672 896 at 31/12/2008) is represented in the value of the used portion of the bank facilities granted by banks dealing with the company amounted to LE 459 million at an average interest rate between 9% and 10% annually on facilities granted in the Egyptian currency obtained by the company with regard to these facilities granted in U.S. Dollars the interest rate is varying between 1% and 2.5% annually in addition to the libor including the commission of the highest debit balance for various guarantees that the banks obtained for the facilities were granted to the group.
22- Trade payables and other credit Balances
31/12/2009le
31/12/2008le
Suppliers & contractors 60 802 478 43 790 170
Notes Payable 4 649 038 9 996 866
Customers – credit balances 6 806 505 7 844 709
Other credit balances 12 898 573 16 568 901
Accrued expenses 20 225 569 13 133 341
Tax Authority 3 329 404 3 843 561
Creditors - fixed assets acquisition - 611 497
Deposits to others 6 541 536 4 401 868
Income tax for the year 6 867 240 11 423 656
Installments of sales tax due within one year 1 072 702 804 646
Employees Dividends payable 603 019 1 514 436
Shareholders’ Dividends payable 184 411 162 738
Social insurance Authority 1 380 904 2 964 577
Employees and service fund 637 362 369 282
Advanced revenue 704 989 -
Early retirement * 4 075 019 -
130 778 749 117 430 248
* The board of directors had authorized meeting no. (1) dated 10/1/2009, the employees retirement system against payments for employees in region El-Saff.
23- capital23-1 authorized capitalThe Company’s authorized capital is determined to be LE 1 000 000 000 (One Billion Egyptian Pound).
23-2 issued and paid up capitalThe Company’s issued and fully paid up capital in the amount of LE 145.152 million is distributed over 72.576 million shares at a nominal value of LE 2 each.
24- special reserve – change in value of investments available for sale
notes no
31/12/2009le
31/12/2008le
The balance at the beginning of the year 62 542 153 163 627 770
add:
Change in value of investments available for sale at year end 71 749 686 (101 085 617)
Balance at the end of the year (13-2) 134 291 839 62 542 153
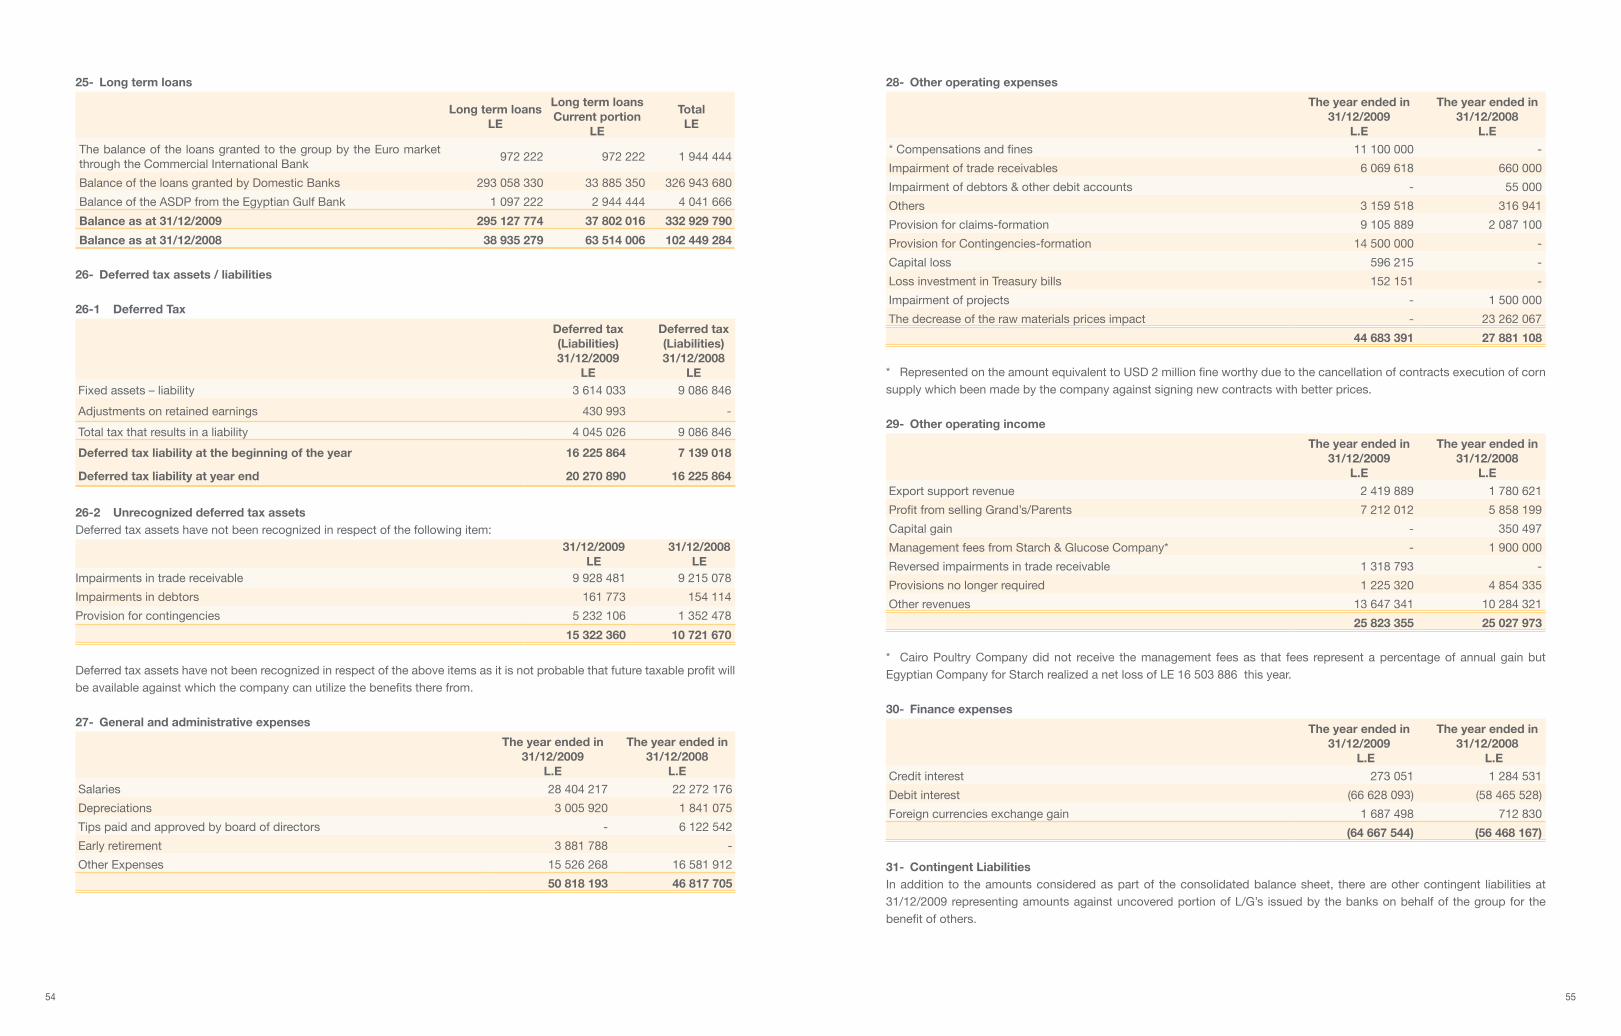
54 55
25- long term loans
long term loansle
long term loanscurrent portion
le
Totalle
The balance of the loans granted to the group by the Euro market through the Commercial International Bank
972 222 972 222 1 944 444
Balance of the loans granted by Domestic Banks 293 058 330 33 885 350 326 943 680
Balance of the ASDP from the Egyptian Gulf Bank 1 097 222 2 944 444 4 041 666
Balance as at 31/12/2009 295 127 774 37 802 016 332 929 790
Balance as at 31/12/2008 38 935 279 63 514 006 102 449 284
26- Deferred tax assets / liabilities
26-1 Deferred Tax
Deferred tax(liabilities)31/12/2009
le
Deferred tax(liabilities)31/12/2008
leFixed assets – liability 3 614 033 9 086 846
Adjustments on retained earnings 430 993 -
Total tax that results in a liability 4 045 026 9 086 846
Deferred tax liability at the beginning of the year 16 225 864 7 139 018
Deferred tax liability at year end 20 270 890 16 225 864
26-2 unrecognized deferred tax assets Deferred tax assets have not been recognized in respect of the following item:
31/12/2009le
31/12/2008le
Impairments in trade receivable 9 928 481 9 215 078
Impairments in debtors 161 773 154 114
Provision for contingencies 5 232 106 1 352 478
15 322 360 10 721 670
Deferred tax assets have not been recognized in respect of the above items as it is not probable that future taxable profit will be available against which the company can utilize the benefits there from.
27- General and administrative expenses
The year ended in31/12/2009
l.e
The year ended in31/12/2008
l.e
Salaries 28 404 217 22 272 176
Depreciations 3 005 920 1 841 075
Tips paid and approved by board of directors - 6 122 542
Early retirement 3 881 788 -
Other Expenses 15 526 268 16 581 912
50 818 193 46 817 705
28- other operating expenses
The year ended in31/12/2009
l.e
The year ended in31/12/2008
l.e
* Compensations and fines 11 100 000 -
Impairment of trade receivables 6 069 618 660 000
Impairment of debtors & other debit accounts - 55 000
Others 3 159 518 316 941
Provision for claims-formation 9 105 889 2 087 100
Provision for Contingencies-formation 14 500 000 -
Capital loss 596 215 -
Loss investment in Treasury bills 152 151 -
Impairment of projects - 1 500 000
The decrease of the raw materials prices impact - 23 262 067
44 683 391 27 881 108
* Represented on the amount equivalent to USD 2 million fine worthy due to the cancellation of contracts execution of corn supply which been made by the company against signing new contracts with better prices.
29- other operating income
The year ended in31/12/2009
l.e
The year ended in31/12/2008
l.e
Export support revenue 2 419 889 1 780 621
Profit from selling Grand’s/Parents 7 212 012 5 858 199
Capital gain - 350 497
Management fees from Starch & Glucose Company* - 1 900 000
Reversed impairments in trade receivable 1 318 793 -
Provisions no longer required 1 225 320 4 854 335
Other revenues 13 647 341 10 284 321
25 823 355 25 027 973
* Cairo Poultry Company did not receive the management fees as that fees represent a percentage of annual gain but Egyptian Company for Starch realized a net loss of LE 16 503 886 this year.
30- Finance expenses
The year ended in31/12/2009
l.e
The year ended in31/12/2008
l.e
Credit interest 273 051 1 284 531
Debit interest (66 628 093) (58 465 528)
Foreign currencies exchange gain 1 687 498 712 830
(64 667 544) (56 468 167)
31- contingent liabilitiesIn addition to the amounts considered as part of the consolidated balance sheet, there are other contingent liabilities at 31/12/2009 representing amounts against uncovered portion of L/G’s issued by the banks on behalf of the group for the benefit of others.

56 57
In addition to the uncovered part of letter of credits existent at year end, the following are contingent liabilities:-
31/12/2009le
31/12/2008le
Letters of guarantee 5 112 556 5 228 138
Letters of Credits 6 607 910 38 664 865
Guarantees for credit facilities granted to subsidiaries 598 038 000 515 357 000
609 758 466 559 250 003
32- capital commitmentThe company’s contribution in investments in subsidiaries and other investments which are not due till the consolidated balance sheet date amounted to LE 4 725 000.
33- Group companiesThe following represents subsidiaries of Cairo Poultry Company that are acquired and controlled by the Company as at 31/12/2009 demonstrated alongside with its contribution percentage held as at the balance sheet date
subsidiary name contribution Percentage country
New Cairo Poultry Company 96.82 % Egypt
Cairo Poultry Processing 99.97 % Egypt
Misr Grand Parents Co. 94.76 % Egypt
Cairo Grand Parents Co. 96.42 % Egypt
Cairo Feed Company 99.97 % Egypt
Cairo Broilers Company 99.97 % Egypt
Cairo Misr Grand Parents Co. 95.10 % Egypt
Corporation Guard Services 67.33 % Egypt
Cairo for Oil Extraction 99.92 % Egypt
Cairo Leasing Company 99.92 % Egypt
Cairo Cold Stores 99.92 % Egypt
Wadi Al Natron for Parent Company 98.97 % Egypt
Wadi Al Natron for Broilers Production Co. 99.92 % Egypt
New Cairo Grand Parents Co. 99.92 % Egypt
Wadi Al Natron for Grand Parent Company 99.92 % Egypt
Cairo Reyer Eggs Company 99.36 % Egypt
(*) Cairo Feed Trading 84.95 % Egypt
(**) Cairo for trading and importing 50.98 % Egypt
El Ahd Elgded 99.96 % Egypt
(*) Cairo Feed Ingredients Trading was temporarily discontinued from practicing its trading activities according to the decision of the board of director dated February 21, 2007.(**) Net assets of Cairo for trading and importing Company as at 31 December 2009 amounted L.E 25 249.- The companies referred to above have been audited by other auditors. Its financial statements represent 21.54% of total consolidated assets , 19,66% of total consolidated liabilities, 31.02% of total consolidated revenue, and 28.94% of total consolidated expenses for the year ended 31 December 2009.- The Group’s management is of the opinion that there is no necessity to consolidate the above mentioned companies whether it is solely or consolidated as its effect will not be significant to the consolidated balance sheet either on group performance or on its cash flows at that date.
acquisition costs l.eThe group’s share in proportion to their contribution to the net profits of subsidiary companies
214 251 161
The group’s share in the net profits of associates companies 990 478
Total 215 241 648
34- related parties transaction
The related parties are represented in the shareholders of the Company and the Companies in which they directly own shares on it, which gives them a significant influences or great control over these companies. The following presents a brief summary of important transactions made between the Company and its related parties during the year:
name of the company nature of transactions
Balance as at 31/12/2009
le
Balance as at 31/12/2008
le
34-1 Due from related Parties
The Egyptian Company for Starch & Glucose Materials Purchases 3 720 839 24 381 423 20 697 845
Materials sales 7 846 826
Materials imprest 4 561 754
Americana Kuwait Meet sector Frozen chicken sales 13 649 579 6 167 009 6 606 676
Americana Kuwait restaurants sector Frozen chicken sales 1 439 803 250 657 588 198
Americana Egypt for Stores & Cool Stores Current - 3 500 -
Cairo feed ingredients trading Payment of expenses on behalf of the company
1 519 916 151 916 -
New Cairo trading & importing company Payment of expenses on behalf of the company
1 045 755 366 565 1 019 639
Befi Frozen chicken sales 8 975 - 98 432
Egyptian Company for touristic projects Sales 131 289 835 33 396 939 22 286 019
National feed Company - Geddah Sales 61 342 - 60 215
Al-Madina Sales 7 862 224 3 429 672 1 620 246
Altalaea Sales 7 163 702 232 488 184 199
Americana group for food and beverages 4 587 -
68 384 756 53 161 469
34-2 Due to related Parties
Farm Frites Company Materials Purchases 3 522 679 670 161 234 000
Cairo feed ingredients trading - - 10 000
Americana Egypt for Stores & Cool Stores - - 2 330
Americana group for food and beverages Current 5 028 6 075 9 104
Kuwaiti Food Company Current 245 022 3 983 045 2 936 728
Green Land - - 6 803
Kuwaiti holding Company Current 123 465 129 469 -
Kuwaiti Company - main office - 1 127 -
4 789 877 3 198 965
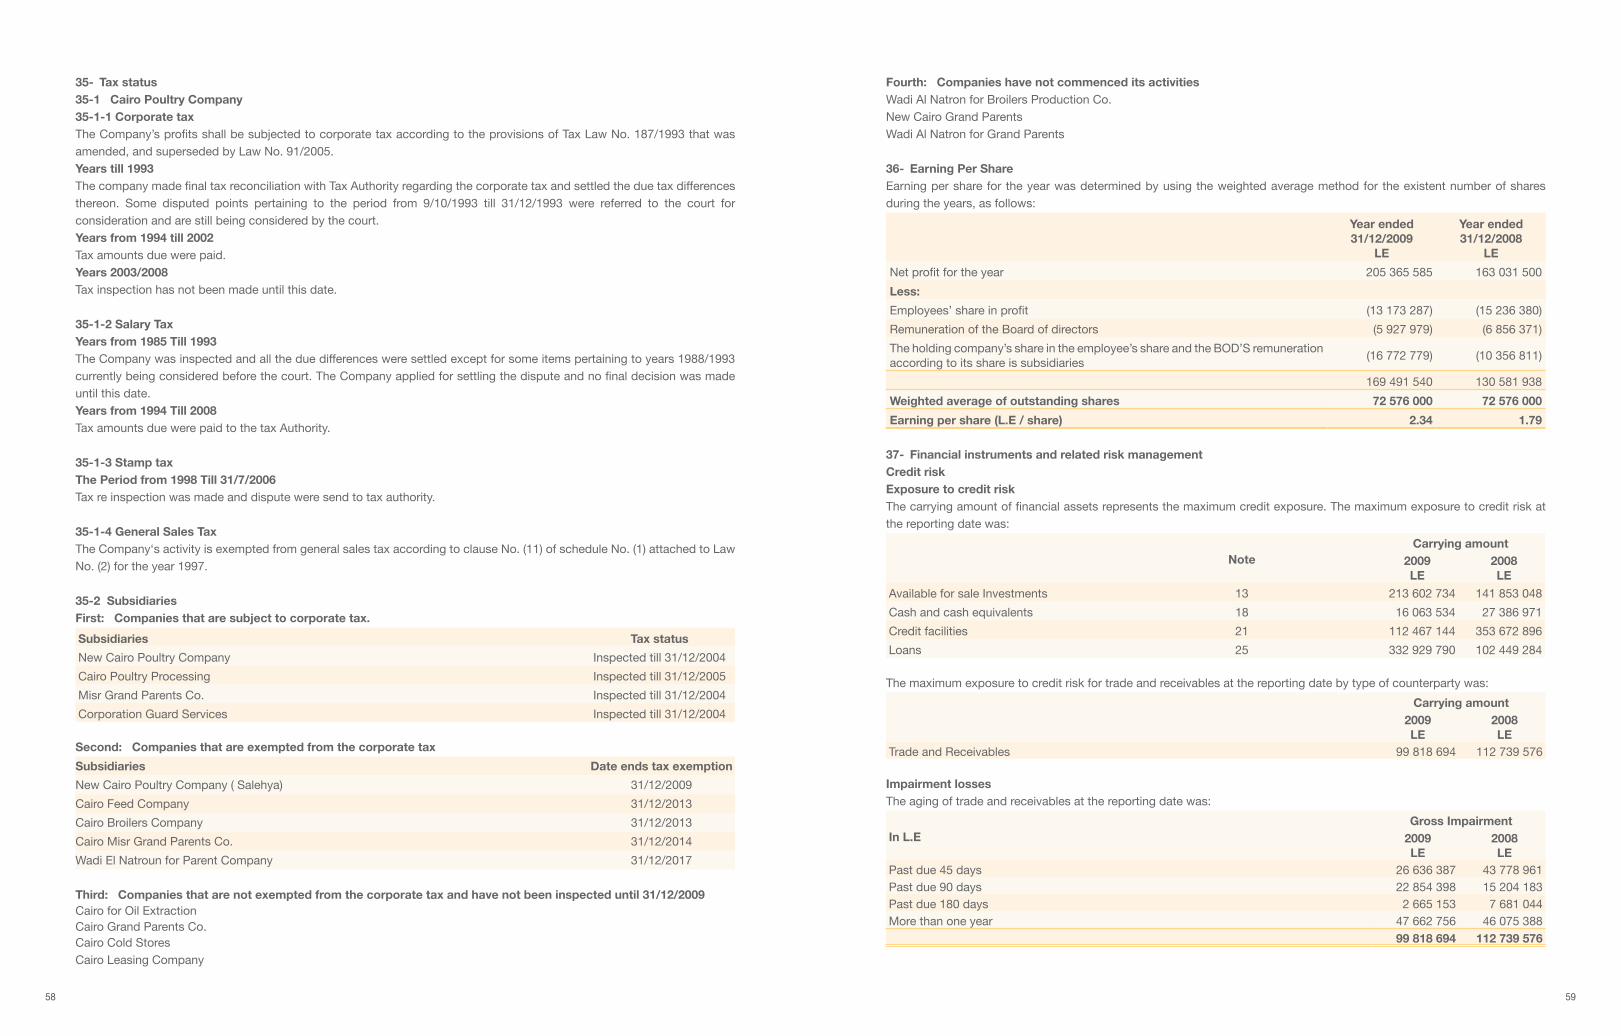
58 59
35- Tax status35-1 cairo Poultry company35-1-1 corporate taxThe Company’s profits shall be subjected to corporate tax according to the provisions of Tax Law No. 187/1993 that was amended, and superseded by Law No. 91/2005.years till 1993The company made final tax reconciliation with Tax Authority regarding the corporate tax and settled the due tax differences thereon. Some disputed points pertaining to the period from 9/10/1993 till 31/12/1993 were referred to the court for consideration and are still being considered by the court.years from 1994 till 2002 Tax amounts due were paid.years 2003/2008Tax inspection has not been made until this date.
35-1-2 salary Taxyears from 1985 Till 1993The Company was inspected and all the due differences were settled except for some items pertaining to years 1988/1993 currently being considered before the court. The Company applied for settling the dispute and no final decision was made until this date.years from 1994 Till 2008Tax amounts due were paid to the tax Authority.
35-1-3 stamp taxThe Period from 1998 Till 31/7/2006Tax re inspection was made and dispute were send to tax authority. 35-1-4 General sales TaxThe Company‘s activity is exempted from general sales tax according to clause No. (11) of schedule No. (1) attached to Law No. (2) for the year 1997.
35-2 subsidiariesFirst: companies that are subject to corporate tax.
subsidiaries Tax status
New Cairo Poultry Company Inspected till 31/12/2004
Cairo Poultry Processing Inspected till 31/12/2005
Misr Grand Parents Co. Inspected till 31/12/2004
Corporation Guard Services Inspected till 31/12/2004
second: companies that are exempted from the corporate tax
subsidiaries Date ends tax exemption
New Cairo Poultry Company ( Salehya) 31/12/2009
Cairo Feed Company 31/12/2013
Cairo Broilers Company 31/12/2013
Cairo Misr Grand Parents Co. 31/12/2014
Wadi El Natroun for Parent Company 31/12/2017
Third: companies that are not exempted from the corporate tax and have not been inspected until 31/12/2009Cairo for Oil ExtractionCairo Grand Parents Co.Cairo Cold StoresCairo Leasing Company
Fourth: companies have not commenced its activitiesWadi Al Natron for Broilers Production Co.New Cairo Grand Parents Wadi Al Natron for Grand Parents
36- earning Per shareEarning per share for the year was determined by using the weighted average method for the existent number of shares during the years, as follows:
year ended31/12/2009
le
year ended31/12/2008
le
Net profit for the year 205 365 585 163 031 500
less:
Employees’ share in profit (13 173 287) (15 236 380)
Remuneration of the Board of directors (5 927 979) (6 856 371)
The holding company’s share in the employee’s share and the BOD’S remuneration according to its share is subsidiaries
(16 772 779) (10 356 811)
169 491 540 130 581 938
Weighted average of outstanding shares 72 576 000 72 576 000
earning per share (l.e / share) 2.34 1.79
37- Financial instruments and related risk managementcredit riskexposure to credit riskThe carrying amount of financial assets represents the maximum credit exposure. The maximum exposure to credit risk at the reporting date was:
notecarrying amount
2009le
2008le
Available for sale Investments 13 213 602 734 141 853 048
Cash and cash equivalents 18 16 063 534 27 386 971
Credit facilities 21 112 467 144 353 672 896
Loans 25 332 929 790 102 449 284
The maximum exposure to credit risk for trade and receivables at the reporting date by type of counterparty was:
carrying amount2009le
2008le
Trade and Receivables 99 818 694 112 739 576
impairment losses The aging of trade and receivables at the reporting date was:
in l.eGross impairment
2009le
2008le
Past due 45 days 26 636 387 43 778 961Past due 90 days 22 854 398 15 204 183Past due 180 days 2 665 153 7 681 044More than one year 47 662 756 46 075 388
99 818 694 112 739 576

60
The allowance accounts in respect of receivables and held-to-maturity investments are used to record impairment losses unless the Company is satisfied that no recovery of the amount owing is possible; at that point the amounts considered irrecoverable and is written off against the financial asset directly. At 31 December 2009 the Company does not have any collective impairment on its receivables or its held-to-maturity investments.
liquidity riskThe following are the contractual maturities of financial liabilities, including estimated interest payments and excluding the impact of netting agreements:
in lecarryingamount
contractual cash flows
Secured bank loans 332 929 790 332 929 790
Credit facilities 112 467 144 112 467 144
currency riskexposure to currency riskThe Group’s exposure to foreign currency risk was as follows based on notional amounts:
31 December 2009 31 December 2008
euro usD GBP euro usD GBP
Cash and cash equivalents 352 - - 26 052 421 149 237
Credit facilities 18 13 142 676 - - 880 268 -
The following significant exchange rates applied during the year:
l.e reporting dateaverage rate closing rate
2009 2008 2009 2008Euro 7.807 8.08 8.06 7.84USD 5.60 5.49 5.50 5.53
38- Comparatives figuresCertain corresponding figures have been reclassified to conform to the current year presentation. The followings are the balances that have been reclassified, along with the reclassified amounts:
Description
31/12/2008Before
Reclassificationle
31/12/2008 after
Reclassificationle
Fixed assets 698 160 689 709 927 510
Goodwill 12 278 497 -
Investments in associates 104 412 153 105 743 568
Other investments 3 602 500 1 202 500
Retained earnings 223 961 382 223 159 511
Minority’s interest share in profit 17 141 109 16 730 191
The group’s share in the net profits of associates companies 5 987 450 5 619 979

Concept and Design Designframe corp www.designframe.netPrinting RAIDY
Overview 1 Highlights 10 Chairman’s Statement 22 Board of Directors 24 Executive Management 26 Financial Review 28

32 H Mourad St., Giza P.O. Box 42 Giza, Egypt
Tel: +(202) 3570 7739 - 3570 7694 Fax: +(202) 3570 7716
www.cpg.com.eg
WH
ATE
VE
R T
HE
CH
ALL
EN
GE
C
PC
AN
NU
AL
RE
PO
RT
2009


