25

What’s New / 2011.1 Data Visualization
JASON BERES : VP, Product Management [email protected] / @jasonberes / @infragistics

Agenda
1 / 2011.1 Packaging
2 / Core Investments
3 / Shared XAML Strategy
4 / New Controls, Features & Frameworks
5 / Resources & Wrap Up
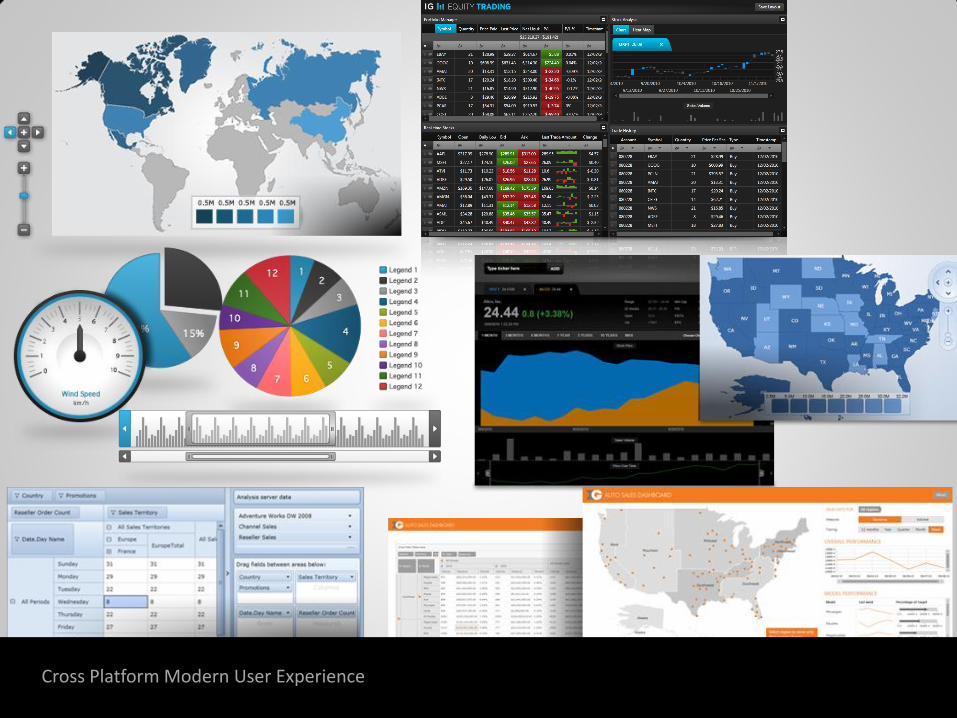
Cross Platform Modern User Experience
Packaging a new way to buy / 9 awesome products / endless opportunities

= 2011 Packaging
All NetAdvantage for .NET products:
NetAdvantage for WPF
NetAdvantage for ASP.NET
NetAdvantage for Silverlight
NetAdvantage for Windows Forms
+ 2 Data Visualization Products NetAdvantage for WPF Data Visualization
NetAdvantage for Silverlight Data Visualization
+ 3 New Products NetAdvantage for jQuery
NetAdvantage for Windows Phone (CTP)
NetAdvantage Reporting (CTP)
+
+

Core Investments RIA Technologies
& Desktop Development
LOB Components for Microsoft Platforms
Depth and Breadth on the XAML Platforms
(Silverlight/WPF)
Single code base for SAML components
Performance, Ease of Use, Styling Quality.
UX Tools & Services Quince Pro- A private, secure and
organized way to collaborate,
communicate and cultivate private
UX design libraries to ensure
consistent user experiences across
your team, department and
company.
Usability, User experiences are key
differentiations driving business
decisions.
Customer satisfaction and branding
are on par with product features
that drive productivity.
Data Visualization XAML Platforms
Dashboards & Reporting
Performance, Ease of Use, Styling Quality
Help businesses make better decisions
TestAdvantage Enterprise level testing capabilities
Higher quality product through test
automation
Reduce the need for cost of manual testing
Increase productivity with the time savings
as the testing stage finishes faster
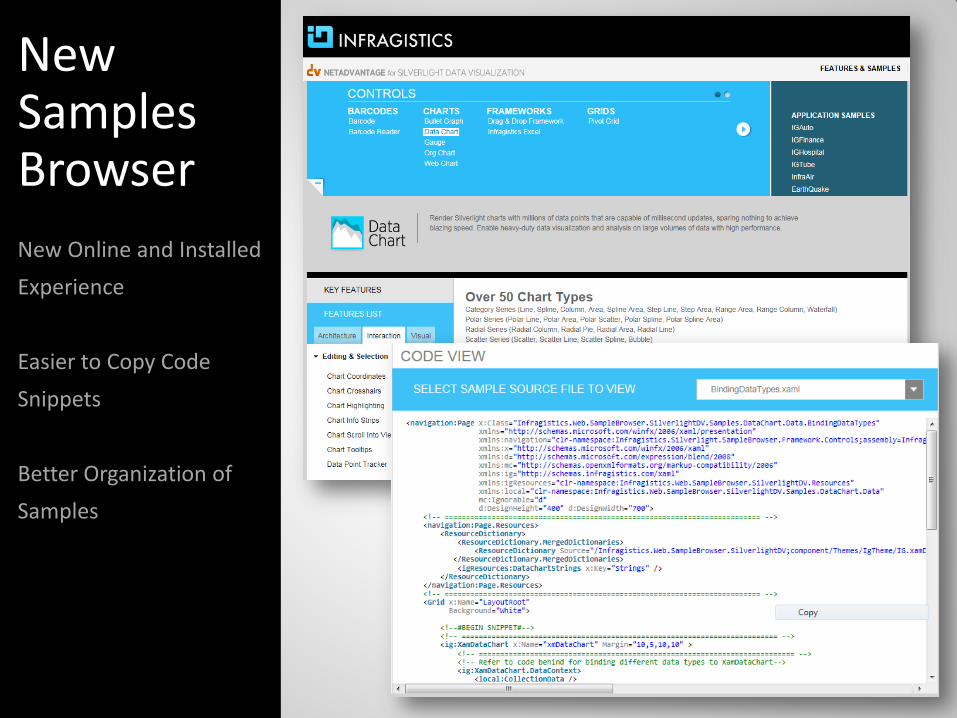
New Samples Browser
New Online and Installed
Experience
Easier to Copy Code
Snippets
Better Organization of
Samples
Cross Platform stylability / ease of use / performance excellence

Styles & Stylability
2011.1 New IG Theme across all
controls on all platforms
XAML
Windows Forms
ASP.NET
jQuery
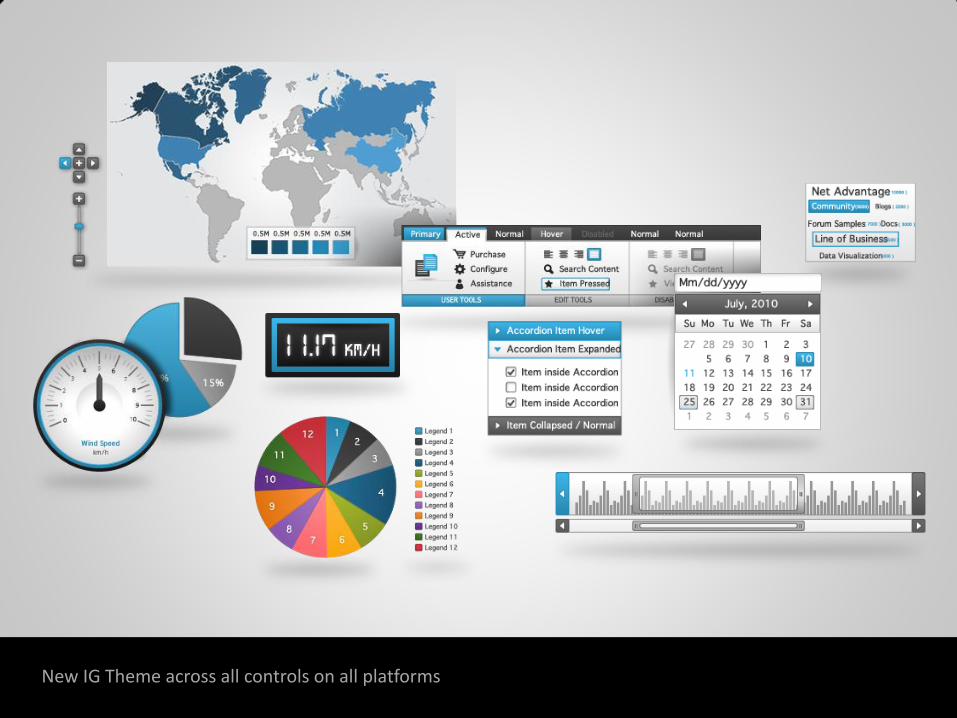
New IG Theme across all controls on all platforms
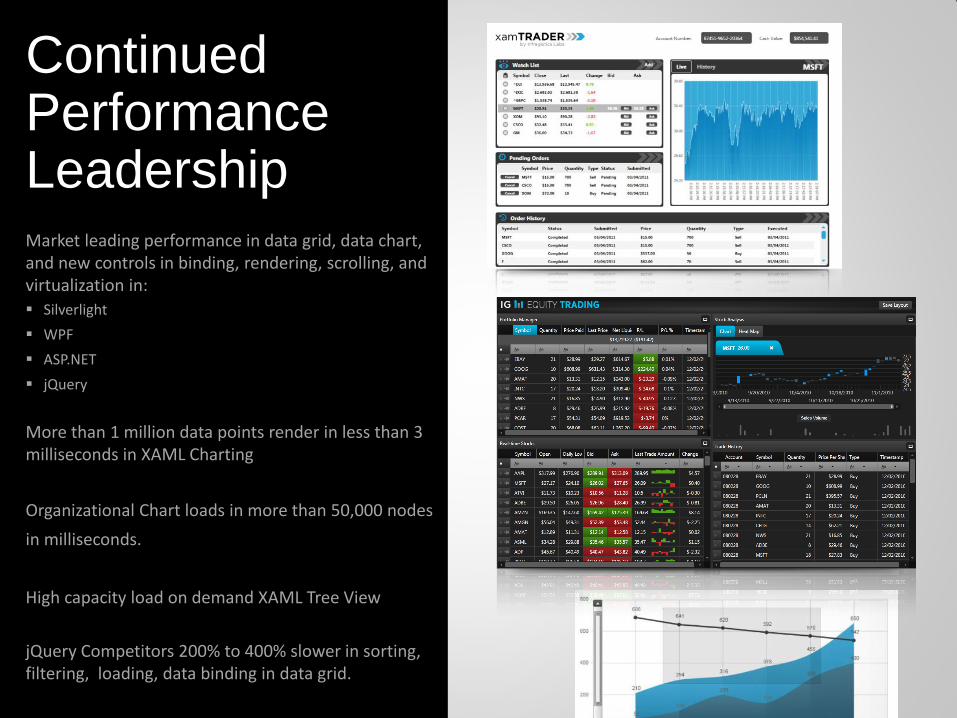
Continued Performance Leadership
Market leading performance in data grid, data chart, and new controls in binding, rendering, scrolling, and virtualization in:
Silverlight
WPF
ASP.NET
jQuery
More than 1 million data points render in less than 3 milliseconds in XAML Charting
Organizational Chart loads in more than 50,000 nodes
in milliseconds.
High capacity load on demand XAML Tree View
jQuery Competitors 200% to 400% slower in sorting, filtering, loading, data binding in data grid.
XAML Data Visualization shared strategy / controls / ctp’s / motion framework
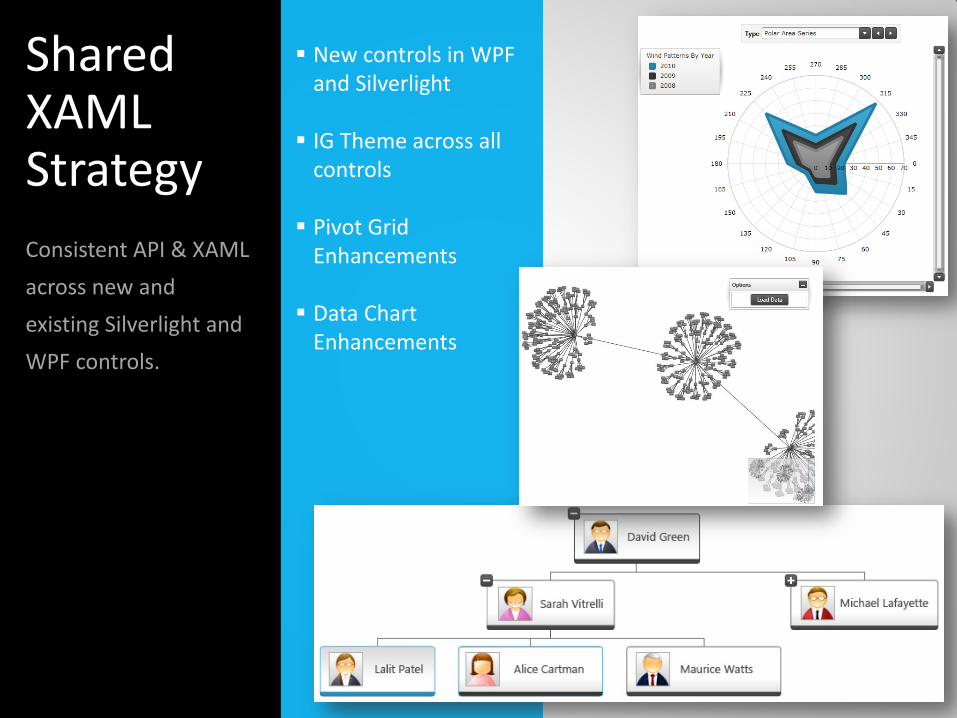
New controls in WPF and Silverlight
IG Theme across all controls
Pivot Grid Enhancements
Data Chart Enhancements
Shared XAML Strategy
Consistent API & XAML
across new and
existing Silverlight and
WPF controls.
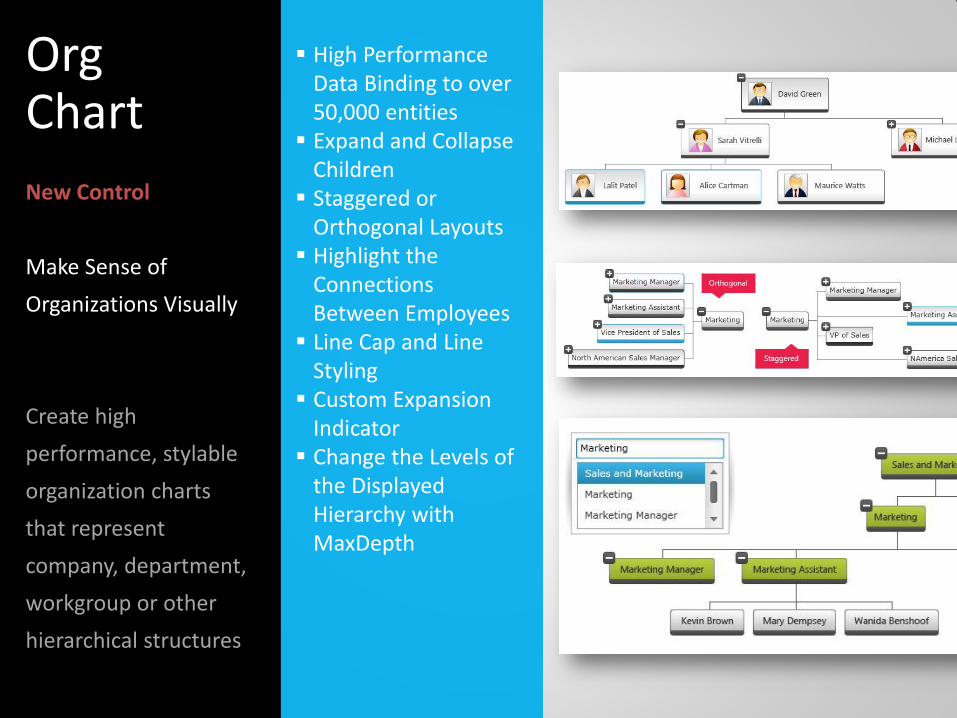
High Performance Data Binding to over 50,000 entities
Expand and Collapse Children
Staggered or Orthogonal Layouts
Highlight the Connections Between Employees
Line Cap and Line Styling
Custom Expansion Indicator
Change the Levels of the Displayed Hierarchy with MaxDepth
Org Chart
New Control
Make Sense of
Organizations Visually
Create high
performance, stylable
organization charts
that represent
company, department,
workgroup or other
hierarchical structures

Load Graph Modeling Language (GML) Files
Multiple Data Models
Interactively Drag to Rearrange Nodes
Retain the current selection during Multiple or Extended selection modes, Conditional Formatting Support
Customize Node Templates
Network Node Map
New Control
Visualize relationships
within a network -
from biological
systems, server
infrastructures, email
communication
patterns, to complex
social or professional
networks.

Pie Chart New Chart Types
Bubble chart Polar Scatter
Series chart Polar Spline Area
Series Radial Area Series Radial Column
Series Radial Line Series Radial Pie Series Radial Series
Formulas Mean Median Variance Logarithmic Time
Scale
Data Chart
New Chart types
New Chart formulas
Maintaining market
leading performance

Error Bars (CTP) New Chart Types
Bar chart (CTP) Funnel (CTP) Stacked 100 Bar
(CTP) Stacked 100
Column (CTP) Stacked Bar (CTP) Stacked Column
(CTP) Formulas
Weighted Moving Average (CTP)
Correlation (CTP)
Data Chart CTP’s
Continued Investment
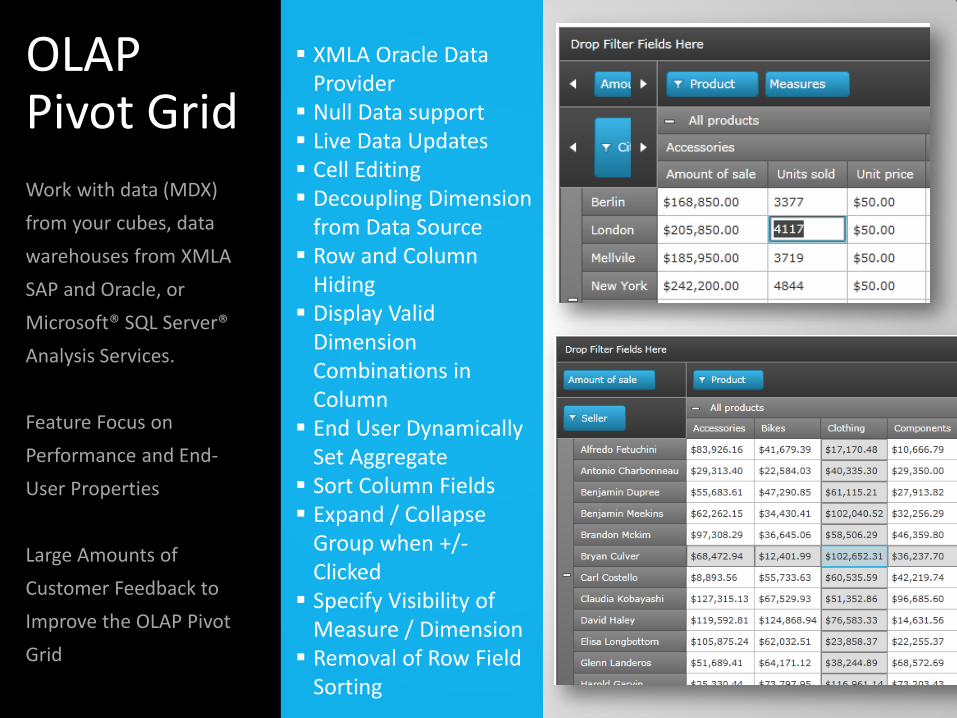
XMLA Oracle Data Provider
Null Data support Live Data Updates Cell Editing Decoupling Dimension
from Data Source Row and Column
Hiding Display Valid
Dimension Combinations in Column
End User Dynamically Set Aggregate
Sort Column Fields Expand / Collapse
Group when +/- Clicked
Specify Visibility of Measure / Dimension
Removal of Row Field Sorting
OLAP Pivot Grid
Work with data (MDX)
from your cubes, data
warehouses from XMLA
SAP and Oracle, or
Microsoft® SQL Server®
Analysis Services.
Feature Focus on
Performance and End-
User Properties
Large Amounts of
Customer Feedback to
Improve the OLAP Pivot
Grid
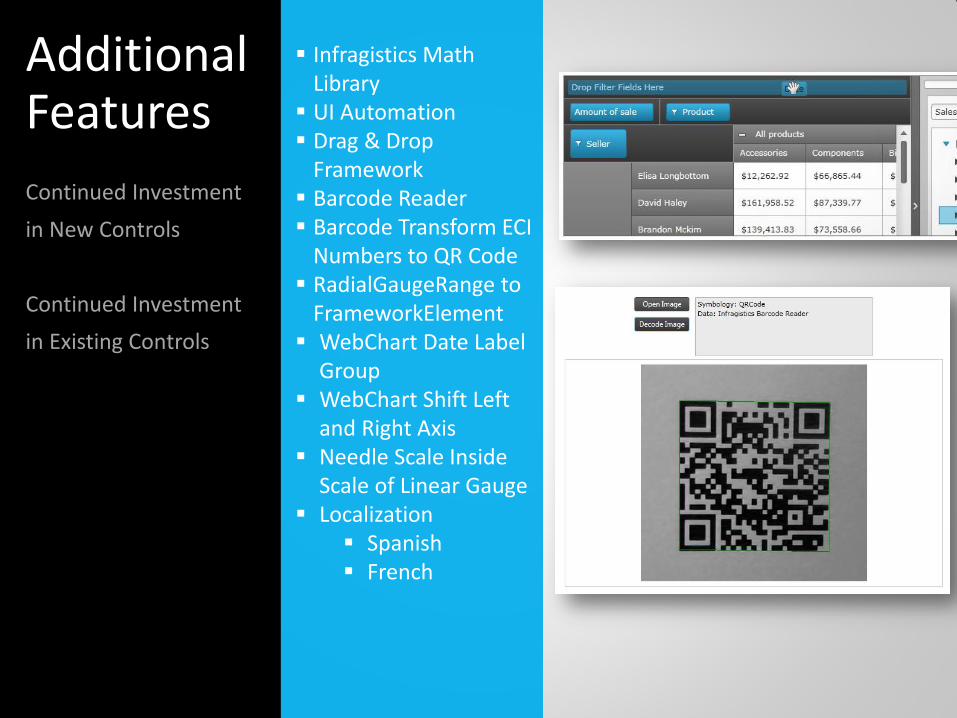
Infragistics Math Library
UI Automation Drag & Drop
Framework Barcode Reader Barcode Transform ECI
Numbers to QR Code RadialGaugeRange to
FrameworkElement WebChart Date Label
Group WebChart Shift Left
and Right Axis Needle Scale Inside
Scale of Linear Gauge Localization
Spanish French
Additional Features
Continued Investment
in New Controls
Continued Investment
in Existing Controls

Motion Framework
Animate the story of your
data over time
Full documentation in
11.1
Use in Data Chart and
Map
Reference Applications:
• World Stats(with full
source code)
• World Maps

Demo
new controls / new features / ctp features
2011.1 In Review
1 / Continued investment in existing products – major new controls like Org
Chart, Network Node Map, Barcode Reader
2 / Styling even simpler with the new IG Theme
3 / Emphasis continues in the User Experience of 3 key areas (Ease of use,
Performance, Styling)

http://www.infragistics.com
http://community.infragistics.com
http://samples.infragistics.com
Follow me &Infragistics on Twitter @infragistics @jasonberes Additional questions –
Resources

Thank You !!


![Slide Da Profª. Ledilce Almeida Ataíde [Fisiopatologia E Farmacoterapia I] - 2011.1 - (08º) - HEMOGLOBINOPATIAS - UNIME](https://static.documents.pub/doc/80x56/55721135497959fc0b8e944f/slide-da-profa-ledilce-almeida-ataide-fisiopatologia-e-farmacoterapia-i-20111-08o-hemoglobinopatias-unime.jpg)


