Projected U.S. wheat supplies for 2013/14 are raised 10 million bushels with higher expected imports from a larger wheat crop in Canada. U.S. trade and food use changes by class largely reflect higher projected exports by Canada. Hard red spring (HRS) wheat imports are raised 10 million bushels and durum imports are raised 5 million bushels. Partly offsetting is a 5-million-bushel reduction in projected soft red winter wheat imports. Food use is raised 10 million bushels for HRS wheat and lowered 10 million bushels for hard red winter (HRW) wheat. HRS wheat exports are lowered 10 million bushels reflecting increased competition from Canadian spring wheat. HRW wheat exports are raised an offsetting 10 million bushels on the strong pace of sales and shipments in recent weeks. Projected all wheat ending stocks are raised 10 million bushels. The projected range for the 2013/14 season-average farm price is narrowed 10 cents on each end of the range to $6.50 to $7.50 per bushel, well below the 2012/13 record of $7.77 per bushel. Increased foreign production forecast for 2013/14 boosts world wheat supplies this month. The increase in world wheat supplies and slightly lower consumption raise projected world ending stocks. U.S. wheat export prospects are unchanged, while European Union (EU-27) and Canadian exports are on the rise. Wheat Outlook Gary Vocke [email protected]Olga Liefert [email protected]Higher Projected Imports Raise 2013/14 Ending Stocks Economic Research Service Situation and Outlook WHS-13i Sept.16, 2013 Wheat Chart Gallery will be updated on Sept. 16, 2013 The next release is October 16, 2013 -------------- Approved by the World Agricultural Outlook Board.
June July Aug. Sept. Oct. Nov. Dec. Jan. Feb. Mar. Apr. May
Market year
2011/12 2012/13 2013/14
Source: USDA, National Agricultural Statistics Service, Agricultural Prices.
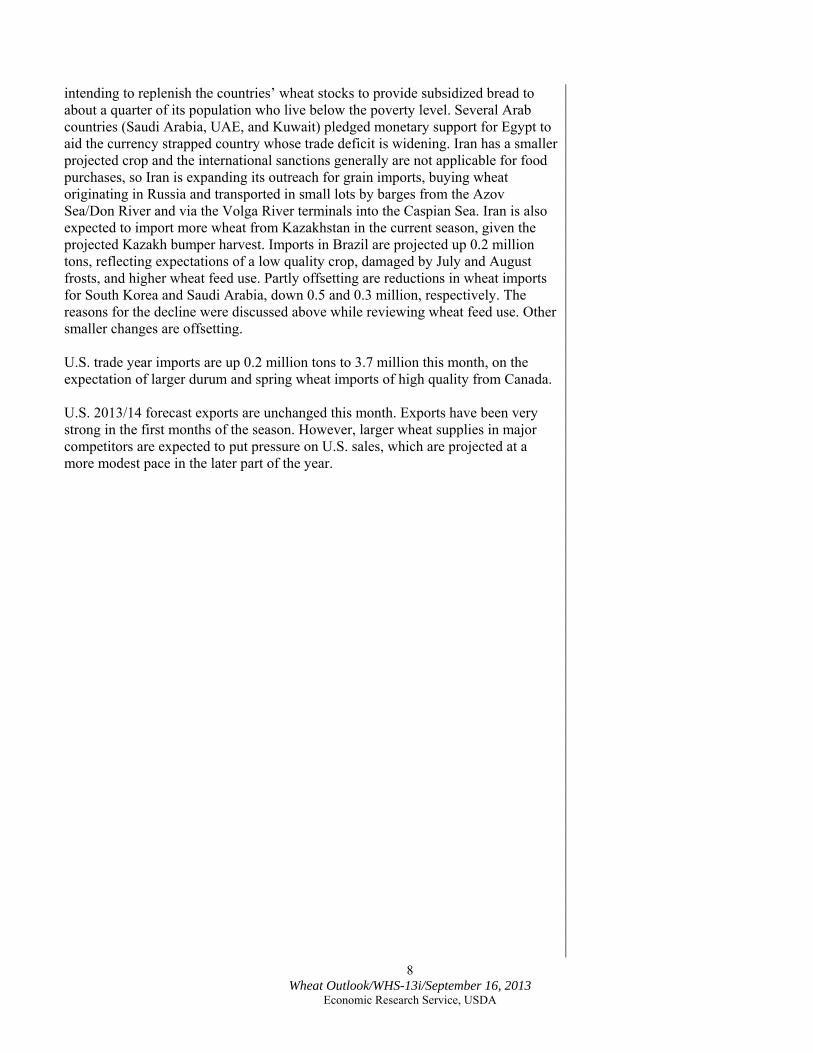
Figure 1All wheat average prices received by farmers
Dollars per bushel
0.00
1.00
2.00
3.00
4.00
5.00
6.00
7.00
8.00
9.00
June July Aug. Sept. Oct. Nov. Dec. Jan. Feb. Mar. Apr. May
Market year
2011/12 2012/13 2013/14
Figure 2Hard red winter wheat average prices received by farmers
Source: USDA, National Agricultural Statistics Service, Agricultural Prices.
Dollars per bushel
0.00
1.00
2.00
3.00
4.00
5.00
6.00
7.00
8.00
9.00
10.00
June July Aug. Sept. Oct. Nov. Dec. Jan. Feb. Mar. Apr. May
Market year
2011/12 2012/13 2013/14
Figure 3Hard red spring wheat average prices received by farmers
Source: USDA, National Agricultural Statistics Service, Agricultural Prices.
Dollars per bushel
10 Wheat Outlook/WHS-13i/Sept 16, 2013
Economic Research Service, USDA
0.00
1.00
2.00
3.00
4.00
5.00
6.00
7.00
8.00
9.00
June July Aug. Sept. Oct. Nov. Dec. Jan. Feb. Mar. Apr. May
Market year
2011/12 2012/13 2013/14
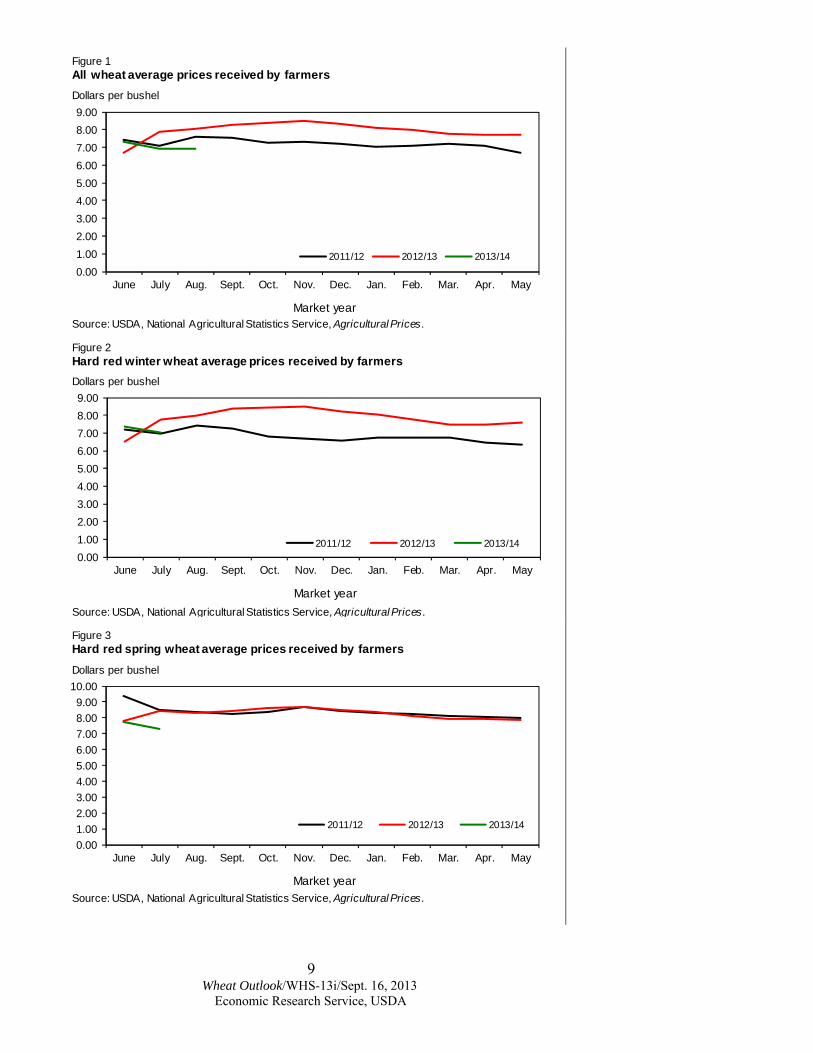
Figure 4Soft red winter wheat average prices received by farmers
Source: USDA, National Agricultural Statistics Service, Agricultural Prices.
Dollars per bushel
0.00
1.00
2.00
3.00
4.00
5.00
6.00
7.00
8.00
9.00
June July Aug. Sept. Oct. Nov. Dec. Jan. Feb. Mar. Apr. May
Market year
2011/12 2012/13 2013/14
Figure 5Soft white wheat average prices received by farmers
Source: USDA, National Agricultural Statistics Service, Agricultural Prices.
Dollars per bushel
0.00
2.00
4.00
6.00
8.00
10.00
12.00
June July Aug. Sept. Oct. Nov. Dec. Jan. Feb. Mar. Apr. May
Market year
2011/12 2012/13 2013/14
Figure 6Durum wheat average prices received by farmers
Dollars per bushel
Source: USDA, National Agricultural Statistics Service, Agricultural Prices.
11 Wheat Outlook/WHS-13i/Sept. 16, 2013
Economic Research Service, USDA
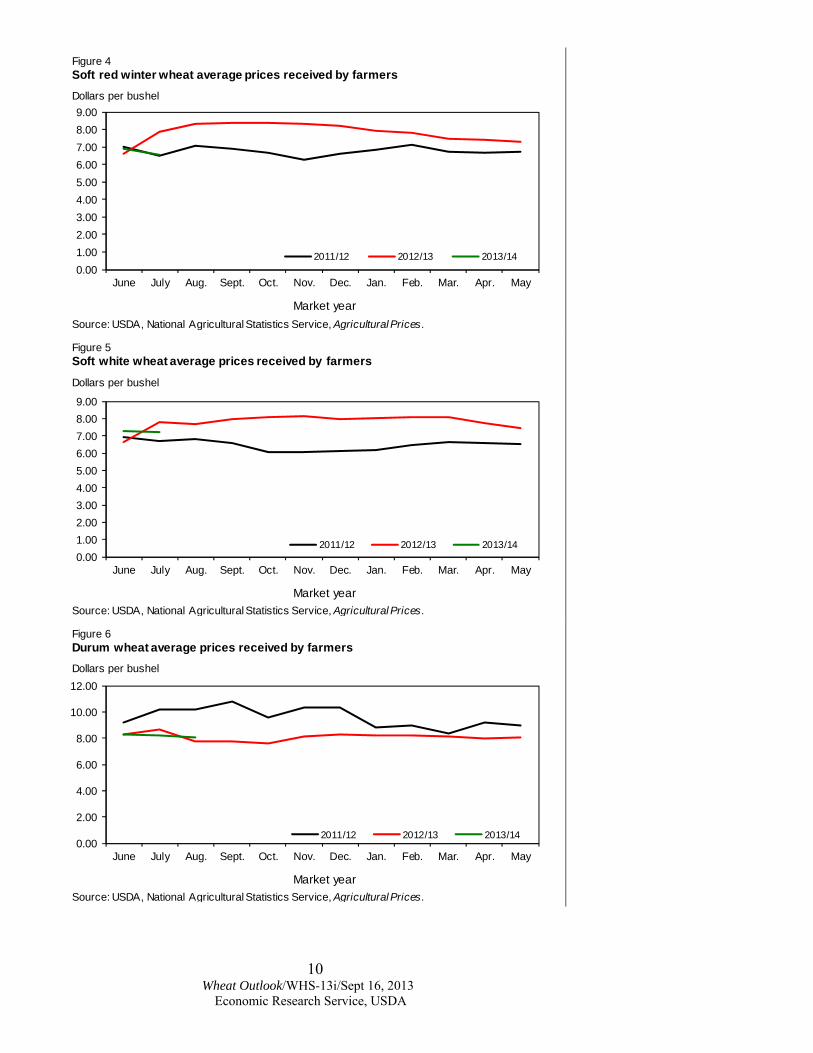
-200 -150 -100 -50 0 50 100 150
Figure 7All wheat: U.S. supply and disappearance change from prior market year
Beginning stocks
Imports
Production
Supply
Domestic use
Exports
Ending stocks
Total disappearance
Million bushels
Source: USDA, World Agricultural Outlook Board, World Agricultural Supply and Demand Estimates.
-250 -200 -150 -100 -50 0 50
Figure 8Hard red winter wheat: U.S. supply and disappearance change from prior market year
Million bushels
Source: USDA, World Agricultural Outlook Board, World Agricultural Supply and Demand Estimates.
Beginning stocks
Imports
Production
Supply
Domestic use
Exports
Total disappearance
Ending stocks
-40 -30 -20 -10 0 10 20
Figure 9Hard red spring wheat: U.S. supply and disappearance change from prior market year
Beginning stocks
Imports
Production
Supply
Domestic use
Exports
Ending stocks
Total disappearance
Million bushels
Source: USDA, World Agricultural Outlook Board, World Agricultural Supply and Demand Estimates.
12 Wheat Outlook/WHS-13i/Sept. 16, 2013
Economic Research Service, USDA
-100 -50 0 50 100 150
Figure 10Soft red winter wheat: U.S. supply and disappearance change from prior market year
Beginning stocks
Imports
Production
Supply
Domestic use
Exports
Ending stocks
Total disappearance
Million bushels
Source: USDA, World Agricultural Outlook Board, World Agricultural Supply and Demand Estimates.
-30 -20 -10 0 10 20 30
Figure 11White wheat: U.S. supply and disappearance change from prior market year
Beginning stocks
Imports
Production
Supply
Domestic use
Exports
Ending stocks
Total disappearance
Million bushels
Source: USDA, World Agricultural Outlook Board, World Agricultural Supply and Demand Estimates.
-25 -20 -15 -10 -5 0 5 10 15 20
Figure 12Durum: U.S. supply and disappearance change from prior market year
Beginning stocks
Imports
Production
Supply
Domestic use
Exports
Ending stocks
Total disappearance
Million bushels
Source: USDA, World Agricultural Outlook Board, World Agricultural Supply and Demand Estimates.
Contacts and Links
13 Wheat Outlook/WHS-13i/September 16, 2013
Economic Research Service, USDA
Data Wheat Monthly Tables http://www.ers.usda.gov/publications/whs-wheat-outlook Wheat Chart Gallery http://www.ers.usda.gov/data-products/wheat-chart-gallery.aspx Related Websites Wheat Outlook http://www.ers.usda.gov/publications/whs-wheat-outlook/ WASDE http://usda.mannlib.cornell.edu/MannUsda/viewDocumentInfo.do?documentID=1194 Grain Circular, http://www.fas.usda.gov/grain_arc.asp Wheat Topic, http://www.ers.usda.gov/topics/crops/wheat.aspx
Contact Information Gary Vocke (domestic), (202) 694-5285, [email protected] Olga Liefert (international), (202) 694-5155, [email protected] Beverly Payton (Web Publishing), (202) 694-5165, [email protected] Subscription Information Subscribe to ERS e-mail notification service at http://www.ers.usda.gov/subscribe-to-ers-e-newsletters.aspx to receive timely notification of newsletter availability. Printed copies can be purchased from the USDA Order Desk by calling 1-800-363-2068 (specify the issue number) To order printed copies of the five field crop newsletters—cotton and wool, feed, rice, oil crops, and wheat—as a series, specify series SUB-COR-4043
The U.S. Department of Agriculture (USDA) prohibits discrimination in all its programs and activities on the basis of race, color, national origin, age, disability, and, where applicable, sex, marital status, familial status, parental status, religion, sexual orientation, genetic information, political beliefs, reprisal, or because all or a part of an individual’s income is derived from any public assistance program. (Not all prohibited bases apply to all programs.) Persons with disabilities who require alternative means for communication of program information (Braille, large print, audiotape, etc.) should contact USDA’s TARGET Center at (202) 720-2600 (voice and TDD). To file a complaint of discrimination write to USDA, Director, Office of Civil Rights, 1400 Independence Avenue, S.W., Washington, D.C. 20250-9410 or call (800) 795-3272 (voice) or (202) 720-6382 (TDD). USDA is an equal opportunity provider and employer.
E mail Notification Readers of ERS outlook reports have two ways they can receive an e-mail notice about release of reports and associated data. • Receive timely notification (soon after the report is posted on the web) via USDA’s Economics, Statistics and Market Information System (which is housed at Cornell University’s Mann Library). Go to http://usda.mannlib.cornell.edu/MannUsda/aboutEmailService.do and follow the instructions to receive e-mail notices about ERS, Agricultural Marketing Service, National Agricultural Statistics Service, and World Agricultural Outlook Board products. • Receive weekly notification (on Friday afternoon) via the ERS website. Go to http://www.ers.usda.gov/subscribe-to-ers-e-newsletters.aspx and follow the instructions to receive notices about ERS outlook reports, Amber Waves magazine, and other reports and data products on specific topics. ERS also offers RSS (really simple syndication) feeds for all ERS products. Go to http://www.ers.usda.gov/rss/ to get started.
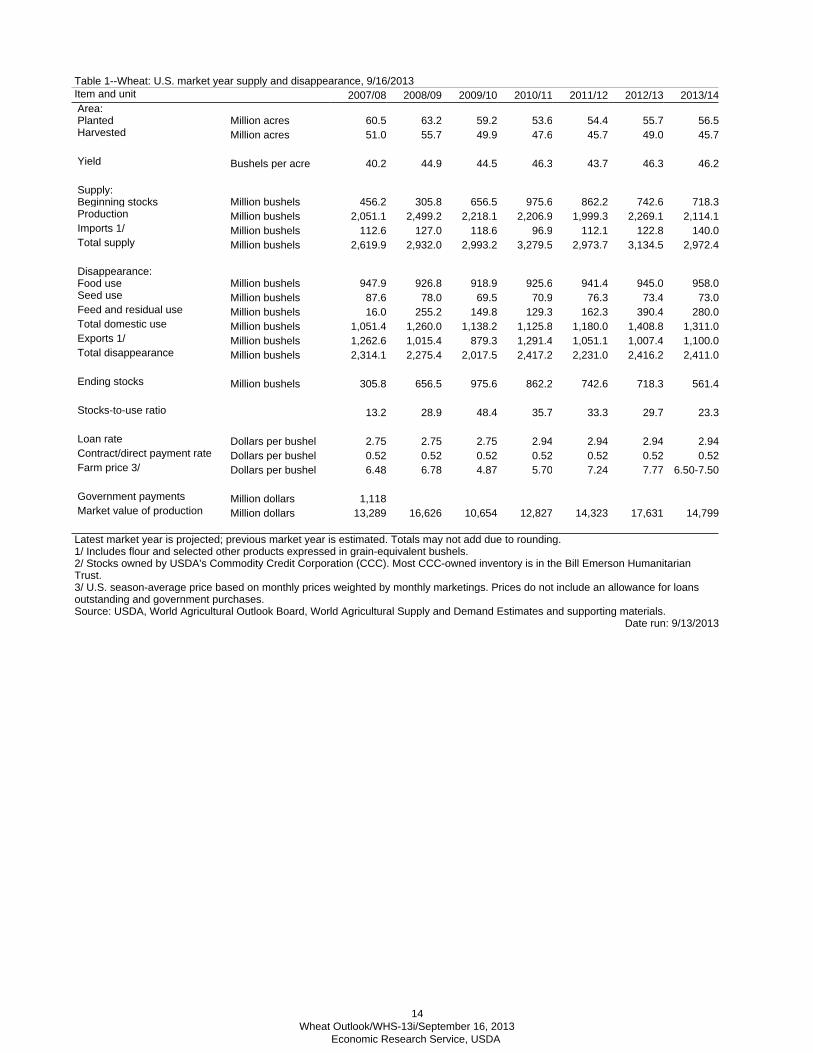
Item and unit 2007/08 2008/09 2009/10 2010/11 2011/12 2012/13 2013/14Area:Planted Million acres 60.5 63.2 59.2 53.6 54.4 55.7 56.5Harvested Million acres 51.0 55.7 49.9 47.6 45.7 49.0 45.7
Government payments Million dollars 1,118Market value of production Million dollars 13,289 16,626 10,654 12,827 14,323 17,631 14,799
Table 1--Wheat: U.S. market year supply and disappearance, 9/16/2013
Latest market year is projected; previous market year is estimated. Totals may not add due to rounding.1/ Includes flour and selected other products expressed in grain-equivalent bushels.2/ Stocks owned by USDA's Commodity Credit Corporation (CCC). Most CCC-owned inventory is in the Bill Emerson Humanitarian Trust.
Date run: 9/13/2013
3/ U.S. season-average price based on monthly prices weighted by monthly marketings. Prices do not include an allowance for loans outstanding and government purchases.Source: USDA, World Agricultural Outlook Board, World Agricultural Supply and Demand Estimates and supporting materials.
14 Wheat Outlook/WHS-13i/September 16, 2013
Economic Research Service, USDA
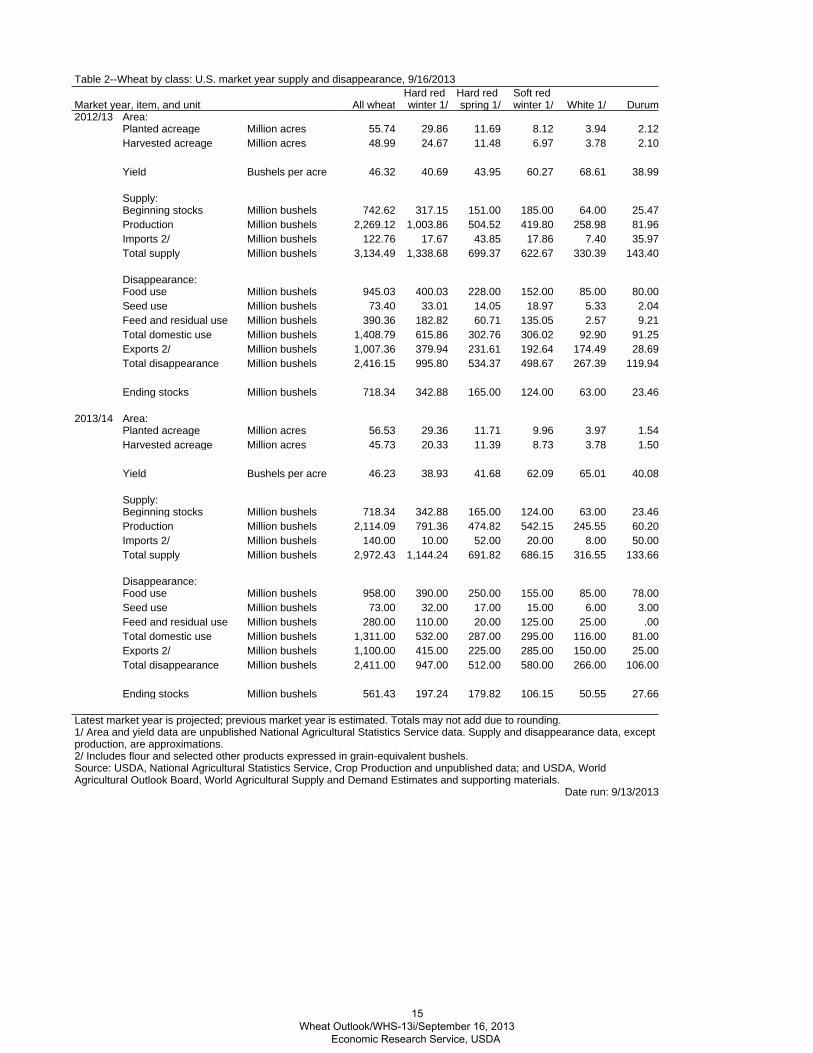
Table 2--Wheat by class: U.S. market year supply and disappearance, 9/16/2013
Latest market year is projected; previous market year is estimated. Totals may not add due to rounding.1/ Area and yield data are unpublished National Agricultural Statistics Service data. Supply and disappearance data, except production, are approximations.
Date run: 9/13/2013
Market year, item, and unit All wheatHard red winter 1/
Hard red spring 1/
Soft red winter 1/ White 1/ Durum
2012/13 Area:Planted acreage Million acres 55.74 29.86 11.69 8.12 3.94 2.12Harvested acreage Million acres 48.99 24.67 11.48 6.97 3.78 2.10
Yield Bushels per acre 46.32 40.69 43.95 60.27 68.61 38.99
Supply:Beginning stocks Million bushels 742.62 317.15 151.00 185.00 64.00 25.47Production Million bushels 2,269.12 1,003.86 504.52 419.80 258.98 81.96Imports 2/ Million bushels 122.76 17.67 43.85 17.86 7.40 35.97Total supply Million bushels 3,134.49 1,338.68 699.37 622.67 330.39 143.40
Disappearance:Food use Million bushels 945.03 400.03 228.00 152.00 85.00 80.00Seed use Million bushels 73.40 33.01 14.05 18.97 5.33 2.04Feed and residual use Million bushels 390.36 182.82 60.71 135.05 2.57 9.21Total domestic use Million bushels 1,408.79 615.86 302.76 306.02 92.90 91.25Exports 2/ Million bushels 1,007.36 379.94 231.61 192.64 174.49 28.69Total disappearance Million bushels 2,416.15 995.80 534.37 498.67 267.39 119.94
Ending stocks Million bushels 718.34 342.88 165.00 124.00 63.00 23.46
2013/14 Area:Planted acreage Million acres 56.53 29.36 11.71 9.96 3.97 1.54Harvested acreage Million acres 45.73 20.33 11.39 8.73 3.78 1.50
Yield Bushels per acre 46.23 38.93 41.68 62.09 65.01 40.08
Supply:Beginning stocks Million bushels 718.34 342.88 165.00 124.00 63.00 23.46Production Million bushels 2,114.09 791.36 474.82 542.15 245.55 60.20Imports 2/ Million bushels 140.00 10.00 52.00 20.00 8.00 50.00Total supply Million bushels 2,972.43 1,144.24 691.82 686.15 316.55 133.66
Disappearance:Food use Million bushels 958.00 390.00 250.00 155.00 85.00 78.00Seed use Million bushels 73.00 32.00 17.00 15.00 6.00 3.00Feed and residual use Million bushels 280.00 110.00 20.00 125.00 25.00 .00Total domestic use Million bushels 1,311.00 532.00 287.00 295.00 116.00 81.00Exports 2/ Million bushels 1,100.00 415.00 225.00 285.00 150.00 25.00Total disappearance Million bushels 2,411.00 947.00 512.00 580.00 266.00 106.00
Ending stocks Million bushels 561.43 197.24 179.82 106.15 50.55 27.66
2/ Includes flour and selected other products expressed in grain-equivalent bushels.Source: USDA, National Agricultural Statistics Service, Crop Production and unpublished data; and USDA, World Agricultural Outlook Board, World Agricultural Supply and Demand Estimates and supporting materials.
15 Wheat Outlook/WHS-13i/September 16, 2013
Economic Research Service, USDA
Table 3--Wheat: U.S. quarterly supply and disappearance (million bushels), 9/16/2013
Latest market year is projected; previous market year is estimated. Totals may not add due to rounding.1/ Includes flour and selected other products expressed in grain-equivalent bushels.Source: USDA, World Agricultural Outlook Board, World Agricultural Supply and Demand Estimates and supporting materials.
Date run: 9/13/2013
Market year and quarter Production Imports 1/ Total supply Food use Seed useFeed and
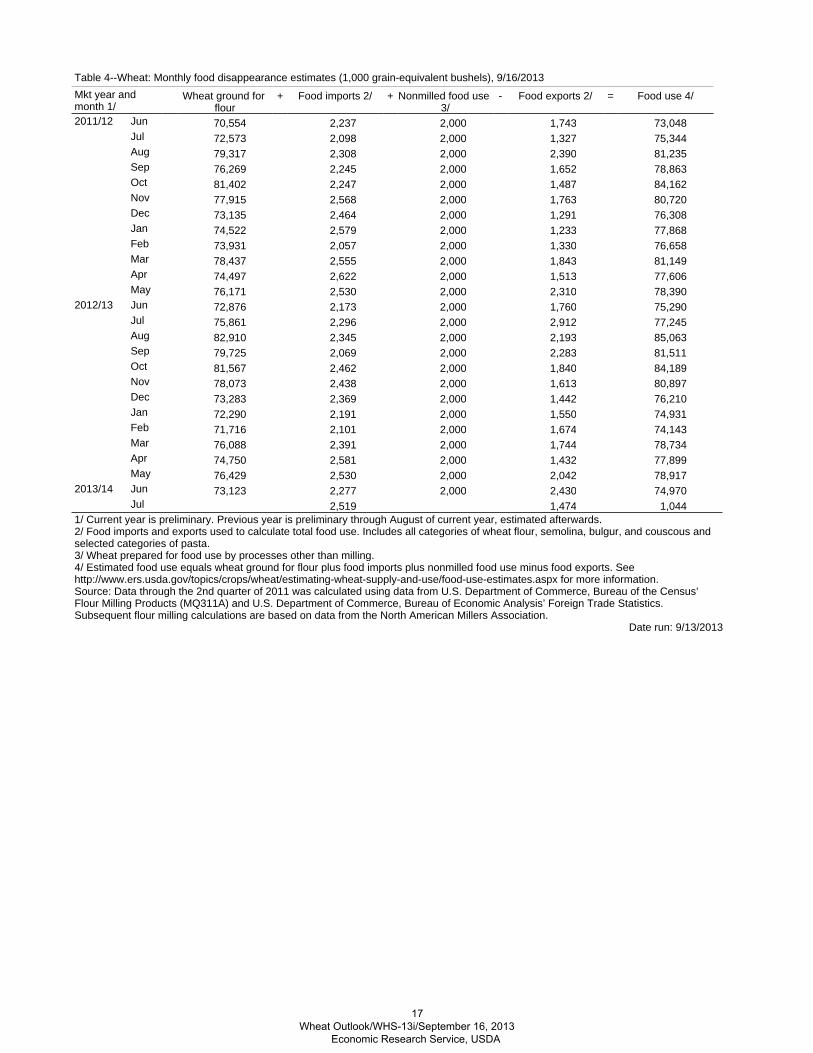
1/ Current year is preliminary. Previous year is preliminary through August of current year, estimated afterwards.2/ Food imports and exports used to calculate total food use. Includes all categories of wheat flour, semolina, bulgur, and couscous and selected categories of pasta.3/ Wheat prepared for food use by processes other than milling.
2013/14 Jun 73,123 2,277 2,000 2,430 74,970Jul 2,519 1,474 1,044
4/ Estimated food use equals wheat ground for flour plus food imports plus nonmilled food use minus food exports. See http://www.ers.usda.gov/topics/crops/wheat/estimating-wheat-supply-and-use/food-use-estimates.aspx for more information.Source: Data through the 2nd quarter of 2011 was calculated using data from U.S. Department of Commerce, Bureau of the Census’ Flour Milling Products (MQ311A) and U.S. Department of Commerce, Bureau of Economic Analysis’ Foreign Trade Statistics. Subsequent flour milling calculations are based on data from the North American Millers Association.
17 Wheat Outlook/WHS-13i/September 16, 2013
Economic Research Service, USDA
Table 5--Wheat: National average price received by farmers (dollars per bushel) 1/, 9/16/2013
1/ Preliminary mid-month, weighted-average price for current month.Source: USDA, National Agricultural Statistics Service, Agricultural Prices.
Month All wheat Winter Durum Other spring2012/13 2013/14 2012/13 2013/14 2012/13 2013/14 2012/13 2013/14
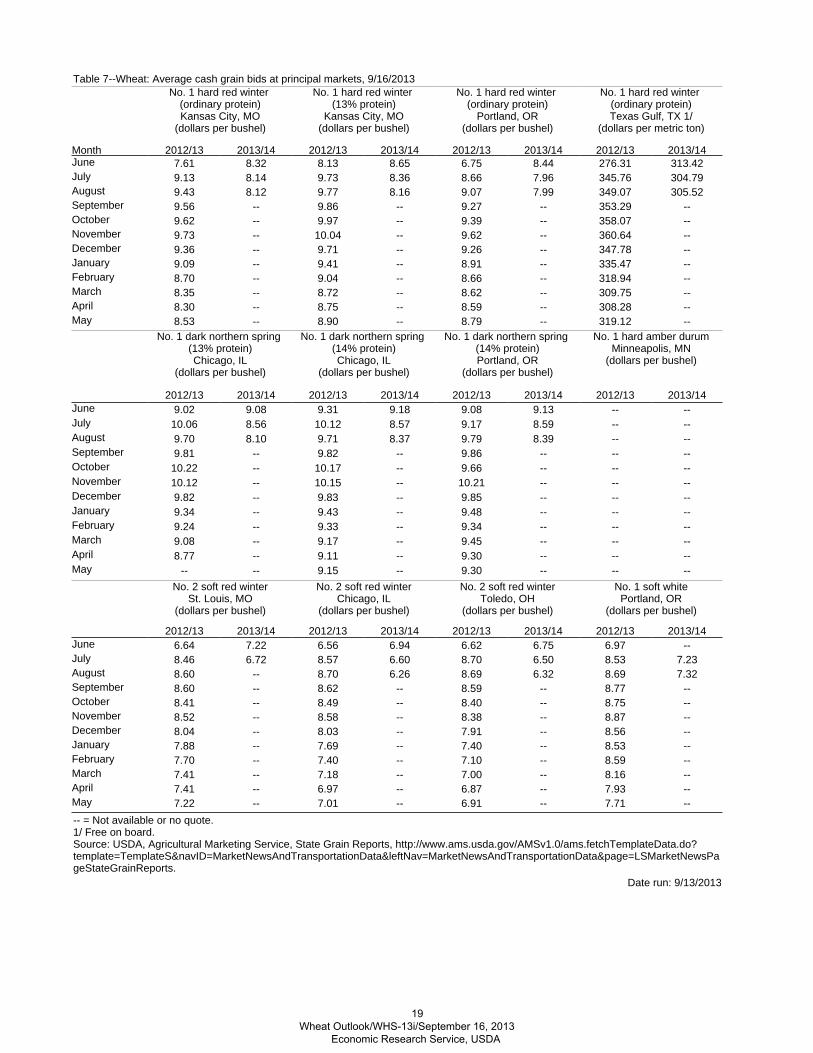
Table 7--Wheat: Average cash grain bids at principal markets, 9/16/2013
-- = Not available or no quote.1/ Free on board.Source: USDA, Agricultural Marketing Service, State Grain Reports, http://www.ams.usda.gov/AMSv1.0/ams.fetchTemplateData.do?template=TemplateS&navID=MarketNewsAndTransportationData&leftNav=MarketNewsAndTransportationData&page=LSMarketNewsPageStateGrainReports.
Month
No. 1 hard red winter (ordinary protein)Kansas City, MO
(dollars per bushel)
No. 1 hard red winter (13% protein)
Kansas City, MO(dollars per bushel)
No. 1 hard red winter (ordinary protein)
Portland, OR(dollars per bushel)
No. 1 hard red winter (ordinary protein)Texas Gulf, TX 1/
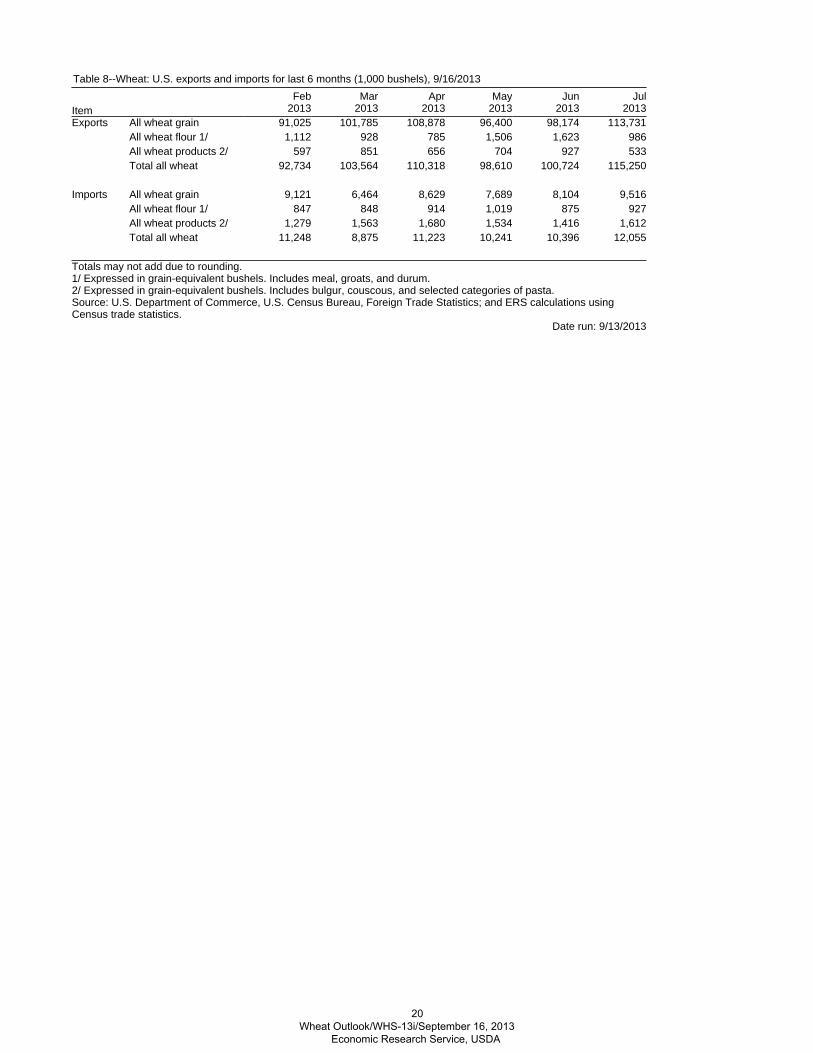
Table 8--Wheat: U.S. exports and imports for last 6 months (1,000 bushels), 9/16/2013
Totals may not add due to rounding.1/ Expressed in grain-equivalent bushels. Includes meal, groats, and durum.2/ Expressed in grain-equivalent bushels. Includes bulgur, couscous, and selected categories of pasta.Source: U.S. Department of Commerce, U.S. Census Bureau, Foreign Trade Statistics; and ERS calculations using Census trade statistics.