I. Introduction ........................................................................................................................................ 6
II. Purpose of this White paper........................................................................................................ 8
Organization of this Document ........................................................................................................... 8
III. Practitioner and Hospital Mind Maps ......................................................................................... 9
A. Practitioners - Overview of Critical ICD-10 Metrics.................................................................. 9
B. Expanded View of Critical ICD-10 Practitioner Metrics ........................................................... 9
C. Overview of Critical ICD-10 Hospital Metrics .......................................................................... 10
D. Expanded View of Critical ICD-10 Hospital Metrics ............................................................... 11
IV. Practitioner and Hospital Metric Descriptions ......................................................................... 13
A. Clinical Documentation: ............................................................................................................. 14
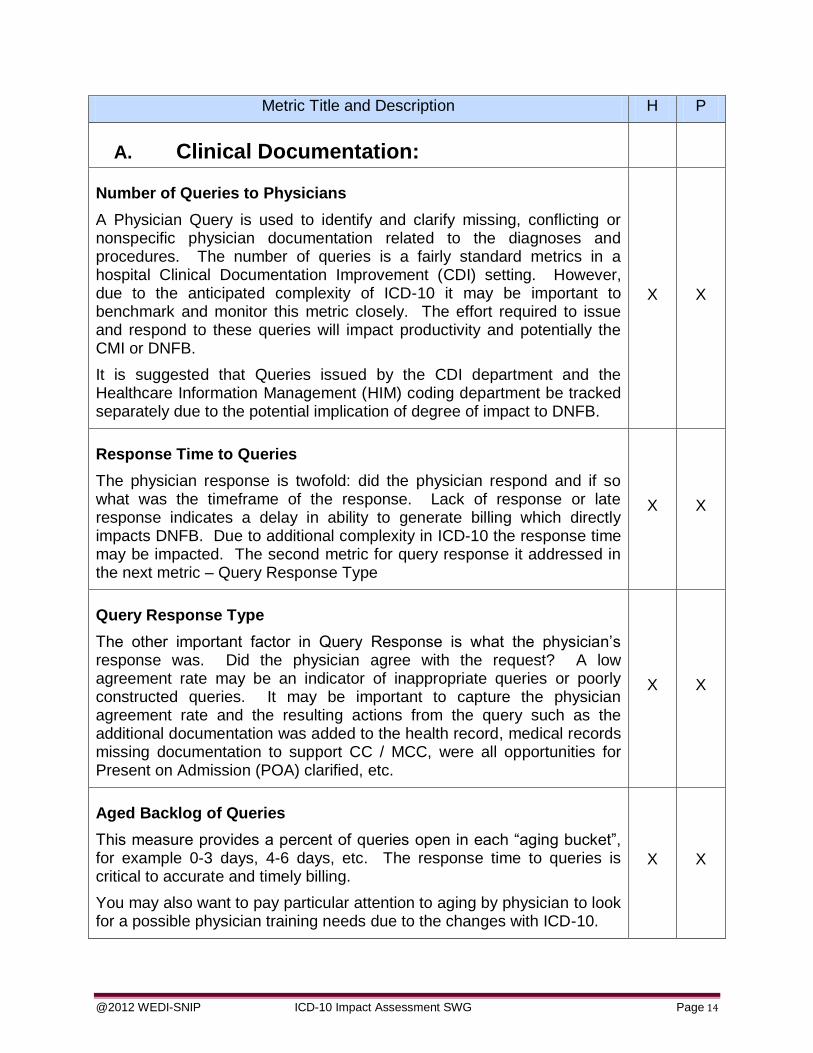
Number of Queries to Physicians ................................................................................................. 14
Response Time to Queries ............................................................................................................ 14
Query Response Type ................................................................................................................... 14
Aged Backlog of Queries ............................................................................................................... 14
Percent of Queries vs. Chart Reviews ......................................................................................... 15
B. Coding and Billing ...................................................................................................................... 15
E. Disease Management Analysis ................................................................................................ 33
F. Population Management Analysis ............................................................................................ 34
VII. Glossary....................................................................................................................................... 35
On January 16, 2009, the Department of Health and Human Services (DHHS) published two final rules under the Administrative Simplification provisions of the Health Insurance Portability and Accountability Act (HIPAA). These rules impart changes to Title 45 – Public Welfare, Code of Federal Regulations, Part 162 – Administrative Requirements by mandating the following: Electronic Transaction Standards:
ASC X12N 005010 with applicable Errata
National Council for Prescription Drug Programs (NCPDP) D.0/Batch 1.2
NCPDP Batch 3.0 for Medicaid Subrogation of Pharmacy Claims
Code Sets:
International Classification of Diseases, 10th Edition, Clinical Modifications (ICD-10-CM) Diagnosis
International Classification of Diseases, 10th Edition, Procedure Coding System (ICD-10-PCS) Inpatient Hospital Procedure Coding System
Covered entities (health care providers, health plans (payers) and healthcare clearinghouses) must comply with the transaction standards for any transactions submitted as of January 1, 2012 and the new code set regulations for dates of service (dates of discharge for inpatient claims) on and after October 1, 2014. The changes to the ASC X12 electronic transactions enable the use of ICD-10 codes in those transactions. The currently used ICD-9-CM code sets consist of 3 volumes. Volumes 1 and 2 contain diagnosis codes and volume 3 contains inpatient hospital procedure codes. The new 10th version includes a naming convention change. ICD-10-CM contains diagnosis codes and ICD-10-PCS contains inpatient hospital procedure codes. The ICD-10-CM and ICD-10-PCS codes sets (commonly referred to in this paper as simply ‘ICD-10’) are complete replacements to their ICD-9-CM Volumes 1, 2 and 3 (commonly referred to in this paper as simply ‘ICD-9’) counterparts and contain more granular detail, as well as major structural differences. The ICD-10-CM diagnosis code set includes significant improvements over the International Classification of Diseases, 9th Edition, Clinical Modifications (ICD-9-CM) in coding primary encounters, external causes of injury, mental disorders, neoplasms and preventive health. There are currently approximately 14,000 ICD-9 diagnosis codes as compared to over 69,000 ICD-10 diagnosis codes. The ICD-10 diagnosis code set reflects advances in medicine and medical technology, as well as accommodates the capture of more detail on socioeconomics, ambulatory care conditions, problems related to lifestyle and the results of screening tests. It also provides for more space to accommodate future expansions, laterality for specifying which organ or part of the body
is involved as well as expanded distinctions for ambulatory and managed care encounters. The ICD-10-PCS Procedure Coding System provides detailed codes to describe complex medical procedures for use on inpatient hospital claims at a much more granular level than its ICD-9 counterpart. It has unique, precise codes to differentiate body parts, surgical approaches and devices used. It can be used to identify resource consumption differences and outcomes for different procedures and describes precisely what is done to the patient. There are currently approximately 3,800 ICD-9 institutional procedures codes in use as compared to nearly 72,000 ICD-10-PCS institutional procedures codes. The Current Procedural Terminology, 4th edition (CPT-4) and Healthcare Common Procedure Coding System (HCPCS) will continue to be the code sets for reporting ambulatory procedures
This white paper focuses on the impact of ICD-10 implementation for:
Hospitals
Practitioners and
Payers
It is meant to be used as a follow up to the previous white papers developed by this group: ICD-10 Impact Assessment Checklist developed to assist in conducting an impact assessment to identify the implications of ICD-10 remediation efforts and the ICD-10 Impact Assessment Mind Maps developed to provide each stakeholder a model of all business processes to be considered to assess your impact and/or begin development of business test scenarios for ICD-10. You may also wish to reference the following WEDI White Papers dealing with ICD-10 implementation for additional information: Redefining Policies, Rules and Categories in ICD-10; ICD-10 Implementation; and ICD-10 Crosswalks. These can be found on the WEDI website: http://www.wedi.org/snip/public/articles/dis_publicDisplay.cfm?docType=6&wptype=1
As a workgroup, we collaborated on determining next steps after ICD-10 Impact Assessment. A critical next step is to identify risks and building contingency plans to mitigate those risks. The top risk across the industry is the potential of financial risk. Even with the goal of “financial neutrality” in the revenue cycle there are other potential financial impacts to healthcare organizations. These vary in each organization but may include the cost to implement system upgrades, training and loss of productivity for physicians, clinical documentation specialists and coders. An increase in coding, billing and payment errors will result in a higher rate of rejections and extend accounts receivables.
Solid contingency plans should be developed and put in place to mitigate these impacts wherever possible. However, there is an old adage “if you can’t measure it, you can’t manage it”. This concept drove the Impact Assessment SWG team to the development of a set of ICD-10 Critical Metrics that will provide a basis to perform benchmarks prior to ICD-10 implementation. These benchmarks and on-going metrics will also provide the monitoring and early warning indicators to ensure your business and mitigation plan after ICD-10 implementation are successful.
We have organized the critical metrics into the same stakeholder’s structures and used the same “mind mapping” concept to drill down to identify specific metrics that should be considered. The result is the compilation of a high level and detailed mind map depicting critical metrics for each of the following entities:
Hospitals
Practitioners (including individual and group providers) and
Payers (both public and private).
Please note that for each entity, there may be metrics listed that do not apply to everyone, but they may be helpful to consider for future implementation.
Organization of this Document
The two major sections of this document are providers (Practitioners and Hospitals) and Payers. Each section begins with a set of “mind maps” that depict the metrics included in the section. The mind maps will be followed with the detail for each metric. In order to eliminate redundancy, you will note in the Practitioners and Hospital section we have included the metrics in a chart format and indicated whether it applies in a Practitioner or a Hospital setting.
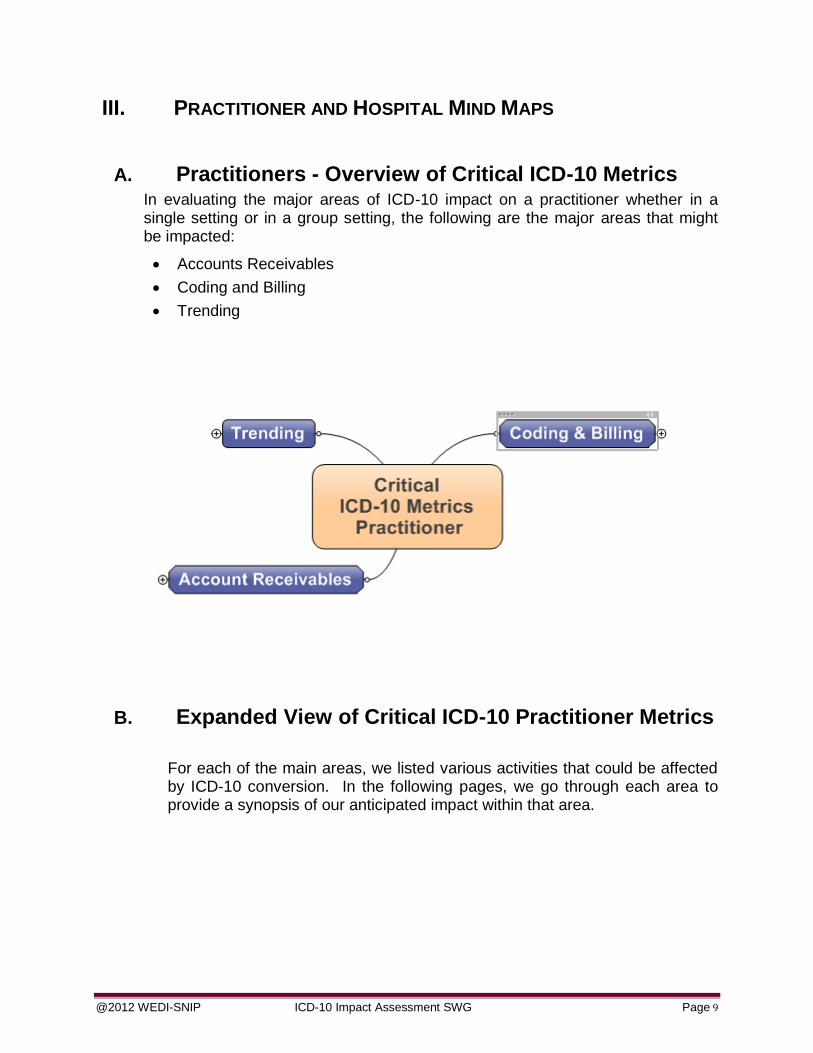
A. Practitioners - Overview of Critical ICD-10 Metrics In evaluating the major areas of ICD-10 impact on a practitioner whether in a single setting or in a group setting, the following are the major areas that might be impacted:
Accounts Receivables
Coding and Billing
Trending
B. Expanded View of Critical ICD-10 Practitioner Metrics
For each of the main areas, we listed various activities that could be affected by ICD-10 conversion. In the following pages, we go through each area to provide a synopsis of our anticipated impact within that area.
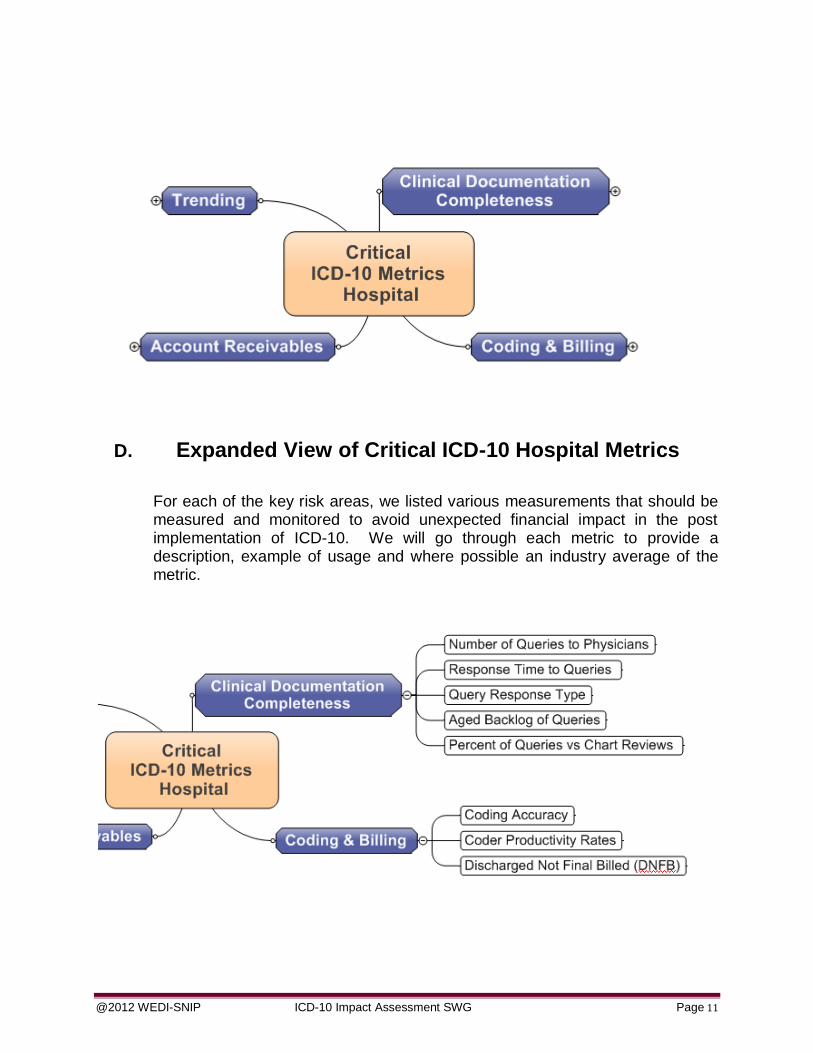
D. Expanded View of Critical ICD-10 Hospital Metrics
For each of the key risk areas, we listed various measurements that should be measured and monitored to avoid unexpected financial impact in the post implementation of ICD-10. We will go through each metric to provide a description, example of usage and where possible an industry average of the metric.
A Physician Query is used to identify and clarify missing, conflicting or nonspecific physician documentation related to the diagnoses and procedures. The number of queries is a fairly standard metrics in a hospital Clinical Documentation Improvement (CDI) setting. However, due to the anticipated complexity of ICD-10 it may be important to benchmark and monitor this metric closely. The effort required to issue and respond to these queries will impact productivity and potentially the CMI or DNFB.
It is suggested that Queries issued by the CDI department and the Healthcare Information Management (HIM) coding department be tracked separately due to the potential implication of degree of impact to DNFB.
X X
Response Time to Queries
The physician response is twofold: did the physician respond and if so what was the timeframe of the response. Lack of response or late response indicates a delay in ability to generate billing which directly impacts DNFB. Due to additional complexity in ICD-10 the response time may be impacted. The second metric for query response it addressed in the next metric – Query Response Type
X X
Query Response Type
The other important factor in Query Response is what the physician’s response was. Did the physician agree with the request? A low agreement rate may be an indicator of inappropriate queries or poorly constructed queries. It may be important to capture the physician agreement rate and the resulting actions from the query such as the additional documentation was added to the health record, medical records missing documentation to support CC / MCC, were all opportunities for Present on Admission (POA) clarified, etc.
X X
Aged Backlog of Queries
This measure provides a percent of queries open in each “aging bucket”, for example 0-3 days, 4-6 days, etc. The response time to queries is critical to accurate and timely billing.
You may also want to pay particular attention to aging by physician to look for a possible physician training needs due to the changes with ICD-10.
This metric measures the CDI program and effectiveness of the CDI specialist. Monitoring this metric may indicate a trend in the opportunity for clinical documentation improvement. During the ICD-10 transition period this metric may be important to monitor as an indicator of both quality and resource impact to the CDI department.
X
B. Coding and Billing
Coder Productivity Rates
Coding productivity is generally perceived as the quantity of work performed. Coding productivity will vary based on specialty, physician and/or coder experience, electronic medical record system, practice management software and the use of computer assisted coding software (CAC). Metrics today are obviously based on current ICD-9 codes. Care consideration and monitoring needs to be planned to be prepared for the anticipated productivity impact of up to 40% at least through the ICD-10 start-up transition period. This measurement will need to be re-evaluated after some practice and experience to determine the new objectives working under ICD-10.
X X
Coding Accuracy
Coding accuracy should include measuring any code that is revised, added or deleted. The quality of coding influences many areas and may have a direct impact on many facets of a provider’s business including:
Reimbursement
Clinical and financial decision-making
Public health tracking
Healthcare policies
Research
It is not always easy to identify (or prevent) coding errors upfront unless there is a quality process implemented. Much of the time, coding errors are not identified until there is feedback such as audit results, claim pends or claim denials.
It is important to focus on this area for ICD-10 and perform root cause analysis. This process will:
Identify root causes for coding errors to decrease variance and increase reliability
Identify strengths and weaknesses of coders to target education
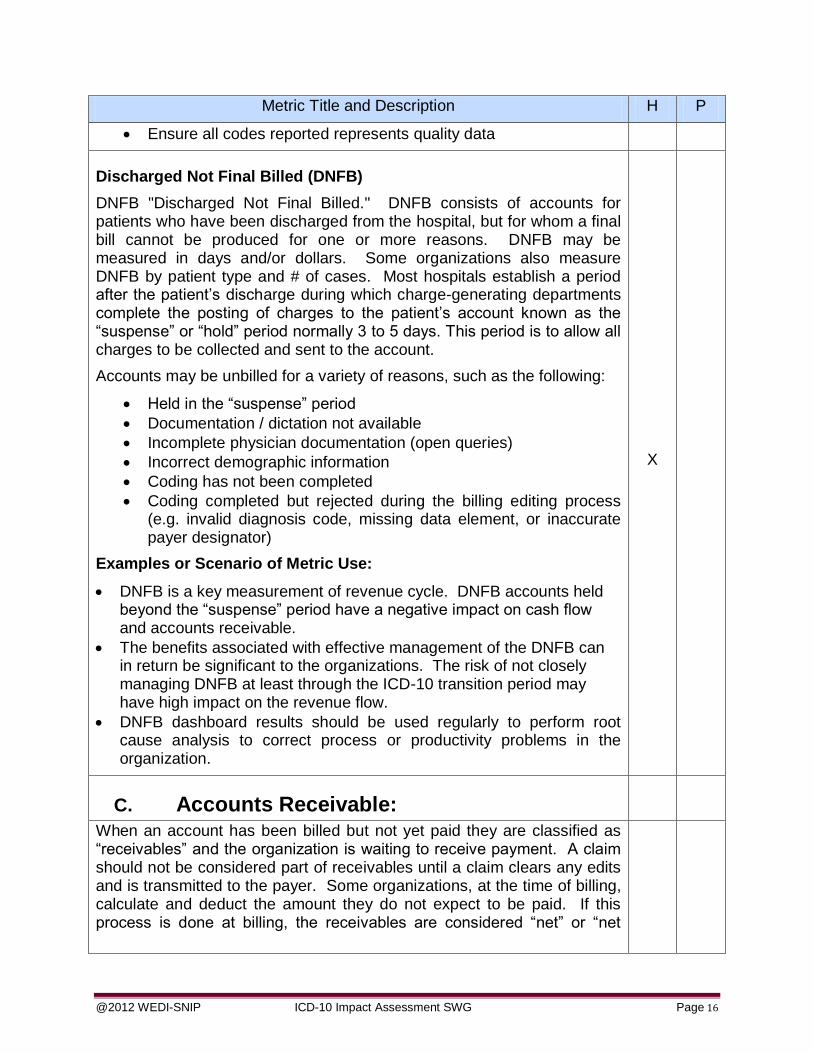
DNFB "Discharged Not Final Billed." DNFB consists of accounts for patients who have been discharged from the hospital, but for whom a final bill cannot be produced for one or more reasons. DNFB may be measured in days and/or dollars. Some organizations also measure DNFB by patient type and # of cases. Most hospitals establish a period after the patient’s discharge during which charge-generating departments complete the posting of charges to the patient’s account known as the “suspense” or “hold” period normally 3 to 5 days. This period is to allow all charges to be collected and sent to the account.
Accounts may be unbilled for a variety of reasons, such as the following:
Held in the “suspense” period
Documentation / dictation not available
Incomplete physician documentation (open queries)
Incorrect demographic information
Coding has not been completed
Coding completed but rejected during the billing editing process (e.g. invalid diagnosis code, missing data element, or inaccurate payer designator)
Examples or Scenario of Metric Use:
DNFB is a key measurement of revenue cycle. DNFB accounts held beyond the “suspense” period have a negative impact on cash flow and accounts receivable.
The benefits associated with effective management of the DNFB can in return be significant to the organizations. The risk of not closely managing DNFB at least through the ICD-10 transition period may have high impact on the revenue flow.
DNFB dashboard results should be used regularly to perform root cause analysis to correct process or productivity problems in the organization.
X
C. Accounts Receivable:
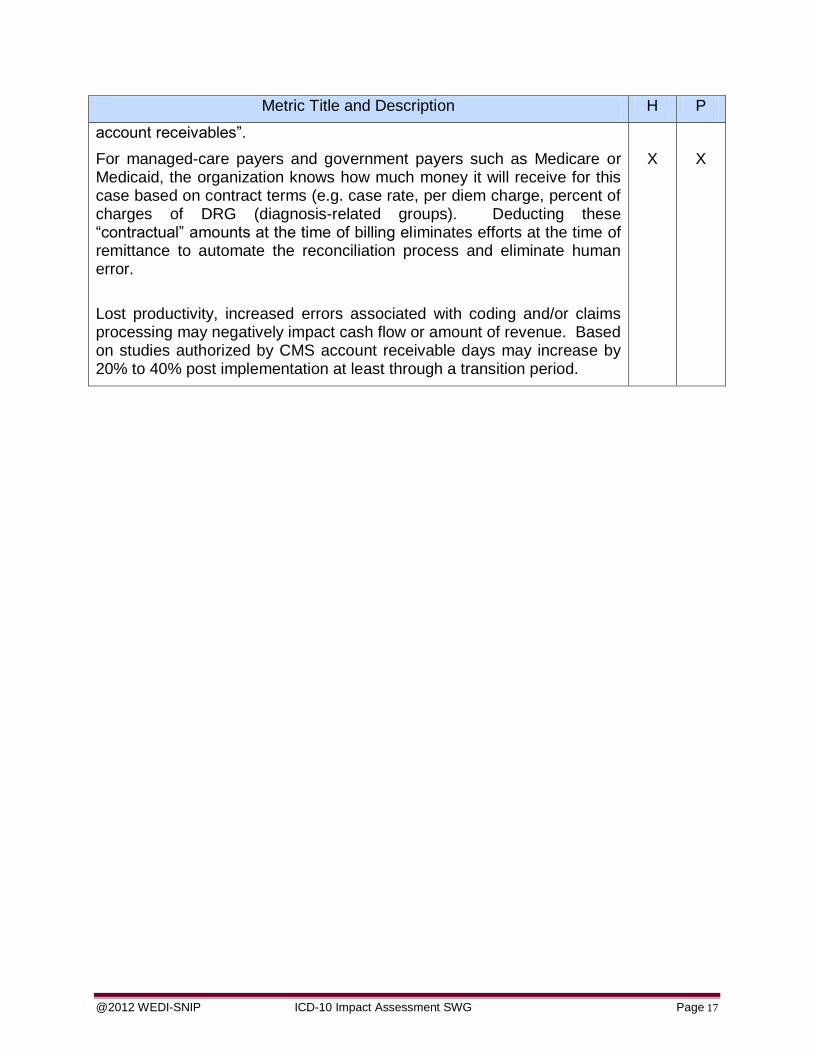
When an account has been billed but not yet paid they are classified as “receivables” and the organization is waiting to receive payment. A claim should not be considered part of receivables until a claim clears any edits and is transmitted to the payer. Some organizations, at the time of billing, calculate and deduct the amount they do not expect to be paid. If this process is done at billing, the receivables are considered “net” or “net
For managed-care payers and government payers such as Medicare or Medicaid, the organization knows how much money it will receive for this case based on contract terms (e.g. case rate, per diem charge, percent of charges of DRG (diagnosis-related groups). Deducting these “contractual” amounts at the time of billing eliminates efforts at the time of remittance to automate the reconciliation process and eliminate human error.
Lost productivity, increased errors associated with coding and/or claims processing may negatively impact cash flow or amount of revenue. Based on studies authorized by CMS account receivable days may increase by 20% to 40% post implementation at least through a transition period.
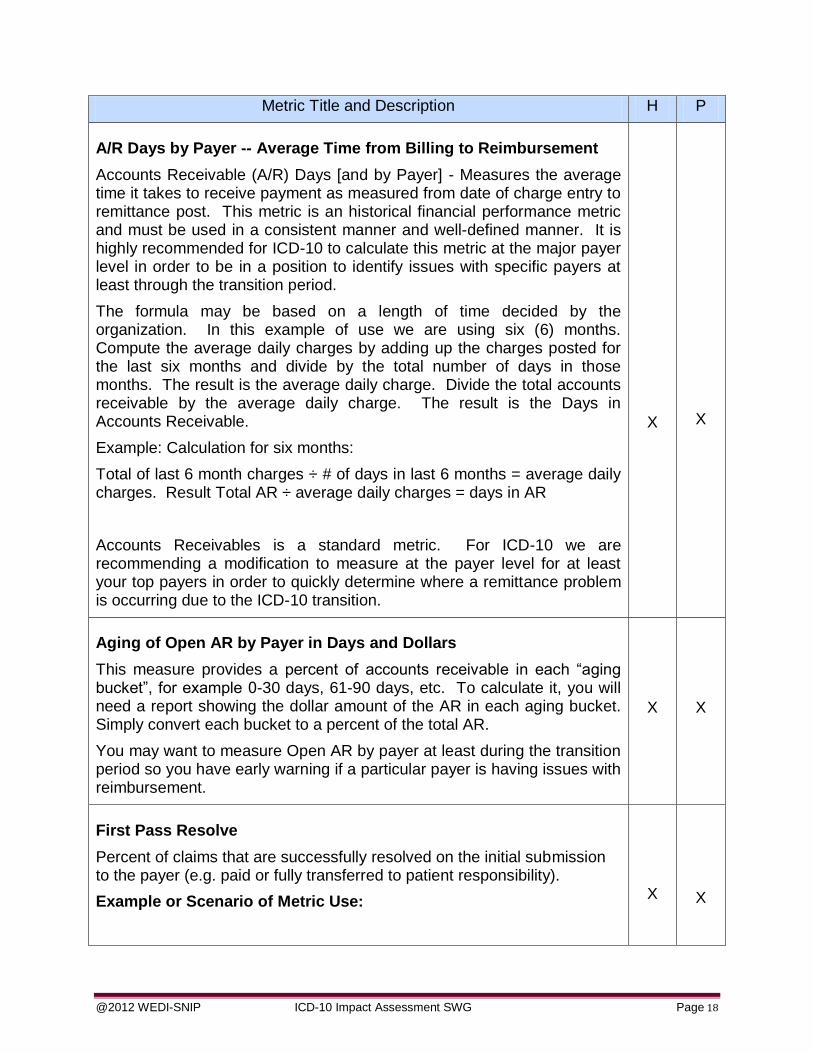
A/R Days by Payer -- Average Time from Billing to Reimbursement
Accounts Receivable (A/R) Days [and by Payer] - Measures the average time it takes to receive payment as measured from date of charge entry to remittance post. This metric is an historical financial performance metric and must be used in a consistent manner and well-defined manner. It is highly recommended for ICD-10 to calculate this metric at the major payer level in order to be in a position to identify issues with specific payers at least through the transition period.
The formula may be based on a length of time decided by the organization. In this example of use we are using six (6) months. Compute the average daily charges by adding up the charges posted for the last six months and divide by the total number of days in those months. The result is the average daily charge. Divide the total accounts receivable by the average daily charge. The result is the Days in Accounts Receivable.
Example: Calculation for six months:
Total of last 6 month charges ÷ # of days in last 6 months = average daily charges. Result Total AR ÷ average daily charges = days in AR
Accounts Receivables is a standard metric. For ICD-10 we are recommending a modification to measure at the payer level for at least your top payers in order to quickly determine where a remittance problem is occurring due to the ICD-10 transition.
X
X
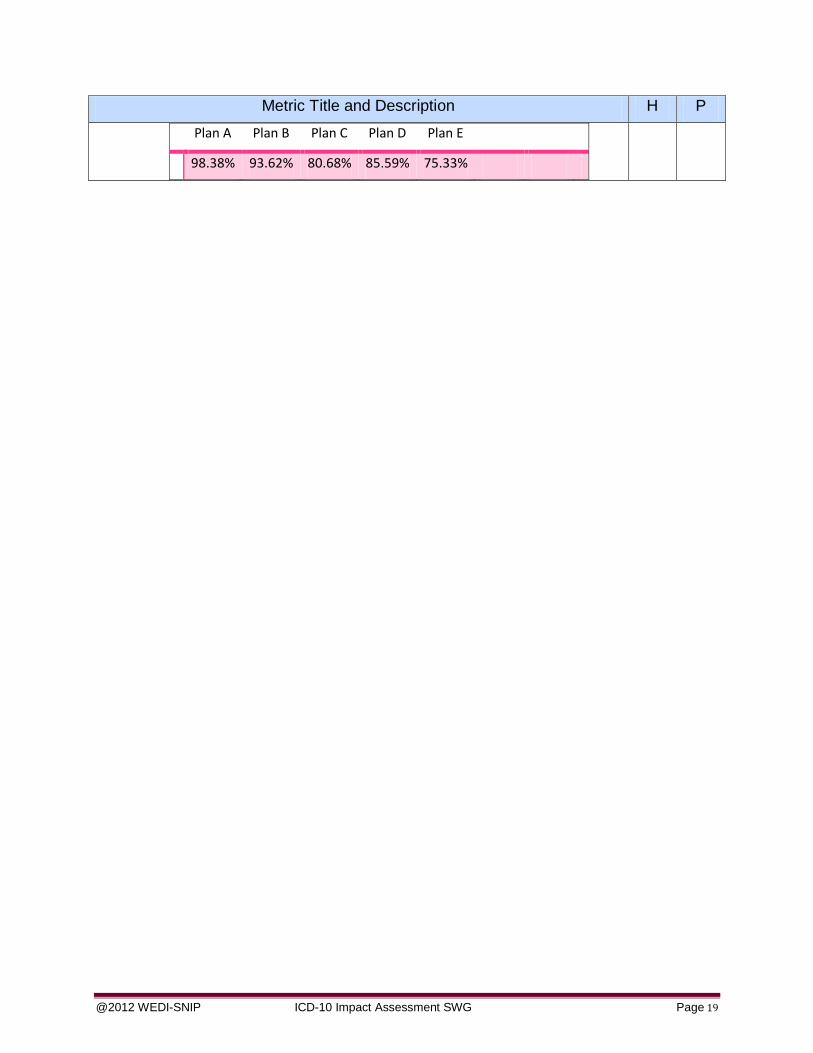
Aging of Open AR by Payer in Days and Dollars
This measure provides a percent of accounts receivable in each “aging bucket”, for example 0-30 days, 61-90 days, etc. To calculate it, you will need a report showing the dollar amount of the AR in each aging bucket. Simply convert each bucket to a percent of the total AR.
You may want to measure Open AR by payer at least during the transition period so you have early warning if a particular payer is having issues with reimbursement.
X X
First Pass Resolve
Percent of claims that are successfully resolved on the initial submission to the payer (e.g. paid or fully transferred to patient responsibility).
Percent of claims (by payer) that require re-work by the Provider. The length of time and amount of re-work required for rejects, PENDS for additional information and denials vary but have a direct impact on revenue flow. This measurement may be broken up into separate categories if possible to also capture the reason for the reject, PEND or denial. Lost productivity, increased errors associated with coding may negatively impact cash flow or amount of revenue. Based on studies authorized by CMS reject / denial rates may increase by 100% to 200% post implementation at least through a transition period.
Examples or Scenario of Metric Use:
We again highly recommend during the transition period at least to measure this data at the payer level and if possible at the type of reject or denial. Below are examples using Claim Adjustment Reason Codes (CARC) and (Remittance Advice Remark Codes [RARC])
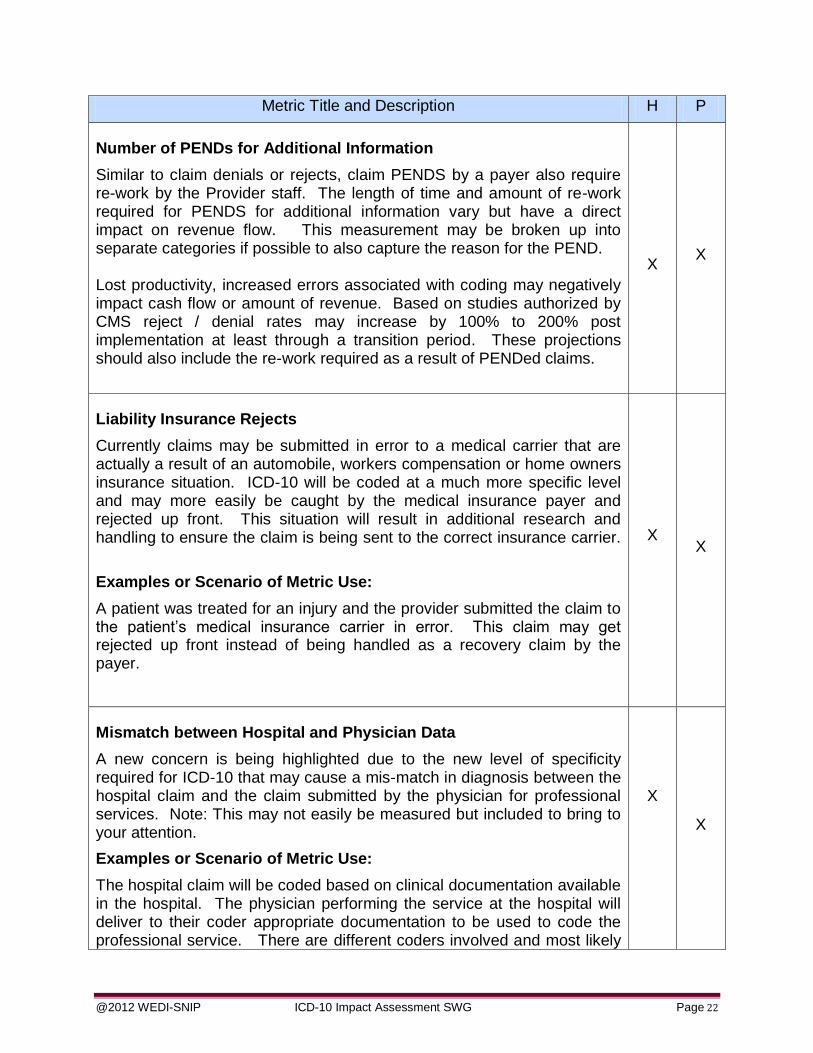
Similar to claim denials or rejects, claim PENDS by a payer also require re-work by the Provider staff. The length of time and amount of re-work required for PENDS for additional information vary but have a direct impact on revenue flow. This measurement may be broken up into separate categories if possible to also capture the reason for the PEND. Lost productivity, increased errors associated with coding may negatively impact cash flow or amount of revenue. Based on studies authorized by CMS reject / denial rates may increase by 100% to 200% post implementation at least through a transition period. These projections should also include the re-work required as a result of PENDed claims.
X X
Liability Insurance Rejects
Currently claims may be submitted in error to a medical carrier that are actually a result of an automobile, workers compensation or home owners insurance situation. ICD-10 will be coded at a much more specific level and may more easily be caught by the medical insurance payer and rejected up front. This situation will result in additional research and handling to ensure the claim is being sent to the correct insurance carrier.
Examples or Scenario of Metric Use:
A patient was treated for an injury and the provider submitted the claim to the patient’s medical insurance carrier in error. This claim may get rejected up front instead of being handled as a recovery claim by the payer.
X X
Mismatch between Hospital and Physician Data
A new concern is being highlighted due to the new level of specificity required for ICD-10 that may cause a mis-match in diagnosis between the hospital claim and the claim submitted by the physician for professional services. Note: This may not easily be measured but included to bring to your attention.
Examples or Scenario of Metric Use:
The hospital claim will be coded based on clinical documentation available in the hospital. The physician performing the service at the hospital will deliver to their coder appropriate documentation to be used to code the professional service. There are different coders involved and most likely
a different level of documentation. There is a likelihood the condition could be coded differently. The concern is under ICD-10 when these claims hit the payers which claim will drive the diagnosis and set the basis for reimbursement? The first one received? Could one claim potentially be denied due to the conflict in the resulting different diagnosis?
The average diagnosis-related group (DRG) weight for all of a hospital’s cases reimbursed using DRGs. A mix of cases in a hospital reflects the diversity, clinical complexity and the needs for resources in the population of patients in a hospital. Patients that have been treated in hospitals are classified in groups where other patients have the same condition, (based on primary and secondary diagnosis, procedures, age) complexity (comorbidities) and needs. These groups are known as Diagnosis Related Groups (DRG).
To calculate the CMI:
Patients are assigned to one of the MS-DRGs weight assigned by CMS or other payer.
Each MS-DRG has a numeric weight reflecting the national “average hospital resource consumption” by patients for that MS-DRG, relative to the national “average hospital consumption” of all patients
The CMI is then calculated by averaging the MS-DRG weight of patients discharged within the calendar year, i.e. the sum of the MS-DRG weights divided by the number of patients
The higher the hospital Case Mix Index the sicker the patients, the more extensive the surgeries and with more resources having to be used to care for those challenging cases. CMI can be used to adjust the average cost for other hospitals by dividing the average cost per patient (or day) by the hospital’s calculated CMI. The adjusted average cost per patient would reflect the charges reported for the types of cases treated in that year.
Therefore, if a hospital has a CMI greater than 1.00, their adjusted cost per patient or per day will be lower and conversely if a hospital has a CMI less than 1.00, their adjusted cost will be higher
X
DRG Shift
There are some conditions and procedures that do not map into the same DRG under ICD-9 and ICD-10. This is due to the level of specificity and increased number of codes between ICD-9 and ICD-10. A financial analysis should be performed to determine if and what financial risk these conditions present to your organization. It may be important to benchmark these high risk DRGs by volume, cost and trends. Monitoring this on a regular basis will prevent being surprised by the financial change caused
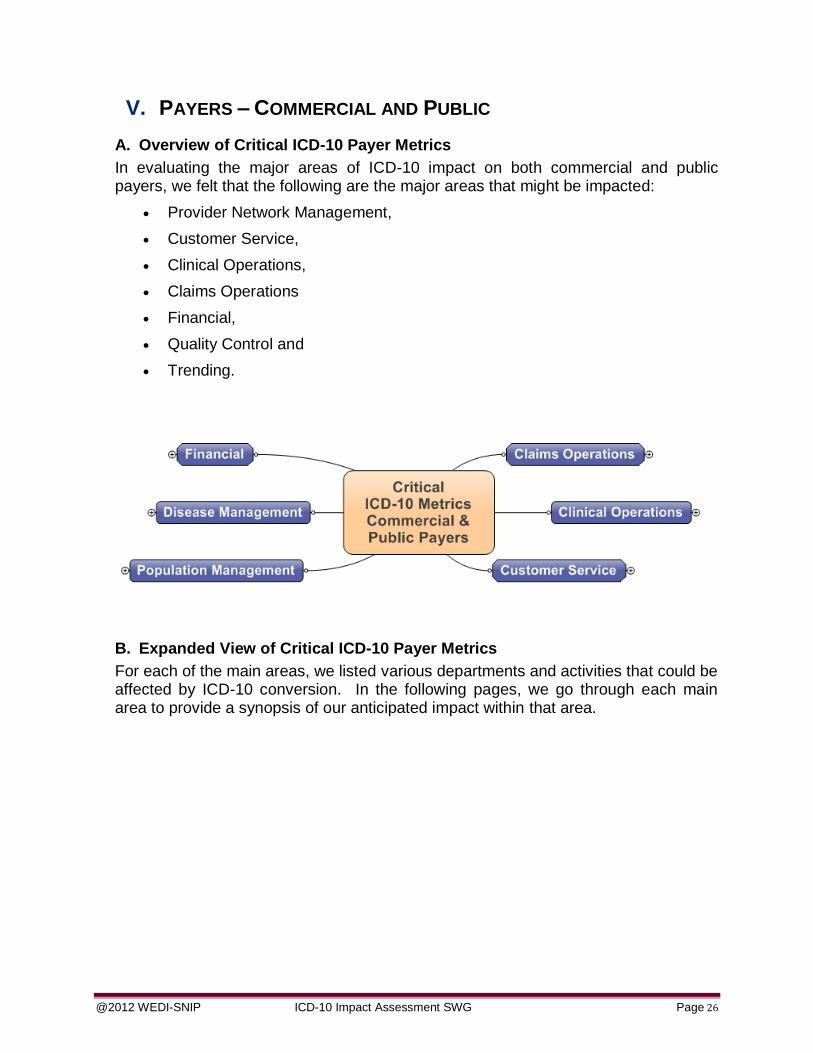
In evaluating the major areas of ICD-10 impact on both commercial and public payers, we felt that the following are the major areas that might be impacted:
Provider Network Management,
Customer Service,
Clinical Operations,
Claims Operations
Financial,
Quality Control and
Trending.
B. Expanded View of Critical ICD-10 Payer Metrics
For each of the main areas, we listed various departments and activities that could be affected by ICD-10 conversion. In the following pages, we go through each main area to provide a synopsis of our anticipated impact within that area.
Standard Operating Metrics: The payers standard operating metrics will become increasingly important with the implementation of ICD-10 to monitor the automation efficiency and deviation from prior claim payment cycle times. Some of these operational metrics will include:
A. Customer Service
Call Volumes
Payers can expect an increase in the numbers of calls from providers as they question diagnosis/procedure code billing procedures; check on the status of pended claims; and question the reason for denied claims for billing errors due to policy changes related ICD-10. This increase in volume may require additional resource to handle the volume at least during the initial transition period.
Calls by Type
Monitor the types of calls to proactively identify the root cause of underlying issues. A payer may want to monitor call volumes by:
Source of initiation (provider, member, vendor, etc…),
Primary purpose of call (eligibility, medical authorization, payment discrepancy, payment cycle, medical necessity, etc…)
This information will provide the payer data to support and identify potential impacts of ICD-10 and promote timely issue remediation through systemic and operational efforts.
Talk Time
Due to the complexity of ICD-10, questions related to billing may be more extensive as providers question proper means of billing for services rendered, especially related to denied claims.
Speed to Answer
This is an important aspect of customer service and you will want to ensure that due to increase in call volume callers do not need to remain on hold for extended periods of time. It may be valuable to include some new pre-recorded messages that answer the most common questions or refer to a FAQ site that is robust in providing answers.
The payers’ clinical performance and operating metrics will become increasingly important with the implementation of ICD-10 to monitor the benefit and eligibility automation efficiency and any deviation from prior benefit management baselines. Some of these metrics will include:
Number of Authorizations
Authorizations and pre-certifications are a concern for Providers especially during the transition period when services may cross the compliance date. Payers may elect to use different approaches to handle this situation. The process may increase the number of authorizations that need to be processed during this timeframe. It may be important to monitor the number of authorizations being requested during at least the transition period.
Turn-around Time for Authorizations Processing
Due to the transition period and the potential for additional complexity it may increase the workload to process these authorizations. There is also a possibility that any auto-authorization logic may need to be validated during this timeframe.
Number and Type of Medical Reviews
It may be important to capture the percent of claims requiring medical review by provider, type of claim and the average turnaround time for each impacted claim. This process may require additional resource during the transition period due to the complexity of the new code set and/or new processes implemented to support ICD-10.
C. Claims Operations
The payers’ claim adjudication performance and operating metrics will become increasingly important with the implementation of ICD-10 to monitor the claim payment automation efficiency and any deviation from prior adjudication baselines. Some of these metrics will include:
Claims Auto Adjudication Rate – Percent of total claim for a defined period of time that are adjudicated without manual intervention.
Claims Accuracy or Rework – Percentage of claims not adjudicating correctly and resulting in rework due to an ICD-10 impact.
Claim Adjudication Cycle Time – Average days to adjudicate the claim. This metric could be presented by claim or provider type.
Suspended or Pended Claim Rates - The count and/or percentage of suspended claims by provider type and claim type.
Aged Claim Report – The aging of claims by dollars and volumes (count and percentage) for periods of 30, 60, 90 and Over 120 days that will
reconcile to the total outstanding claim population at any given time. This could be presented at a provider, provider type or claim type level.
Quality Assurance and Audit Findings / Results
Appeals
Claim Auto Adjudication Rate
It is expected that ICD-10 will eventually allow the auto adjudication rate to increase as fewer claims will require attachments. However, there will be a conversion time period where these rates may drop due to excessive denials and possible programming errors. In order to keep a handle on the effect of ICD-10 conversion, it will be important to benchmark the adjudication rate prior to conversion as well as tracking it through conversion to post implementation.
Claim Accuracy
It is important to benchmark pre ICD-10 claim accuracy data in order to account for potential spikes in claim errors during and post implementation.
Claim Turn-around Time (Adjudication Cycle Time)
The time it takes to receive payment is a critical factor to Providers. This equates to claim turn-around time to Payers. It is important to benchmark this current metric in order to monitor during and post implementation.
Claim PEND by Type
It is expected that ICD-10 will ultimately reduce the number of claims that PEND due to the more detailed diagnosis information being submitted. It will be important to monitor pended claims by reason code to make sure that properly submitted claims are not pended inappropriately.
Aged Claim Backlog
All payers strive to keep their aged claim backlog low. While there may be a possible spike in the claims backlog during implementation, payers must do everything to ensure that they are going into implementation with a minimum number of aged claims in order to deal with processing new claims being submitted under ICD-10. Aging of claims is normally measured by dollars and volumes (count and percentage) within timeframe buckets. It may be reported by provider, provider type or claim type levels.
Prior to ICD-10 implementation, it will be wise to make sure that any internal or external audits are completed. If any regularly scheduled audits are expected to take place during implementation, communicate with the auditors to see if the audits can be scheduled in advance or postponed until after implementation is complete.
Appeals:
It is anticipated the number of appeals submitted will increase during the transition period due to the sheer complexity and potential for errors with ICD-10. It is recommended this situation be monitored and additional resource be made available to handle this temporary increase in activity. You may consider benchmarking and monitoring by volume and type of appeals.
D. Financial
The payers’ claim adjudication performance and operating metrics will become increasingly important with the implementation of ICD-10 to monitor the claim payment automation efficiency and any deviation from prior adjudication baselines. Some of these metrics will include:
Medical Cost Per Member Per Month
Case Mix Index (CMI) – Analysis of the allocation of payments (dollars and percentage) between DRG and percent of charge payment, by State, Region and/or provider type.
Incurred but Not Reported (IBNR) - An accrual calculation to determine a claims reserve for services rendered but not yet billed as of the reporting date. The calculation is based on prior claim and authorization experience, along with other factors to determine the dollar value of services rendered as of a certain date.
DRG Shift – there are some conditions and procedures that do not map into the same DRG under ICD-9 and ICD-10. This is due to the level of specificity and the increased number of codes between ICD-9 and ICD-10.
The average diagnosis-related group (DRG) weights for all of an organization’s line of business Medicare, Medicare Advantage or other commercial business volume. A mix of cases reflects the diversity, clinical complexity and the need for resources in the population of patients/members. Patients that have been treated are classified in groups where other patients have the same condition, (based on principal and secondary diagnoses, procedures, age) complexity (co-morbidities) and needs. These groups are known as Diagnosis Related Groups (DRG).
To calculate the CMI:
Patients are assigned to one of the MS-DRGs weight assigned by CMS
Each MS-DRG has a numeric weight reflecting the national “average resource consumption” by patients for that MS-DRG, relative to the national “average consumption” of all patients
The CMI is then calculated by averaging the MS-DRG weight of patients within the calendar year, i.e. the sum of the MS-DRG weights divided by the number of patients
The higher the Case Mix Index the sicker the patients, the larger the surgeries and with more resources having to be used to care for those challenging cases. CMI is an important measurement and widely used in reimbursement of a population by Medicare and Medicaid. This metric is analyzed regularly by finance and will need to be monitored closely for shifts as a result of ICD-10.
IBNR- Incurred but Not Reported
IBNR consists of contractual services rendered for member that have not been billed by the provider, resulting in a payable for the payer to offset premium revenues for the same period. Though this is an actuarial calculation the periodic monitoring of the account balance through the ICD-10 transition may provide the opportunity to identify ICD-10 related issues. The balance may be impacted for a variety of reasons, such as the following:
Held by the provider in a “suspense” period to ensure completeness of bill
Documentation / dictation not available
Incomplete physician documentation (open queries)
Incorrect demographic information
Coding has not been completed
Coding completed but rejected during the billing editing process (e.g. invalid diagnosis code, missing data element, or inaccurate payer designator)
Increased coding rejections will increase the outstanding provider billing; while impacting negatively the provider cash flow and payer accounts payable balance.
The risk of not closely managing IBNR through the ICD-10 transition period may have high impact on the claim payable balance and consequently the medical loss ratio.
DRG Shift
There are some conditions and procedures that do not map into the same DRG under ICD-9 and ICD-10. This is due to the level of specificity and increased number of codes between ICD-9 and ICD-10. A financial analysis should be performed to determine if and what financial risk these conditions present to your organization. It may be important to benchmark these high risk DRGs by volume, cost and trends. Monitoring this on a regular basis will prevent being surprised by the financial change caused by these DRGs.
E. Disease Management Analysis
Disease management is "a system of coordinated healthcare interventions and communications for populations with conditions in which patient self-care efforts are significant." To be effective it requires 'whole system' implementation with community social support networks, a range of satisfying occupations and activities relevant to the context, clinical professionals willing to act as partners or coaches and on-line resources which are verified and relevant to the country and context. Knowledge sharing, knowledge building and a learning community are integral to the concept of disease management. It is a population health strategy as well as an approach to personal health. It may reduce healthcare costs and/or improve quality of life for individuals by preventing or minimizing the effects of disease, usually a chronic condition, through knowledge, skills, enabling a sense of control over life (despite symptoms of disease) and integrative care.
We are not addressing the medical benefits in these suggested metrics, although it is assumed the availability of data will greatly increase the ability to identify and management both diseases and enrollees. We are including the more traditional business measurements of a disease management program include:
Number of people enrolled Percentage of members in program that generate savings
Healthcare cost associated with the actively managed members
Net annual savings amount by disease program
F. Population Management Analysis
Population management takes disease management to the next level. A population management program is designed to manage all health plan members who have a disease, regardless of the severity of individual cases. For example, every plan member with diabetes is assumed to be a program participant and is managed as such, unless he or she requests otherwise. By contrast, disease management programs usually manage only members with the most severe forms of the disease and only those who volunteer to participate.
By managing an entire population with a given disease, population management programs can institute preventive measures for less severely afflicted members while continuing to manage the existing ailments of the more severely afflicted, higher-cost members. Population management also emphasizes effective patient self-management through member education and care support. Over time, this approach results in a lower percentage of high-risk, high-cost members in the population mix. For those members who receive preventive care and education regarding their condition, the onset of co-morbid complications associated with a disease can be delayed or eliminated.
We are not addressing the medical benefits in these suggested metrics, although it is assumed the availability of data will greatly increase the ability to identify and management both diseases and enrollees. We are including the more traditional business measurements of a disease management program include:
Number of people enrolled
Percentage of members in program that generate savings
Healthcare cost associated with the actively managed members Net annual savings amount by disease program
A/R Days Measures the average time it takes to receive payment as measured from date of charge entry to remittance post.
Accounts Receivable When an account has been billed but not yet paid they are classified as “receivables” and the organization is waiting to receive payment.
Case Mix Index CMI – The average diagnosis-related group (DRG) weight for all of an organization’s line of business Medicare, Medicare Advantage or other commercial business volume. A mix of cases in a hospital reflects the diversity, clinical complexity and the needs for resources in the population of patients in a hospital
CDI See “Clinical Documentation Improvement”
Claims Adjudication Rate
Percent of total claims for a defined period of time that are processed and paid (adjudicated) without manual intervention.
Clinical Documentation Improvement
Clinical Documentation Improvement (CDI) – is a program implemented in facilities with the purpose of conducting concurrent and retrospective reviews of inpatient health records for conflicting, incomplete or nonspecific provider documentation. The reviews are conducted by CDI professionals and often written queries to the provider to ensure complete documentation is included in the medical record. These efforts result in improved documentation, coding and reimbursement.
CMI See “Case Mix Index”
Diagnosis Related Groups
DRG - Patients are classified in groups where other patients have the same condition, (based on primary and secondary diagnosis, procedures, age, complexity (comorbidities) and needs. These groups are knows as Diagnosis Related Groups (DRG).
Discharged Not Final Billed
DNFB – consists of accounts for patients who have been discharged from the hospital, but for whom a final bill cannot be produced for one or more reasons.
Disease Management
Disease management is “a system of coordinated healthcare interventions and communications for populations with conditions in which patient self-care efforts are significant”.
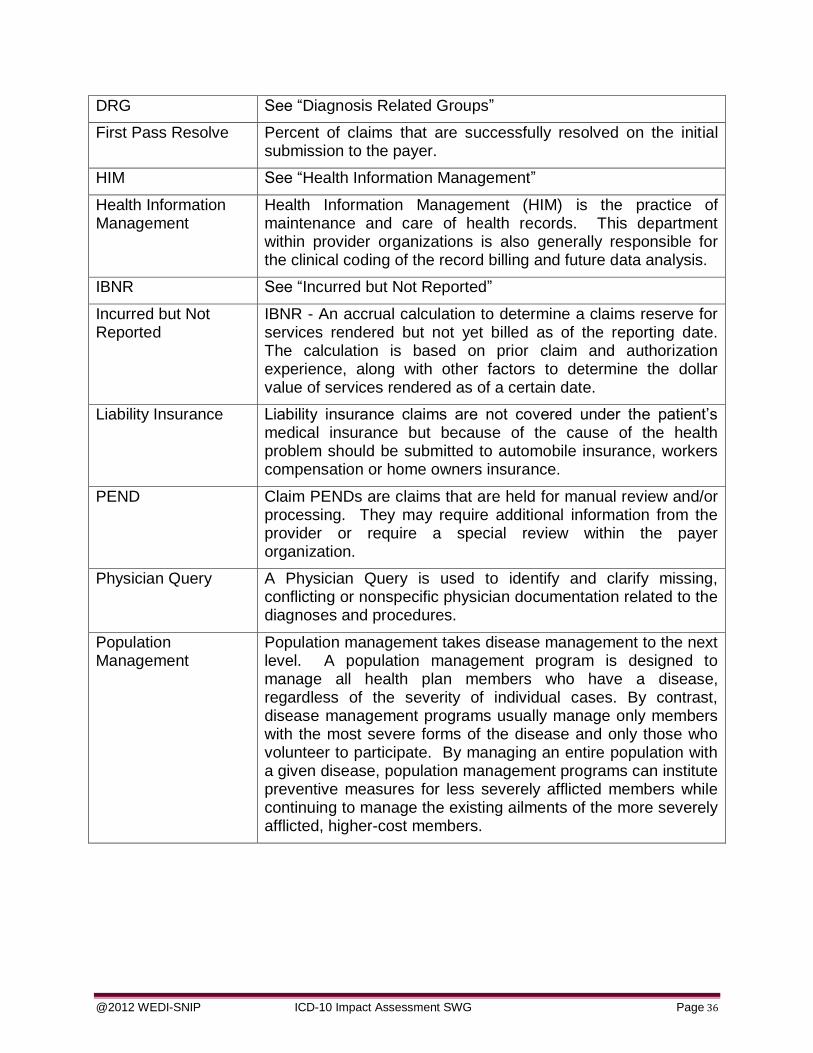
First Pass Resolve Percent of claims that are successfully resolved on the initial submission to the payer.
HIM See “Health Information Management”
Health Information Management
Health Information Management (HIM) is the practice of maintenance and care of health records. This department within provider organizations is also generally responsible for the clinical coding of the record billing and future data analysis.
IBNR See “Incurred but Not Reported”
Incurred but Not Reported
IBNR - An accrual calculation to determine a claims reserve for services rendered but not yet billed as of the reporting date. The calculation is based on prior claim and authorization experience, along with other factors to determine the dollar value of services rendered as of a certain date.
Liability Insurance Liability insurance claims are not covered under the patient’s medical insurance but because of the cause of the health problem should be submitted to automobile insurance, workers compensation or home owners insurance.
PEND Claim PENDs are claims that are held for manual review and/or processing. They may require additional information from the provider or require a special review within the payer organization.
Physician Query A Physician Query is used to identify and clarify missing, conflicting or nonspecific physician documentation related to the diagnoses and procedures.
Population Management
Population management takes disease management to the next level. A population management program is designed to manage all health plan members who have a disease, regardless of the severity of individual cases. By contrast, disease management programs usually manage only members with the most severe forms of the disease and only those who volunteer to participate. By managing an entire population with a given disease, population management programs can institute preventive measures for less severely afflicted members while continuing to manage the existing ailments of the more severely afflicted, higher-cost members.