WHO DECIDES? POLICY RIGHTS AND COALITION GOVERNMENT Lucy Goodhart Columbia University [email protected]February 2007 ________________________________________________________________________ I thank David Rueda for comments on an earlier version of this paper and Julien Demoulin-Smith for research assistance. All remaining errors are my own.
Transcript
WHO DECIDES? POLICY RIGHTS AND COALITION GOVERNMENT
February 2007 ________________________________________________________________________ I thank David Rueda for comments on an earlier version of this paper and Julien Demoulin-Smith for research assistance. All remaining errors are my own.
1
ABSTRACT
Who decides policy in a coalition government? The question is important to political scientists and presumably to voters. It plays a central role in a literature on government accountability and economic voting. Empirical analysis of policy-making, however, faces considerable challenges. This paper circumvents those challenges and infers macro-economic policy using the actual record of the macro-economy in a specification based on Alesina’s rational partisan theory (Alesina, 1987). The testing strategy relies upon the variation we see in party control of different cabinet ministries under coalition government. According to rational partisan theory, partisan policy preferences will only have real effects on the economy after a surprise change in the macro-economic policy-maker, as after an election. By tabulating changes in party control of different ministerial positions with changes in the real economy, therefore, we can infer which cabinet positions actually confer policy rights and are decisive in macro-economic policy. In particular, we can test whether the Minister of Finance has full power over macro-economic policy, as posited by Laver and Shepsle’s theory of ministerial discretion (1996). The analysis is implemented by extending Alesina’s model of rational partisan theory using a set of interaction terms that isolate the effect of party change in different positions and is estimated using data on government composition and ministerial appointments from Woldendorp, Keman and Budge (2000) and macro-economic data from the IMF and OECD.
2
I. INTRODUCTION
As Martin and Vanberg (2004) note, although great progress has been made in
understanding coalition government, the majority of analysis has focused on cabinet formation
and termination, leaving the question of how coalition cabinets function in office relatively
unexplored. Much of the information we possess on coalition government is thus demographic
in nature – a record of births and deaths – leaving the legislative activities and policy coordination
of coalition governments a black box. We still do not fully understand how the policy
preferences of different cabinet members are aggregated to produce government policy, the key
quantity for voter welfare.
The lack of attention given to policy coordination in coalition governments is connected
to the opacity of the policy-making process. Coalition negotiations over policy are not directly
observed so that hypotheses on the power and influence of different parties are not readily tested.
Many analysts fall back on the task of attempting to infer individual party input into policy from
the collective record of cabinet decisions.
A cabinet’s collective decisions, however, are not simply a source of data. For cabinet
members, they are a crucial resource and potential liability, as the output of coalition
governments directly affects their constituents. Delegation of specific cabinet jurisdictions to
different parties creates a principal-agent problem, since individual ministers have an incentive to
exploit “slack” in coalition contracts to push policy in their favored direction.
The most prominent theory of cabinet decision-making rejects the possibility that cabinet
members from one party can ever monitor or control the actions of ministers from another.
Coalition contacts, if they exist, are moot. Instead, the parties negotiating the coalition treat
policy outcomes in each dimension as following exactly the preferences of the party holding the
relevant ministry. Laver and Shepsle (1996) note the long tradition of ministerial discretion in
cabinet government and the deference given to technical expertise within separate departments.
In addition, they point out that ministers decide which issues to bring to cabinet and that
individual departments have significant power over the shape of proposals that are presented in
that forum. Given the obstacles to transmission of information, and the gate-keeping power of
ministers, Laver and Shepsle theorize that coalition partners resign themselves to ministerial
defection and grant full autonomy to individual ministers in their particular jurisdiction, a theory
3
known as “ministerial discretion”.1 Since political parties under most parliamentary systems are
cohesive, this implies that parties assume full rights over the policy areas attached to individual
departments. The bargaining over portfolios that takes place between political parties in a
coalition, therefore, is exactly equivalent to negotiating a coalition policy contract.
In more recent years, scholars of coalition behavior have noted that coalition members
possess mechanisms by which they can both monitor the policy choices of other coalition
members and penalize them for defection from an implicit coalition contract. Thies (2001)
analyzes the role of junior ministers as “watchdogs” while Martin and Vanberg (2004, 2005)
show how the threat of parliamentary scrutiny and delay can discourage policy slack by coalition
partners. Evidence from hiring patterns and the duration of parliamentary debates supports the
claim that these mechanisms are put into practice in ways consistent with theory. Finally,
narrative accounts of cabinet policy-making contain diverse examples of inter-party coordination
via cabinet sub-committees, including the “concertation” procedure in Austria (Gerlich and
Müller in Blondell and Müller, 1997) and the practice in Norway under Willcook’s coalition
cabinet of not bringing “tricky” issues to cabinet until they had been discussed by the Prime
Minister and the chairmen of the other two coalition parties (Eriksen in Blondell and Müller,
1997).
The existence of monitoring and control mechanisms, however, does not decisively prove
the case against ministerial discretion. While the evidence supports the case for joint policy-
making, the tests are vulnerable to the charge that the observed mechanisms exist for reasons that
are incidental to policy coordination and control. Observed variation in the length of
parliamentary scrutiny (for instance) could be consistent with a model in which ministers exert
policy discretion but backbenchers have stronger interest in debating bills on which coalition
preferences are divergent. Further, while the analysis suggests that political parties in a coalition
can police a joint policy agreement, it cannot indicate the weight that each might hold in that
agreement.
Meanwhile, the identity of the policy-maker, whether individual or joint, is not simply a
curio of coalition studies, but relates to a significant literature on economic voting. As Powell
and Whitten (1993) point out, if voters cannot ascribe responsibility for economic outcomes to
1 The theory of ministerial discretion is by no means the major output of Laver and Shepsle’s work. Rather, as the authors make clear on p. 33, it is a building block of a theory that imposes necessary structure on negotiations over multi-dimensional policy by reducing potential outcomes to a finite set of discrete points in ideological space that conform to portfolio allocations.
4
any particular member or members of a coalition, the economy will be less useful as a signal of
incumbent competence. Votes and popularity will respond less to macro-economic outcomes in
coalition governments because “clarity of responsibility” is lower. Thus, voter behavior and
incumbent incentives are arguably very different across coalition and majoritarian systems (see
Kiewiet, 2000, and Anderson, 2007). To test this theory accurately, however, we need solid
priors about whom the public might hold responsible. If the theory of ministerial discretion is
correct, then models of economic voting under coalition, which assume the coalition as a whole
as the responsible agent, are likely to obscure the true relationship between popularity and the
economy. Instead, we should test whether the popularity of the party that holds policy rights for
the macro-economy feels the effect of public praise or blame.
II. THEORY
We return to the issue of how to determine the influence of different agents over coalition
policy. In particular, any testing strategy quickly encounters two significant challenges. The first
is how to measure policy outputs using some standard metric that recognizes the full range of
policy instruments that governments can employ, including legislative enactment, budgetary
expenditure and regulatory change (see, for instance, Budge and Keman, 1990). The second is
how to locate the policy preferences of any particular party (taking each party as a unitary actor)
on the same metric, or in the same space, as policy outputs so that one can specify the distance
between ultimate policy outputs and party preferences. In this paper, I focus on one particular
policy area in which the problem of identifying policy outputs is circumvented because of our
ability to infer policy actions. Specifically, I look at macro-economic policy and use actual
outcomes to infer policy actions by incumbent policy-makers that either expand or contract the
real economy. The focus on macro-economic policy carries an additional advantage in that it is
easier to locate party preferences over macro-economic policy than on other policy dimensions
using available expert surveys. The use of such surveys (and of computer coding of manifestoes)
to produce uni-dimensional measures of party position is not uncontroversial. Frequently these
measures have been criticized as an inaccurate portrayal of party conflicts that are inherently
multi-dimensional. Scholars of electoral de-alignment and realignment, for instance, have
speculated that the declining salience of material issues has redirected attention towards issues of
the environment, quality of life, and gender equity (see Inglehart, 1984, and Dalton et al 1984).
Yet in defense of our use of such expert surveys, Huber and Inglehart (1995) demonstrate that
macro-economic policy is the main, under-lying latent variable that generates the left-right axis of
party competition and conclude that most political systems can be fully described by a single axis
5
of competition. If these widely used measures of party position are valid for any policy area, it is
most likely macro-economic policy.
Taking the macro-economy as my case study for coalition policy-making, I examine the
effect of changes in different cabinet positions, including the Ministry of Finance, on economic
outcomes. Given the prominence of the theory, I adopt ministerial discretion as the sustained or
null hypothesis and test it against conceptually plausible alternatives using a strategy based on the
logic of Alesina’s rational partisan theory (1987). To date, empirical testing of rational partisan
theory has generally assumed that a single incumbent sets policy and has sought confirmation of
partisan effects following from a change in the incumbent that moves policy preferences left or
right. Instead, I propose that we implement the model in a manner that will allow the data to
select the relevant policy-maker based on the magnitude of partisan effects that we observe
following changes in party control of different positions. The section below explains the
mechanisms laid out in rational partisan theory and how the model can be modified to serve the
purposes at hand.
The foundational work on partisan theory was written by Hibbs (1977) who argued that
parties adopt markedly different positions on macro-economic policy due to distributional
concerns for their electoral base. Left-wing parties are more concerned with the impact of
unemployment on workers (who vote for them in greater numbers) and thus adopt policies that
reduce unemployment at the expense of higher inflation. The predicted result is that growth (and
inflation) is higher under left-wing governments while unemployment is lower. Alesina (1987)
updated this model to incorporate rational expectations on the part of voters, who anticipate the
policy actions of different governments. Because voters incorporate expected inflation into their
wage contracts, the long-term impact of partisan policy preferences on growth and unemployment
are negated. Nominal wage contracts, however, are set for determinate periods, generally two
years, so that an unexpected change in the partisan preferences of the policy-maker can have real
effects on output via a change in the real wage level. Specifically, a change in the preferences of
the incumbent to the right will result in a lower rate of inflation and an increase in real wages,
reducing the demand for labor, shrinking output and simultaneously increasing unemployment.
These real effects on growth and output, termed rational partisan cycles, occur only after a
surprise change in the identity of the incumbent policy-maker, as after an election or a change in
cabinet composition following an intra-electoral dissolution. The testable implication of rational
partisan theory is that a change to a right (or more right-wing) government will be followed by a
period of lower growth (higher unemployment) before nominal wage contracts are up-dated. For
6
equivalent reasons, a move to a left (or more left-wing) government should be associated with a
temporary period of higher growth (lower unemployment) as increased inflation erodes real
wages and expands labor demand. The theory is tested using the observed sequence of real GDP
growth (or rate of unemployment) to determine whether changes in the preferences of incumbents
have significant effects, albeit during the transitional period before economic agents up-date
nominal wage contracts to reflect the actual change in inflation. The model is generally specified
by regressing real growth (or unemployment) on its own lags, a measure of the global business
cycle, and a dummy variable indicating a change in government to the right or left.
Empirical testing has been undertaken by Alesina et al (1997) and others (Paldam, 1989b)
to see whether “politics matters” and has led to a general affirmation of rational partisan theory.
Indeed, rational partisan theory gains strong and robust support in the U.S. and cross-nationally
for advanced industrial societies, a finding which differentiates it from models of opportunistic
cycles originating with Nordhaus’ 1975 work on political business cycles (Alesina et al, 1997).
The empirical tests used in support of rational partisan theory can also be used, however,
to determine who among a set of candidate policy-makers controls macro-economic policy
because of independent variation in party control over different cabinet positions in coalition
governments. We can observe government changes, for instance, in which the Finance Minister
changed, but other potential decision-makers in the cabinet (such as the Prime Minister or the
largest Party) did not and, by contrast, observations where these other actors changed, but the
Minister of Finance did not.2 These examples would include several coalition governments in
Belgium in the 1970’s and 1980’s in which the largest party, and the occupant of the Prime
Minister’s office, was consistently the centrist Christian People’s Party but the position of
Minister of Finance was held at different times by the Flemish Socialist Party and the more right-
leaning Party of Liberty and Progress (PVV).3 Equally, it would include examples from Finland
in the 1990’s where the Minister of Finance position was held by the right-leaning National
2 In what follows, I assume that it is the Minister of Finance who controls macro-economic policy, despite the fact that the related ministries of Economic Affairs and Treasury exist in many coalition governments (Woldendorp, Keman and Budge, 2000). The Minister of Finance position exists in all cabinets and is held to be the most important portfolio in all twelve of the country cases analyzed by Laver and Shepsle (1996, p.153). By contrast, the Minister of Economic Affairs is generally charged with responsibility for labor market regulation and management and the Treasury Minister with responsibility for public debt. 3 Woldendorp, Keman and Budge (2000) define a government change as a change in party composition of the coalition, a change in the Prime Minister, or a resignation in an inter-election period followed by the reformation of the government with the same party composition and Prime Minister. It is possible to observe, therefore, by this definition, government changes that involved no change in the Finance Minister, the Prime Minister or the Minister of Finance.
7
Coalition (or KOK) across two successive and different governments in which the largest party,
and Prime Minister, was first the Center Party (KESK) and second the Social Democrats. Third,
it would include a switch in the Dutch governing coalition in 1994. At that time, the Christian
Democrats, who had been the largest party in the coalition and had held the position of Prime
Minister, left the coalition. They were replaced by the PvdA (the Dutch Labor Party) who had
previously been in the coalition but as one of the junior partners. The PvdA assumed control of
the Prime Minister’s office, which might be associated with a leftward tilt in policy preferences of
the coalition as a whole. At the same time, though, the free-market liberal party (or VVD)
entered the coalition and were awarded the Ministry of Finance, which the PvdA had just vacated.
Thus, we would have completely contrasting predictions on macro-economic policy depending on
which actor was thought to decide macro-economic policy: the Finance Minister or the Prime
Minister backed by the largest party. Such examples of independent change in party control of
the Ministry of Finance and party control of other positions are not legion but they are sufficiently
plentiful to permit statistical study of their impact.
If the theory of ministerial discretion is correct, we should only observe real effects in the
economy after a change in government moves the Ministry of Finance to a party with different
preferences. There should be no real effect when a change in government keeps the Ministry of
Finance in the hands of the same party. Thus, by tweaking the methodology of Alesina, Roubini
and Cohen (1997) to distinguish changes in ministerial allocation from simple changes in
government, we can employ rational partisan theory to determine whether macro-economic
policy rights in coalition government follow the hypothesis of ministerial discretion. The
approach is similar to that of Bawn (1999), who uses changes in the number and preferences of
potential veto players to test the impact that these agents have over legislative output and closely
related to that if Bräuninger and Hallerberg (2003) who look for shifts in spending upon
government and ministerial changes. In this paper, the tests are estimated empirically for 16 of
the 17 parliamentary democracies analyzed in Alesina, Roubini and Cohen (1997) using quarterly
data for the twenty-five year period 1973-97.4 The start of the sample period is established by the
4 The countries are Australia, Austria, Belgium, Canada, Denmark, Finland, France, Germany, Ireland, Italy, Japan, The Netherlands, New Zealand, Norway, Sweden, and the United Kingdom. Of these countries, three (Australia, Canada, and the UK) never experienced a coalition government while another four (Belgium, Finland, Germany, The Netherlands) were governed exclusively by coalitions over the sample period. I do not include Switzerland in the data set. This is because the norm of “collegiality” in the Swiss Federal Council (analogous to the cabinet) in which all major parties are represented prevents me from forming any theoretical priors over which actors should control macro-economic policy (Church, 2004). Finally, I do not include the U.S. in the data set because of the difficulties of ascribing policy control to different branches of governing in a presidential system.
8
break-up of the Bretton Woods system which reduces the concern that coefficients are unstable
across regime change. Alesina et al (1997) present empirical results for the full period 1960-93
but report that the findings on rational partisan cycles are markedly stronger after 1972 and with
the greater discretion in macro-economic policy that came with flexible exchange rates. Finally,
in many country cases, the starting date for the sample is given by the availability of macro-
economic data and frequently falls after 1973.5 Information on the party membership of
government and party control of particular positions is drawn from the data set originally
presented by Woldendrop, Keman and Budge (1993) in the European Journal of Political
Research and up-dated (with additional country cases) in their 2000 volume.6 The data source on
government composition also sets the end date of the sample as the data extends only to the end
of 1997. Each party is considered a unitary actor so that individual ministers are assumed to
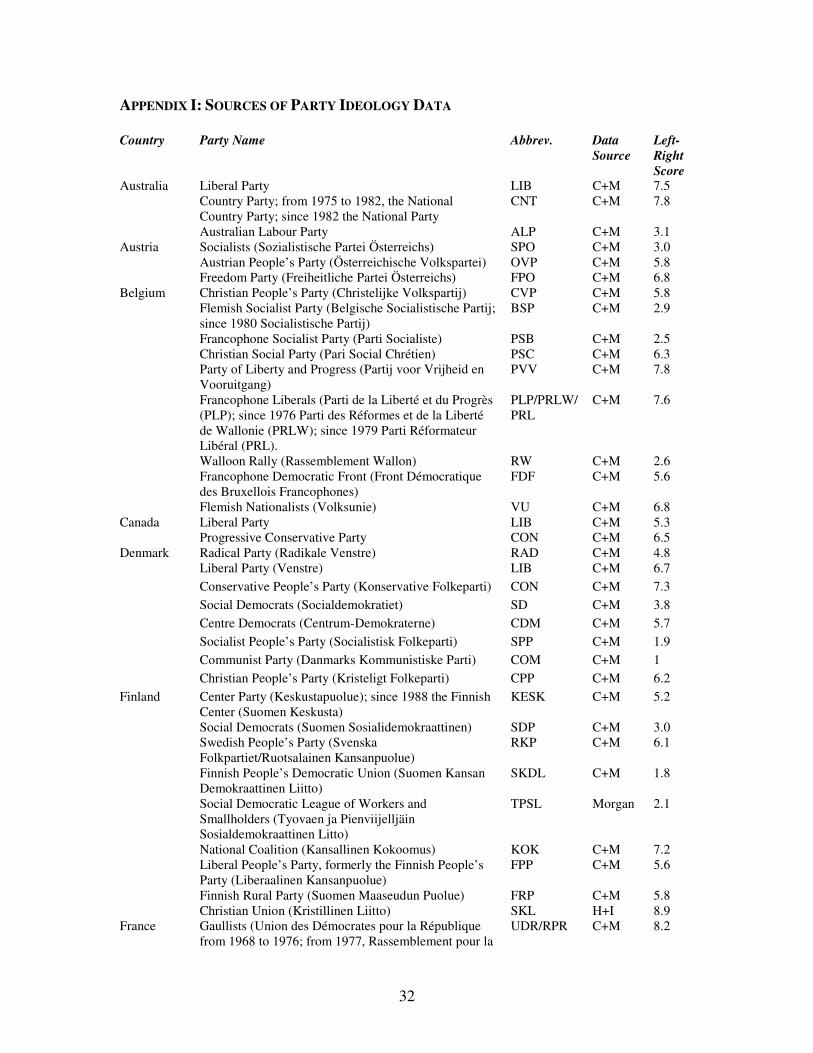
follow the preferences of their parties.7 Measures of party positions, used in order to identify left-
right changes in ministerial appointments, were taken from studies using expert surveys. These
measures are adopted as acceptable approximations of each party’s preferences over the macro-
economy. In most cases the expert judgments are taken from the survey by Castles and Mair
(1984) which falls just before the mid-point of my sample period. When expert judgments were
not available for a particular party from this source, the information was supplemented using
Morgan (1976), Sani and Sartori (1983), Inglehart and Klingemann (1987) and Huber and
Inglehart (1995). In these cases, the party positions were re-scaled to conform to the zero-ten
metric used by Castles and Mair (1984). The individual party scores are shown in Appendix I.8
The main hypothesis can also be stated visually, using a spatial representation of party
preferences in two dimensions, where the horizontal axis stands for macro-economic (or finance)
5 Appendix II lists the sources and availability of macro-economic data. 6 In compiling the information on coalition governments, the Australian electoral pact between the Liberal Party and the Country Party (which changed its name to the National Country Party and then the National Party during the sample period) is treated as a single party when in government. The pact has lasted since the 1940’s, shortly after the founding of the Liberal Party, and involves an implicit agreement not to contest each other’s safe seats (see Delury, 1983). Likewise, the brief period from 1984 to 1986 during which the Japanese Liberal Democrat Party governed with a breakaway group composed of its own former members, the National Liberal Club, is also treated as a single party. The NLC was subsequently re-absorbed into the Liberal Democrats. 7 It may seem strange to assume that individual parties are cohesive while simultaneously questioning whether coalitions can enforce coalition contracts. Parties are taken as plausible unitary actors because of the incentive mechanisms they possess (including placement on PR lists) to enforce conformity. 8 The lack of updated expert surveys, however, means that I am unable to study the impact of parties that entered government for the first time in the mid to late 1990’s, as in Japan, Italy and New Zealand.
9
policy and the vertical axis captures the remaining dimension of partisan policy preferences.9
Figure 1 indicates the feasible government alternatives for a two-party coalition in a three-party
legislature. The points “AA” and “BB” indicate minority governments in which one party holds
all ministerial positions and indicate the ideal point of each party in two-dimensional policy
space. Initially, Party A is in a coalition with Party B. Since this coalition involves an allocation
of ministerial posts for each party, the position of the government is given either by BA (in which
case B controls the position of Minister of Finance) or by AB (in which case A holds the Minister
of Finance position and B controls the single remaining policy dimension). Without loss of
generality, I assume that the government stands at position AB.10
The coalition composed of parties A and B then breaks down, and a new coalition
comprising parties A and C forms. The two possible government locations predicted under the
theory of Ministerial discretion would be AC or CA. The first location would involve no shift in
the preferences of the Minister of Finance while the second would.
The macro-economy will be consistent with the hypothesis of ministerial discretion if:
1. There is no observed rational partisan cycle after a change of government from AB to AC (in which the preferences of the Minister of Finance remain constant), and
2. There is an observed rational partisan cycle after a change of government from AB to CA (in which the preferences of the Minister of Finance shift).
In other words, and under the hypothesis of ministerial discretion, the key occurrence for the
economy is not a change in the Left-Right position of the government as a whole but a change in
the Left-Right position of the Minister of Finance because it is the Minister of Finance who
controls macro-economic policy.
Conversely, the economic record would contradict the hypothesis of ministerial discretion if
either:
9 Laver and Shepsle (1996) label the vertical axis “foreign policy”, which they regard as the second most important ministerial position after the Minister of Finance. 10 Position AB is also a stable equilibrium since it is the “dimension-by-dimension” median and there are no alternative governments in its winset. It may, however, be vetoed as a government outcome by party A, which is strong in the sense that any governments in the winset of position AA also contain A, who must agree to enter into those governments. In what follows, I do not explain how the government moves from position AB to CA or AC and this example is used solely to clarify the means by which I test the hypothesis of ministerial discretion.
10
1. There is an observed rational partisan cycle after a change in government from position AB to position AC, (although the preferences of the Minister of Finance remain constant), or
2. There is no observed rational partisan cycle after a change in government from AB to CA (despite a shift in the preferences of the Minister of Finance).
The first of these counter-indications would arise if the macro-economic policy of the original AB
government had been set on the contract curve (pictured) between ideal points AA and BB rather
than being fixed at the position of the Finance Minister, A. In this case, the negotiation of a new
coalition agreement on the contract curve between AA and CC would allow a large shift in
macro-economic policy. The second counter-example follows from a situation in which A
initially controlled the Minister of Finance position and ensured that its preferred macro-
economic policy was enacted and then continued to exert complete policy control even though
formal ministerial control had shifted to party C. Thus, the counter examples both refer to
contexts in which cabinet partners are able to influence policy control although they do not hold
the Ministry of Finance. The key occurrence for the economy, therefore, is a change in the Left-
Right position of these other cabinet members.
The appropriate empirical specification for testing ministerial discretion, however,
requires that we put some structure on the identity of cabinet partners who can potentially affect
macro-economic policy. Failure to do so would introduce the standard risk of omitted variable
bias since changes in the position of Minister of Finance are likely correlated with changes in
cabinet structure and personnel that can also affect policy outcomes. Specifically, and based on
theoretical priors, I examine changes in coalition governments that generate a change in the Prime
Minister and/or a change in the largest party in the coalition.
Why do I highlight these actors? First, we have theoretical priors about the ways in
which the Prime Minister and/or the largest party in cabinet could move policy in their preferred
direction. In the first case, the Prime Minister could influence overall policy through the power
that he or she exerts over cabinet agenda-setting and bureaucratic appointments as well as, for all
the countries considered here, the ability to call a vote of confidence on legislation (Huber,
1996).11 In the case of the largest party, Martin and Stevenson (2001) find that the largest party
in the legislature is almost always the formateur in cabinet negotiations, giving it significant
proposal power at the first stage of cabinet negotiations (see also Snyder et al, 2005). If those
11 In four of the country cases, however, the Prime Minister is required to gain cabinet approval before declaring a vote of confidence. Those countries are Finland, Italy, The Netherlands and Sweden (Huber, 1996, Table 1).
11
negotiations are successful, the formateur will also be the largest party in the cabinet. Sadly, the
structure of the party government data set from Woldendorp, Keman and Budge (2000) does not
allow me to identify the formateur party directly, meaning that the closest we can get to
identifying the formateur is through the seat share.12 Second, changes in party control of the post
of Prime Minister and changes in the largest party in the cabinet both involve large shifts in the
preferences of the agent in question, as is also the case when we have a change in party control of
the Minister of Finance. Specifically, the average absolute change in the expert survey measures
of party position that occurs with a shift in the largest party is 2.98 using the zero to ten metric.
The average absolute change in party position for a change in the Prime Minister is 2.82 and the
average absolute change in party position for a switch in the Minister of Finance is 2.73. These
averages are computed for all types of governments but are still large when we restrict the sample
to coalition governments and are large in comparison to the range of political alternatives
represented by major parties. In conclusion, I examine changes in coalition governments that
involve a switch in party control of the Minister of Finance, the Prime Minister or the largest
party (or any subset of the above) in order to test which has the largest and most significant
impact on macro-economic outcomes. In these cases, we can be confident that the shift in policy
preferences that accompanies the change in party control should be sufficient to induce a partisan
cycle if the actors whose preferences change have policy control. The theory of ministerial
discretion is tested by examining the magnitude and significance of partisan effects following a
change in the Minister of Finance once we control for changes in the largest party and in the
office of Prime Minister.
Before outlining the specification in greater detail, I first indicate the extent to which
coalitions actually divide major portfolios among different parties and away from the largest
party. It is this division that gives rise to variation in party control of different cabinet positions.
I then quantify the degree of independent variation in these positions in order to mitigate concern
that statistical results are reliant on specific country cases and vulnerable to redefinition of the
sample.
As Table 1 demonstrates, the division of major portfolios across different parties in
the cabinet is a widespread and frequent phenomenon.13 Each cell indicates the percentage of
12 Woldendorp, Keman and Budge include data on the seat numbers of all parties in cabinet. The largest party is defined here as the party with the largest seat share of all parties in cabinet. 13 The German experience is an outlier in that the largest party always controlled the Ministry of Finance and occupied the office of Prime Minister over the sample period.
12
times, under coalition government, that a given party member of the position controlled one
position but not another, so that the largest party, for instance, did not also hold the office of
Prime Minister. There are exactly 799 quarters (or just under 200 observed years) in the data set
for which the government in power is a coalition and the positions of interest (the largest party,
the Prime Minister and the Minister of Finance) can be identified and are not held by individuals
described by Woldendorp, Keman and Budge (2000) as “non-aligned”.14 In 105 of those
quarters in which we observe a coalition and can identify particular actors, the largest party did
not occupy the office of Prime Minister, for a rate of sharing of 13.1 percent. The largest party
allocated the position of Minister of Finance to a different party with much great frequency, and
these positions were held by different parties just over 47 percent of the time. The percentage of
time for which coalition governments did not unify control of the Prime Minister’s office and the
Ministry of Finance was even greater, at almost 52 percent. It is commonplace, in other words,
for coalition members to divide important cabinet positions between different political parties.
More important, and because major cabinet positions are divided among different parties,
we observe many instances of independent variation in each potential policy actor (ie: the Finance
Minister, the Prime Minister, and the largest party). This variation can happen in one of three
ways, indicated by the examples in the previous section. First, the partisan preferences of a given
actor can change (as when we have a change in the Minister of Finance) but the partisan
preferences of other actors remain constant (because the largest party and the party controlling the
Prime Minister stay in place). Second, the partisan preferences of a given actor can remain
constant (the party controlling the Finance Ministry retains control of that post) while there is
partisan change in the other actors (so that another party assumes control of the Prime Minister’s
office or the largest party in the coalition changes). Third, there can be change in the partisan
preferences of a given actor (a new party assumes control of the Ministry of Finance) as well as
other actors, but these changes work in different directions so that changes in coalition
composition move the assumed preferences of the Ministry of Finance to the left (right) and those
of other actors to the right (left). Defining independent variation on this basis, there are nine
changes in government for which we can isolate the impact of changes in the preferences of the
party controlling the office of Prime Minister (three from Belgium, two from Finland and four
from Italy). There are eight changes in government for which we can isolate the effect of a
change in the preferences of the largest party in the coalition (two from Belgium, two from
14 There are 12 quarters in the sample of coalition governments for which the Minister of Finance is described as non-aligned, five in Finland and seven in Italy and four quarters (all from Italy) for which the Prime Minister is described as non-aligned.
13
Finland, two from France, one from Italy and one from Sweden). Finally, there are 28
government changes for which we can isolate the effect of changes in the policy preferences of
the Ministry of Finance. We observe seven examples from Belgium, one in Denmark, six in
Finland, one in France, three in Ireland, five in Italy, three in the Netherlands and two in Sweden.
Changes in party control of the Ministry of Finance, in other words, are far more frequent than
changes in the largest party or changes in the party that controls the Prime Minister’s office and
occur in many of the countries that experience coalition government.
III. METHODOLOGY
The ideal specification to test the implications of rational partisan theory would reflect the
causal mechanisms inherent in the theoretical model postulated by Alesina (1987) and
subsequently applied to two-party and multi-party systems (Alesina, Cohen and Roubini, 1992,
Alesina and Roubini, 1992). Thus, cycles in the real economy would be conditioned on the
probability associated with different governments coming to power when a government change is
expected, the probability given to a change of government, the expected inflation levels under the
universe of potential governments and actual, ex post, government outcomes.
As Alesina et al make clear, this is a tall order, particularly given the absence in many
countries of consistent, high frequency poll data on popularity or vote intentions for different
political parties and the complex theoretical question of how to infer from that data the
probability of different governments.15 Given the tremendous practical difficulties in
operationalizing the model at this level of specificity, Alesina et al (1997) equate actual change in
government with surprise change and estimate a model in which GDP growth (or unemployment)
is regressed on its own lags, a control for the international business cycle, and a dummy variable
marking an actual change in government incumbent. The decision by previous authors to proxy
for “surprise” changes in government using actual changes in incumbent is obviously imperfect.
There may be periods, right after a highly anticipated election, where the re-election of an
incumbent government is greeted with shock or, conversely, when the election of a new
15 Estimation is far more tractable in the case of the U.S, where the dates of elections are given and known, monthly data on approval is available and the presidency goes to the plurality winner from a set of (generally) two parties. In this case, Carlsen (1998) and Carlsen and Peddersen (1999) have estimated models in which GDP growth is conditioned on the probability of incumbent re-election and the left-right divergence between party positions.
14
government is widely predicted.16 Alesina et al (1997) offer two justifications for this procedure.
First, as mentioned on p. 148 (fn.9), the inclusion of controls for anticipated electoral results (and
thus for the probability of given governments) would require a series of pre-electoral polls for
each country and this data does not exist in many cases. Second, election timing is endogenous in
most parliamentary systems prior to the mandated conclusion of a government so that termination
itself is a random event. Further, although Alesina et al (1997) do not make this point, the
identification of a surprise change in government with an actual change implies that the
coefficients on the dummy variables marking the anticipated rational partisan cycle will, if
anything, be under-estimated. Episodes in which a government that was widely expected to be
defeated, yet continued in office, will not be included in the dummy variable and the partisan
impact on growth that the inconsistency between inflation expectations and outcomes should
generate will be reflected in the “noisiness” of the dependent variable. By contrast, episodes in
which a widely anticipated change occurred will be coded as a potential opportunity for partisan
effect although wage contracts will already have been updated and any potential real effects
nullified. Both instances will have a depressing effect on the coefficient measuring the impact of
a surprise government change.
In the tests that follow, I use the same baseline model as Alesina et al (1997) to estimate a
model of rational partisan cycles with modifications to capture agent-specific changes. The
baseline specification is a fixed effects, dynamic panel regression of GDP growth (and
unemployment) on its own past history, a measure of the world business cycle, and a dummy
variable capturing the rational partisan effects anticipated by theory. Country and year dummies
are included to soak up country-specific and period-specific heterogeneity that may otherwise
induce bias in the coefficients of interest. The measure of the world business cycle captures
variation in growth dues to linkages between the domestic and international economy. In
addition, because the dummy variable for change in different policy actors takes on different
values depending on whether the change in party control moved the ministry right or left the
variable RIGHT is included as a control, as is a dummy variable for coalition governments COAL
because this category is implicitly used in the construction of dummies used to test the rational
partisan cycle.17 The dummy variable RIGHT takes on the value one whenever the overall
16 The British general elections of 1992 and 1997 would serve, respectively, as examples of these phenomena. 17 It is not anticipated that coalition governments will differ in their average level of growth from single-party governments, nor that “left” governments will differ from “right” governments once we take into account transitory, partisan effects. These additional controls are introduced in case their omission induces bias in the estimation of the coefficient on the dummy variable capturing the magnitude of partisan cycles.
15
ideology of the cabinet, calculated as a weighted average of party positions, is to the right of
center.
The baseline model has the following specification.
t
T
t
t
n
i
ittpptptt
RIGHT
COALDDDRPTNywyyy
εδ
γβαααα
++
++++++++= ∑∑==
+−−
1111110 ...
(1)
In this example, ty is the stacked vector of time-series data on output growth, p is the
number of lags of the dependent variable, tyw is a proxy for the growth of the world economy,
iD is a set of country dummies and tD is the set of year dummies. The proxy for world growth
is the weighted average of GDP growth in the largest seven OECD economies, weighted by each
country’s share of GDP over the total.18 The acronym DRPTN stands for “Dummy for Rational
Partisan Theory of length N quarters” consistent with the terminology employed by Alesina et al
(1997). In tests of rational partisan theory, the dummy takes on the value one in the quarter in
which a more right-wing government comes into power and during the N-1 succeeding quarters.
It takes on the value minus one in the quarter during which a more left-wing government enters
office and the next N-1 quarters. The standard choices for the length N of the transitory period in
which a rational partisan cycle will be effective are four, six and eight quarters. In estimations in
which the dependent variable is real GDP growth, the coefficient 1β on DRPTN should be
negative and significant, since a change to a right-wing government is expected to reduce GDP
growth prior to the updating of nominal wage contracts to reflect changes in policy. In
estimations in which the dependent variable is unemployment, the coefficient should be positive
since a shift to a right government is expected to raise the rate of unemployment above its base
rate and the left to reduce it.
18 Alesina et al (1997) use either this specification to control for the impact of the world economy, or year dummies or by using the difference between national growth and average growth as their dependent variable. They report that results are insensitive to the procedure used. I employ both the OECD average and year dummies.
16
In what follows, the operationalization of the DRPTN dummy is more complex since the
theory is being used to isolate the impact of a change in particular cabinet actors holding the
identity (and preferences) of other actors constant. Thus, I create a dummy DRPTN-F, which
takes on the value one with a change to a more right-wing Minister of Finance and for the next N-
1 quarters and the value of minus one for an equivalent change to a more left-wing Minister of
Finance. Similarly, DRPTN-P is coded one (minus one) for changes to a more right (left) Prime
Minister. DRPTN-L is coded one for changes in government that result in a shift in the policy
preferences of the largest party moving rightwards and minus one for changes in government that
shift the policy preferences of the largest party to the left.
Finally, I introduce a dummy variable for changes in government in which one single-
party government succeeded another, as in all government changes in Australia, Canada, and the
UK. In cases where a single party controls cabinet and gives way to another party that has
exclusive control of cabinet positions, there can be no independent variation in different cabinet
positions and the largest party is always in control of all portfolios. It makes no sense, for these
cases, to introduce separate dummy variables for changes in the different actors since we cannot
estimate separate effects. To account for these cases, I introduce a variable DRPTN-SPG to
cover all the cases in which one single-party government succeeds another and with the same left-
right interpretation.19 This partitioning of changes in policy actors is done for ease of
interpretation. In addition, the coefficient on DRPTN-SPG allows us to compare the size of
rational partisan effects to previous findings from Alesina et al (1997) and others and to the size
of rational partisan effects found under coalition governments. In all cases, the DRPTN political
dummy is introduced with a lag length of one quarter, implying that partisan cycles start one
quarter after the installation of a new government.20
The dependent variable is real GDP growth or unemployment. The growth rate of GDP is
defined as 100*)ln(ln 1, −− tiit GDPGDP , the quarterly percentage change in the underlying,
constant price GDP index for each country.21 Augmented Dickey Fuller tests on quarterly GDP
19 The DRPTN-F, DRPTN-P and DPRTN-L variables are defined for cases in which either the previous government or the succeeding government were coalitions or both. 20 This was found to produce the strongest fit to data and significance levels. The coefficients were also significant, however, if the political dummy was introduced contemporaneously. 21Alesina et al (1997) use quarterly measures of the yearly percentage change in real GDP. This approach is eschewed here because, if the underlying time series is marked by serial correlation, then the use of year on year changes extends the effect of serial correlation over a longer time-span. In tests using GDP growth defined in both ways, the presence of serial correlation is found to be more problematic when using year on year changes.
17
growth by country reveal that this measure is stationary, so that the standard asymptotic results
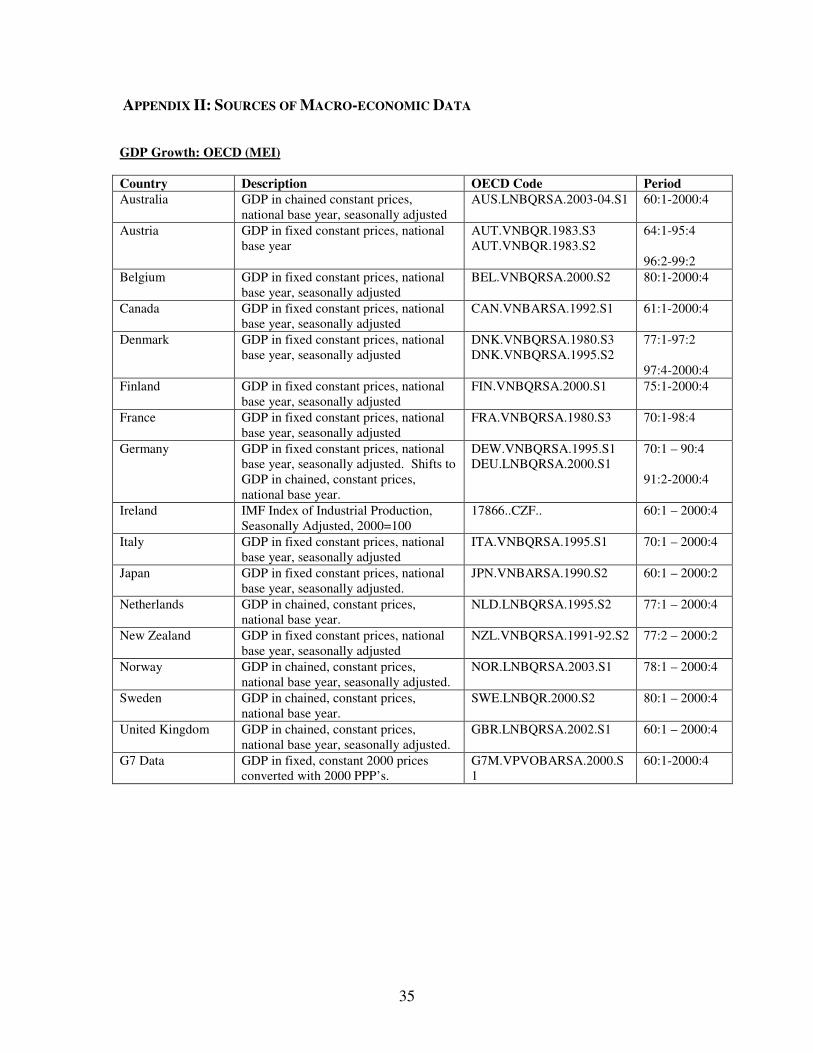
for inference apply. I use two sources of data for GDP growth. The first is drawn from the
OECD's Main Economic Indicators (MEI) data set, and specific series numbers are given in
Appendix III. One advantage of the MEI GDP indices is that they display less evidence of
seasonality than GDP indices drawn from the IMF’s International Financial Statistics (IFS) which
is the preferred source for Alesina et al (1997).22 However, the OECD data covers less of the
sample period for many countries. In order to capture the advantages of increased sample size
but to lessen concerns about sensitivity to data sources I present results using both the IMF and
the OECD growth rates. The number of lags used in the regression was determined by reference
to the Aikake Information Criterion (or AIC, see Greene, 5th Edition, 2003, p.787). Eight lags
are employed in the panel regression of GDP growth.23 The incorporation of these lags is
sufficient to remove all traces of first-order serial correlation in the residuals, which alleviates
concerns regarding bias in the standard errors.24 It is unlikely, still, that the residuals are
independent and identically distributed. As has been pointed out by Beck and Katz (1995) and
others, time-series, cross section regressions are often characterized by correlations in
contemporaneous shocks across panels and by panel-specific heteroskedasticity. In order to
estimate the error matrix correctly in this environment, and to produce unbiased standard errors,
the regression is estimated using panel corrected standard errors, as described in Beck and Katz
(1995) and implemented in Stata 9.1.
Although most of the estimations use real GDP growth as the dependent variable I also
present results in which the dependent variable is the alternative measure of real activity, the
unemployment rate. The source of the unemployment data is the OECD’s standardized rate of
unemployment and availability of this data is also shown in Appendix II. Based on significant
concerns regarding the stationarity of the unemployment variable, and following the approach
used by Alesina et al (1997) I use the deviation of a country’s quarterly unemployment rate from
the average unemployment rate of the G7 countries, or UDIFF, as the dependent variable. This
22 The MEI data also contain fewer outliers. 23 Hsiao (2003) shows that the use of lagged dependent variables in a dynamic, fixed effects panel model may lead to inconsistent estimates of the parameters through the correlation between the error term and the lagged dependent variables. The problem is serious in panel sets where the number of cross-sectional observations (N) is large in comparison to the number of time series observations (T). In the current data set, the number of time series observations (80 quarters) is large compared to the number of included lags. In cases where T is large, the parameter estimates of the standard fixed-effects dynamic model are consistent if the underlying data generating process is ergodic. 24 First-order serial correlation was analyzed using the Breusch-Godfrey test, under which residuals are regressed on lagged values of the residuals and the other exogenous variables from the original regression. See Hayashi (2000).
18
variable thus captures the movement in domestic unemployment that cannot be attributed to
world business cycle movements.
IV. RESULTS
The estimation of the model described in the previous section allows for direct comparison of
the impact of changes in different potential coalition policy-makers. Table Two presents the
results of estimations that run the DRPTN dummy variables against each other as a horse race.
Model 1 presents the results of a model in which the dependent variable is real GDP growth
measured using IMF data. Model 2 uses real GDP growth measured using OECD data while
Model 3 shows the results using UDIFF, or differences in unemployment from the G7 average, as
the dependent variable. The results presented are for a dummy variable covering four quarters
and results are similar (with declining magnitudes and declining levels of significance) for
estimations run with a dummy variable of six or eight quarters.25
Turning first to some of the control variables, we see that the coefficient on growth in the G-7
economies is estimated very precisely with the size of the coefficient implying that a one percent
increase in the G-7 real growth is associated with a contemporaneous increase in GDP growth in
the advanced, industrialized economies of 0.8 to almost 0.97 percent. In addition, the eight lags
of GDP growth are always jointly significant, as are the country and year dummies. The
coefficient on the dummy for coalition government is sometimes significant and always negative,
implying that coalitions were associated with a lower level of GDP growth (of the order of
approximately 1.0 - 1.6 percentage per year) with no observed difference in unemployment. By
contrast, the coefficient on the dummy for right governments is small and never significant.
In order to test the main hypothesis, we examine the size of the coefficients on the dummy
variables capturing changes in different policy actors (and changes from one single-party
government to another). If the hypothesis of ministerial discretion is correct, the coefficient on
the change in the Minister of Finance should be negative and significant when the dependent
variable is GDP growth and positive and significant for unemployment deviations. What we see
across all models, however, is that once we control for changes in other policy actors we never
find significant results from a change in party control of the Ministry of Finance. The sign on the
coefficient is as predicted but the coefficient never reaches significance and the standard error is
generally larger than the coefficient. Changes in the party occupying the Ministry of Finance, in
25 Results available from author.
19
other words, do not appear to generate significant shifts in real growth or unemployment
deviations.
This result is not due to multi-collinearity among the dummy terms that would obscure
any connection between the partisan composition of the cabinet and economic outcomes. Rather,
we see that changes in the largest party in the coalition have the results that would be predicted by
partisan theory if the largest party is also a decisive policy actor, at least for the case of GDP
growth. The coefficients in this case are large and negative, indicating that when there is a shift
in the party composition of the cabinet, and the largest party now hails from the right, we see a
significant reduction in the rate of real GDP growth of almost 0.9 percentage points a quarter
using IMF data and approximately 0.6 percentage points a quarter for growth estimated from
OECD sources. This impact is greater in magnitude than the effect on the economy that we see
when there are shifts from right to left in single-party governments (indicated by the coefficient
on the dummy variable for a change under a single-party government) but we cannot say that the
coefficients are significantly different from one another.26 Finally, there is no evidence of
rational partisan cycles for either single-party governments or different coalition policy actors
using unemployment deviations as the dependent variable although the coefficients are in the
expected direction, and are more significant, when we see partisan changes from one single-party
government to another and for changes in the largest party. The absence of findings is likely
related to the lower level of variation within the unemployment series and to the specification
adopted.
The coefficient on the dummy variable for control of the Prime Minister’s office is of
interest because it is significant in estimations for which growth is the dependent variable and
runs counter to hypotheses. Indeed, taken singly, the coefficient would imply that a change in
party control of the office of Prime Minister that brings in a more right-wing (left-wing) party
results in higher (lower) economic growth. This interpretation is implausible and the assumption
is, rather, that the results are driven by differences in economic growth outcomes when the largest
party and the Prime Minister’s office change hands at the same time versus instances in which we
get a different party as the largest party in the coalition but no change in the party controlling the
Prime Minister’s office. If we believe that the Prime Minister plays a facilitator role in the
cabinet, and assumes some responsibility for forging the coalition contract and sustaining the
coalition in office, then it is realistic to infer that the Prime Minister sacrifices some of his or her
26 Results available from author.
20
party’s macro-economic policy objectives for the sake of maintaining unity. This would also
imply that, on average, changes in government which generate a change in the largest party have
a smaller economic effect than indicated by the coefficient on the largest party because, in
general, the largest party in any coalition also assumes the position of Prime Minister. This
implication is borne out in versions of the model in which I enter the dummy variable for changes
in the largest party without the dummy variables for change in Minister of Finance and/or change
in the Prime Minister. In this case, the coefficient on the dummy variable for change in the
largest party is -0.38 (significant at the five percent level) when growth is measured using IMF
data and -0.31 using OECD data (significant at the ten percent level).27 The difference between
the estimated impact of independent change in Prime Minister and change in the largest party also
indicates that the influence of the largest party does not stem from control over the procedural
prerogatives of the Prime Minister, including the option of calling a vote of confidence on matters
of legislation. The finding has an intuitive interpretation. Huber (1996) presents the vote of
confidence privilege as a strategy that the Prime Minister can use to attain “final mover”
advantage in legislative debates that arise after the formation of a cabinet and involve issues that
were not covered in any earlier, implicit contract. The position of the coalition on the macro-
economy, however, should be a central and predictable issue that will be discussed in coalition
negotiations and established prior to the formation of the coalition.
Finally, the coefficient on the dummy variable for a change when one single-party
government succeeds another is also, for the case of GDP growth, significant and in the size
suggested by theory. Indeed, it is heartening that the size of the coefficient (at -0.56 and -0.44 for
OECD data) is very close in size to the coefficient found by Alesina et al (1997) for a sample of
“single party or two-bloc” countries for the sample period 1960-1993 (at -0.48) and increases our
confidence that the underlying result on rational partisan theory is very stable.
I next turn to a set of robustness checks that are motivated by particular concerns with the
preceding specification and its interpretation. First, we might think that the specification in Table
Two unfairly penalizes the hypothesis of ministerial discretion. Once we have introduced a
dummy variable for changes in the largest party, it might be argued, we have soaked up much of
the partisan change that happens within a coalition. The alternation between the Christian
Democrats and the Republican Party in the Italian Ministry of Finance, for instance, would not be
27 This effect is obviously smaller than the impact of a change from one single-party government but we cannot say that the coefficients on the dummy variable for the largest party and the coefficient on single party governments are significantly different in a statistical sense.
21
expected to have a large impact on the economy because the shift in party preferences that was
associated with this change of party control is small. If such minor changes are standard in the
allocation of the Ministry of Finance we would not expect to see a significant result on the
dummy overall once we had controlled for largest party. The kind of specification we would
prefer to run, in this case, is one that calibrates changes in party control over different positions
by the degree of ideological change implied in that switch. We would like to test, in other words,
whether parties got a bang for their buck and whether the degree of change in ideological
preference when one party succeeded another in a given position was transformed into an
equivalent change in economic outcomes.
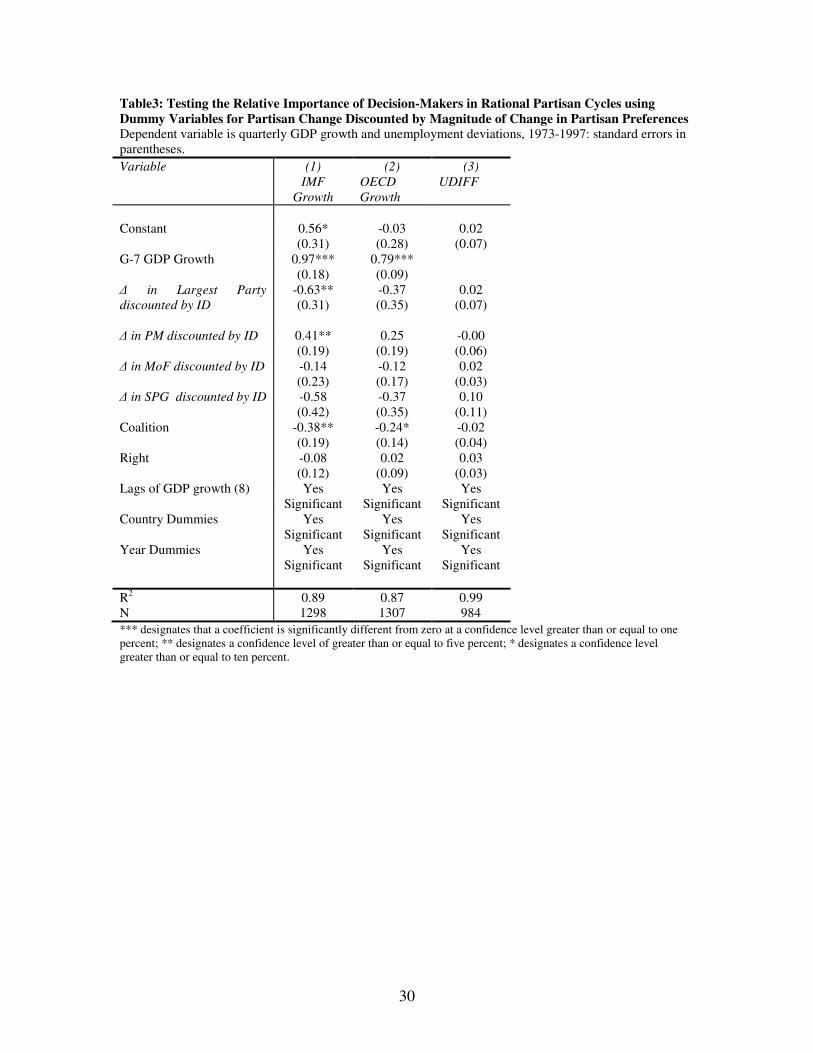
In Table Three I present that alternative specification. It is estimated using the dummy
variables that were previously computed for changes in party control of different positions but, in
this case, each dummy variable has been discounted for the degree of change in party preferences.
Specifically, each dummy variable is divided by the absolute change in party preferences that is
implied by the particular change in party control. Thus, changes in cabinet positions that
involved large change in preferences (from a Socialist to a European “liberal”) are shrunk
because we should have seen large changes in these instances if changes in outcomes followed
shifts in preferences. Following this transformation, the coefficient on each dummy variable
estimates the marginal impact of each one unit change in policy preferences of the particular actor
on macro-economic outcomes. For a single-party government, the coefficient measures the
marginal effect of each one unit change in policy preferences of the government as a whole.
Once we discount the dummy variables by degree of ideological change, we wipe out
many of the results that were previously significant (and no variables are significant in the
estimation for unemployment deviations). Even the coefficient on the variable indicating a
change from one single-party government to another is now insignificant although it is similar in
magnitude to previous results. The variable capturing the marginal effect of preference change in
the largest party is significant and in the hypothesized direction when the dependent variable is
growth calculated from IMF sources and not for growth estimated from OECD sources. The
same pattern of positive coefficients on the variable capturing the change in the Prime Minister’s
office can also be observed. More relevant to the question at hand, the coefficient on the variable
capturing the marginal effect of preference change in the Ministry of Finance is in the appropriate
direction, but is much smaller than the coefficient on the variable for change in the largest party at
about one-third of the size, and is never significant. Indeed, the standard error is always larger
than the coefficient. In conclusion, it does not appear that changes in party control of the
22
Ministry of Finance have significant effect for the economy even when we control for the
magnitude of shifts in partisan preferences that occur when party control over different cabinet
positions changes.
Finally, I turn to the interpretation that is placed on the coefficient on the dummy
variable for a change in the largest party. To recap, changes in the party that had the largest seat
share in the cabinet were highlighted because the largest party in any coalition is generally the
formateur for that coalition and the formateur is assumed to have proposal power in setting the
coalition contract. The limitations of the data, however, do not permit me to control for the
formateur directly and this may weaken the insights that we are able to draw from the findings on
the coefficient on the dummy variable for change in the largest party. In particular, it could be
argued that a change in the largest party is also associated with a dramatic shift in the ideological
composition of the government as a whole. Thus, the significant and positive coefficient on the
dummy variable for a shift in the largest party could simply indicate that it is the coalition as a
whole that sets out the appropriate direction for macro-economic policy through a coalition
contract. The finding, in other words, is consistent with a theory in which policy coordination is
joint as well as with a theory under which the largest party is a decisive actor in macro-economic
policy.
I address this concern, and seek to distinguish the particular mechanism by which
coalitions determine macro-economic policy, by modifying the dummy variable for changes in
the largest party in two particular ways and by comparing results using these different variables.
Table Four presents the results for estimations using GDP growth as the dependent variable. In
models 1 and 4, I run the test for a rational partisan cycle using the dummy variable for a change
in the largest party discounted by the absolute magnitude of the change in preferences for the
largest party that we observe with these switches. Once again, this variable indicates the
marginal effect of each one unit change in policy preferences that follows a change in the largest
party. The two models serve as a baseline for the impact of partisan changes on the economy that
we observe when we see a shift in the largest party. In models 2 and 5, I run the same
specification using a variable that captures the magnitude of the change in the preferences of the
coalition as a whole when we see a shift in the largest party.28 If it is really the changes in the
preferences of the coalition as a whole that affect macro-economic policy outcomes, this
28 The policy position of the coalition as a whole is calculated as the weighted average of the policy positions of the parties in coalition, with weights being taken from seat shares, as in Huber and Powell (1994).
23
coefficient should be larger and more significant than the coefficient in the baseline. Finally, in
models 3 and 6, I use a dummy variable that captures any change in cabinet composition that
moves overall government policy preferences left or right and discounts that dummy variable by
the change in government preferences that occurred. In other words, this dummy variable is
picking up changes in the composition of the coalition as a whole and calibrating this by the
degree of change in government preferences that ensued. Once again, and if it is the coalition as
a whole that is decisive for macro-economic policy, the coefficient on this variable should be
larger and more significant than the coefficient in the baseline specification.
In fact, the coefficients on the dummy variable in models 2 and 5 are smaller and less
significant than the coefficient in the baseline specifications of 1 and 3. It does not seem to be the
case that changes in the weighted average preferences of the coalition as a whole are more
significant for economic outcomes than the preferences of the largest party. In addition, while the
coefficient on the dummy variable for government change is actually significant in model 3 it has
the wrong sign and is so small as to have negligible substantive impact on GDP growth. It is the
preferences of the largest party, then, rather than the preferences of the coalition as a whole, that
seem to be driving changes in real growth outcomes when there is a change in the largest party.
Finally, there is a remaining concern that the results might be biased by the omission
of controls for institutional factors that could constrain partisan policy-making, in
particular a fixed exchange rate and an independent central bank. The concern arises
because coalition governments in the sample were significantly more likely to have a
fixed exchange rate and a highly independent central bank and because these institutions
are expected to remove discretion in independent monetary policy. On the other hand,
the variation that we see in the magnitude of partisan cycles depending on changes in
cabinet positions implies that these institutional effects cannot be driving the overall
results. If partisan policy was significantly constrained by a fixed exchange rate, or an
independent central bank, then we should never expect to see rational partisan cycles,
regardless of whether the largest party in the coalition also changed.
V. CONCLUSION
I turn to the implications of these findings under four headings, looking first at our
assessment of ministerial discretion, second at the strategic behavior of parties in seeking
24
portfolios, third the consequences for our understanding of coalition formation, and fourth the
economic consequences of coalition government.
First, the results indicate that the theory of ministerial discretion does not hold, at least in the
area of macro-economic policy. Moreover, the expectation is that the results would be
particularly robust for changes in party control over the Ministry of Finance because we see so
much independent variation in which party holds this ministry. The results serve as one of the
first empirical tests relating coalition membership to policy outcomes. Not only do coalition
governments possess the means to monitor and discipline individual ministers, they appear to use
them. Thus, the earlier findings on mechanisms are now substantiated by findings that directly
link policy output to coalition membership. Changes in the party assigned to the Ministry of
Finance have no significant effect on real GDP growth once we hold constant the largest party in
the coalition.
It may be argued in support of the theory of ministerial discretion that the selection of the
macro-economy as a test case is a particularly unfavorable case study. Macro-economic
preferences between real growth and price stability can be seen as core to any government’s
reputation and electoral prospects. Coalition partners might be willing to delegate control over,
for instance, language policy, the spatial allocation of public works, or the treatment of religious
schools to smaller parties as part of the coalition bargain, but they are hardly likely to do so when
the policy at stake is so central. While this is true, the theory of ministerial discretion, if correct,
is assumed to hold in all policy jurisdictions and has greatest predictive power for cabinet
formation if it holds for important jurisdictions.
The findings prompt us to re-examine the theoretical priors of ministerial discretion. If
governments really partition policy rights to different ministerial jurisdictions in multi-
dimensional space, we might expect to see political parties specializing in the provision of
specific policies and grooming themselves to occupy particular ministerial niches. This might be
one characterization of portfolio allocation in Israel, where the two major parties (Labour and
Likud) consistently control the positions of Finance, Foreign Affairs and Defense, while smaller
parties are observed to occupy the Ministry of Agriculture and the Ministry of Education.
Ministerial discretion, in other words, might be the corollary of multi-dimensional politics in
party systems where issues like religion in schools are of particular interest to a given party. Yet,
for most of Western Europe, politics is generally regarded as uni-dimensional and the cleavages,
on religion and other matters, that helped to create multi-party systems (Lipset and Rokkan, 1967)
25
were mainly absent from public policy debate after 1960. If, as Huber and Inglehart (1995)
contend, macro-economic policy is the main, under-lying latent variable that generates left-right
party competition, we would be surprised if coalition members were willing to accept ministerial
discretion in this area. In extensions to this work, I will test whether larger parties place more
weight on the macro-economy in their manifestoes than do smaller parties. If larger parties are
more likely than smaller ones to offer benefits to their constituents in terms of programmatic,
macro-economic policy (eg: lower unemployment, lower inflation) they should work harder to
seek to exert control over macro-economic policy than over other policy issues. As a corollary,
ministerial discretion might hold to a greater degree in ministries that can produce targeted
policies and rents, such as education, public works, and housing.
Second, the findings might lead us to ask us what objective function political parties are
satisfying when they fight for control of the Ministry of Finance. This is particularly true for
smaller parties, since junior partners in coalitions are expected to have much less influence on
macro-economic policy than the largest party. On one interpretation, smaller parties that assume
control over the Ministry of Finance are making strategic errors or perhaps engaged in costly
learning. The frequency with which smaller parties negotiate for, and take on, the Finance
Ministry, however, belies this theory. Alternatively, the Minister of Finance position may be
sought because it accords prestige and access to the media even in cases in which the Minister
cannot serve as the perfect agent for his or her party. In addition, and as mentioned by Farrell
(1994), the Minister of Finance wields exceptionally strong control over the actions of ministers
in other jurisdictions through what is described as their “minute control of expenditure”.
Occupying this post therefore allows a party to monitor whether coalition policy pledges are
implemented. Finally, parties may trade off the ability to show competence as a Minister of
Finance against the potential losses in policy payoffs. This description might apply to the
experience of Ruairi Quinn who served as Finance Minister from the Irish Labour Party in
coalition with Fine Gael in the 1990’s and whose web biography mentions that he felt a particular
responsibility to avoid public sector deficits while serving as Labour’s first ever Minister of
Finance.
Third, if we reject the theory of ministerial discretion, at least for macro-economic policy, we
are back to the complicated question of how to infer the position of coalition governments across
different policy areas and to predict the likely membership of coalitions. One of the major
challenges for future research will be to ensure that the assumptions we make about cabinet
policy-making as part of theory building are consistent with observed policy outcomes. An
26
obvious puzzle following the results presented above is why the largest party is able to wield such
significant influence over macro-economic policy even when smaller, more centrist parties are
also members of the coalition.
Fourth, this paper is part of a broad literature that looks at the economic consequences of
coalition government. A well-known strand of this literature examines the association between
coalitions, budget deficits and public debt.29 At the same time, scholars have pointed to coalition
governments as exemplars of stability and centrism in macro-economic policy and have credited
multi-party systems with avoiding the periodic upheavals of policy cycles. For instance, Alesina
et al (1997) write, “Thus, proportional representation, which typically delivers coalition
governments, avoids policy cycles and achieves policy moderation.” This conclusion is
consistent with the findings of Carol Mershon (2000) that coalition governments involve high
fluctuation in personnel but remarkable policy stability and echoes the results of Huber and
Powell (1994) that coalition governments are more centrist than governments composed of a
single party. However, once we pay attention to the decisive macro-economic policy maker in
the coalition, the largest party, we reject the finding of moderation for coalition governments.
When the largest party also occupies the office of Prime Minister, it appears to compromise
somewhat on its policy preferences in order to maintain the coalition. Even when this happens,
however, we still observe a significant effect on GDP growth when there is a change in the largest
party from left to right or vice versa. Coalitions are not inherently centrist although, since
changes in the largest party are infrequent, they show a degree of stability that is similar to that of
single-party governments. Distributional conflicts, over the appropriate balance between inflation
and growth, characterize political competition even in coalition systems and have real
consequences. The normative implication is that politics in multi-party systems is about
something and that voters can affect the desired balance of macro-economic policy by shifting
their votes between different parties. Returning to the question of accountability with which this
paper started, a final implication is that it is the largest party in a coalition that should be held
accountable by voters for economic performance and which should bear the brunt of economic
voting.
29 For empirical work on institutional features, political instability and debt, see Roubini and Sachs, 1989 a,b, Kontopoulous and Perotti (1997) and Grilli, Masciandaro, and Tabellini (1991). For a model of public debt creation as a common pool problem see Velasco (1999).
27
FIGURES
Figure 1: Government Positions under Ministerial Discretion
Macroeconomic Policy
BA
BB
AC CC
CA
AB
AA
28
TABLES
Table 1: Division of Cabinet Positions among Political Parties under Coalition Government
Largest Party Prime Minister Finance Minister
Largest Party does not control
the office of…
0.0 13.1% 47.7%
Prime Minister is from a
different party than…
0.0% 51.8%
Minister of Finance is from a
different party than…
0.0%
*Cells indicate the percentage of time during which the party occupying the position listed vertically is different from the party controlling the office listed on the horizontal axis.
29
Table2: Testing the Relative Importance of Decision-Makers in Rational Partisan Cycles
Dependent variable is quarterly GDP growth and unemployment deviations, 1973-1997: standard errors in parentheses. Variable (1)
IMF
Growth
(2)
OECD
Growth
(3)
UDIFF
Constant 0.55* -0.10 0.02 (0.31) (0.28) (0.07) G-7 GDP Growth 0.97*** 0.79*** (0.12) (0.09) ∆ in Largest Party -0.88*** -0.57** 0.08 (0.29) (0.24) (0.07) ∆ in PM 0.53** 0.36** -0.06 (0.22) (0.17) (0.07) ∆ in MoF -0.02 -0.10 0.005 (0.16) (0.13) (0.03) ∆ in Single-Party
Government
-0.56** (0.25)
-0.44** (0.18)
0.09 (0.06)
Coalition -0.40** -0.24* -0.01 (0.19) (0.14) (0.04) Right -0.00 0.06 0.02 (0.12) (0.09) (0.03) Lags of GDP growth (8) Yes Yes Yes Significant Significant Significant Country Dummies Yes Yes Yes Significant Significant Significant Year Dummies Yes Yes Yes Significant Significant Significant R2 0.89 0.87 0.99 N 1298 1308 984 *** designates that a coefficient is significantly different from zero at a confidence level greater than or equal to one percent; ** designates a confidence level of greater than or equal to five percent; * designates a confidence level greater than or equal to ten percent.
30
Table3: Testing the Relative Importance of Decision-Makers in Rational Partisan Cycles using
Dummy Variables for Partisan Change Discounted by Magnitude of Change in Partisan Preferences
Dependent variable is quarterly GDP growth and unemployment deviations, 1973-1997: standard errors in parentheses. Variable (1)
IMF
Growth
(2)
OECD
Growth
(3)
UDIFF
Constant 0.56* -0.03 0.02 (0.31) (0.28) (0.07) G-7 GDP Growth 0.97*** 0.79*** (0.18) (0.09) ∆ in Largest Party
discounted by ID
-0.63** (0.31)
-0.37 (0.35)
0.02 (0.07)
∆ in PM discounted by ID 0.41** 0.25 -0.00 (0.19) (0.19) (0.06) ∆ in MoF discounted by ID -0.14 -0.12 0.02 (0.23) (0.17) (0.03) ∆ in SPG discounted by ID -0.58 -0.37 0.10 (0.42) (0.35) (0.11) Coalition -0.38** -0.24* -0.02 (0.19) (0.14) (0.04) Right -0.08 0.02 0.03 (0.12) (0.09) (0.03) Lags of GDP growth (8) Yes Yes Yes Significant Significant Significant Country Dummies Yes Yes Yes Significant Significant Significant Year Dummies Yes Yes Yes Significant Significant Significant R2 0.89 0.87 0.99 N 1298 1307 984 *** designates that a coefficient is significantly different from zero at a confidence level greater than or equal to one percent; ** designates a confidence level of greater than or equal to five percent; * designates a confidence level greater than or equal to ten percent.
31
Table3: Testing the Relative Importance of Changes in the Partisan Preferences of the Largest Party
against Changes inn the Partisan Preferences of the Coalition as a Whole
Dependent variable is quarterly GDP growth and unemployment deviations, 1973-1997: standard errors in parentheses. Variable (1)
IMF
Growth
(2)
IMF
Growth
(3)
IMF
Growth
(4)
OECD
Growth
(5)
OECD
Growth
(6)
OECD
Growth
Constant 0.46 0.54* 0.56* 0.03 0.56** -0.08 (0.32) (0.31) (0.31) (0.27) (0.27) (0.28) G-7 GDP Growth 0.96*** 0.98*** 0.95*** 0.76*** 0.76*** 0.75*** (0.12) (0.12) (0.11) (0.09) (0.09) (0.09) ∆ in Largest Party
Significant Significant Significant Significant Significant Significant Country Dummies Yes Yes Yes Yes Yes Yes Significant Significant Significant Significant Significant Significant Year Dummies Yes Yes Yes Yes Yes Yes Significant Significant Significant Significant Significant Significant R2 0.89 0.89 0.89 0.87 0.87 0.87 N 1315 1310 1283 1342 1337 1310 *** designates that a coefficient is significantly different from zero at a confidence level greater than or equal to one percent; ** designates a confidence level of greater than or equal to five percent; * designates a confidence level greater than or equal to ten percent.
32
APPENDIX I: SOURCES OF PARTY IDEOLOGY DATA
Country Party Name Abbrev. Data
Source
Left-
Right
Score Australia Liberal Party LIB C+M 7.5 Country Party; from 1975 to 1982, the National
Country Party; since 1982 the National Party CNT C+M 7.8
Australian Labour Party ALP C+M 3.1 Austria Socialists (Sozialistische Partei Österreichs) SPO C+M 3.0 Austrian People’s Party (Österreichische Volkspartei) OVP C+M 5.8 Freedom Party (Freiheitliche Partei Österreichs) FPO C+M 6.8 Belgium Christian People’s Party (Christelijke Volkspartij) CVP C+M 5.8 Flemish Socialist Party (Belgische Socialistische Partij;
since 1980 Socialistische Partij) BSP C+M 2.9
Francophone Socialist Party (Parti Socialiste) PSB C+M 2.5 Christian Social Party (Pari Social Chrétien) PSC C+M 6.3 Party of Liberty and Progress (Partij voor Vrijheid en
Vooruitgang) PVV C+M 7.8
Francophone Liberals (Parti de la Liberté et du Progrès (PLP); since 1976 Parti des Réformes et de la Liberté de Wallonie (PRLW); since 1979 Parti Réformateur Libéral (PRL).
Flemish Nationalists (Volksunie) VU C+M 6.8 Canada Liberal Party LIB C+M 5.3 Progressive Conservative Party CON C+M 6.5 Denmark Radical Party (Radikale Venstre) RAD C+M 4.8
Liberal Party (Venstre) LIB C+M 6.7
Conservative People’s Party (Konservative Folkeparti) CON C+M 7.3
Social Democrats (Socialdemokratiet) SD C+M 3.8
Centre Democrats (Centrum-Demokraterne) CDM C+M 5.7
Socialist People’s Party (Socialistisk Folkeparti) SPP C+M 1.9
Communist Party (Danmarks Kommunistiske Parti) COM C+M 1
Christian People’s Party (Kristeligt Folkeparti) CPP C+M 6.2
Finland Center Party (Keskustapuolue); since 1988 the Finnish Center (Suomen Keskusta)
KESK C+M 5.2
Social Democrats (Suomen Sosialidemokraattinen) SDP C+M 3.0 Swedish People’s Party (Svenska
Finnish People’s Democratic Union (Suomen Kansan Demokraattinen Liitto)
SKDL C+M 1.8
Social Democratic League of Workers and Smallholders (Tyovaen ja Pienviijelljäin Sosialdemokraattinen Litto)
TPSL Morgan 2.1
National Coalition (Kansallinen Kokoomus) KOK C+M 7.2 Liberal People’s Party, formerly the Finnish People’s
Party (Liberaalinen Kansanpuolue) FPP C+M 5.6
Finnish Rural Party (Suomen Maaseudun Puolue) FRP C+M 5.8 Christian Union (Kristillinen Liitto) SKL H+I 8.9 France Gaullists (Union des Démocrates pour la République
from 1968 to 1976; from 1977, Rassemblement pour la UDR/RPR C+M 8.2
33
République). Popular Republican Movement (Mouvement
Républicain Populaire: the parliamentary group of this party was known as the Centre Progrès et Démocratie Moderne)
PDM C+M 3.8
Independent Republicans (Fédération Nationale des Républicains Indépendents)
IND S+S 6.8
Center Democracy and Progress (Centre Démocratie et Progrès: reunited with the Democratic Center to form the Center Social Democrats, or CDS, in 1976)
CDP/CDS S+S 5.3
Reformer’s Movement (Mouvement Réformateur) REF I+K 6.0 Left Radicals (Mouvement des Radicaux de Gauche) MRG Morgan 5.1 Union for French Democracy (Union pour la
Démocratie Francaise (founded in the 1970’s as a union of the Republicans, the Radicals, the CDS, and other minor centrist and conservative groups)
UDF C+M 6.6
Socialist Party (Parti Socialiste) PSF C+M 2.6 Communist Party (Parti Communiste Francais) PCF C+M 1.4 Germany Social Democrats (Sozialdemokratische Partei
Deutschlands) SPD C+M 3.3
Free Democrats (Freie Demokratische Partei) FDP C+M 5.1 Christian Democrats (Christlich Demokratische Union:
considered as permanently aligned with the Christian Social Union)
CDU C+M 6.7
Ireland Fianna Fáil (Warriers of Destiny) FF C+M 6.3 Fine Gael (Tribe of Gaels) FG C+M 6.8 Irish Labour Party LAB C+M 3.6 Progressive Democrats PD H+I 8.1 Italy Christian Democrats (Democrazia Cristiana) DC C+M 5.4
Socialist Party (Partito Socialista Italiano) PSI C+M 3.1
Republican Party (Partito Repubblicano Italiano) PRI C+M 4.8
Social Democrats (Partito Soclialista Democraticao Italiano)
PSDI C+M 5.4
Liberal Party (Partito Liberale Italiano) PLI C+M 5.9
Japan Liberal Democratic Party (Jiyu Minshu-to) LDC H+I 8.3 New Liberal Club (Shin Jiyu Club; a splinter from the
LDP formed in 1976 and reunited with them in 1986) NLC H+I 8.3
Netherlands Roman Catholic People’s Party (Rooms-Katholieke Volkspartij)
KVP Morgan 5.1
Anti-Revolutionary Party (Anti-Revolutionaire Partij) ARP Morgan 5.6 Christian Historical Union (Christelijk-Historische
Unie) CHU Morgan 6.6
Liberal Party (Volkspartij voor Vrijheid en Democratie)
Labor Party (Partij van der Arbeid) PVDA C+M 2.6 Demcrats ’66 (Democraten ’66) D66 C+M 4.4 Radical Political Party (Politieke Partij Radicalen) PPR C+M 1.6 Christian Democratic Appeal (Christen Democratisch
Appel; formed from the merger in 1979 of KVP, ARP, CHU)
CDA C+M 5.7
New Zealand
National Party NP C+M 6
Labour Party LAB C+M 3.8
34
Norway Center Party (Senterpartiet) CP C+M 5.8 Christian People’s Party (Kristelig Folkeparti) CPP C+M 6.1 Conservatives (Høyre) CON C+M 7.7 Liberals (Venstre) LIB C+M 4.0 Labor Party (Det Norske Arbeiderparti) AP C+M 3.0 Sweden Social Democrats (Sveriges Socialdemokratistiska
Arbetareparti) SDA C+M 2.9
Center Party (Centerpartiet) CP C+M 5.9 People’s Party (Folkpartiet) FP C+M 5.5 Moderate Unity Party (Moderate Samlingspartiet) MUP C+M 7.7 Christian Democrats (Kristdemokratiska
Samhallspartiet) KDS H+I 6.7
U.K. Conservative Party CON C+M 7.8 Labour Party LAB C+M 2.3 Detailed Sources for Party Ideological Placement: C+M: Castles and Mair (1984), Morgan: Morgan (1976), S+S: Sani and Sartori (1983), I+K: Ingelhart and Klingemann (1987), H+I: Huber and Ingelhart (1995).
35
APPENDIX II: SOURCES OF MACRO-ECONOMIC DATA
GDP Growth: OECD (MEI)
Country Description OECD Code Period
Australia GDP in chained constant prices, national base year, seasonally adjusted
AUS.LNBQRSA.2003-04.S1 60:1-2000:4
Austria GDP in fixed constant prices, national base year
AUT.VNBQR.1983.S3 AUT.VNBQR.1983.S2
64:1-95:4 96:2-99:2
Belgium GDP in fixed constant prices, national base year, seasonally adjusted
BEL.VNBQRSA.2000.S2 80:1-2000:4
Canada GDP in fixed constant prices, national base year, seasonally adjusted
CAN.VNBARSA.1992.S1 61:1-2000:4
Denmark GDP in fixed constant prices, national base year, seasonally adjusted
DNK.VNBQRSA.1980.S3 DNK.VNBQRSA.1995.S2
77:1-97:2 97:4-2000:4
Finland GDP in fixed constant prices, national base year, seasonally adjusted
FIN.VNBQRSA.2000.S1 75:1-2000:4
France GDP in fixed constant prices, national base year, seasonally adjusted
FRA.VNBQRSA.1980.S3 70:1-98:4
Germany GDP in fixed constant prices, national base year, seasonally adjusted. Shifts to GDP in chained, constant prices, national base year.
DEW.VNBQRSA.1995.S1 DEU.LNBQRSA.2000.S1
70:1 – 90:4 91:2-2000:4
Ireland IMF Index of Industrial Production, Seasonally Adjusted, 2000=100
17866..CZF.. 60:1 – 2000:4
Italy GDP in fixed constant prices, national base year, seasonally adjusted
ITA.VNBQRSA.1995.S1 70:1 – 2000:4
Japan GDP in fixed constant prices, national base year, seasonally adjusted.
JPN.VNBARSA.1990.S2 60:1 – 2000:2
Netherlands GDP in chained, constant prices, national base year.
NLD.LNBQRSA.1995.S2 77:1 – 2000:4
New Zealand GDP in fixed constant prices, national base year, seasonally adjusted
NZL.VNBQRSA.1991-92.S2 77:2 – 2000:2
Norway GDP in chained, constant prices, national base year, seasonally adjusted.
NOR.LNBQRSA.2003.S1 78:1 – 2000:4
Sweden GDP in chained, constant prices, national base year.
SWE.LNBQR.2000.S2 80:1 – 2000:4
United Kingdom GDP in chained, constant prices, national base year, seasonally adjusted.
GBR.LNBQRSA.2002.S1 60:1 – 2000:4
G7 Data GDP in fixed, constant 2000 prices converted with 2000 PPP’s.
G7M.VPVOBARSA.2000.S1
60:1-2000:4
36
GDP Growth: IMF (IFS)
Country Description IMF Code Period Australia GDP Vol 2000=100 19399BVRZF... 60:1 – 2000:4 Austria GDP Vol 2000=100 12299BVPZF... 64:1 – 2000:4 Belgium GDP Vol 2000=100 12499BVPZF... 80:1 – 2000:4 Canada GDP Vol 2000=100 15699BVRZF... 60:1 – 2000:4 Denmark GDP Vol 2000=100 12899BVPZF... 77:1 – 2000:4 Finland GDP Vol 2000=100 17299BVPZF... 70:1 – 2000:4 France GDP Vol 95 = 100 13299BVRZF... 70:1 – 2000:4 Germany GDP Vol 2000=100 13499BVRZF... 60:1 – 2000:4 Ireland Index of Industrial
Production, Seasonally Adjusted, 2000=100
17866..CZF.. 60:1 – 2000:4
Italy GDP Vol 95 prices 13699B.RYF... 80:1 – 2000:4 Japan GDP Vol 2000=100 15899BVRZF... 60:1 – 2000:4 Netherlands GDP Vol 2000=100 13899BVRZF... 77:1 – 2000:4 New Zealand GDP Vol 2000=100 19699BVRZF... 82:2 – 2000:4 Norway GDP Vol 2000=100 14299BVPZF... 66:1 – 2000:4 Sweden GDP Vol 2000=100 14499BVPZF... 69:1 – 2000:4 United Kingdom GDP Vol 2000=100 11299BVRZF... 60:1 – 2000:4 OECD Unemployment Data (MEI)
Country Description Period Australia AUS Unemp SUR 67:1 – 2000:4 Austria AUT Unemployed % total labour force sa - units: as
percentage of total labour force - power: 0 69:1 – 2000:4
Belgium BEL Unemployment rate (SUR) sa - units: Percent of civilian labour force - power: 0
82:1 – 2000:4
Canada CAN Unemployment rate (SUR) sa - units: Percent of civilian labour force - power: 0
67:1 – 2000:4
Denmark DNK Unemployment rate (SUR) sa - units: Per cent of civilian labour force - power: 0
82:1 – 2000:4
Finland FIN Unemployment rate (SUR) sa - units: Per cent of civilian labour force - power: 0
84:1 – 2000:4
France FRA Unemployment rate (SUR) sa - units: Per cent of civilian labour force - power: 0
82:1 – 2000:4
Germany DEU Unemployment rate (SUR) sa - units: Per cent of civilian labour force - power: 0
78:1 – 2000:4
Ireland IRL Unemployment rate (SUR) sa - units: Per cent of civilian labour force - power: 0
82:1 – 2000:4
Italy ITA Unemployed % total labour force sa - units: as percentage of total labour force - power: 0
67:1 – 2000:4
Japan JPN Unemployment rate (SUR) sa - units: Per cent of civilian labour force - power: 0
67:1 – 2000:4
Netherlands NLD Unemployment rate (SUR) sa - units: Per cent of civilian labour force - power: 0
70:1 – 2000:4
New Zealand NZL Unemployment rate (SUR) sa - units: Per cent of civilian labour force - power: 0
85:4 – 2000:4
Norway NOR Unemployment rate (SUR) sa - units: Per cent of 72:1 – 2000:4
37
civilian labour force - power: 0 Sweden SWE Unemployed % total labour force sa - units: as
percentage of total labour force - power: 0 70:1 – 2000:4
United Kingdom GBR Unemployed % total labour force sa - units: as percentage of total labour force - power: 0
68:1 – 2000:4
G7 control G7 – SUR 78:1 – 2000:4
38
BIBLIOGRAPHY Aesina, Alberto, 1987, “Macroeconomic Policy in a Two-Party System as a Repeated Game.” Quarterly Journal of Economics, 102:3, 651-78. Alesina, Alberto, Cohen, Gerald, and Roubini, Nouriel, 1992, “Macroeconomic Policy and Elections in OECD Democracies,” Economics and Politics, 4:1, 1-30. Alesina, Alberto and Nouriel Roubini with Gerald Cohen, 1997, Political Cycles and the
Macroeconomy, Cambridge, MA: MIT Press. Anderson, Christopher J., 2007, “The End of Economic Voting? Contingency Dilemmas and the Limits of Democratic Accountability,” American Review of Political Science, forthcoming. Bawn, Kathleen, 1999, “Money and Majorities in the Federal Republic of Germany: Evidence for a Veto Players Model of Government Spending,” American Journal of Political Science, 43:3, 707-736. Beck, Nathanial and Jonathan Katz, 1995, “What to do (and not to do) with Time Series Cross Section Data,” American Political Science Review, 89:3, 634-647. Bingham Powell, G. and Guy D. Whitten, (1993) “A Cross-National Analysis of Economic Voting: Taking Account of the Political Context,” American Journal of Political Science, 37:2, 391-414. Blondel, Jean and Ferdinand Müller-Rommel, 1993, Governing Together: The Extent and Limits
of Joint Decision-Making in Western European Cabinets, New York, NY: Macmillan Press. Blondel, Jean and Ferdinand Müller-Rommel, eds., 1997, Cabinets in Western Europe, New York: St. Martins Press. Bräuninger, Thomas and Mark Hallerberg, 2003, “Cabinet Decision-Making and Policy Outcomes in Parliamentary Democracies,” paper prepared for the Midwest Political Science Association, Chicago, IL, April 2003. Budge, Ian and Hans Keman, 1990, Parties and Democracy: Coalition Formation and
Government Functioning in Twenty States, Oxford: Oxford University Press. Carlsen, Fredrik, 1997, “Counter-cyclical Policies and Partisan Politics,” Applied Economics, 29:2, 145-151. Carlsen, Fredrik, 1998, “Rational Partisan Theory: Empirical Evidence for the United States,” Southern Economic Journal, 65:1, 64-82. Carlsen, Fredrik and Elin Pedersen, 1999, “Rational Partisan Theory: Evidence for Seven OECD Economies,” Economics and Politics, 11:1, 13-32. Castles, Francis and Peter Mair, 1984, “Left-Right Political Scales: Some ‘Expert” Judgments,” European Journal of Political Research, 12:1, 73-88.
39
Church, Clive H., 2004, The Government and Politics of Switzerland, London: Palgrave Macmillan. Dalton, Russell J., Scott Flanagan and Paul Allen Beck, eds., 1984, Electoral Change in
Advanced Industrial Democracies: Realignment or Dealignment?, Princeton N.J.: Princeton University Press. Delury, George, ed., 1999, World Encyclopedia of Political Systems and Parties, New York: Facts on File. Eriksen, Svein, 1988, “Norway: Ministerial Autonomy and Collective Responsibility,” in Müller and Blondel, eds., Cabinets in Western Europe, New York: St. Martin’s Press. Friedrich, Robert, 1982, “In Defense of Multiplicative Terms in Multiple Regression Equations,” American Journal of Political Science, 26:4, 797-833. Gerlich, Peter and Wolfgang C. Müller, 1988, “Austria: Routine and Ritual,” in Müller and Blondel, eds., Cabinets in Western Europe, New York: St. Martin’s Press. Greene, William H., 2003, Econometric Analysis, Upper Saddle River, N.J.: Prentice Hall. Grilli, V., Masciandaro, D., and Guido Tabellini, 1991, “Political and Monetary Institutions and Public Financial Policies in the Industrialized Countries,” Economic Policy 13, 342-92. Hayashi, Fumio, 2000, Econometrics, Princeton, NJ: Princeton University Press. Hibbs, Douglas, 1977, “Political Parties and Macroeconomic Policy,” American Political Science
Review, 71:4, 1467-87. Hsiao, Cheng, 2003, Analysis of Panel Data, Cambridge: Cambridge University Press. Huber, John and Matthew Gabel, 2000, “Putting Parties in their Place: Inferring Party Left-Right Ideological Positions from Party Manifestos Data,” American Journal of Political Science, 44:1, 94-103. Huber, John and Ronald Inglehart, 1995, “Expert Interpretations of Party Space and Party Locations in 42 Societies,” Party Politics, 1:1, 73-111. Huber, John and G. Bingham Powell, 1994, “Congruence between Citizens and Policymakers in Two Visions of Liberal Democracy.” World Politics, 46:3, 291-326. Inglehart, Ronald, 1984, “The Changing Structure of Political Cleavages in Western Society,” in Dalton et al, Electoral Change in Advanced Industrial Democracies: Realignment or
Dealignment?, Princeton: Princeton University Press. Inglehart, Ronald and Hans Klingemann, 1987, “Party Identification, Ideological Preferences and the Left-Right Dimension among Western European Mass Publics,” in Ian Budge, David Robertson, and Derek Hearl (eds), Ideology, Strategy, and Party Change, Cambridge: Cambridge University Press.
40
Kiewiet, D. R., 2000, “Economic Retrospective Voting and Incentives for Policy-Making,” Electoral Studies, 19: 427-44. Klingemann, Hans-Dieter, Richard I. Hofferbert, Ian Budge, and Hans Keman, 1994, Parties,
Policies, and Democracy, Boulder: Westview Press. Kontopoulos, Y., and Roberto Perotti, 1999, “Government Fragmentation and Fiscal Policy Outcomes: Evidence from the OECD Countries,” in J. Poterba and J. von Hagen, eds., Fiscal
Institutions and Fiscal Performance, Chigago: University of Chicago Press. Laver, Michael and Kenneth A. Shepsle, 1990, “Coalitions and Cabinet Government,” American
Political Science Review, 84:3, 873-90. Laver, Michael and Kenneth A. Shepsle, eds, 1994, Cabinet Ministers and Parliamentary
Government, Cambridge, U.K.: Cambridge University Press. Laver, Michael and Kenneth A. Shepsle, 1996, Making and Breaking Governments: Cabinets and
Legislatures in Parliamentary Democracies, Cambridge, U.K.: Cambridge University Press. Lipset, Seymour Martin and Stein Rokkan, eds., 1967, Party Systems and Voter Alignments:
Cross-National Perspectives, New York: MacMillan. Martin, Lanny and Randolph Stevenson, 2001, “Government Formation in Parliamentary Democracies,” American Journal of Political Science, 45:1, 33-50. Martin, Lanny W. and Georg Vanberg, 2004, “Policing the Bargain: Coalition Government and Parliamentary Scrutiny.” American Journal of Political Science, 48:1, 13-27. Martin, Lanny W. and Georg Vanberg, 2005, “Coalition Policymaking and Legislative Review.” American Political Science Review, 99:1, 93-106. Mershon, Carol, 2000, The Costs of Coalition, Stanford, CA: Stanford University Press. Morgan, M., 1976, “The Modelling of Coalition Formation: A Policy-based Approach with Interval Measurement,” University of Michigan, Ph.d. Thesis. Müller, Wolfgang and Kaare Strøm, 2000, Coalition Governments in Western Europe, Oxford, UK: Oxford University Press. Nordhaus, William, 1975, “The Political Business Cycle,” Review of Economic Studies, 42: 169-90. Paldam, Martin, 1989a, “Politics Matter After All: Testing Alesina’s Theory of RE Partisan Cycles,” working paper, Aarhaus University. Paldam, Martin, 1989b, “Politics Matter After All: Testing Hibbs’ Theory of Partisan Cycles,” working paper, Aarhaus University. Powell, G. Bingham and Guy Whitten, 1993, “A Cross-National Analysis of Economic Voting Taking Account of the Political Context,” American Journal of Political Science, 37:2, 391-414.
41
Roubini, Nouriel and Jeffrey Sachs, 1989a, “Political and Economic Determinants of Budget Deficits in Industrialized Democracies,” European Economic Review, 33:5, 903-33. Roubini, Nouriel and Jeffrey Sachs, 1989b, “Government Spending and Budget Deficits in the Industrialized Countries,” Economic Policy, 8:99-132. Sani, G. and Giovanni Sartori, 1983, “Polarization, Fragmentation and Competition in Western Democracies,” in H. Dalder and P. Mair, eds., Western European Party Systems, London and Beverly Hills: Sage. Snyder, James M., Michael M. Ting, and Stephen Ansolabehere, 2005, “Legislative Bargaining under Weighted Voting,” American Economic Review, 95:4, 981-1004. Thies, Michael, 2001, “Keeping Tabs on Partners: The Logic of Delegation in Coalition Governments,” American Journal of Political Science, 43:3, 580-598. Velasco, Andres, 1999, “A Model of Endogenous Fiscal Deficit and Delayed Fiscal Reforms,” in J. Poterba and J. von Hagen, eds., Fiscal Rules and Fiscal Performance, Chicago: University of Chicago Press. Woldendorp, Jaap, Hans Keman, and Ian Budge, 1993, “Political Data 1945-1990: Party Government in 20 Democracies,” European Journal of Political Research, 24:1, 1-119. Woldendorp, Jaap, Hans Keman, and Ian Budge, 1998, “Party Government in 20 Democracies: an update (1990-1995),” European Journal of Political Research, 33:1, 125-164. Woldendorp, Jaap, Hans Keman and Ian Budge, 2000, Party Government in 48 Democracies