65
Who Drives Digital Innovation? Evidence from the U.S. Medical Device Industry Cirrus Foroughi Ariel Dora Stern Working Paper 19-120
Who Drives Digital Innovation? Evidence from the U.S. Medical Device Industry
Cirrus Foroughi Ariel Dora Stern
Working Paper 19-120
Working Paper 19-120
Copyright © 2019 by Cirrus Foroughi and Ariel Dora Stern
Working papers are in draft form. This working paper is distributed for purposes of comment and discussion only. It may not be reproduced without permission of the copyright holder. Copies of working papers are available from the author.
Who Drives Digital Innovation? Evidence from the U.S. Medical Device Industry
Cirrus Foroughi Harvard Business School
Ariel Dora Stern Harvard Business School
Who drives digital innovation?
Evidence from the U.S. medical device industry
Cirrus Foroughi and Ariel Dora Stern∗
April, 2019
Abstract
Does the large-scale technological change that is characteristic of an industry-wide digitaltransformation entrench industry leaders or enable the rise of new entrants? We offer a novelapproach to this question by studying the medical device industry, a unique setting in whichwe observe all new product commercialization over several years and in which the introductionof software has created fresh opportunities for new product development. Pioneering a newapplication of text analysis, we consider over 35,000 new medical devices that came to marketin the United States from 2002 to 2016 in order to identify digital products. We examine therelative importance of within-firm know-how, geography, and financial resources in predictingdigital new product development. We find that prior product-area commercialization experi-ence and location in a region of concentrated expertise reinforce one another as predictors ofdigital innovation. Access to financing through public capital markets and venture capital arealso positive predictors, but the magnitudes of these effects are smaller and do not appear tocompensate for past product experience or geography. We conclude that the digital transforma-tion of the medical device industry is disproportionately driven by product area and geographicincumbents.
Keywords: Innovation; Digitization; Medical Technology; Medical Devices; Software
∗Harvard Business School, Boston, Massachusetts, 02163 ([email protected]). We are grateful to Carliss Baldwin,George Ball, Moritz Fischer, Shane Greenstein, Joachim Henkel, Marco Iansiti, Karim Lakhani, Jeffrey Macher, KyleMyers, Christian Peukert, Scott Stern, and several conference and seminar participants for helpful suggestions. LynneChou O’Keefe provided generous insight on the investor’s perspective on digital health and Paul Jonak, Lila Kelso,and Melissa Ouellet provided excellent research assistance. The authors are grateful for support from the HarvardBusiness School Division of Research and Faculty Development and the Kauffman Foundation (Stern).
1
1 Introduction
In recent years, major industries ranging from manufacturing and inventory management to en-
tertainment to health care have undergone a “digital transformation,” in which key aspects of
both day-to-day business and new frontiers of product development have migrated to a primarily
digital (i.e., software-driven) context. This scenario raises questions about how new opportunities
for digital product development impact both new entrants and experienced industry leaders. Does
widespread technological change strengthen incumbent power or does it provide greater opportu-
nity for new entry? The answer is not clear ex ante: incumbent firms have substantial experiential
and resource advantages that could allow them to both weather and take advantage of large-scale
technological change, while younger, leaner firms are not burdened by existing research and de-
velopment (R&D) approaches and are often characterized by creativity and flexibility (Gans and
Stern 2003).
This study implements our research question in a novel setting: the digital transformation
of the medical device industry. An advantage of this setting is that all product commercializa-
tion is directly observable. The existence of a centralized, national regulatory approval process,
combined with detailed databases that assign all devices to standardized product areas, allows for
precise and comprehensive categorization of new products, which can, in turn, be directly linked to
commercializing firms and locations. Using text analysis and document classification techniques,
we characterize over 35,000 medical devices brought to market from 2002 to 2016 and identify the
digital products among them. We describe the commercialization of these products across medical
specialty areas, across types of innovator firms, and over time.
We find that within-firm experience and geographic expertise are the strongest predictors
of digital product commercialization. While a firm’s previous experience with digital devices is
broadly relevant, experience that is specific to a particular medical specialty area (product class)
is additionally predictive of follow-on innovation (i.e., the commercialization of new versions of
already-marketed digital products). This finding points to likely within-firm spillovers from experi-
ence in this context. Geography—in particular, a firm’s location within a cluster—is a universally
strong predictor of digital innovation. Interestingly, this effect is specific to digital experience within
2
a product class, suggesting that geographic expertise is most relevant for digital innovation when
knowledge is specialized. Overall, we find that digital innovation is led by generalist firm experts,
but is more likely to occur in specialized clusters.
With respect to financial resources, we find that access to capital is associated with higher
rates of digital innovation, but that these effects are smaller than those associated with experience
and geographic expertise. Public firms are more likely to commercialize digital products, but these
firms are, by definition, already incumbents. Among newer entrants, our estimates suggest that an
order-of-magnitude increase in venture capital (VC) funding would be needed to offset the positive
effects of being in a specialized product cluster. Further, the results imply that a doubling of VC
funding would be necessary to offset just a single-digit percent increase in a firm’s recent experience
with related digital devices.
Finally, we observe that different types of access to capital matter in slightly different
ways: publicly listed firms are particularly likely to engage in digital innovation of durable medical
devices (those used multiple times, often based in hospitals; e.g., ultrasound equipment), whereas
VC-funded firms are more likely to pursue digital innovation in single-use devices (those used for
only one patient; e.g., pacemakers and insulin pumps). These findings are consistent with stronger
inter-temporal spillovers from digital innovation among established firms.
Previous studies have highlighted the importance of software and digitization in deter-
mining how firms innovate (Arora et al. 2013; Branstetter et al. 2018) and perform (Brynjolfsson
and McElheran 2016). Our study builds in many ways on the literature linking software and net-
working capabilities to innovative activity; it differs, however, from previous studies, in that our
primary measure of innovation goes beyond patenting activity to assess the precise and complete
set of new products that are ultimately brought to market. Because new product commercializa-
tion in the medical device industry typically occurs well after patenting, this study characterizes
software-driven innovation at the tail end of the innovation process, focusing on the final phase of
new product development. Furthermore, this study is distinct in that it models digital innovation
as a dependent variable, whereas other studies have frequently treated the use of software as an
independent variable.
3
We proceed as follows: Section 2 provides background on the U.S. health care industry and
on FDA medical device regulation as it relates to the process of new product commercialization.
Section 3 presents a conceptual framework for the supply-side cost of new product commercializa-
tion, based on firm experience, geography, and financial resources and lays out testable hypotheses.
Section 4 describes the data used in the empirical analyses. Section 5 presents estimation results.
Section 6 concludes.
2 Background
In the United States, health care spending makes up nearly 18% of the economy (National Health
Expenditure Accounts Highlights 2016), offering a large potential market for new technologies and
a variety of opportunities for innovators to build and grow businesses around new products. A
growing segment of the health care market is “digital health,” which is broadly defined to include
companies and products at the intersection of healthcare and technology.1 The digital health space
includes health care IT and information systems, as well as a host of companies that build and
sell technologies such as wireless sensors, software-enabled diagnostic and imaging devices, and
artificial intelligence software programs with health care applications. In recent years, there has
been dramatic growth in funding for digital health (Tecco and Zweig 2017), with notable private
and public initiatives emerging to fund research and investment.2
Medical technologies—the devices and equipment used in treating and caring for patients—
have become increasingly digitized, as software and networking capabilities have become integrated
into a growing number and share of new products. Common examples include digital blood-glucose
monitors and nearly all contemporary radiology devices, which combine equipment for imaging
with software for image processing and display. Modern medical devices incorporate software for
tasks ranging from simple blood pressure monitoring to the processing and analysis of computed
1https://rockhealth.com/what-digital-health-is-and-isnt2For example, Rock Health describes itself as “the first venture fund dedicated to digital health”
(https://rockhealth.com/about) and the state of Massachusetts launched the Massachusetts Digital Healthcare Ini-tiative in January, 2016 as “a comprehensive public-private partnership that will advise the administration onthe future of the Commonwealth’s digital healthcare industry” (http://www.mass.gov/governor/press-office/press-releases/fy2017/governor-establishes-mass-digital-healthcare-council.html).
4
tomography (CT) data. Today, digital medical technology is commonplace and its use is inescapable
for health care delivery professionals: a recent report found that U.S. hospitals use an average of
10 to 15 “connected”—i.e., networked—digital devices per patient bed (Newman 2017). Yet until
the late 20th century, few software-driven medical devices existed and it wasn’t until the late 1990s
that the U.S. Food and Drug Administration (FDA) first issued guidance on the incorporation of
software into regulated medical devices (FDA, 1999).
While the 21st century has seen rapid digitization of medical data as a result of the growth
of electronic health records (Wachter and Howell 2018) and the creation of a multi-billion-dollar
digital health investment space (Tecco 2016), the growth of software in medical devices has not
yet been characterized across products or firms, nor is it tracked directly by regulators. The
implications of digitization for shaping patterns of innovation and commercial leadership in this
sector have therefore not yet been studied at scale.
2.1 Regulated Medical Devices
The FDA is the only regulatory authority with the power to grant marketing approval for medical
devices in the United States. An agency within the U.S. Department of Health and Human Services,
it regulates over two trillion dollars’ worth of products annually, including all medical technologies
(Babiarz and Pisano 2008). The FDA is organized into centers, each of which focuses on one type
of product. Medical devices, including radiation-emitting products such as X-ray and ultrasound
machines, are regulated by the Center for Devices and Radiological Health (CDRH).3 Within the
CDRH, the Office of Device Evaluation reviews new products.4
Devices are wide-ranging in their complexity and their risk to patients. They range from
low-risk devices such as stethoscopes and tongue depressors to moderate-risk products such as
hearing aids and blood pressure monitors to complex, high-risk products such as cardiac pacemak-
ers and replacement heart valves. While devices of the lowest risk are subject only to so-called
3Other centers are responsible for other product categories. For example, drugs are regulated by the Centerfor Drug Evaluation and Research (CDER) and biologics are regulated by the Center for Biologics Evaluation andResearch (CBER).
4Since 1976, the regulation of new medical devices has been governed by the Medical Device Amendments (MDA)to the Federal Food, Drug, and Cosmetic Act of 1938.
5
“general controls” of labeling and of compliance with the FDA’s good manufacturing practices,5
moderate-risk and high-risk devices must submit applications to the FDA for regulatory clearance
or regulatory approval, respectively.6 The administrative data from these regulatory processes,
along with each new product’s formal description, are made publicly available at the time a device
completes regulatory review. These documents constitute the main source of new product data
used in our analyses.
As described in detail below, a growing number and share of devices now contain software.
Such features allow for additional functionality, such as allowing physicians to remotely diagnose
and monitor patients. For example, the CardioMEMSTM
HF System allows for remote, wireless
heart failure (HF) monitoring, which has been shown to reduce HF hospital admissions for at-risk
patients.7 Despite recognition of the increasingly digital nature of medical devices,8 the FDA does
not formally track the use of software in medical devices in its product-level regulatory data. As
a result, the prevalence and growth trajectory of digital products and their distribution across
medical specialty areas have not yet been broadly described. The first portion of this paper is
therefore dedicated to using information embedded in the text of medical device summaries to
identify digital medical devices and quantify their growth. Using text analysis and an off-the-shelf
natural language processing tool for medical topic identification, we analyze 15 years of medical
device product summaries. We then turn to a set of empirical exercises that model the drivers of
digital innovation across firms in this industry.
2.2 Moderate-risk Devices and the 510(k) Process
Moderate-risk devices are approved through a process called premarket notification, which is often
referred to as the “510(k) process”—a reference to the section of the law that established this
regulatory pathway. One important component of the 510(k) application is the 510(k) Summary, a
text document describing the device and published at the time of clearance. The summary includes
5https://www.accessdata.fda.gov/scripts/cdrh/cfdocs/cfpcd/315.cfm6https://www.fda.gov/MedicalDevices/DeviceRegulationandGuidance/Overview7https://www.sjm.com/en/sjm/cardiomems8See, for example, the FDA’s growing list of guidance documents related to software in medical devices (FDA,
1999; FDA, 2005a; FDA, 2014; FDA, 2016).
6
“a description of the device such as might be found in the labeling or promotional material for the
device” along with “an explanation of how the device functions [and] the scientific concepts that
form the basis for the device.” The summary also describes “significant physical and performance
characteristics of the device, such as device design, material used, and physical properties,” making
it a clear source of information on the product’s key technological characteristics.9 It is these
summaries (and their equivalents for high-risk devices) that are used to construct the text database
described below.
A sample 510(k) Summary can be seen in Appendix Exhibit 1. Appendix A provides
additional detail on the 510(k) process.
2.3 High-risk Devices and the PMA Process
High-risk (Class III) devices are regulated through a process called Premarket Approval (PMA),
which typically requires data from clinical trials in order to establish a device’s safety and effec-
tiveness with reasonable certainty.10 Evidence from trials is presented to the FDA as one part of
the PMA package (Kramer et al. 2012).11
Like the 510(k) process, the PMA process includes a product-specific summary document,
which is made publicly available at the time the device is approved.12 Much like 510(k) sum-
maries, PMA summary documents contain information on indications for use and a detailed device
description—“how the device functions, the basic scientific concepts that form the basis for the
device, and the significant physical and performance characteristics of the device”—among other
components.13
Appendix B contains additional detail on the PMA process; a sample PMA summary can
be seen in Exhibit 2.
9https://www.accessdata.fda.gov/scripts/cdrh/cfdocs/cfcfr/CFRSearch.cfm?CFRPart=80710See: http://www.fda.gov/MedicalDevices/DeviceRegulationandGuidance/HowtoMarketYourDevice/Premarket
Submissions/PremarketNotification510k/11Additional details of the PMA review process can be found at: http://www.fda.gov/MedicalDevices/DeviceRegulation
andGuidance/HowtoMarketYourDevice/PremarketSubmissions/PremarketApprovalPMA/ucm047991.htm12These summaries are used along with their moderate-risk device equivalents in the analysis below.13https://www.accessdata.fda.gov/scripts/cdrh/cfdocs/cfcfr/CFRSearch.cfm?FR=814.20
7
2.4 Software in Medical Devices
The integration of software into medical devices is a relatively recent phenomenon. The first traces
of regulatory interest in software in medical devices go back to 1999, when the FDA released its first
guidance document, outlining expectations and standards for software embedded in new medical
technologies (FDA, 1999). The FDA’s guidance has been augmented and updated several times
since (e.g. FDA, 2005a; FDA, 2005b; FDA, 2005b; FDA, 2016) and today, medical devices that
not only incorporate software but also functionally rely on it, are commonplace. Thousands of
patients and their physicians have come to depend on software-enabled medical devices, ranging
from imaging devices for radiology to software-enabled insulin pumps to implantable heart failure
monitors capable of wireless transmission.
2.5 Software in the Health Care Industry
While we are not aware of any studies of the digitization of medical devices, a small but growing
body of literature in management and economics explores topics at the intersection of digitization
and health care. Most prominently, a number of papers have analyzed the use and adoption of
electronic health records (EHRs), one of the primary ways in which software and information
technology have impacted health care delivery in the past decade (e.g. Adler-Milstein et al. 2014;
Agha 2014; Dranove et al. 2014; Lee et al. 2013; Lin et al. 2018). These studies have documented
the ongoing adoption of EHRs along with the heterogeneous (and typically limited or delayed)
impacts on patient outcomes.
Our study is also related to a small literature on the adoption and use of software and
information technology elsewhere in health care delivery. For example, Athey and Stern (2002)
find that basic digitalization of emergency services (“911”) increased the short-term survival rate
of patients in cardiac distress. Other researchers have considered subtler regulatory factors in
health care, such as data privacy laws (Miller and Tucker 2017), in order to understand how new
technologies are adopted and used by patients. In the context of telehealth, (Dorsey and Topol
2016) describe the major trends with a particular focus on home and mobile device applications.
Yet beyond these studies, management and economics research at the intersection of digitization
8
and health care is scant and the impacts of digitization on health care innovation have not been
rigorously examined.
2.6 Determinants of Innovation
Firm experience and incumbency have been shown to drive innovative activity in contexts ranging
from biotechnology Henderson and Cockburn (1996) and pharmaceuticals (Nerkar and Roberts
2004; Morton 1999) to computer and IT hardware (Bayus and Agarwal 2007; King and Tucci 2002).
In various settings and competitive environments, research has shown that a firm’s experience in
an industry is important for predicting when and how it enters new markets. Explanations for the
enduring role of incumbent firms are numerous, but include organizational experience in specific
types of markets (Morton 1999), productivity spillovers in R&D activities (Henderson and Cockburn
1996), complementarities among technological and product-market experience (Bayus and Agarwal
2007), and experience with the process of new-market entry itself (King and Tucci 2002). Using
detailed commercialization histories, we are able to revisit the role of firm experience in the context
of an industry undergoing digitization.
A number of studies in management and economics have also highlighted the role of ge-
ography in innovative activity. Forman et al. (2016) study the competing effects of colocation and
coagglomeration of invention, showing evidence of geographic clustering of patents within the San
Francisco Bay Area in information and communication technologies as well as more generally. Ear-
lier research from Jaffe et al. (1993) suggests similar dynamics; namely, local knowledge spillovers
leading to geographic clustering of patent citations. In the related health care context of biotech-
nology, Mariani (2004) highlights the role of knowledge spillovers and agglomeration economies in
research-intensive sectors.
Finally, firm financial resources are thought to explain firms’ innovation activities. Cohen
(2010) reviews the literature on this topic and concludes that in many—but not all—settings, cash
flow is associated with higher R&D spending, noting that at least for smaller firms, the causality is
thought to run from the former to the latter (Hao and Jaffe 1993). In the medical technology setting
specifically, data suggest that small firms are particularly capital-constrained and rely on capital
9
flows from both larger firms and venture capitalists to finance costly new product development
(Makower 2010). Thus, our set-up also considers firms’ access to capital (in particular, public
markets and VC funding) as specific financial resources that may drive innovation.
3 Conceptual Framework
We outline a simple conceptual framework for predicting how firms make decisions to pursue costly
new product development projects, given heterogeneity in location, prior experience, and financial
resources. In particular, we emphasize that the necessity of a regulatory approval process, along
with the accompanying time, financial investments, and institutional know-how required for suc-
cessful new product development, generate differences in the relative costs of commercialization
activities for different types of firms. Our framework focuses solely on the supply-side decision to
enter a new market.
A typical feature of digital products is low (or zero) marginal cost of provision to additional
customers (Goldfarb et al. 2015), however the cost of developing the digital technology in the first
place may be quite large. We build on this intuition, noting that in the case of a multi-purpose
technology such as software (for example, for digital data transmission, imaging, or data display),
the marginal cost of applying the technology to subsequent products within a firm’s portfolio will fall
as the firm acquires experience. Further, financial resources are known to shape R&D investments
at the firm level (Cohen 2010; Hall and Lerner 2010; Kortum and Lerner 2001; and many others).
In a setting where multiple factors can influence the cost of new product development, financial
resources are another important lever that would be expected to impact the costs associated with
digital innovation.
3.1 Framework for firm decision-making
A simple framework for considering firm investments can be seen in the following stylized two-
period model: consider a firm, f , from geography g, facing a decision in period 1 (t = 1) regarding
commercialization of a product in product class s. Commercializing a product involves costs, Cfstg,
which include manufacturing and production costs, Mfstg, and financing costs, Ifst, e.g., for product
10
design and R&D. That is, Cfstg = c(Mfstg, Ifst).14
Commercialization of a product results in expected revenues in period 2, rfst+1. Firms
will invest in commercializing new products when Cfstg < rfst+1; that is, whenever net expected
profits from a given product are positive:15 rfst+1 − Cfstg = πfstg+1 > 0.
We consider variation at the firm, product class, time, and geography levels in the empirical
models that follow. In the remainder of this section, we leave off subscripts for simplicity.
3.2 Hypotheses
To preview, our conceptual framework predicts that the costs of commercializing a new product
will vary with firm know-how, location, and financial inputs to R&D activities. C will therefore be
decreasing in E and increasing in I. As a direct corollary, expected revenues in period 2 for firm
f commercializing a given device in period 1, πt+1, would be increasing in E and decreasing in I,
making firms with more experience, those located in clusters, and/or those with lower financing
costs more likely to pursue innovation. In this setup, four assumptions, which are consistent with
both the theoretical and empirical literature, are required in order to take into account variation
in firm commercialization decisions over time. All cross-partial derivatives of C and π can then be
signed, leading to a set of testable hypotheses.
Assumption 1: Manufacturing costs are a function of a firm’s labor costs, raw material
costs, and prior commercialization experience, such that Mftg = m(Ltg, Rtg, Eft). We assume
that all firms can access the same local labor and raw materials markets such that the remaining
variation in the cost of manufacturing is only related to differences in know-how, E (that is, prior
commercialization experience).
Assumption 2: We can further disaggregate E to allow for both firm- and geography-
specific differences in know-how. More precisely, we allow for firm-level and area-level variation
14Financing costs may vary by firm and product class and over time, but should not further vary by geographyafter accounting for other factors.
15A more detailed model could also account for the relevant discount rate. This stylized 2-period model does notincorporate the fact that it may take more than one period for an investment to realize positive profits, which couldalso be included in a more detailed model; however, we note that since the average product lifecycle is just 1.5–2years (Wizemann et al. 2010), it is realistic to assume that products should achieve profitability on a very short timehorizon in order to justify commercialization.
11

in prior commercialization experience such that E = e(α, γ), where α is the level of within-firm
expertise and γ is the level of local geographic expertise. The importance of within-firm expertise
has been extensively documented (Bayus and Agarwal 2007; Henderson and Cockburn 1996; King
and Tucci 2002; Nerkar and Roberts 2004; Morton 1999; and many others),16 as has the role of
regional expertise and geography in predicting innovative activity (Delgado et al. 2014; Forman et
al. 2016; Mariani 2004; Jaffe et al. 1993; and many others).
Additionally, we note that within-firm and local geographic expertise can be categorized as
general or class-specific, such that general experience considers a firm or location’s commercializa-
tion experience across all software-driven medical devices, while class-specific experience considers
only a firm or location’s software-driven product commercialization experience within a specific
FDA product class, such as digital radiology products. That is, E can be divided into general and
class-specific components: E = e(α, γ, αs, γs).
Assumption 3: We expect that class-specific expertise is more transferrable to new
product development than expertise outside the focal product class such that class-specific expertise
reduces commercialization costs more than general expertise does. Thus, δEδγ < δE
δγsand δE
δα < δEδαs
.
Our hypotheses then can be stated as follows:
• Hypothesis 1: δCδE
δEδαs <
δCδE
δEδα < 0.
– 1a: Within-firm know-how (previous experience) decreases commercialization costs.
– 1b: It does so in a way that is increasing in the specificity of within-firm experience.
• Hypothesis 2: δCδE
δEδγs <
δCδE
δEδγ < 0.
– 2a: Local geographic expertise (being located within a cluster) decreases commercial-
ization costs.
– 2b: It does so in a way that is increasing in the specificity of local expertise.
Assumption 4: We assume that a firm’s financing cost, I, is correlated with its access
to external capital, through either public capital markets or venture capital financing. This is
16This is also consistent with the theory of economies of scope as described by Panzar and Willig (1981) and asseen in empirical studies such as Henderson and Cockburn (1996).
12

consistent with literature linking firm performance and innovation to access to finance and financial
constraints (Cohen 2010; Cohen and Klepper 1996; Hao and Jaffe 1993; Stern 2017). We can
therefore write I as a decreasing function of (a) being publicly listed (having access to public
capital markets), φ and (b) being VC-funded, v. We can then define I as a function i, where
I = i(φ, v) and δIδφ and δI
δv <0.
The next set of hypotheses therefore address the implications of financial resources on
expected patterns of commercialization, in which smaller and more capital-constrained firms will
face higher costs of pursuing digital innovation:
• Hypothesis 3: δCδI
δIδφ < 0. The cost of digital new-product development will be lower for
publicly listed companies, making them more likely to commercialize new products.
• Hypothesis 4: δCδI
δIδv < 0. The cost of digital new-product development will be lower for
firms with venture capital funding, making them more likely to commercialize new products.
Importantly, we expect these dynamics to emerge as novel manifestations of firm advantage in
digital new product commercialization. That is, the digital-product-specific components of firm
experience, geography, and access to financing should matter above and beyond the advantages
that these factors may confer already, when considering firms’ commercialization patterns more
broadly. We test each of these hypotheses in the analyses described below.
4 Data, Classification, and Summary Statistics
4.1 Summary
This project draws on four main sources of data. We begin with administrative data on all FDA-
regulated moderate-risk and high-risk medical devices that came to market over 15 recent calendar
years; namely 2002 to 2016, inclusive. For each device, we collect and analyze the text of the
accompanying product summary or statement.
Using an automated script and two different types of supervised document classification,
we identify and characterize digital (software-driven) devices. First, we document the incidence and
13
frequency of keywords related to software and networking capabilities in products and track these
keywords over time. Subsequently, we use the National Library of Medicine’s Medical Text Indexer
(MTI)17—a set of document classification algorithms that take free text and provide subject index-
ing recommendations based on the Medical Subject Headings (“MeSH R©” vocabulary) established
by the National Institutes of Health (NIH)—to validate the keyword-driven classification exercise.
Using the commercializing firm’s identity along with historical data about the location of a given
product application and firm-level financial data, we characterize commercializing firms at the time
each medical device in our dataset came to market.
4.2 Administrative Data on New Medical Devices
The first dataset for this project comes from combined regulatory clearance documents associated
with all new moderate-risk and high-risk medical devices that came to market in the United States
after 1996. Moderate-risk devices—such as hearing aids, blood pressure monitors and echocardio-
graph devices—are the largest category of devices regulated by the FDA, while high-risk devices—
such as pacemakers and drug eluting stents—make up a smaller share of new products. Moderate-
risk device clearance happens through a process called “510(k),” while high-risk device approval
occurs through the PMA process. Both processes are described briefly above (Section 2) and in
detail in Appendices A and B, respectively. These processes are the final step of the research and
development process, after which a cleared/approved product can be legally marketed in the United
States. The FDA has historically received approximately 4,000 applications for new 510(k) devices
annually, compared to fewer than 100 PMA applications (Maisel 2004).
The FDA’s 510(k) clearance database18 and PMA approval database19 include the full set
of device names, product codes (three-letter classifications that categorize devices according to site
of use and purpose), and submission and FDA decision dates for all products cleared/approved for
marketing. The top eight medical specialty areas (classes) account for over 75% of all new product
approvals and are the focus of this study (Table 1). For each of these classes, there were over 2,000
17https://ii.nlm.nih.gov/MTI18https://www.accessdata.fda.gov/scripts/cdrh/cfdocs/cfpmn/pmn.cfm19https://www.accessdata.fda.gov/scripts/cdrh/cfdocs/cfpma/pma.cfm
14
unique new device approvals between January 1, 2002 and December 31, 2016.20 Due to availability
of product descriptions (as described below) this is our period of analysis. Over this period, 35,794
new regulated devices came to market in the United States. Each class of devices includes multiple
product codes and (typically) multiple unique devices within each product code. Figure 1 presents
a simple example of the hierarchy of the classification system.
4.3 Rich Text Data
The second data source is a novel database of text files made up of the device summaries (stan-
dardized product descriptions). At the time of 510(k) clearance or PMA approval, a “summary” or
“statement” is published for each device. As noted above, the summary must contain “a descrip-
tion of the device...including an explanation of how the device functions, the scientific concepts
that form the basis for the device, and the significant physical and performance characteristics”
(such as design and physical properties).21 In less than 10% of cases in our sample years, a related
document called a “statement” was published in lieu of a summary,22 in which case, we used the
text from the statement instead. While somewhat less detailed than summaries, statements also
contain relevant information about the content of products (for example, several included use of
the word “software”) and therefore provide the type of text information that is relevant for product
classification in this study.23 We hereafter use the term “summary” broadly to refer to both types
of document.
Device summaries are published as online PDF documents following a standardized URL-
format and we use an automated script to batch download all posted documents. These documents
began to be digitized in May 2001 and we begin our study sample in 2002, the first full calendar
year with digitized summaries available. Using Abbyy FineReader optical character recognition
20These eight classes are defined using the full set of FDA clearance records available and therefore represent theuniverse of newly approved, FDA-regulated devices.
21https://www.fda.gov/MedicalDevices/DeviceRegulationandGuidance/HowtoMarketYourDevice/PremarketSub-missions/PremarketNotification510k/ucm142651.htm; as noted above, Exhibits 1 and 2 present examples of 510(k)and PMA summaries, respectively.
22https://www.fda.gov/MedicalDevices/ProductsandMedicalProcedures/DeviceApprovalsandClearances/510kClearances/ucm089452.htm
23In theory, the use of statements could lead to under counting digital products if their text files are less detailed.Therefore, in robustness tests (unreported), we confirm that all results hold when considering the sample of productsummary documents only.
15
(OCR) software, we convert downloaded documents into machine-readable text files. In total,
ninety-eight percent of the product summaries could be converted to a machine-readable format
giving us 35,794 device-text pairs.24 We have no systematic concerns regarding selection or time
trends in missing text data: the machine-readability of online PDFs is not statistically different
across medical specialties overall, in any year, or over time. For all years, at least 97% of all
digital documents were machine-readable following OCR document processing. Appendix C, Table
I presents the number of machine-readable summaries in our sample by calendar year.
Although the use of text-based data—for example, categorizing phrases to document firm
extensions into new products and services, as in Greenstein (2000)—has a well-established history in
empirical analysis, the automation of these exercises is a relatively nascent phenomenon. Gentzkow
et al. (2017) describe several techniques for parsing and analyzing text data and highlight the fact
that “the information encoded in text is a rich complement to the more structured kinds of data
traditionally used in research.” In recent years, text data has been used in studies ranging from
sentiment analysis of policy uncertainty (Baker et al. 2016) to labor economics (Deming and Kahn
2018) and in the analysis of patent data (Moser et al. 2017). Here, we demonstrate the utility of
automated classification of product types at scale for understanding the content and functionality
of new medical devices.
We process text files in two ways, each of which leads to a similar classification of digital
medical devices. Our first approach is a form of supervised document classification in which we
identify the incidence and frequency of keywords related to software and networking capabilities
in each device description. These terms were selected in advance using two online glossaries of
computer-related terms.25 (A list of the 36 most frequently used keywords—each of which were
found in over 100 unique product descriptions—can be found in Table II of Appendix C.) Unsur-
prisingly, the use of “software” and several related keywords has increased over time (Appendix C,
Figure I). Because “software” is the most common among our search terms and is highly correlated
with others, we rely on its inclusion in a product’s description as our first indicator to identify
digital products.
24These include 35,495 510(k) summaries and 299 PMA summaries.25Composite list from http://www.math.utah.edu/∼wisnia/glossary.html and https://pc.net/glossary
16
Categorizing products by keyword use is our first application of simple document classifi-
cation to identify digital devices. It has the advantage of being simple and highly transparent, but
the disadvantage of being somewhat ad hoc. However, this method is very successful in identifying
products of interest. In particular, since the product descriptions included in FDA clearance doc-
uments are standardized and parsimonious, there is no reason—and indeed no option—to include
extraneous text related to features that are not included in the device itself. To put it simply,
keywords such as “software” will not appear in the product description if they do not relate to
aspects of the device’s functionality (see Appendix Exhibits 1 and 2). Nevertheless, we performed
several manual inspections to confirm that incidents of keywords found were indeed references to
the technology in the device: we drew a random sample of 120 devices (eight per calendar year)
that had been flagged for including “software” and manually inspected each of these devices’ sum-
maries. In this sample, 100% of devices flagged as including “software” were found to be correctly
coded (that is, a 0% rate of type I error in this random subsample).
We validate our ad hoc supervised document classification using the National Library
of Medicine’s MTI algorithm. As noted above, the MTI takes free text as an input to provide
subject indexing recommendations based on the MeSH vocabulary established by the NIH. Since
our primary measure of digitization is the incorporation of software into new products, we classify
device descriptions using the MTI and generate an indicator for whether the algorithm assigned the
MeSH code for software to the product.26 The MeSH code for “software” broadly covers “sequential
operating programs and data which instruct the functioning of a digital computer,” a slightly higher
bar for classifying digital products than searching for the keyword “software” alone.
The MTI algorithm has the advantage of having been externally validated by the NIH
and by several years of use by the National Library of Medicine, but has two clear disadvantages.
First, as noted above, we believe that the bar may be higher for flagging product descriptions
for software inclusion (that is, identifying digital devices), since the MTI will require a discussion
of software programs in the text, beyond simply using the keyword “software.” For this reason,
our expectation is that the MTI may identify a more software-intensive subset of products in our
26In the MeSH tree, “software” takes the tree number L01.224.900. We identify all products that are classified asbeing anywhere on the “software” branch of the MeSH tree.
17
sample. Second, the MTI is non transparent in how it assigns concepts to text, since the algorithm
itself has not been published.27
Comparing the MTI output to our own keyword-based document classification method,
we find high degree of overlap: 100% of the devices flagged by the MTI as describing software
are also identified by the keyword method as being about software. However, as expected, not all
summaries using the keyword “software” are identified by the MTI. The rightmost column of Table
II in Appendix C presents a cross-tabulation of our ad hoc keyword-based document classification
versus the MTI’s classification. Notably, the actual keyword “software” has the highest degree of
overlap with the MTI-based definition.
Because we care primarily about digitization in the sense of incorporating any software, we
focus on the keyword-based definition for our primary analysis; however, for all regression models,
we test the alternative (MTI-based) definition and present alternative versions of all key tables in
Appendix C. The choice of definition does not appear to change the sign or statistical significance
of the main results below, but magnitudes are attenuated roughly proportionally to the decrease
in the number of software devices included in the MTI-defined sample.
Figure 2 presents the growth of new digital devices over our observation period. Figure
3a shows the growth in digitized product codes—unique types of devices—over time, while Figure
3b shows growth in the number of firms pursuing digital innovation. Through these figures, we
see that the growth in digital devices has been a result of the entry of both new products and new
firms. Figure 4a shows that the number of digital product codes grew by over 400% over this period,
while non-software product codes grew by only about 150% (albeit off a higher baseline). Figure
4b breaks down the growth of digital devices across medical specialty classes, revealing interesting
heterogeneities. Although all classes show growth in digital products, the share of new products
that are digital varies dramatically across medical specialty classes.
27The MTI algorithm is not directly observable/open source; we batch-process text files through the algorithm andrecord the subject headings that the MTI returns as output.
18
4.4 Measuring Firm Experience and Geographic Clusters
We characterize firms’ digital device experience along two dimensions. First we calculate the count
of digital devices the firm commercialized in the three years prior to the year of observation. This
window is consistent with the medical device development period, which may run over two years
(Wizemann et al. 2010). Second, we calculate the count of digital devices within each class that
the firm commercialized over the same three-year window of time (up to, but not including, the
year of observation). We calculate total (digital and non-digital) devices commercialized by each
firm in the same manner to be used as measures of overall firm experience.28
With respect to geography, we characterize firms as to whether or not they are in a “digital
cluster” in three (increasingly specific) ways.29 Each of these definitions requires limiting the sample
to U.S.-based applications in order to operationalize a consistent definition of state-based geographic
clusters. Notably, many of these applications are from U.S. offices of firms headquartered outside
of the United States, so many large, international firms are in the final sample.
First, we consider local labor market expertise. Using annual data for 2016 from the U.S.
Bureau of Labor Statistics (BLS), we compile data on each state’s share of software engineers in
the labor force30 in order to consider whether there is a relationship between the characteristics of
the skilled IT workforce in a state and the likelihood of digital innovation emerging from that state.
Because each application includes an address, we can see the location of the facility from which a
device application was submitted. Appendix Figure II presents a set of sample states. While there
is some variation over time within states, the primary source of variation in the share of software
engineers is across states.
Next we consider two types of state cluster for digital innovation, as defined by where
device commercialization took place in preceding years. We define digital clusters by identifying
the top 20% of states for digital device commercialization, based on a three-year moving average of
the number of digital products brought to market in the period leading up to the year of observation.
28in robustness tests, we also consider a two-year and a five-year window of past firm experience29We also define overall device commercialization clusters in analogous ways to be used as controlls.30Data were available for 2005 to 2015 inclusive; however, our analysis sample spans 2005 to 2016. In order to
estimate 2016 data, we impute 2016 state employee shares based on a linear projection from the prior five years,which is similar to the method that BLS uses in its own projections.
19
We then consider a class-specific version of this definition, in which we define the top 20% of states
for digital device commercialization within each product class. Based on each of these definitions,
we create an indicator variable for whether or not a device originated from a cluster. The sample
used in regression analysis is limited to the years 2005 to 2016 (inclusive), to facilitate a three-year
look-back on regional product expertise. For example, a data point in the year 2005 uses data from
the years 2002, 2003, and 2004. Using these two definitions, Appendix Figures III and IV show the
share of digital devices originating from clusters versus those not originating from clusters.
By using a three-year look-back to define clusters and to define firms’ digital device ex-
perience, our analysis sample includes only the set of products that came to market in the years
2005-2016 (although data from the years 2002 to 2004 are used to define important firm measures
in the early years of the analysis sample). Further, we limit our analysis sample products commer-
cialized in the United States (including those commercialized by foreign firms with U.S. regulatory
submission addresses), in order to tractably and consistently define geographic clusters. The fi-
nal analysis sample includes 22,291 observations at the product level (Table 1). Table 2 presents
summary statistics of all variables used in regression models.
4.5 Firm Financial Data
Each device is linked by its commercializing entity to detailed firm financing data. We first link
commercializing entities to a panel of firm acquisitions created using data from EvaluateMedTech31
in order to account for subsidiary ownership and introduce the notion of child (acquired) and
parent (acquirer) firms. These child and parent firms are then separately linked to data on each
firm’s public listing status and venture capital data. In order to link firm-level datasets, we use
the software program matchIT, which performs fuzzy matching of company names (or addresses)
between (or within) datasets and grades the text match quality by score. We used this software
because it is highly flexible, fully parameterized, and deals effectively with foreign names. Firm
names were cleaned using a consistent set of rules to account for suffixes and abbreviations.32
Data on venture capital funding are assembled from EvaluateMedTech and Preqin, with
31A market intelligence database that tracks public and private firms in the medical device industry.32This method is similar in nature to work done for the NBER Patent Data Project by Bessen.
20

precedence given to the latter.33 We observe deal dates and funding amounts for each linked firm,
which we use in creating (a) lagged binary indicators for whether a firm was ever venture-funded
or venture-funded prior to product commercialization and (b) running totals for dollar values of
venture funding.
Data on firm public listing were collected from EvaluateMedTech and Capital IQ, with
precedence given to the former, as it has broad coverage of the medical device industry.34 These
data allow us to create a binary indicator for whether the commercializing firm was publicly listed
at the time a given product came to market. Appendix Figures V and VI show the share of digital
devices that were commercialized by venture-capital–funded firms (in the sample of all privately-
held firms) and by public firms, respectively.
5 Estimation and Results
In the estimation exercises that follow, we test the hypotheses outlined in Section 3.2. First, we
explore evidence for Hypotheses 1 (firm experience) and 2 (geographic clusters) and the likelihood
of a firm engaging in digital device innovation. Next, we explore evidence for Hypotheses 3 and
4 by modeling the relationship between firm financial resources (public capital and VC funding,
respectively) and digital innovation. In combined models, we consider all factors simultaneously
and explore mechanisms.
5.1 Overall Estimates
Trends in digital innovation in medical technology and the observed variation across medical spe-
cialty classes can be seen in Figures 2 to 4. Notably, there is significant heterogeneity across classes
in the volume (Figure 2) and share (Figure 4b) of digital innovation. There are also clear time
trends, with the number of new digital products growing over time. Among other things, the
descriptive findings point to the importance of using product class and year controls in empirical
33Preqin is widely considered the best publicly available dataset for venture funding and has been used in a varietyof recent studies (e.g. Harris et al. 2014 and Korteweg and Nagel 2016).
34We validate EvaluateMedTech data using Capital IQ, long considered a primary source for detailed firm financials.See, for example, Acharya and Xu (2017); Booth and Salehizadeh (2011); Sheen (2014).
21

models. We model the likelihood of digital innovation, D, as:
Dfpct = f(βX) + ε,
where the regressors include:
• Indicators of expertise (within-firm experience and geographic), each of which can be general
or class-specific.
• Indicators of firm financial resources, including whether a product emerged from a publicly
listed firm or a VC-funded firm.
• Controls for:
– Clearance year, in order to capture time trends in software inclusion over time.
– Medical specialty class, in order to account for persistent differences in the relative ease
or applicability of software in a given area of medicine and medical technology.
– The firm’s overall level of recent device innovation (that is, all product commercializa-
tion), such that any additional statistical relationships identified represent additional
effects seen for digital devices.
– The firm’s location in a general device cluster (that is, all devices, not just digital prod-
ucts), such that any additional statistical relationships identified represent additional
effects seen for digital devices.
• An error term, ε.
In the regression models below, all specifications include controls for the focal firm’s volume
of recent commercialization activity, controls for the locations of general medical device clusters,
and year and class fixed effects, with standard errors clustered at the product-code level in ac-
knowledgement of potential differences across product type (for example, as a result of differences
in innovation behavior or regulatory burden). All tables report marginal effects from logit models,
22
facilitating a more direct interpretation of statistical relationships.35
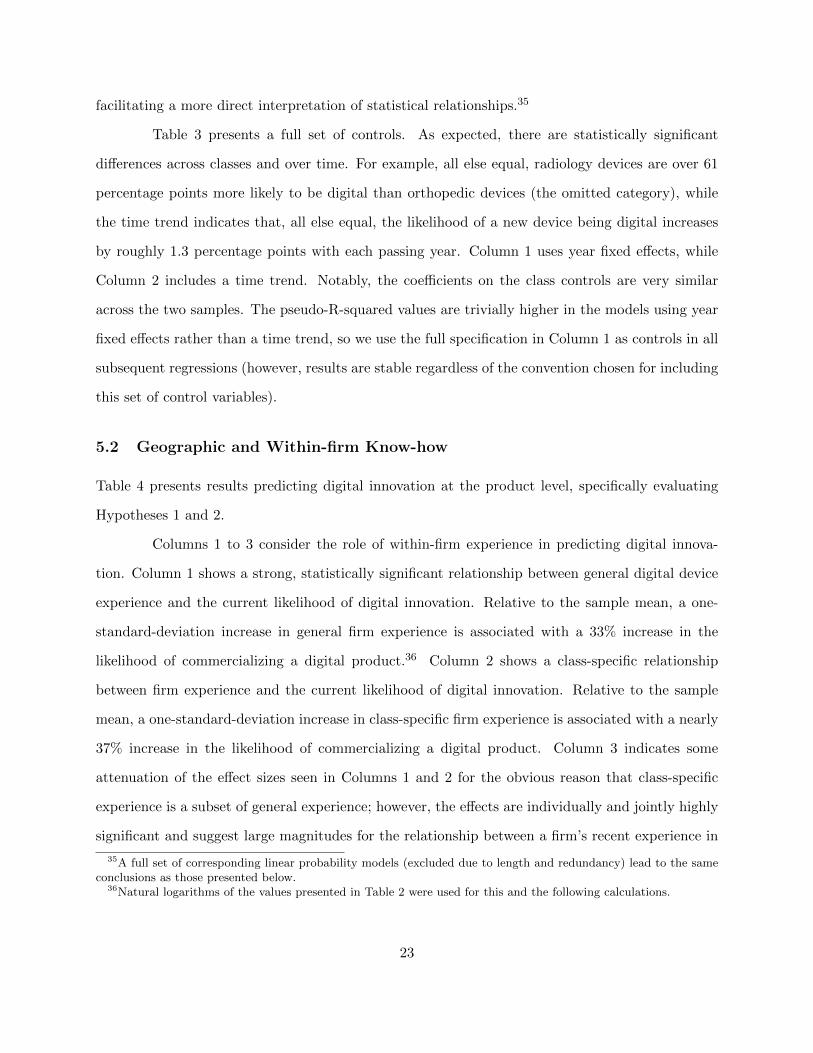
Table 3 presents a full set of controls. As expected, there are statistically significant
differences across classes and over time. For example, all else equal, radiology devices are over 61
percentage points more likely to be digital than orthopedic devices (the omitted category), while
the time trend indicates that, all else equal, the likelihood of a new device being digital increases
by roughly 1.3 percentage points with each passing year. Column 1 uses year fixed effects, while
Column 2 includes a time trend. Notably, the coefficients on the class controls are very similar
across the two samples. The pseudo-R-squared values are trivially higher in the models using year
fixed effects rather than a time trend, so we use the full specification in Column 1 as controls in all
subsequent regressions (however, results are stable regardless of the convention chosen for including
this set of control variables).
5.2 Geographic and Within-firm Know-how
Table 4 presents results predicting digital innovation at the product level, specifically evaluating
Hypotheses 1 and 2.
Columns 1 to 3 consider the role of within-firm experience in predicting digital innova-
tion. Column 1 shows a strong, statistically significant relationship between general digital device
experience and the current likelihood of digital innovation. Relative to the sample mean, a one-
standard-deviation increase in general firm experience is associated with a 33% increase in the
likelihood of commercializing a digital product.36 Column 2 shows a class-specific relationship
between firm experience and the current likelihood of digital innovation. Relative to the sample
mean, a one-standard-deviation increase in class-specific firm experience is associated with a nearly
37% increase in the likelihood of commercializing a digital product. Column 3 indicates some
attenuation of the effect sizes seen in Columns 1 and 2 for the obvious reason that class-specific
experience is a subset of general experience; however, the effects are individually and jointly highly
significant and suggest large magnitudes for the relationship between a firm’s recent experience in
35A full set of corresponding linear probability models (excluded due to length and redundancy) lead to the sameconclusions as those presented below.
36Natural logarithms of the values presented in Table 2 were used for this and the following calculations.
23

digital product commercialization and its current likelihood of digital innovation.37
Columns 4 to 7 consider the role of geography in predicting digital innovation. We find
that although a state’s share of software engineers (Column 4) is not a statistically significant
predictor of digital innovation (although the coefficient is positive, as expected), other measures of
geographic expertise are associated with a much higher likelihood of digital innovation. Dummy
variable indicators for being in either a general digital device cluster (Column 5) or being in
a class-specific digital device cluster (Column 6) are both strongly associated–both individually
and jointly–with higher probabilities of digital innovation in new products (Column 7). In the
combined model, which suffers least from potential omitted-variable bias, we observe that being in
a general digital device cluster is associated with a 4.1 percentage point increase in the likelihood of
digital innovation, while being in a class-specific cluster increases that probability by a further 13.3
percentage points.38 Further, these magnitudes are large: devices in the sample were roughly 30%
digital in 2016, the final year of observation. This implies that being located in a general digital
device cluster would (conservatively) increase the baseline likelihood of digital innovation by 13.7%
while being in a class-specific cluster would increase it by over 44%.39
Column 8 of Table 4 presents an “all-in” model that combines both experience and geogra-
phy. The magnitudes of the coefficients are similar to those in Columns 3 and 7, with the exception
of general digital device clusters becoming an insignificant predictor of digital innovation. Column
8 therefore suggests that after controlling for factors related to firm experience, only location in a
class-specific cluster is additionally predictive of digital innovation. The similarity of the remaining
coefficients across specifications in Table 4 indicates that within-firm experience and class-specific
geographic expertise are mostly independent of one another and have largely orthogonal impacts in
these predictive models. The findings in Table 4 support Hypotheses 1a, 1b, and 2b and partially
37These findings are also consistent with the experience of a former medical device industry executive who wasinterviewed about these findings ex post. He described a relatively siloed R&D process within the companies hewas most familiar with, where knowledge was likely to spill over first within business units. Medical device firms’business units tend to be organized by medical specialty area (e.g., interventional cardiology) and such specialtieslargely correspond to the classes used here. The class-specific nature of the spillovers documented in Table 4 weredescribed by the executive as “unsurprising.”
38In this model, the state’s share of software engineers is also predictive of digital innovation.39Being in a digital device cluster is associated with a 4.1 percentage point increase in the likelihood of digital
innovation off a mean of 30%, for a 13.7% increase. A similar calculation was done to arrive at the 44% figure forbeing in a class-specific cluster.
24
support Hypothesis 2a.
5.3 Firm Financial Resources
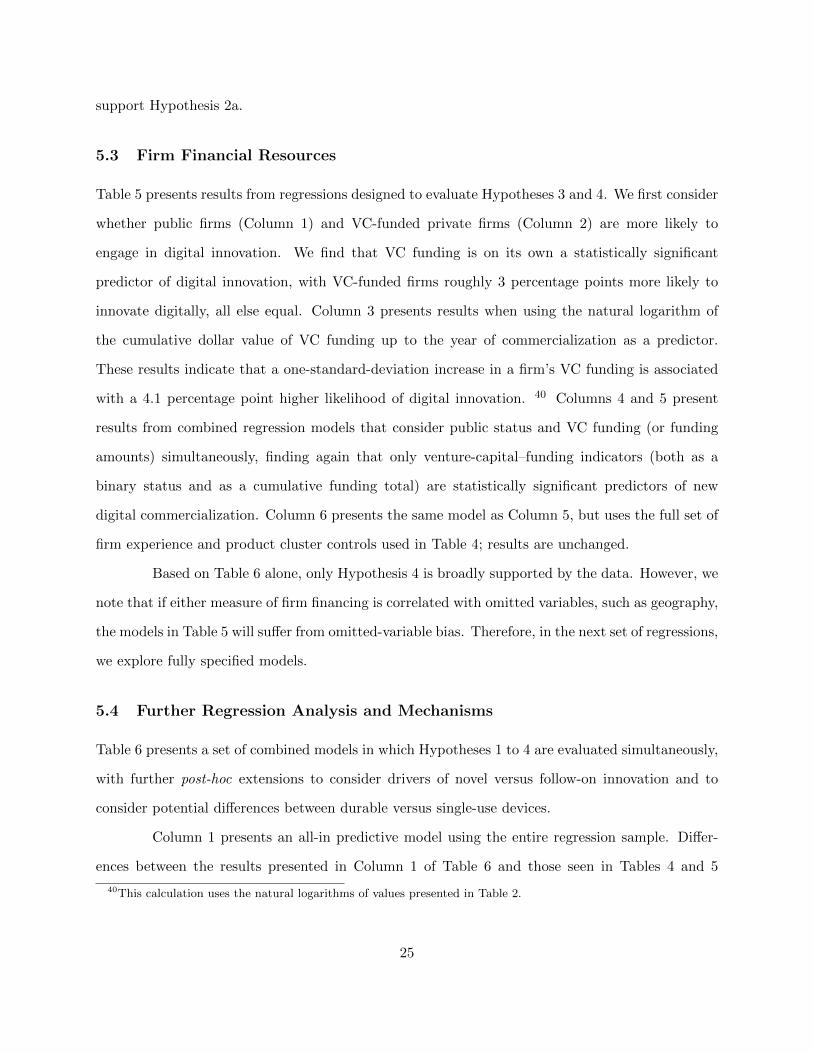
Table 5 presents results from regressions designed to evaluate Hypotheses 3 and 4. We first consider
whether public firms (Column 1) and VC-funded private firms (Column 2) are more likely to
engage in digital innovation. We find that VC funding is on its own a statistically significant
predictor of digital innovation, with VC-funded firms roughly 3 percentage points more likely to
innovate digitally, all else equal. Column 3 presents results when using the natural logarithm of
the cumulative dollar value of VC funding up to the year of commercialization as a predictor.
These results indicate that a one-standard-deviation increase in a firm’s VC funding is associated
with a 4.1 percentage point higher likelihood of digital innovation. 40 Columns 4 and 5 present
results from combined regression models that consider public status and VC funding (or funding
amounts) simultaneously, finding again that only venture-capital–funding indicators (both as a
binary status and as a cumulative funding total) are statistically significant predictors of new
digital commercialization. Column 6 presents the same model as Column 5, but uses the full set of
firm experience and product cluster controls used in Table 4; results are unchanged.
Based on Table 6 alone, only Hypothesis 4 is broadly supported by the data. However, we
note that if either measure of firm financing is correlated with omitted variables, such as geography,
the models in Table 5 will suffer from omitted-variable bias. Therefore, in the next set of regressions,
we explore fully specified models.
5.4 Further Regression Analysis and Mechanisms
Table 6 presents a set of combined models in which Hypotheses 1 to 4 are evaluated simultaneously,
with further post-hoc extensions to consider drivers of novel versus follow-on innovation and to
consider potential differences between durable versus single-use devices.
Column 1 presents an all-in predictive model using the entire regression sample. Differ-
ences between the results presented in Column 1 of Table 6 and those seen in Tables 4 and 5
40This calculation uses the natural logarithms of values presented in Table 2.
25
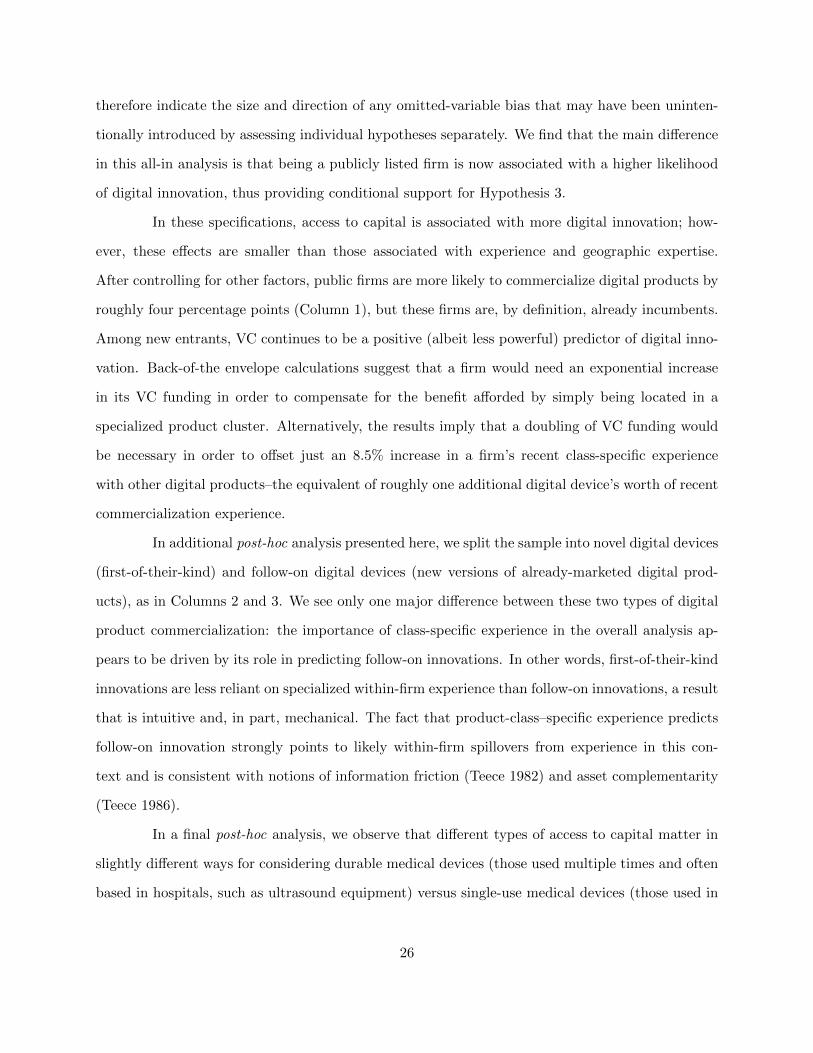
therefore indicate the size and direction of any omitted-variable bias that may have been uninten-
tionally introduced by assessing individual hypotheses separately. We find that the main difference
in this all-in analysis is that being a publicly listed firm is now associated with a higher likelihood
of digital innovation, thus providing conditional support for Hypothesis 3.
In these specifications, access to capital is associated with more digital innovation; how-
ever, these effects are smaller than those associated with experience and geographic expertise.
After controlling for other factors, public firms are more likely to commercialize digital products by
roughly four percentage points (Column 1), but these firms are, by definition, already incumbents.
Among new entrants, VC continues to be a positive (albeit less powerful) predictor of digital inno-
vation. Back-of-the envelope calculations suggest that a firm would need an exponential increase
in its VC funding in order to compensate for the benefit afforded by simply being located in a
specialized product cluster. Alternatively, the results imply that a doubling of VC funding would
be necessary in order to offset just an 8.5% increase in a firm’s recent class-specific experience
with other digital products–the equivalent of roughly one additional digital device’s worth of recent
commercialization experience.
In additional post-hoc analysis presented here, we split the sample into novel digital devices
(first-of-their-kind) and follow-on digital devices (new versions of already-marketed digital prod-
ucts), as in Columns 2 and 3. We see only one major difference between these two types of digital
product commercialization: the importance of class-specific experience in the overall analysis ap-
pears to be driven by its role in predicting follow-on innovations. In other words, first-of-their-kind
innovations are less reliant on specialized within-firm experience than follow-on innovations, a result
that is intuitive and, in part, mechanical. The fact that product-class–specific experience predicts
follow-on innovation strongly points to likely within-firm spillovers from experience in this con-
text and is consistent with notions of information friction (Teece 1982) and asset complementarity
(Teece 1986).
In a final post-hoc analysis, we observe that different types of access to capital matter in
slightly different ways for considering durable medical devices (those used multiple times and often
based in hospitals, such as ultrasound equipment) versus single-use medical devices (those used in
26
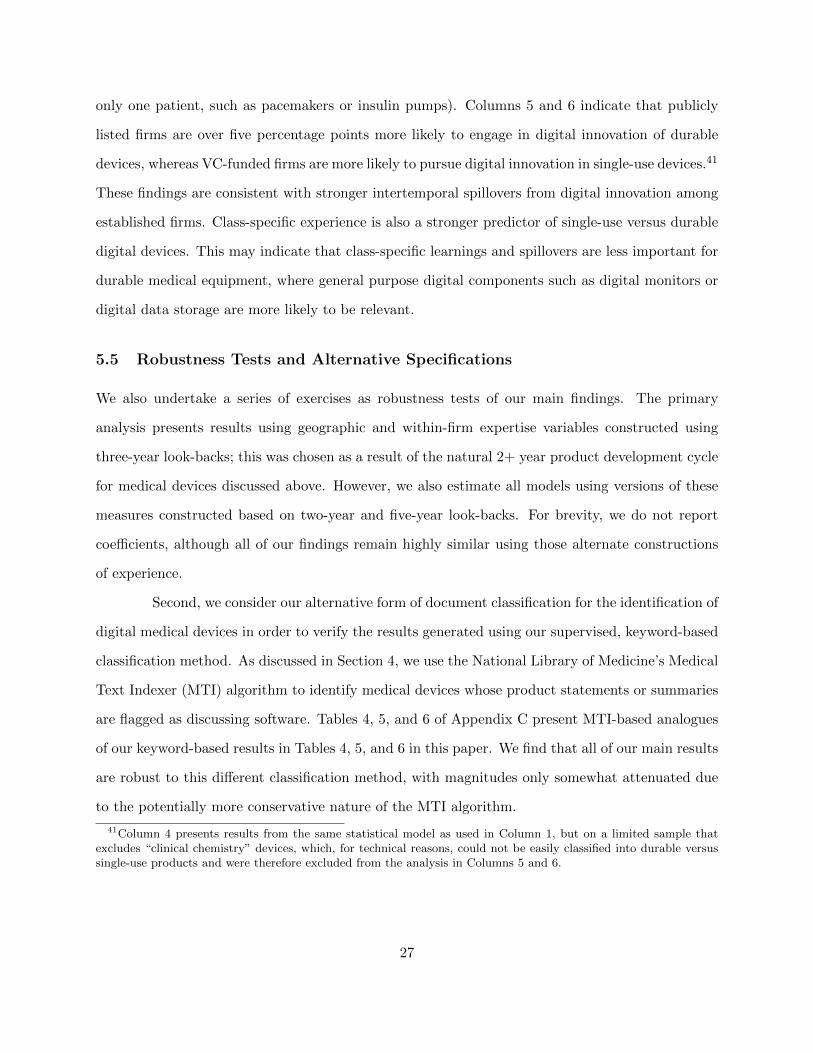
only one patient, such as pacemakers or insulin pumps). Columns 5 and 6 indicate that publicly
listed firms are over five percentage points more likely to engage in digital innovation of durable
devices, whereas VC-funded firms are more likely to pursue digital innovation in single-use devices.41
These findings are consistent with stronger intertemporal spillovers from digital innovation among
established firms. Class-specific experience is also a stronger predictor of single-use versus durable
digital devices. This may indicate that class-specific learnings and spillovers are less important for
durable medical equipment, where general purpose digital components such as digital monitors or
digital data storage are more likely to be relevant.
5.5 Robustness Tests and Alternative Specifications
We also undertake a series of exercises as robustness tests of our main findings. The primary
analysis presents results using geographic and within-firm expertise variables constructed using
three-year look-backs; this was chosen as a result of the natural 2+ year product development cycle
for medical devices discussed above. However, we also estimate all models using versions of these
measures constructed based on two-year and five-year look-backs. For brevity, we do not report
coefficients, although all of our findings remain highly similar using those alternate constructions
of experience.
Second, we consider our alternative form of document classification for the identification of
digital medical devices in order to verify the results generated using our supervised, keyword-based
classification method. As discussed in Section 4, we use the National Library of Medicine’s Medical
Text Indexer (MTI) algorithm to identify medical devices whose product statements or summaries
are flagged as discussing software. Tables 4, 5, and 6 of Appendix C present MTI-based analogues
of our keyword-based results in Tables 4, 5, and 6 in this paper. We find that all of our main results
are robust to this different classification method, with magnitudes only somewhat attenuated due
to the potentially more conservative nature of the MTI algorithm.
41Column 4 presents results from the same statistical model as used in Column 1, but on a limited sample thatexcludes “clinical chemistry” devices, which, for technical reasons, could not be easily classified into durable versussingle-use products and were therefore excluded from the analysis in Columns 5 and 6.
27
6 Discussion and Conclusions
In this study, we describe the digital transformation of the medical device industry and consider
how new opportunities for digital product development have been pursued by both new entrants
and incumbents. In this setting, we observe all new product commercialization over a 15-year
period and document several trends in the digitization of medical technology and their implications
for the industry.
We first characterize the growth of digital products over time and across medical special-
ties, finding important differences. For example, by 2016, there were over twice as many digitized
product types and more than three times as many new digital product approvals for cardiovascu-
lar devices than for orthopedic devices. These descriptive findings are novel; to our knowledge,
no other studies have comprehensively characterized the digitization of products in this industry.
Further, we develop and validate a method for using supervised document classification to analyze
the contents of product descriptions. We use multiple methods to collect indicators of the use of
software in product descriptions of new medical devices and cross-validate our findings.
We then turn to unpacking the factors that predict which firms drive digital innovation in
this setting and find several pieces of evidence that point to significant incumbent advantages. We
observe a strong relationship in which both geographic digital product clusters and prior digital
product commercialization experience–above and beyond existing general clusters and overall new
product commercialization experience–predict digital innovation. Class-specific firm experience is
even more strongly associated with digital innovation, pointing to the importance of product area
experience when commercializing new digital devices.
The importance of firm experience is evocative of other studies of the medical device indus-
try, such as Chatterji (2009), that emphasize the importance of regulatory knowledge, marketing
knowledge, and understanding of market opportunities in the medical device industry. The results
are also similar to those seen in other settings, where the important role of “complementary know-
how” in a changing industry has been well documented (Helfat 1997). More broadly, our findings
are consistent with the evidence that acquired know-how has positive spillovers not only within
firms, but also across firms in a local labor market, as summarized by Azoulay and Lerner (2012).
28
Interestingly, within-firm experience and class-specific geographic expertise are mostly independent
of one another and have largely orthogonal impacts in these predictive models. This suggests that
being advantageously located can compensate to some extent for lack of within-firm know-how (and
vice versa).
We also consider how access to capital may support digital innovation and we find positive–
but comparatively small–effects of financial resources on predicting digital innovation. After con-
trolling for other factors, public firms are more likely to commercialize digital products, as are
those with VC funding, however we find that in order to have a comparable likelihood of com-
mercializing a digital device, a firm would need orders of magnitude more VC funding in order
to compensate for the benefits of being in a specialized product cluster. Considering differences
between novel versus follow-on innovations, we find that first-of-their-kind digital products appear
to be less reliant on within-firm experience than are follow-on innovations, for which there appear
to be stronger spillovers from medical-specialty-class–specific activities. Finally, we observe that,
in this setting, publicly listed firms are more likely to commercialize durable medical devices, which
are used over longer periods of time and are often hospital-based, relative to privately-held and/or
VC-funded firms, which are more likely to pursue single-use products. These findings support
stronger intertemporal spillovers from digital innovation among established firms.
Taken together, our results suggest that industry incumbents–by multiple definitions–are
driving digital innovation in the U.S. medical device industry. We observe within-firm and within-
cluster spillovers from past digital innovation into future digital innovation as well as a positive
role of large, publicly listed firms (which are, by definition, established players). Venture capital
funding does appear to play a small role in supporting digital innovation, but this role is dwarfed
by that by other factors. We conclude that in this industry setting, where the costs of entering new
product markets are high, digital innovation favors firms with an incumbent advantage.
An important caveat to this study is that we have characterized just one industry. Our
setting is advantageous because data on all new product commercialization can be observed and
databases are detailed and provide rich product detail. However, it is a setting in which entry
barriers shape the relatively high costs associated with entering new product markets. We therefore
29
expect that our findings are most likely to be relevant in other settings–whether regulated industries
or not–in which the cost of entering a new product market is non trivial and where supply-side
costs are therefore relevant predictors of new market entry behavior.
These findings have important managerial and policy implications. For firms considering
digital market entry, our results suggest that in settings with significant entry costs, incumbent
firms are likely to play a more significant role in digital product development than new entrants.
More specifically, firms with digital product experience are at an advantage relative to firms with
only general product experience. However, the geographic concentration of digital new product
development in specific product areas points to advantages for both new entrants and incumbent
firms located in these clusters. As noted above, these effects appear to be largely orthogonal: being
advantageously located can to some extent compensate for a lack of digital product experience,
and contrariwise. Thus, new entrants may strategically benefit from co-locating with early digital
leaders in their industry.
For policy-makers, our findings suggest the importance of prior experience when under-
taking digital product commercialization. To the extent that policy-makers want to support new
entrants, clear guidance on best practices for developing digital products may serve as a substi-
tute for prior experience. As regulators increasingly devote attention to clarifying expectations for
digital devices–for example, through the FDA’s new “digital health software pre-certification” pro-
gram,42 which allows a small group of technology leaders to commercialize new software products
more efficiently–it will be important to keep such considerations in mind.
References
Acharya, Viral and Zhaoxia Xu, “Financial dependence and innovation: The case of public
versus private firms,” Journal of Financial Economics, 2017, 124 (2), 223 – 243.
Adler-Milstein, Julia, Joseph Kvedar, and David W Bates, “Telehealth among US hospi-
tals: several factors, including state reimbursement and licensure policies, influence adoption,”
42https://www.fda.gov/MedicalDevices/DigitalHealth/DigitalHealthPreCertProgram/default.htm
30

Health Affairs, 2014, 33 (2), 207–215.
Agha, Leila, “The effects of health information technology on the costs and quality of medical
care,” Journal of Health Economics, 2014, 34, 19 – 30.
Arora, Ashish, Lee G Branstetter, and Matej Drev, “Going soft: How the rise of software-
based innovation led to the decline of Japan’s IT industry and the resurgence of Silicon Valley,”
Review of Economics and Statistics, 2013, 95 (3), 757–775.
Athey, Susan and Scott Stern, “The Impact of Information Technology on Emergency Health
Care Outcomes,” The RAND Journal of Economics, 2002, 33 (3), 399–432.
Azoulay, Pierre and Josh Lerner, “Technological Innovation and Organizations,” in Robert
Gibbons and John Roberts, eds., The Handbook of Organizational Economics, Princeton Univer-
sity Press, 2012.
Babiarz, Josephine C and Douglas J Pisano, “Overview of FDA and drug development,” in
“FDA Regulatory Affairs,” CRC Press, 2008, pp. 11–42.
Baker, Scott R, Nicholas Bloom, and Steven J Davis, “Measuring economic policy uncer-
tainty,” The Quarterly Journal of Economics, 2016, 131 (4), 1593–1636.
Bayus, Barry L and Rajshree Agarwal, “The role of pre-entry experience, entry timing, and
product technology strategies in explaining firm survival,” Management Science, 2007, 53 (12),
1887–1902.
Booth, Bruce L and Bijan Salehizadeh, “In defense of life sciences venture investing,” Nature
Biotechnology, 07 2011, 29, 579 EP –.
Branstetter, Lee G, Matej Drev, and Namho Kwon, “Get with the program: Software-
driven innovation in traditional manufacturing,” Management Science, 2018.
Brynjolfsson, Erik and Kristina McElheran, “The rapid adoption of data-driven decision-
making,” American Economic Review, 2016, 106 (5), 133–39.
Chatterji, Aaron K, “Spawned with a silver spoon? Entrepreneurial performance and innovation
in the medical device industry,” Strategic Management Journal, 2009, 30 (2), 185–206.
31

Cohen, Wesley M., “Chapter 4 - Fifty Years of Empirical Studies of Innovative Activity and
Performance,” in Bronwyn H. Hall and Nathan Rosenberg, eds., Handbook of The Economics
of Innovation, Vol. 1, Vol. 1 of Handbook of the Economics of Innovation, North-Holland, 2010,
pp. 129 – 213.
and Steven Klepper, “A Reprise of Size and R&D,” The Economic Journal, 1996, 106 (437),
925–951.
Delgado, Mercedes, Michael E Porter, and Scott Stern, “Clusters, convergence, and eco-
nomic performance,” Research Policy, 2014, 43 (10), 1785–1799.
Deming, David and Lisa B Kahn, “Skill requirements across firms and labor markets: Evidence
from job postings for professionals,” Journal of Labor Economics, 2018, 36 (S1), S337–S369.
Dorsey, E Ray and Eric J Topol, “State of Telehealth,” New England Journal of m=Medicine,
2016, 375 (2), 154–161.
Dranove, David, Chris Forman, Avi Goldfarb, and Shane Greenstein, “The trillion dol-
lar conundrum: Complementarities and health information technology,” American Economic
Journal: Economic Policy, 2014, 6 (4), 239–70.
Forman, Chris, Avi Goldfarb, and Shane Greenstein, “Agglomeration of Invention in the
Bay Area: Not Just ICT,” American Economic Review, May 2016, 106 (5), 146–51.
Gans, Joshua S and Scott Stern, “The product market and the market for “ideas”: commer-
cialization strategies for technology entrepreneurs,” Research Policy, 2003, 32 (2), 333–350.
Gentzkow, Matthew, Bryan T Kelly, and Matt Taddy, “Text as Data,” Working Paper
23276, National Bureau of Economic Research March 2017.
Goldfarb, Avi, Shane M Greenstein, and Catherine E Tucker, Economic analysis of the
digital economy, University of Chicago Press, 2015.
Greenstein, Shane, “Building and Delivering the Virtual World: Commercializing Services for
Internet Access,” The Journal of Industrial Economics, 2000, 48 (4), 391–411.
Guidance for and FDA Staff on the Content of Premarket Submissions for Management of Cy-
bersecurity in Medical Devices
32
Guidance for and FDA Staff on the Content of Premarket Submissions for Manage-
ment of Cybersecurity in Medical Devices, Technical Report, Food and Drug Administra-
tion: Center for Devices and Radiological Health 2014.
Guidance for Industry and FDA Staff on the Content of Premarket Submissions for Software
Contained in Medical Devices
Guidance for Industry and FDA Staff on the Content of Premarket Submissions for
Software Contained in Medical Devices, Technical Report, Food and Drug Administration:
Center for Devices and Radiological Health 2005.
Guidance for Industry and Food and Drug Administration Staff on Postmarket Management of
Cybersecurity in Medical Devices
Guidance for Industry and Food and Drug Administration Staff on Postmarket Man-
agement of Cybersecurity in Medical Devices, Technical Report, Food and Drug Adminis-
tration: Center for Devices and Radiological Health 2016.
Guidance for Industry: Cybersecurity for Networked Medical Devices Containing Off the-Shelf
(OTS) Software
Guidance for Industry: Cybersecurity for Networked Medical Devices Containing Off
the-Shelf (OTS) Software, Technical Report, Food and Drug Administration: Center for
Devices and Radiological Health 2005.
Guidance for Industry, FDA Reviewers and Compliance on Off-The-Shelf Software Use in Medical
Devices
Guidance for Industry, FDA Reviewers and Compliance on Off-The-Shelf Software
Use in Medical Devices, Technical Report, Food and Drug Administration: Center for Devices
and Radiological Health 1999.
Hall, Bronwyn H and Josh Lerner, “The financing of R&D and innovation,” in “Handbook
of the Economics of Innovation,” Vol. 1, Elsevier, 2010, pp. 609–639.
Hao, Kenneth Y. and Adam B. Jaffe, “Effect Of Liquidity On Firms’ R&D Spending,” Eco-
nomics of Innovation and New Technology, 1993, 2 (4), 275–282.
33
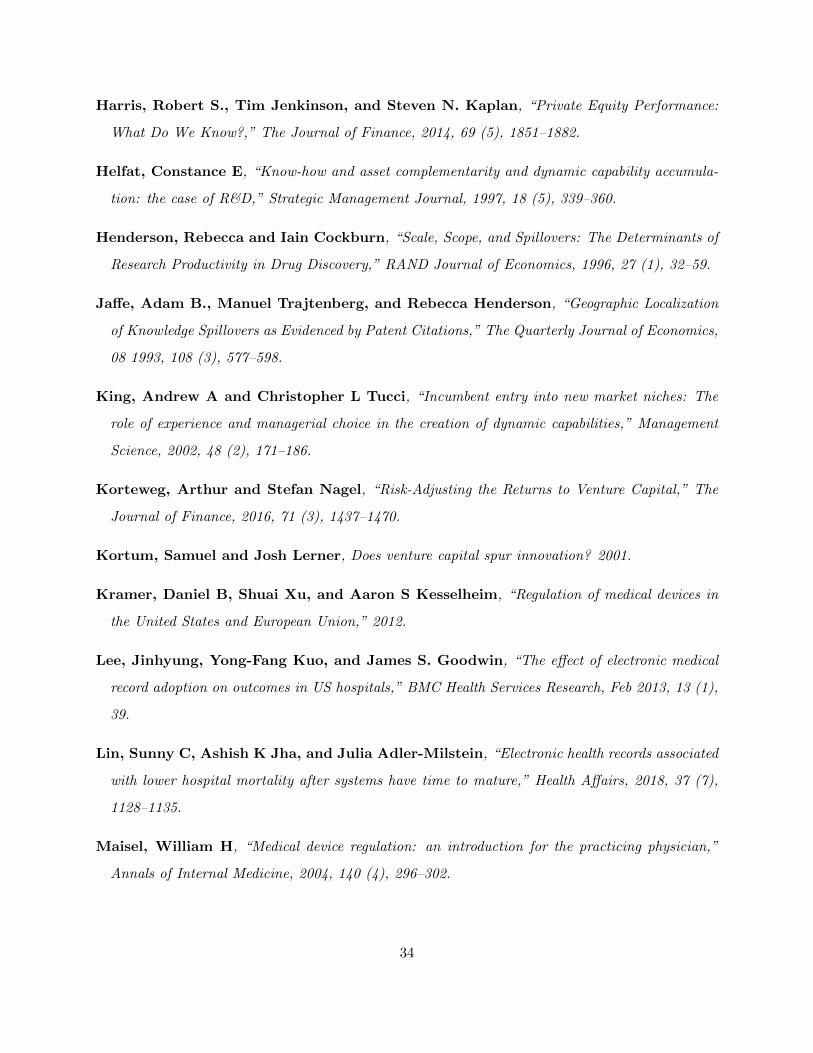
Harris, Robert S., Tim Jenkinson, and Steven N. Kaplan, “Private Equity Performance:
What Do We Know?,” The Journal of Finance, 2014, 69 (5), 1851–1882.
Helfat, Constance E, “Know-how and asset complementarity and dynamic capability accumula-
tion: the case of R&D,” Strategic Management Journal, 1997, 18 (5), 339–360.
Henderson, Rebecca and Iain Cockburn, “Scale, Scope, and Spillovers: The Determinants of
Research Productivity in Drug Discovery,” RAND Journal of Economics, 1996, 27 (1), 32–59.
Jaffe, Adam B., Manuel Trajtenberg, and Rebecca Henderson, “Geographic Localization
of Knowledge Spillovers as Evidenced by Patent Citations,” The Quarterly Journal of Economics,
08 1993, 108 (3), 577–598.
King, Andrew A and Christopher L Tucci, “Incumbent entry into new market niches: The
role of experience and managerial choice in the creation of dynamic capabilities,” Management
Science, 2002, 48 (2), 171–186.
Korteweg, Arthur and Stefan Nagel, “Risk-Adjusting the Returns to Venture Capital,” The
Journal of Finance, 2016, 71 (3), 1437–1470.
Kortum, Samuel and Josh Lerner, Does venture capital spur innovation? 2001.
Kramer, Daniel B, Shuai Xu, and Aaron S Kesselheim, “Regulation of medical devices in
the United States and European Union,” 2012.
Lee, Jinhyung, Yong-Fang Kuo, and James S. Goodwin, “The effect of electronic medical
record adoption on outcomes in US hospitals,” BMC Health Services Research, Feb 2013, 13 (1),
39.
Lin, Sunny C, Ashish K Jha, and Julia Adler-Milstein, “Electronic health records associated
with lower hospital mortality after systems have time to mature,” Health Affairs, 2018, 37 (7),
1128–1135.
Maisel, William H, “Medical device regulation: an introduction for the practicing physician,”
Annals of Internal Medicine, 2004, 140 (4), 296–302.
34
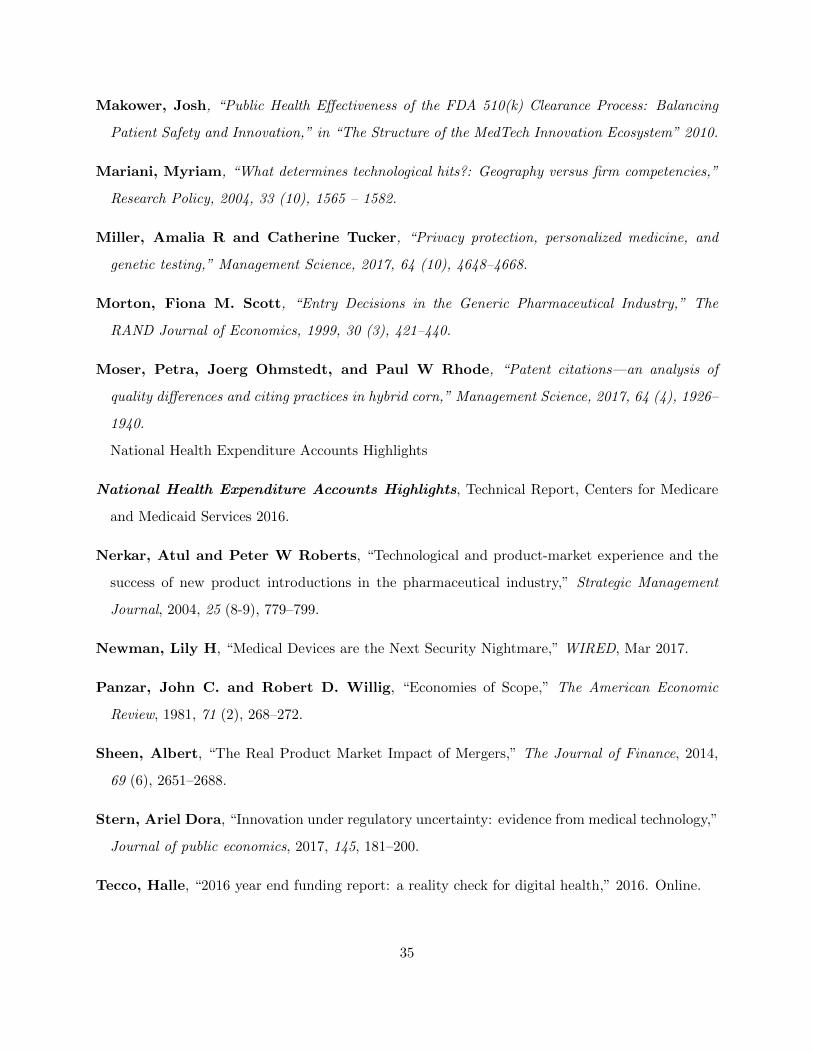
Makower, Josh, “Public Health Effectiveness of the FDA 510(k) Clearance Process: Balancing
Patient Safety and Innovation,” in “The Structure of the MedTech Innovation Ecosystem” 2010.
Mariani, Myriam, “What determines technological hits?: Geography versus firm competencies,”
Research Policy, 2004, 33 (10), 1565 – 1582.
Miller, Amalia R and Catherine Tucker, “Privacy protection, personalized medicine, and
genetic testing,” Management Science, 2017, 64 (10), 4648–4668.
Morton, Fiona M. Scott, “Entry Decisions in the Generic Pharmaceutical Industry,” The
RAND Journal of Economics, 1999, 30 (3), 421–440.
Moser, Petra, Joerg Ohmstedt, and Paul W Rhode, “Patent citations—an analysis of
quality differences and citing practices in hybrid corn,” Management Science, 2017, 64 (4), 1926–
1940.
National Health Expenditure Accounts Highlights
National Health Expenditure Accounts Highlights, Technical Report, Centers for Medicare
and Medicaid Services 2016.
Nerkar, Atul and Peter W Roberts, “Technological and product-market experience and the
success of new product introductions in the pharmaceutical industry,” Strategic Management
Journal, 2004, 25 (8-9), 779–799.
Newman, Lily H, “Medical Devices are the Next Security Nightmare,” WIRED, Mar 2017.
Panzar, John C. and Robert D. Willig, “Economies of Scope,” The American Economic
Review, 1981, 71 (2), 268–272.
Sheen, Albert, “The Real Product Market Impact of Mergers,” The Journal of Finance, 2014,
69 (6), 2651–2688.
Stern, Ariel Dora, “Innovation under regulatory uncertainty: evidence from medical technology,”
Journal of public economics, 2017, 145, 181–200.
Tecco, Halle, “2016 year end funding report: a reality check for digital health,” 2016. Online.
35

and Megan Zweig, “Digital Health Funding 2017 Midyear Review: A Record Breaking First
Half,” 2017. Online.
Teece, David J, “Towards an economic theory of the multiproduct firm,” Journal of Economic
Behavior & Organization, 1982, 3 (1), 39–63.
, “Profiting from technological innovation: Implications for integration, collaboration, licensing
and public policy,” Research policy, 1986, 15 (6), 285–305.
Wachter, Robert M. and Michael D. Howell, “Resolving the Productivity Paradox of Health
Information Technology: A Time for OptimismResolving the Productivity Paradox of Health
Information TechnologyResolving the Productivity Paradox of Health Information Technology,”
JAMA, 07 2018, 320 (1), 25–26.
Wizemann, Theresa et al., Public health effectiveness of the FDA 510 (k) clearance process:
balancing patient safety and innovation: workshop report, National Academies Press, 2010.
36
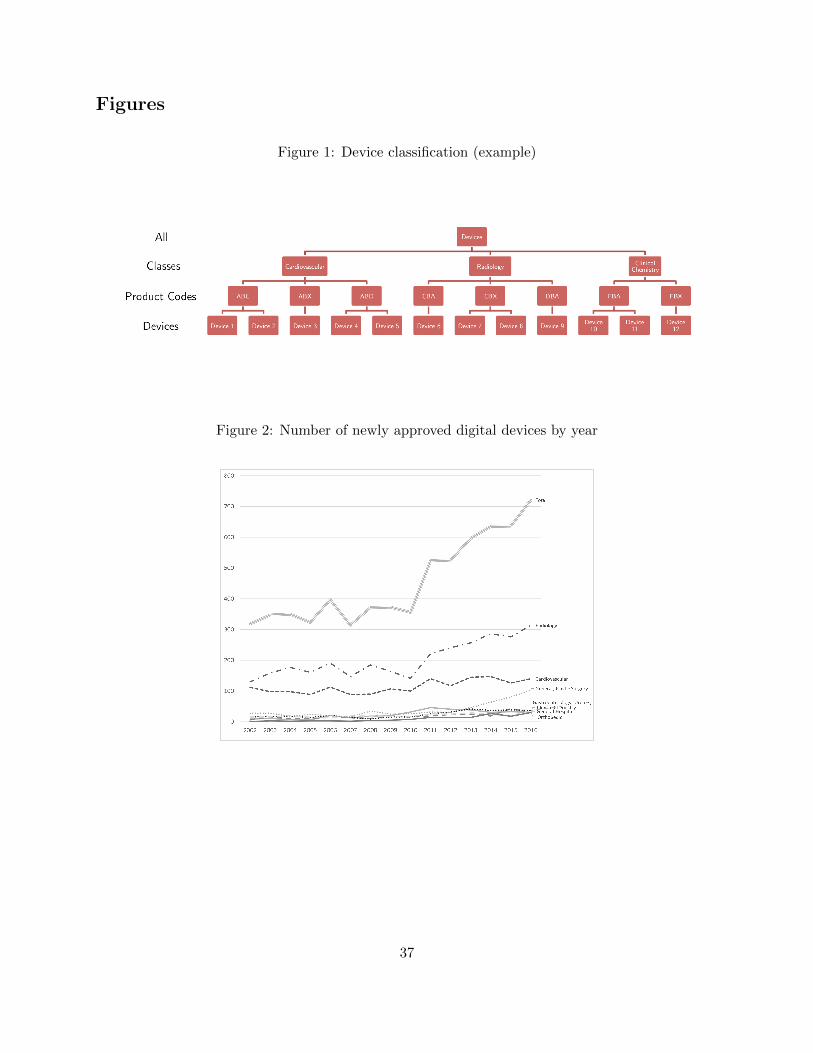
Figures
Figure 1: Device classification (example)
Figure 2: Number of newly approved digital devices by year
37
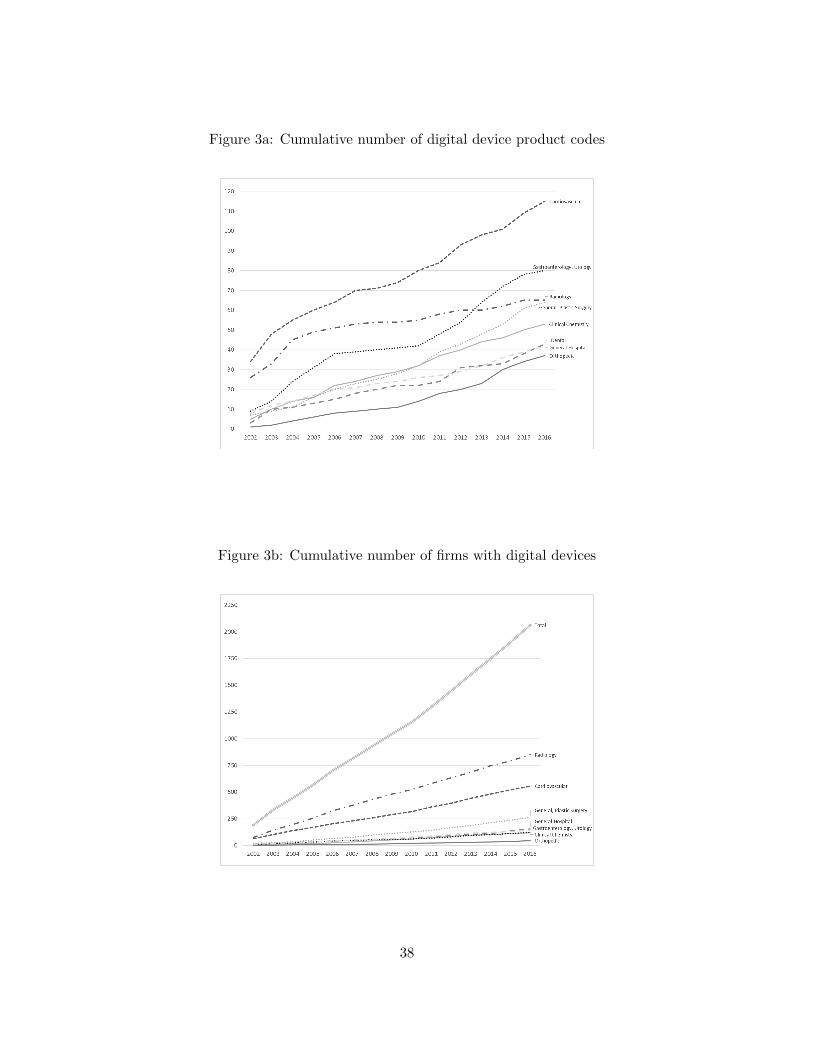
Figure 3a: Cumulative number of digital device product codes
Figure 3b: Cumulative number of firms with digital devices
38
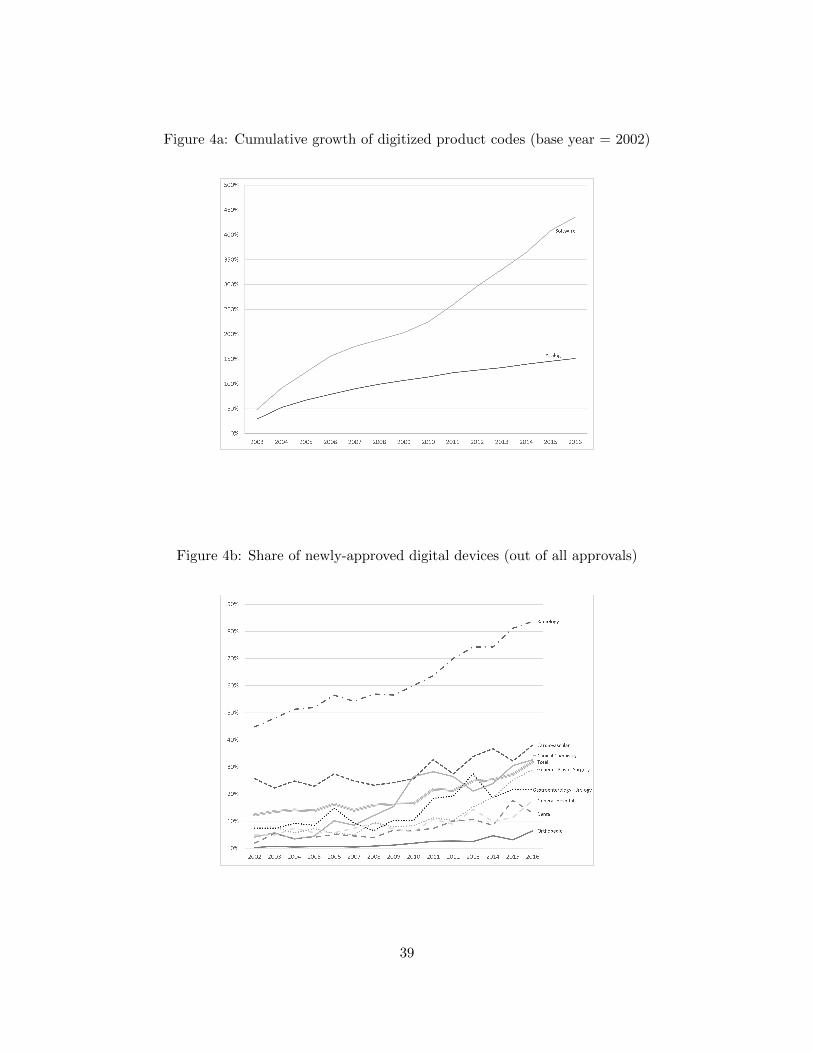
Figure 4a: Cumulative growth of digitized product codes (base year = 2002)
Figure 4b: Share of newly-approved digital devices (out of all approvals)
39
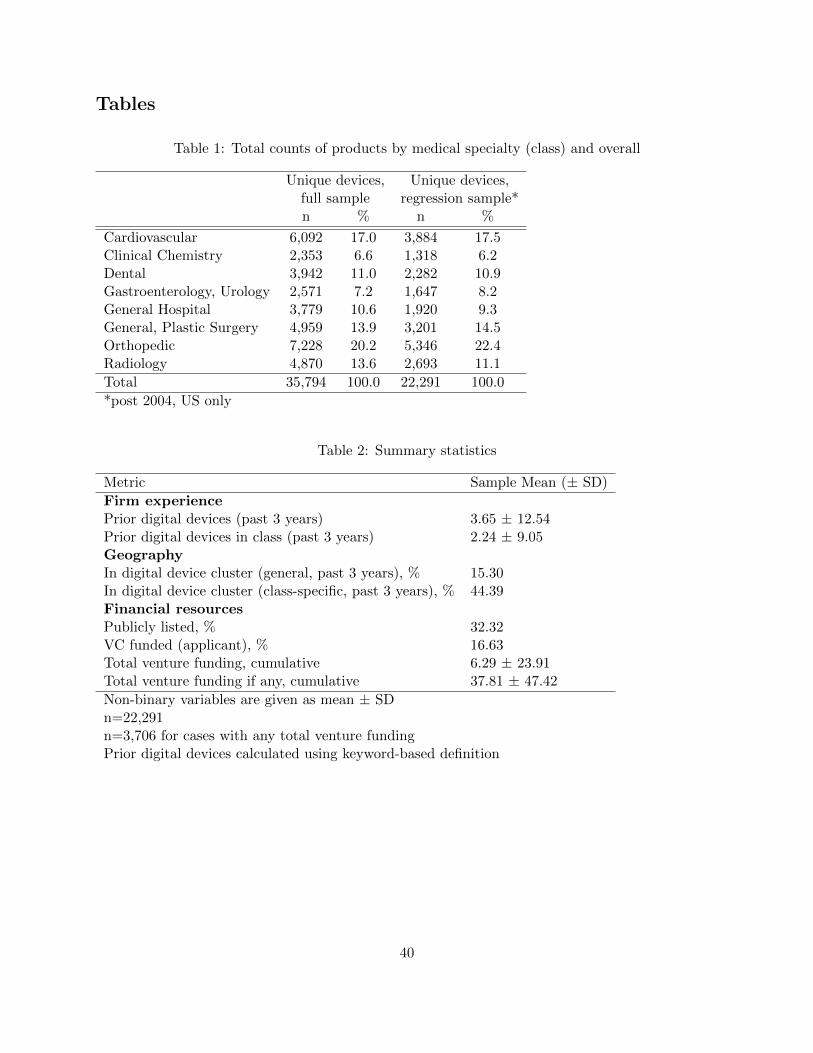
Tables
Table 1: Total counts of products by medical specialty (class) and overall
Unique devices, Unique devices,full sample regression sample*n % n %
Cardiovascular 6,092 17.0 3,884 17.5Clinical Chemistry 2,353 6.6 1,318 6.2Dental 3,942 11.0 2,282 10.9Gastroenterology, Urology 2,571 7.2 1,647 8.2General Hospital 3,779 10.6 1,920 9.3General, Plastic Surgery 4,959 13.9 3,201 14.5Orthopedic 7,228 20.2 5,346 22.4Radiology 4,870 13.6 2,693 11.1
Total 35,794 100.0 22,291 100.0
*post 2004, US only
Table 2: Summary statistics
Metric Sample Mean (± SD)
Firm experiencePrior digital devices (past 3 years) 3.65 ± 12.54Prior digital devices in class (past 3 years) 2.24 ± 9.05GeographyIn digital device cluster (general, past 3 years), % 15.30In digital device cluster (class-specific, past 3 years), % 44.39Financial resourcesPublicly listed, % 32.32VC funded (applicant), % 16.63Total venture funding, cumulative 6.29 ± 23.91Total venture funding if any, cumulative 37.81 ± 47.42
Non-binary variables are given as mean ± SDn=22,291n=3,706 for cases with any total venture fundingPrior digital devices calculated using keyword-based definition
40
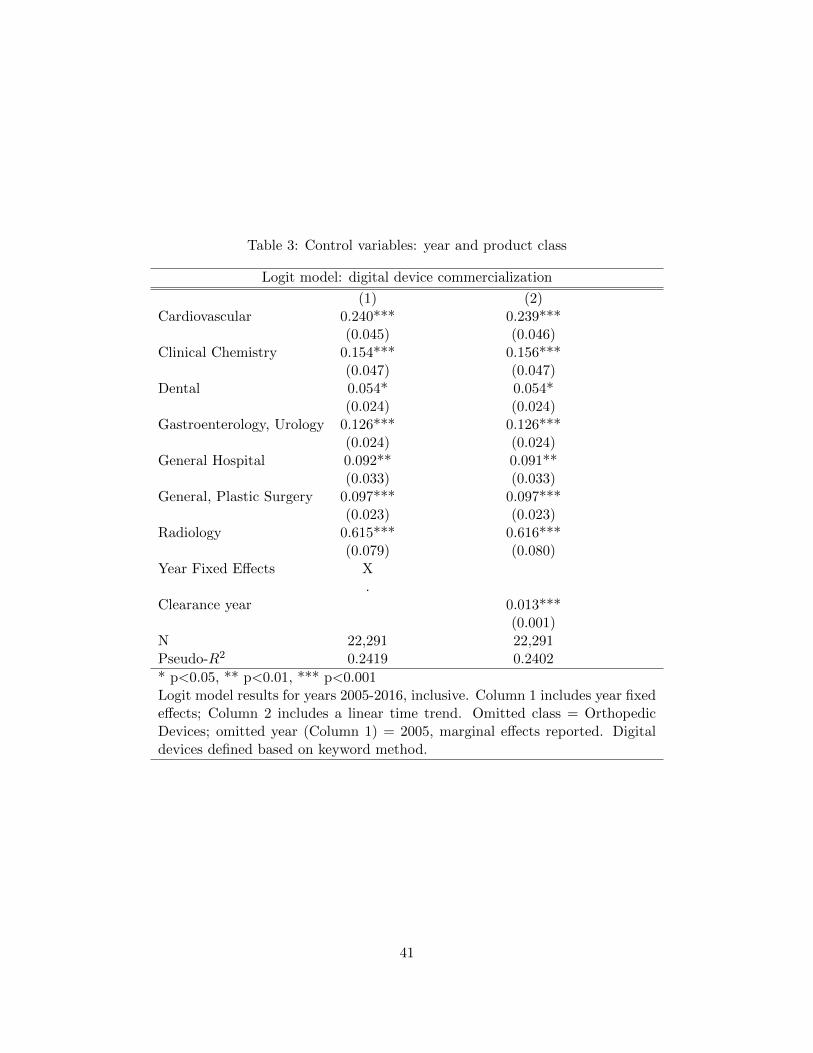
Table 3: Control variables: year and product class
Logit model: digital device commercialization
(1) (2)Cardiovascular 0.240*** 0.239***
(0.045) (0.046)Clinical Chemistry 0.154*** 0.156***
(0.047) (0.047)Dental 0.054* 0.054*
(0.024) (0.024)Gastroenterology, Urology 0.126*** 0.126***
(0.024) (0.024)General Hospital 0.092** 0.091**
(0.033) (0.033)General, Plastic Surgery 0.097*** 0.097***
(0.023) (0.023)Radiology 0.615*** 0.616***
(0.079) (0.080)Year Fixed Effects X
.Clearance year 0.013***
(0.001)N 22,291 22,291Pseudo-R2 0.2419 0.2402
* p<0.05, ** p<0.01, *** p<0.001Logit model results for years 2005-2016, inclusive. Column 1 includes year fixedeffects; Column 2 includes a linear time trend. Omitted class = OrthopedicDevices; omitted year (Column 1) = 2005, marginal effects reported. Digitaldevices defined based on keyword method.
41
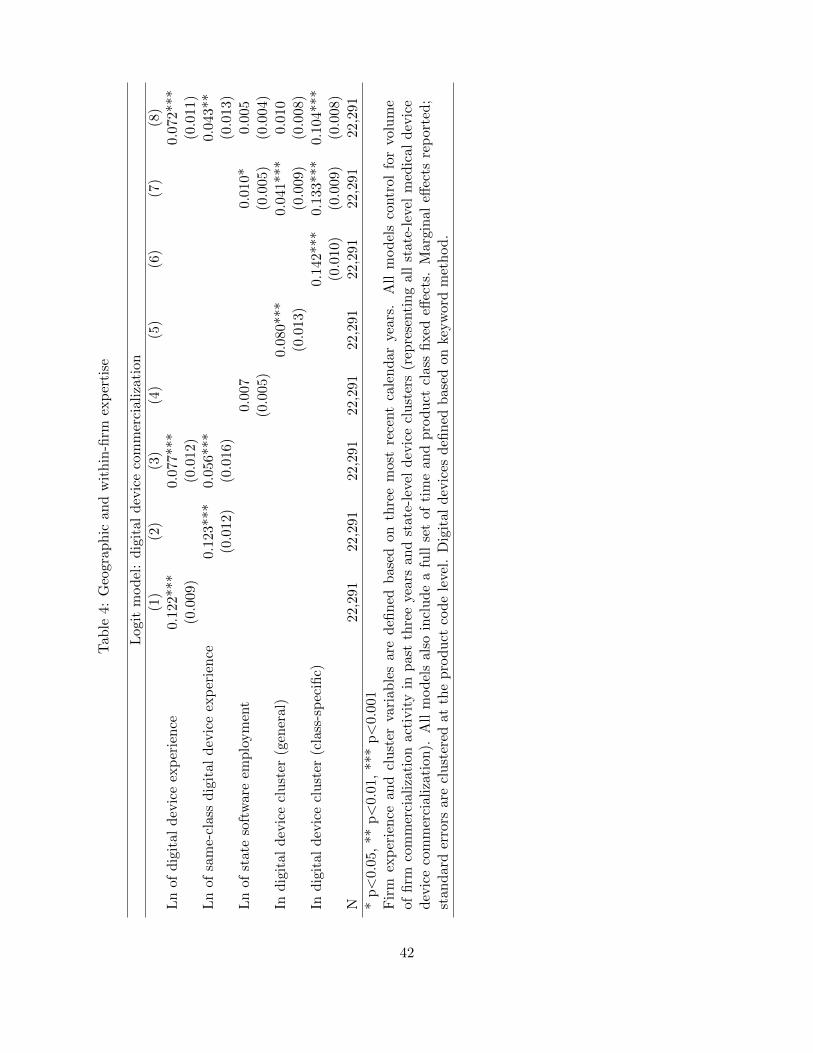
Tab
le4:
Geo
grap
hic
and
wit
hin
-firm
exp
erti
se
Log
itm
od
el:
dig
ital
dev
ice
com
mer
cial
izat
ion
(1)
(2)
(3)
(4)
(5)
(6)
(7)
(8)
Ln
ofd
igit
ald
evic
eex
per
ien
ce0.
122*
**0.
077*
**0.0
72***
(0.0
09)
(0.0
12)
(0.0
11)
Ln
ofsa
me-
clas
sd
igit
ald
evic
eex
per
ien
ce0.
123*
**0.
056*
**0.0
43**
(0.0
12)
(0.0
16)
(0.0
13)
Ln
ofst
ate
soft
war
eem
plo
ym
ent
0.00
70.0
10*
0.0
05
(0.0
05)
(0.0
05)
(0.0
04)
Ind
igit
ald
evic
ecl
ust
er(g
ener
al)
0.08
0***
0.0
41***
0.0
10
(0.0
13)
(0.0
09)
(0.0
08)
Ind
igit
ald
evic
ecl
ust
er(c
lass
-sp
ecifi
c)0.
142***
0.1
33***
0.1
04***
(0.0
10)
(0.0
09)
(0.0
08)
N22
,291
22,2
9122
,291
22,2
9122
,291
22,2
91
22,2
91
22,2
91
*p<
0.05
,**
p<
0.01
,**
*p<
0.00
1F
irm
exp
erie
nce
and
clu
ster
vari
able
sar
ed
efin
edb
ased
onth
ree
mos
tre
cent
cale
nd
arye
ars.
All
mod
els
contr
ol
for
volu
me
offi
rmco
mm
erci
aliz
atio
nac
tivit
yin
pas
tth
ree
year
san
dst
ate-
leve
ld
evic
ecl
ust
ers
(rep
rese
nti
ng
all
state
-lev
elm
edic
al
dev
ice
dev
ice
com
mer
cial
izat
ion
).A
llm
od
els
also
incl
ud
ea
full
set
ofti
me
and
pro
duct
clas
sfi
xed
effec
ts.
Marg
inal
effec
tsre
port
ed;
stan
dar
der
rors
are
clu
ster
edat
the
pro
duct
cod
ele
vel.
Dig
ital
dev
ices
defi
ned
bas
edon
keyw
ord
met
hod
.
42
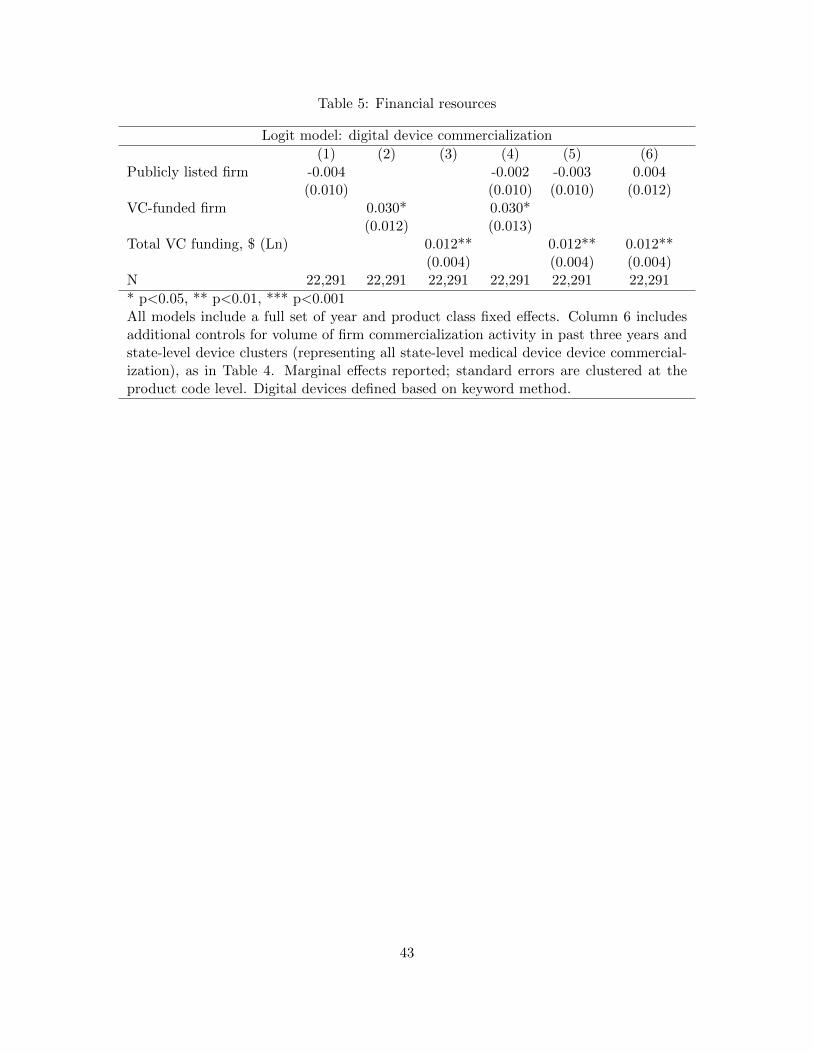
Table 5: Financial resources
Logit model: digital device commercialization
(1) (2) (3) (4) (5) (6)Publicly listed firm -0.004 -0.002 -0.003 0.004
(0.010) (0.010) (0.010) (0.012)VC-funded firm 0.030* 0.030*
(0.012) (0.013)Total VC funding, $ (Ln) 0.012** 0.012** 0.012**
(0.004) (0.004) (0.004)N 22,291 22,291 22,291 22,291 22,291 22,291
* p<0.05, ** p<0.01, *** p<0.001All models include a full set of year and product class fixed effects. Column 6 includesadditional controls for volume of firm commercialization activity in past three years andstate-level device clusters (representing all state-level medical device device commercial-ization), as in Table 4. Marginal effects reported; standard errors are clustered at theproduct code level. Digital devices defined based on keyword method.
43
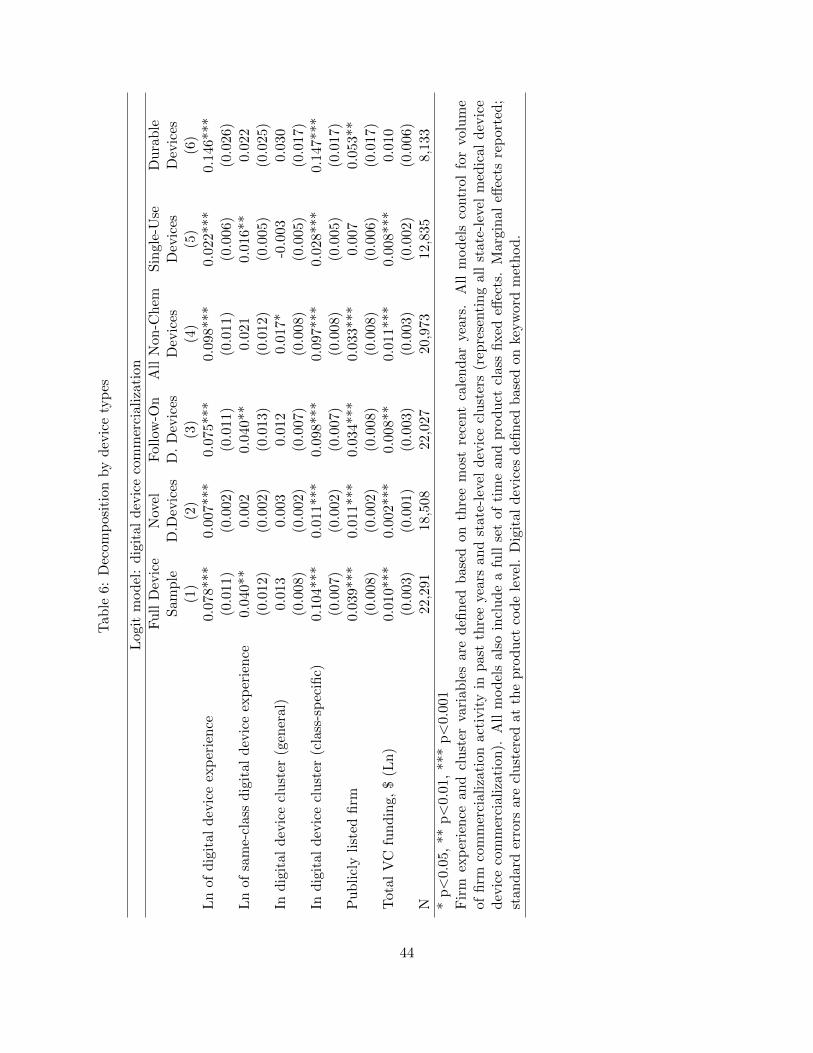
Tab
le6:
Dec
omp
osit
ion
by
dev
ice
typ
es
Log
itm
od
el:
dig
ital
dev
ice
com
mer
cial
izat
ion
Fu
llD
evic
eN
ovel
Fol
low
-On
All
Non
-Ch
emS
ingle
-Use
Du
rab
leS
amp
leD
.Dev
ices
D.
Dev
ices
Dev
ices
Dev
ices
Dev
ices
(1)
(2)
(3)
(4)
(5)
(6)
Ln
ofd
igit
ald
evic
eex
per
ien
ce0.
078*
**0.
007*
**0.
075*
**0.
098*
**0.0
22***
0.1
46***
(0.0
11)
(0.0
02)
(0.0
11)
(0.0
11)
(0.0
06)
(0.0
26)
Ln
ofsa
me-
clas
sd
igit
ald
evic
eex
per
ien
ce0.
040*
*0.
002
0.04
0**
0.02
10.0
16**
0.0
22
(0.0
12)
(0.0
02)
(0.0
13)
(0.0
12)
(0.0
05)
(0.0
25)
Ind
igit
ald
evic
ecl
ust
er(g
ener
al)
0.01
30.
003
0.01
20.
017*
-0.0
03
0.0
30
(0.0
08)
(0.0
02)
(0.0
07)
(0.0
08)
(0.0
05)
(0.0
17)
Ind
igit
ald
evic
ecl
ust
er(c
lass
-sp
ecifi
c)0.
104*
**0.
011*
**0.
098*
**0.
097*
**0.0
28***
0.1
47***
(0.0
07)
(0.0
02)
(0.0
07)
(0.0
08)
(0.0
05)
(0.0
17)
Pu
bli
cly
list
edfi
rm0.
039*
**0.
011*
**0.
034*
**0.
033*
**0.0
07
0.0
53**
(0.0
08)
(0.0
02)
(0.0
08)
(0.0
08)
(0.0
06)
(0.0
17)
Tot
alV
Cfu
nd
ing,
$(L
n)
0.01
0***
0.00
2***
0.00
8**
0.01
1***
0.0
08***
0.0
10
(0.0
03)
(0.0
01)
(0.0
03)
(0.0
03)
(0.0
02)
(0.0
06)
N22
,291
18,5
0822
,027
20,9
7312,8
35
8,1
33
*p<
0.05
,**
p<
0.01
,**
*p<
0.00
1F
irm
exp
erie
nce
and
clu
ster
vari
able
sar
ed
efin
edb
ased
onth
ree
mos
tre
cent
cale
nd
arye
ars.
All
mod
els
contr
ol
for
volu
me
offi
rmco
mm
erci
aliz
atio
nac
tivit
yin
pas
tth
ree
year
san
dst
ate-
leve
ld
evic
ecl
ust
ers
(rep
rese
nti
ng
all
state
-lev
elm
edic
al
dev
ice
dev
ice
com
mer
cial
izat
ion
).A
llm
od
els
also
incl
ud
ea
full
set
ofti
me
and
pro
duct
clas
sfi
xed
effec
ts.
Marg
inal
effec
tsre
port
ed;
stan
dar
der
rors
are
clu
ster
edat
the
pro
duct
cod
ele
vel.
Dig
ital
dev
ices
defi
ned
bas
edon
keyw
ord
met
hod
.
44

Appendix A: The 510(k) Process
Appendix Exhibit 1: Extract from 510(k) Statement
The information in this appendix is taken directly from the FDA’s official description of the510(k) (premarket notification) process (http://www.fda.gov/MedicalDevices/DeviceRegulation andGuid-ance/HowtoMarketYourDevice/PremarketSubmissions/PremarketNotification510k/)
45
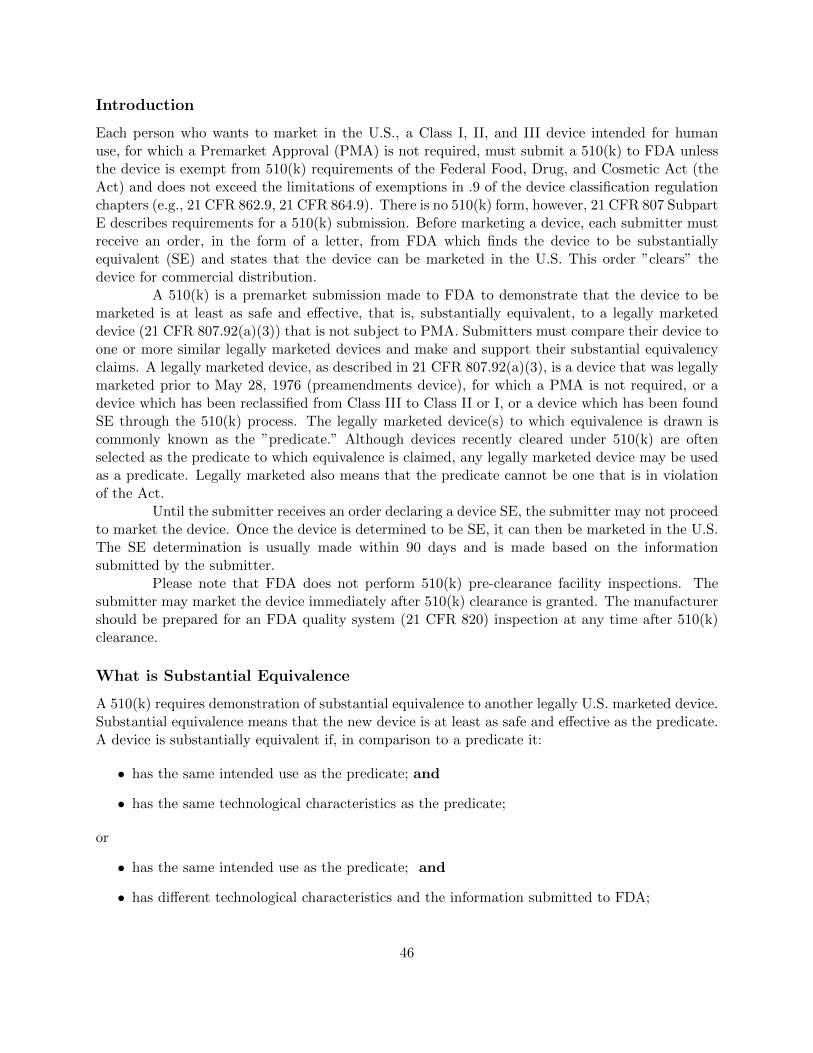
Introduction
Each person who wants to market in the U.S., a Class I, II, and III device intended for humanuse, for which a Premarket Approval (PMA) is not required, must submit a 510(k) to FDA unlessthe device is exempt from 510(k) requirements of the Federal Food, Drug, and Cosmetic Act (theAct) and does not exceed the limitations of exemptions in .9 of the device classification regulationchapters (e.g., 21 CFR 862.9, 21 CFR 864.9). There is no 510(k) form, however, 21 CFR 807 SubpartE describes requirements for a 510(k) submission. Before marketing a device, each submitter mustreceive an order, in the form of a letter, from FDA which finds the device to be substantiallyequivalent (SE) and states that the device can be marketed in the U.S. This order ”clears” thedevice for commercial distribution.
A 510(k) is a premarket submission made to FDA to demonstrate that the device to bemarketed is at least as safe and effective, that is, substantially equivalent, to a legally marketeddevice (21 CFR 807.92(a)(3)) that is not subject to PMA. Submitters must compare their device toone or more similar legally marketed devices and make and support their substantial equivalencyclaims. A legally marketed device, as described in 21 CFR 807.92(a)(3), is a device that was legallymarketed prior to May 28, 1976 (preamendments device), for which a PMA is not required, or adevice which has been reclassified from Class III to Class II or I, or a device which has been foundSE through the 510(k) process. The legally marketed device(s) to which equivalence is drawn iscommonly known as the ”predicate.” Although devices recently cleared under 510(k) are oftenselected as the predicate to which equivalence is claimed, any legally marketed device may be usedas a predicate. Legally marketed also means that the predicate cannot be one that is in violationof the Act.
Until the submitter receives an order declaring a device SE, the submitter may not proceedto market the device. Once the device is determined to be SE, it can then be marketed in the U.S.The SE determination is usually made within 90 days and is made based on the informationsubmitted by the submitter.
Please note that FDA does not perform 510(k) pre-clearance facility inspections. Thesubmitter may market the device immediately after 510(k) clearance is granted. The manufacturershould be prepared for an FDA quality system (21 CFR 820) inspection at any time after 510(k)clearance.
What is Substantial Equivalence
A 510(k) requires demonstration of substantial equivalence to another legally U.S. marketed device.Substantial equivalence means that the new device is at least as safe and effective as the predicate.A device is substantially equivalent if, in comparison to a predicate it:
• has the same intended use as the predicate; and
• has the same technological characteristics as the predicate;
or
• has the same intended use as the predicate; and
• has different technological characteristics and the information submitted to FDA;
46
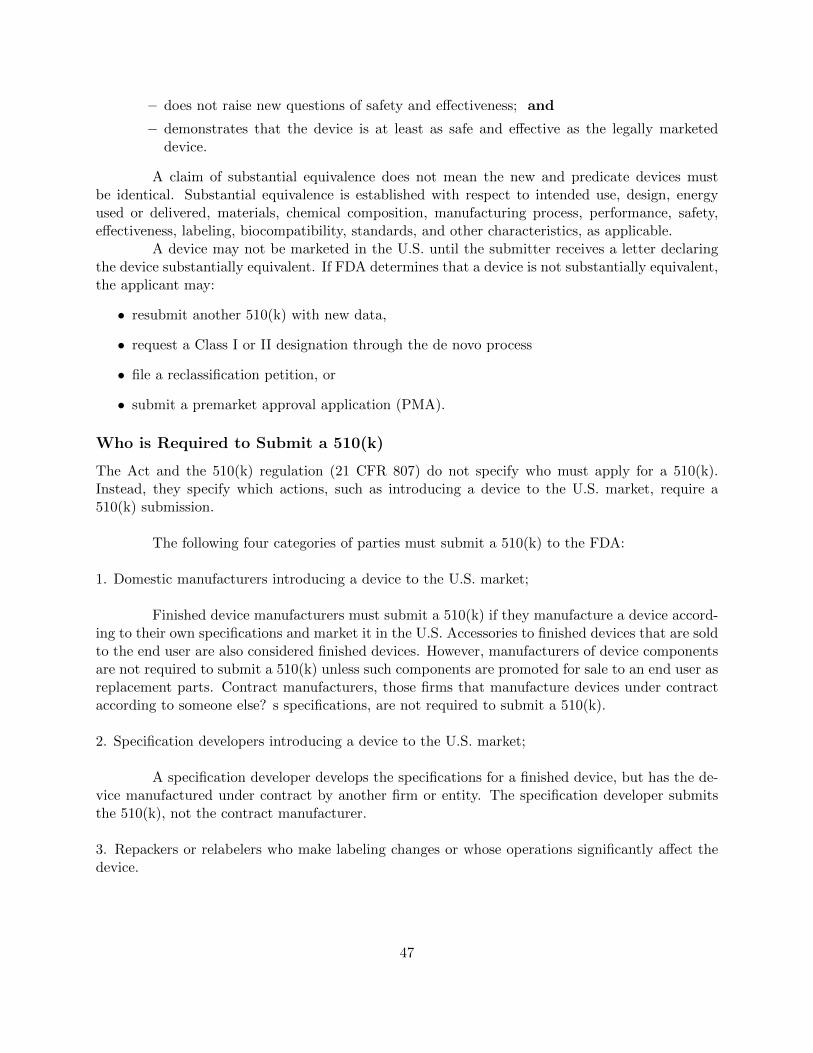
– does not raise new questions of safety and effectiveness; and
– demonstrates that the device is at least as safe and effective as the legally marketeddevice.
A claim of substantial equivalence does not mean the new and predicate devices mustbe identical. Substantial equivalence is established with respect to intended use, design, energyused or delivered, materials, chemical composition, manufacturing process, performance, safety,effectiveness, labeling, biocompatibility, standards, and other characteristics, as applicable.
A device may not be marketed in the U.S. until the submitter receives a letter declaringthe device substantially equivalent. If FDA determines that a device is not substantially equivalent,the applicant may:
• resubmit another 510(k) with new data,
• request a Class I or II designation through the de novo process
• file a reclassification petition, or
• submit a premarket approval application (PMA).
Who is Required to Submit a 510(k)
The Act and the 510(k) regulation (21 CFR 807) do not specify who must apply for a 510(k).Instead, they specify which actions, such as introducing a device to the U.S. market, require a510(k) submission.
The following four categories of parties must submit a 510(k) to the FDA:
1. Domestic manufacturers introducing a device to the U.S. market;
Finished device manufacturers must submit a 510(k) if they manufacture a device accord-ing to their own specifications and market it in the U.S. Accessories to finished devices that are soldto the end user are also considered finished devices. However, manufacturers of device componentsare not required to submit a 510(k) unless such components are promoted for sale to an end user asreplacement parts. Contract manufacturers, those firms that manufacture devices under contractaccording to someone else? s specifications, are not required to submit a 510(k).
2. Specification developers introducing a device to the U.S. market;
A specification developer develops the specifications for a finished device, but has the de-vice manufactured under contract by another firm or entity. The specification developer submitsthe 510(k), not the contract manufacturer.
3. Repackers or relabelers who make labeling changes or whose operations significantly affect thedevice.
47
Repackagers or relabelers may be required to submit a 510(k) if they significantly changethe labeling or otherwise affect any condition of the device. Significant labeling changes may in-clude modification of manuals, such as adding a new intended use, deleting or adding warnings,contraindications, etc. Operations, such as sterilization, could alter the condition of the device.However, most repackagers or relabelers are not required to submit a 510(k).
4. Foreign manufacturers/exporters or U.S. representatives of foreign manufacturers/exporters in-troducing a device to the U.S. market.
Please note that all manufacturers (including specification developers) of Class II and IIIdevices and select Class I devices are required to follow design controls (21 CFR 820.30) duringthe development of their device. The holder of a 510(k) must have design control documentationavailable for FDA review during a site inspection. In addition, any changes to the device specifica-tions or manufacturing processes must be made in accordance with the Quality System regulation(21 CFR 820) and may be subject to a new 510(k). Please see our guidance, “Deciding When toSubmit a 510(k) for a Change to an Existing Device.”
When a 510(k) is Required
A 510(k) is required when:
1. Introducing a device into commercial distribution (marketing) for the first time. AfterMay 28, 1976 (effective date of the Medical Device Amendments to the Act), anyone who wants tosell a device in the U.S. is required to make a 510(k) submission at least 90 days prior to offeringthe device for sale, even though it may have been under development or clinical investigation beforethat date. If your device was not marketed by your firm before May 28, 1976, a 510(k) is required.
2. You propose a different intended use for a device which you already have in commercialdistribution. The 510(k) regulation (21 CFR 807) specifically requires a 510(k) submission for amajor change or modification in intended use. Intended use is indicated by claims made for a devicein labeling or advertising. Most, if not all changes in intended use will require a 510(k). Pleasenote that prescription use to over the counter use is a major change in intended use and requiresthe submission of a new 510(k).
3. There is a change or modification of a legally marketed device and that change couldsignificantly affect its safety or effectiveness. The burden is on the 510(k) holder to decide whetheror not a modification could significantly affect safety or effectiveness of the device. Any modifica-tions must be made in accordance with the Quality System regulation, 21 CFR 820, and recordedin the device master record and change control records. It is recommended that the justificationfor submitting or not submitting a new 510(k) be recorded in the change control records.
A new 510(k) submission is required for changes or modifications to an existing device,where the modifications could significantly affect the safety or effectiveness of the device or thedevice is to be marketed for a new or different indication for use. See Is a new 510(k) required fora modification to the device? for additional information.
48
When a 510(k) is Not Required
The following are examples of when a 510(k) is not required.
1. You sell unfinished devices to another firm for further processing or sell components tobe used in the assembling of devices by other firms. However, if your components are to be solddirectly to end users as replacement parts, a 510(k) is required.
2. Your device is not being marketed or commercially distributed. You do not need a510(k) to develop, evaluate, or test a device. This includes clinical evaluation. Please note that ifyou perform clinical trials with your device, you are subject to the Investigational Device Exemp-tion (IDE) regulation (21 CFR 812).
3. You distribute another firm’s domestically manufactured device. You may place a labelon the device, ”Distributed by ABC Firm” or ”Manufactured for ABC Firm,” (21 CFR 801.1) andsell it to end users without submission of a 510(k).
4. In most cases, if you are a repackager or a relabeler you are not required to submit a510(k) if the existing labeling or condition of the device is not significantly changed. The labelingshould be consistent with the labeling submitted in the 510(k) with the same indications for useand warnings and contraindications.
5. Your device was legally in commercial distribution before May 28, 1976 and you havedocumentation to prove this. These devices are ”grandfathered” and have Preamendment Status.You do not have to submit a 510(k) unless the device has been significantly modified or there hasbeen a change in its intended use.
6. The device is made outside the U.S. and you are an importer of the foreign made med-ical device. A 510(k) is not required if a 510(k) has been submitted by the foreign manufacturerand received marketing clearance. Once the foreign manufacturer has received 510(k) clearance forthe device, the foreign manufacturer may export his device to any U.S. importer.
7. Your device is exempted from 510(k) by regulation (21 CFR 862-892). That is, certainClass I or II devices can be marketed for the first time without having to submit a 510(k). A list ofthe Class I and II exempted devices can be found on Medical Device Exemptions 510(k) and GMPRequirements. However, if the device exceeds the limitations of exemptions in .9 of the deviceclassification regulation chapters (e.g., 21 CFR 862.9, 21 CFR 864.9), such as the device has a newintended use or operates using a different fundamental scientific technology than a legally marketeddevice in that generic type of device, or the device is a reprocessed single-use device, then a 510(k)must be submitted to market the new device.
Preamendment Devices
The term ”preamendments device” refers to devices legally marketed in the U.S. by a firm beforeMay 28, 1976 and which have not been:
• significantly changed or modified since then; and
49
• for which a regulation requiring a PMA application has not been published by FDA.
Devices meeting the above criteria are referred to as ”grandfathered” devices and do notrequire a 510(k). The device must have the same intended use as that marketed before May 28,1976. If the device is labeled for a new intended use, then the device is considered a new deviceand a 510(k) must be submitted to FDA for marketing clearance.
Please note that you must be the owner of the device on the market before May 28, 1976,for the device to be grandfathered. If your device is similar to a grandfathered device and marketedafter May 28, 1976, then your device does NOT meet the requirements of being grandfathered andyou must submit a 510(k). In order for a firm to claim that it has a preamendments device, itmust demonstrate that its device was labeled, promoted, and distributed in interstate commercefor a specific intended use and that intended use has not changed. See Preamendment Status forinformation on documentation requirements.
Third Party Review Program
The Center for Devices and Radiological Health (CDRH) has implemented a Third Party ReviewProgram. This program provides an option to manufacturers of certain devices of submittingtheir 510(k) to private parties (Recognized Third Parties) identified by FDA for review instead ofsubmitting directly to CDRH. For more information on the program, eligible devices and a list ofRecognized Third Parties go to Third Party Review Program Information page.
50
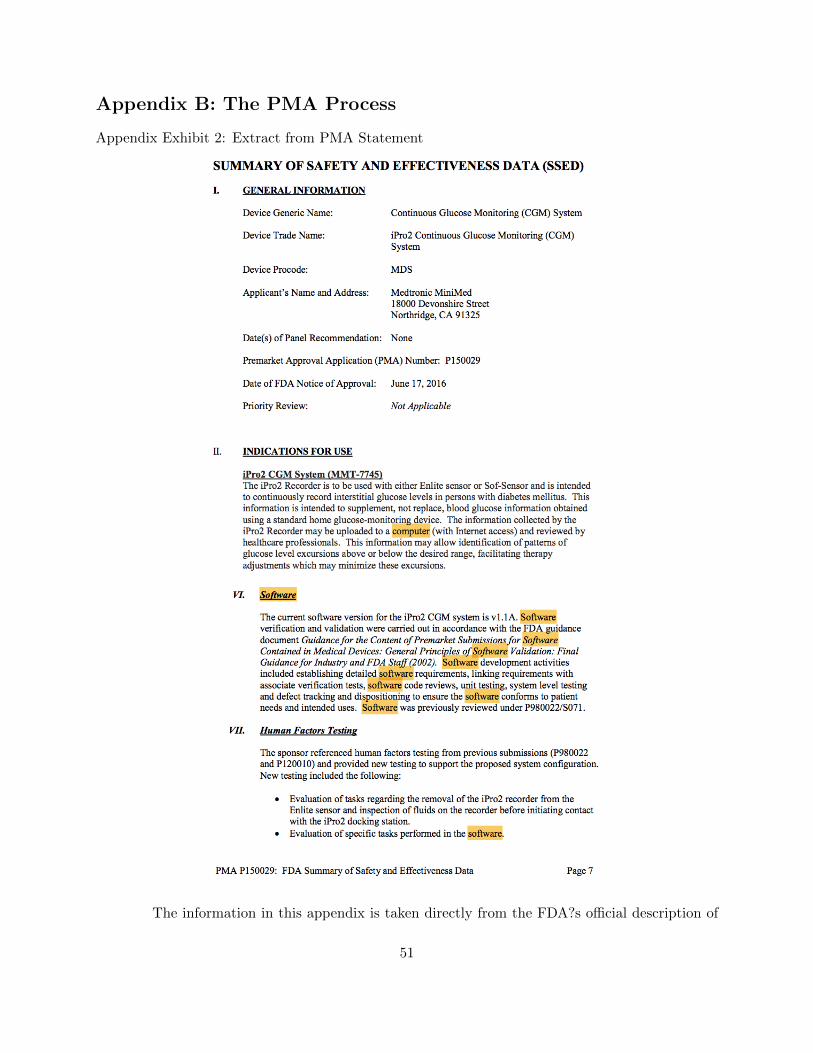
Appendix B: The PMA Process
Appendix Exhibit 2: Extract from PMA Statement
The information in this appendix is taken directly from the FDA?s official description of
51
the Premarket Approval process (http://www.fda.gov/MedicalDevices/DeviceRegulationandGuid-ance/HowtoMarketYourDevice/PremarketSubmissions/PremarketApprovalPMA/default.htm).
Overview
Premarket approval (PMA) is the FDA process of scientific and regulatory review to evaluate thesafety and effectiveness of Class III medical devices. Class III devices are those that support orsustain human life, are of substantial importance in preventing impairment of human health, orwhich present a potential, unreasonable risk of illness or injury. Due to the level of risk associatedwith Class III devices, FDA has determined that general and special controls alone are insufficient toassure the safety and effectiveness of class III devices. Therefore, these devices require a premarketapproval (PMA) application under section 515 of the FD&C Act in order to obtain marketingclearance. Please note that some Class III preamendment devices may require a Class III 510(k).See “Historical Background” for additional information.
PMA is the most stringent type of device marketing application required by FDA. Theapplicant must receive FDA approval of its PMA application prior to marketing the device. PMAapproval is based on a determination by FDA that the PMA contains sufficient valid scientificevidence to assure that the device is safe and effective for its intended use(s). An approved PMAis, in effect, a private license granting the applicant (or owner) permission to market the device.The PMA owner, however, can authorize use of its data by another.
The PMA applicant is usually the person who owns the rights, or otherwise has autho-rized access, to the data and other information to be submitted in support of FDA approval. Thisperson may be an individual, partnership, corporation, association, scientific or academic estab-lishment, government agency or organizational unit, or other legal entity. The applicant is oftenthe inventor/developer and ultimately the manufacturer.
FDA regulations provide 180 days to review the PMA and make a determination. Inreality, the review time is normally longer. Before approving or denying a PMA, the appropriateFDA advisory committee may review the PMA at a public meeting and provide FDA with thecommittee’s recommendation on whether FDA should approve the submission. After FDA notifiesthe applicant that the PMA has been approved or denied, a notice is published on the Internet(1) announcing the data on which the decision is based, and (2) providing interested persons anopportunity to petition FDA within 30 days for reconsideration of the decision.
The regulation governing premarket approval is located in Title 21 Code of Federal Regula-tions (CFR) Part 814, Premarket Approval. A class III device that fails to meet PMA requirementsis considered to be adulterated under section 501(f) of the FD&C Act and cannot be marketed.
When a PMA is Required
PMA requirements apply to Class III devices, the most stringent regulatory category for medi-cal devices. Device product classifications can be found by searching the Product ClassificationDatabase. The database search provides the name of the device, classification, and a link to theCode of Federal Regulations (CFR), if any. The CFR provides the device type name, identificationof the device, and classification information.
A regulation number for Class III devices marketed prior to the 1976 Medical DeviceAmendments is provided in the CFR. The CFR for these Class III devices that require a PMA
52
states that the device is Class III and will provide an effective date of the requirement for PMA. Ifthe regulation in the CFR states that “No effective date has been established of the requirementfor premarket approval,” a Class III 510(k) should be submitted.
Please note that PMA devices often involve new concepts and many are not of a typemarketed prior to the Medical Device Amendments. Therefore, they do not have a classificationregulation in the CFR. In this case, the product classification database will only cite the devicetype name and product code. If it is unclear whether the unclassified device requires a PMA,use the three letter product code to search the Premarket Approval (PMA) database and the510(k) Premarket Notification database. These databases can also be found by clicking on thehypertext links at the top of the product classification database web page. Enter only the threeletter product code in the product code box. If there are 510(k)?s cleared by FDA and the newdevice is substantially equivalent to any of these cleared devices, then the applicant should submit a510(k). Furthermore, a new type of device may not be found in the product classification database.If the device is a high risk device (supports or sustains human life, is of substantial importancein preventing impairment of human health, or presents a potential, unreasonable risk of illness orinjury) and has been found to be not substantially equivalent (NSE) to a Class I, II, or III [ClassIII requiring 510(k)] device, then the device must have an approved PMA before marketing in theU.S. Some devices that are found to be not substantially equivalent to a cleared Class I, II, orIII (not requiring PMA) device, may be eligible for the de novo process as a Class I or Class IIdevice. For additional information on the de novo process, see the guidance “New section 513(f)(2)- Evaluation of Automatic Class III Designation: Guidance for Industry and CDRH Staff” as wellas the Evaluation of Automatic Class III Designation (De Novo) Summaries webpage.
Devices Used in Blood Establishments
The Center for Biologic, Evaluation, Research (CBER) has expertise in blood, blood products, andcellular therapies as well as the integral association of certain medical devices with these biologicalproducts. To utilize this expertise marketing and investigational device submissions (PremarketNotification, Premarket Approval, and Investigational Device Exemption) for medical devices asso-ciated with the blood collection and processing procedures as well as those associated with cellulartherapies are reviewed by CBER. Although these products are reviewed by CBER, the medicaldevice laws and regulations still apply. The list of medical devices reviewed by CBER are availableon the Internet. In addition to CDRH guidance on Premarket Approval, specific medical deviceguidance for devices reviewed by CBER is available at online or by contacting:
Center for Biologics Evaluation and ResearchOffice of Communication, Training and Manufacturers Assistance (HFM-43)1401 Rockville Pike, Room 200NRockville, MD 20852-1448 U.S.A.Telephone Number: 301-827-2000 or 800-835-4709Fax Number: 301-827-3843
53
Data Requirements
A Premarket Approval (PMA) application is a scientific, regulatory documentation to FDA todemonstrate the safety and effectiveness of the class III device. There are administrative elementsof a PMA application, but good science and scientific writing is a key to the approval of PMAapplication. If a PMA application lacks elements listed in the administrative checklist, FDA willrefuse to file a PMA application and will not proceed with the in-depth review of scientific andclinical data. If a PMA application lacks valid clinical information and scientific analysis on soundscientific reasoning, it could impact FDA’s review and approval. PMA applications that are in-complete, inaccurate, inconsist, omit critical information, and poorly organized have resulted indelays in approval or denial of PMA applications. Manufacturers should perform a quality controlaudit of a PMA application before sending it to FDA to assure that it is scientifically sound andpresented in a well organized format.
Technical Sections: The technical sections containing data and information should allowFDA to determine whether to approve or disapprove the application. These sections are usuallydivided into non-clinical laboratory studies and clinical investigations.
Non-clinical Laboratory Studies Section: Non-clinical laboratory studies section in-cludes information on microbiology, toxicology, immunology, biocompatibility, stress, wear, shelflife, and other laboratory or animal tests. Non-clinical studies for safety evaluation must be con-ducted in compliance with 21 CFR Part 58 (Good Laboratory Practice for Nonclinical LaboratoryStudies). To assist you in determining the appropriate preclinical bench studies for your device,refer to the applicable guidance documents and standards identified in the Product Classificationdatabase for your device. You may also seek input from the review branch via the Pre-SubmissionProgram.
Clinical Investigations Section: Clinical investigations section includes study proto-cols, safety and effectiveness data, adverse reactions and complications, device failures and replace-ments, patient information, patient complaints, tabulations of data from all individual subjects,results of statistical analyses, and any other information from the clinical investigations. Anyinvestigation conducted under an Investigational Device Exemption (IDE) must be identified assuch.
Like other scientific reports, FDA has observed problems with study designs, study con-duct, data analyses, presentations, and conclusions. Investigators should always consult all ap-plicable FDA guidance documents, industry standards, and recommended practices. Numerousdevice-specific FDA guidance documents that describe data requirements are available. Study pro-tocols should include all applicable elements described in the device-specific guidance documents.
54
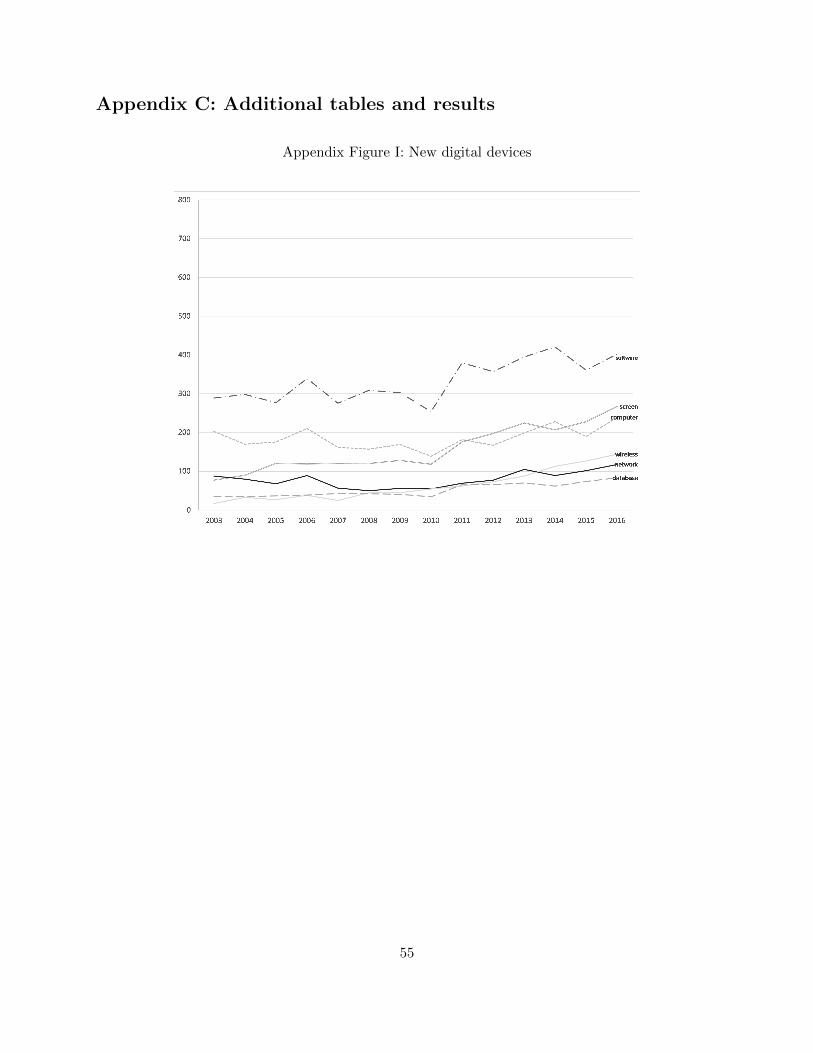
Appendix C: Additional tables and results
Appendix Figure I: New digital devices
55
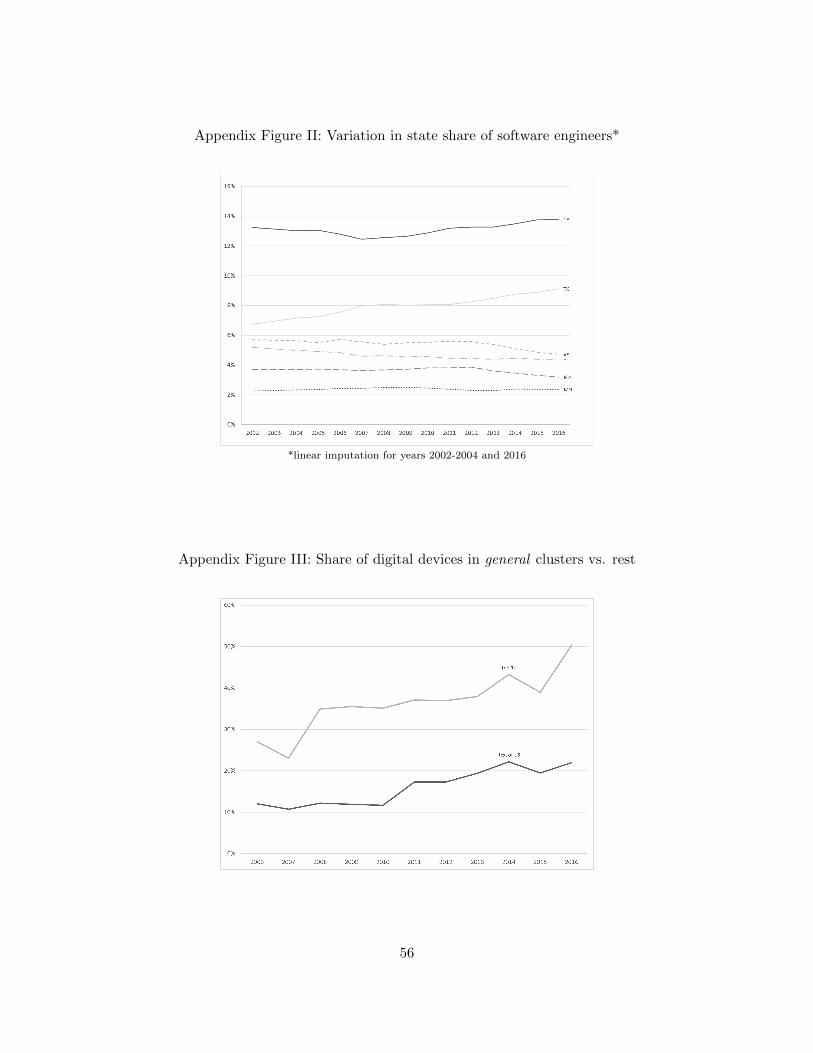
Appendix Figure II: Variation in state share of software engineers*
*linear imputation for years 2002-2004 and 2016
Appendix Figure III: Share of digital devices in general clusters vs. rest
56
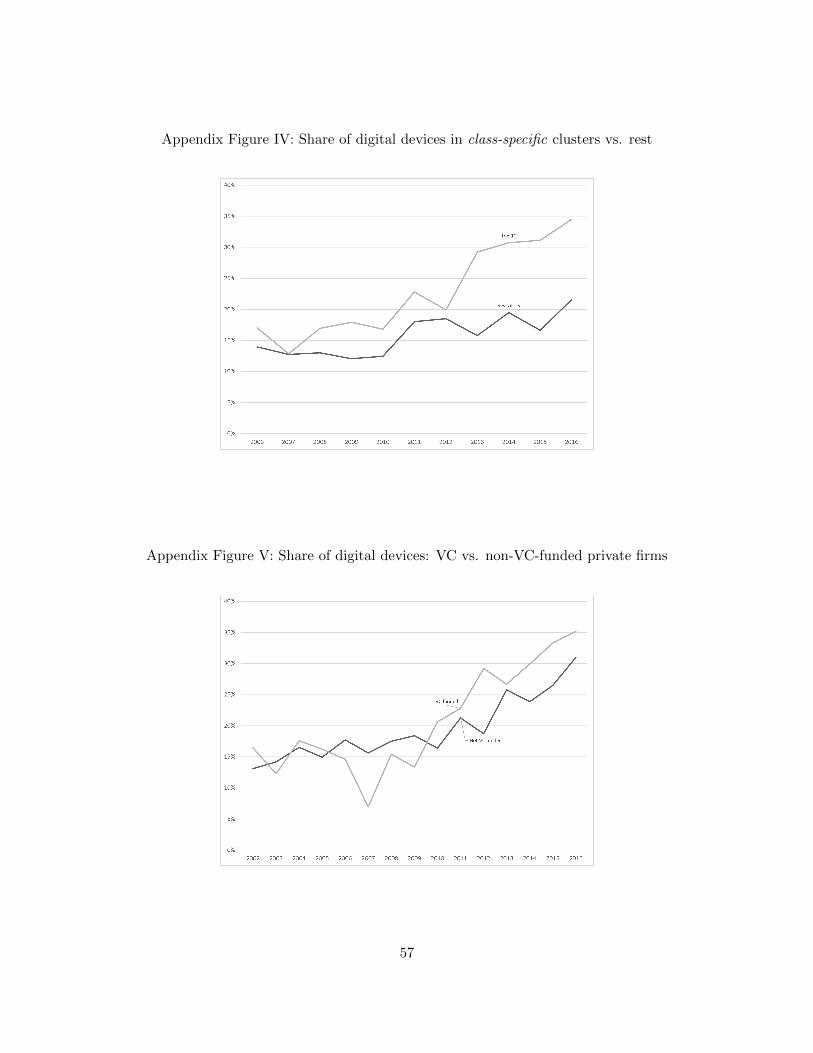
Appendix Figure IV: Share of digital devices in class-specific clusters vs. rest
Appendix Figure V: Share of digital devices: VC vs. non-VC-funded private firms
57
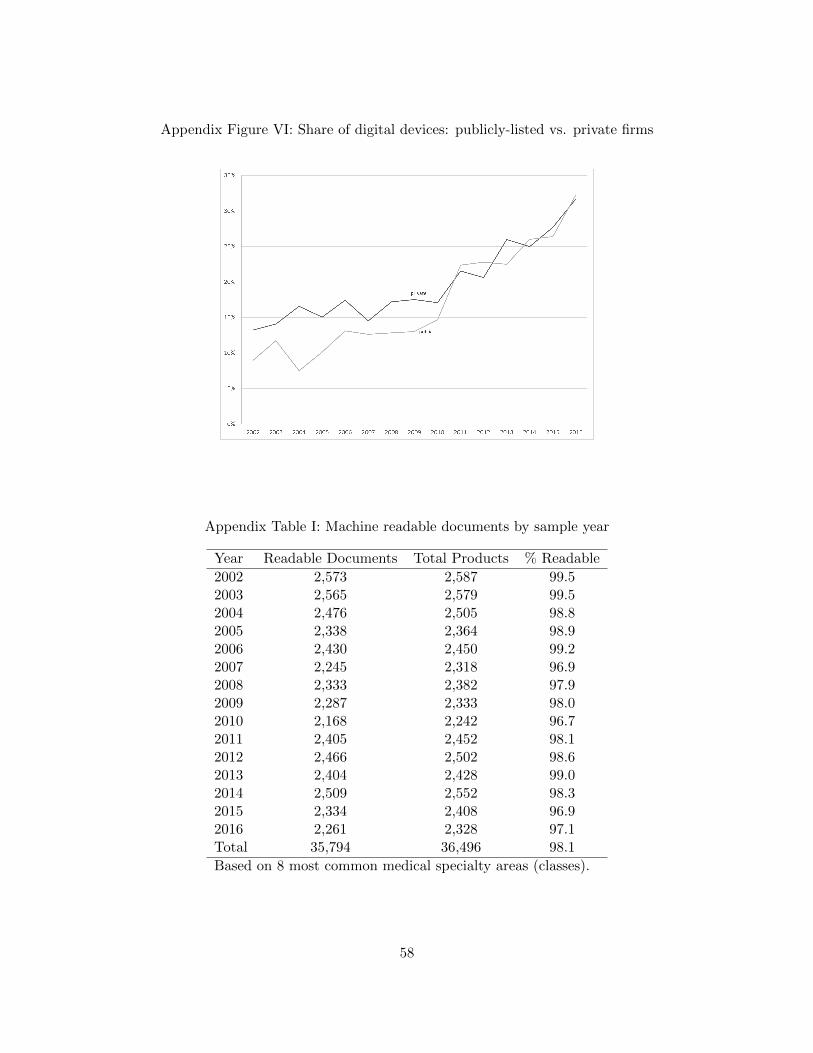
Appendix Figure VI: Share of digital devices: publicly-listed vs. private firms
Appendix Table I: Machine readable documents by sample year
Year Readable Documents Total Products % Readable
2002 2,573 2,587 99.52003 2,565 2,579 99.52004 2,476 2,505 98.82005 2,338 2,364 98.92006 2,430 2,450 99.22007 2,245 2,318 96.92008 2,333 2,382 97.92009 2,287 2,333 98.02010 2,168 2,242 96.72011 2,405 2,452 98.12012 2,466 2,502 98.62013 2,404 2,428 99.02014 2,509 2,552 98.32015 2,334 2,408 96.92016 2,261 2,328 97.1Total 35,794 36,496 98.1
Based on 8 most common medical specialty areas (classes).
58
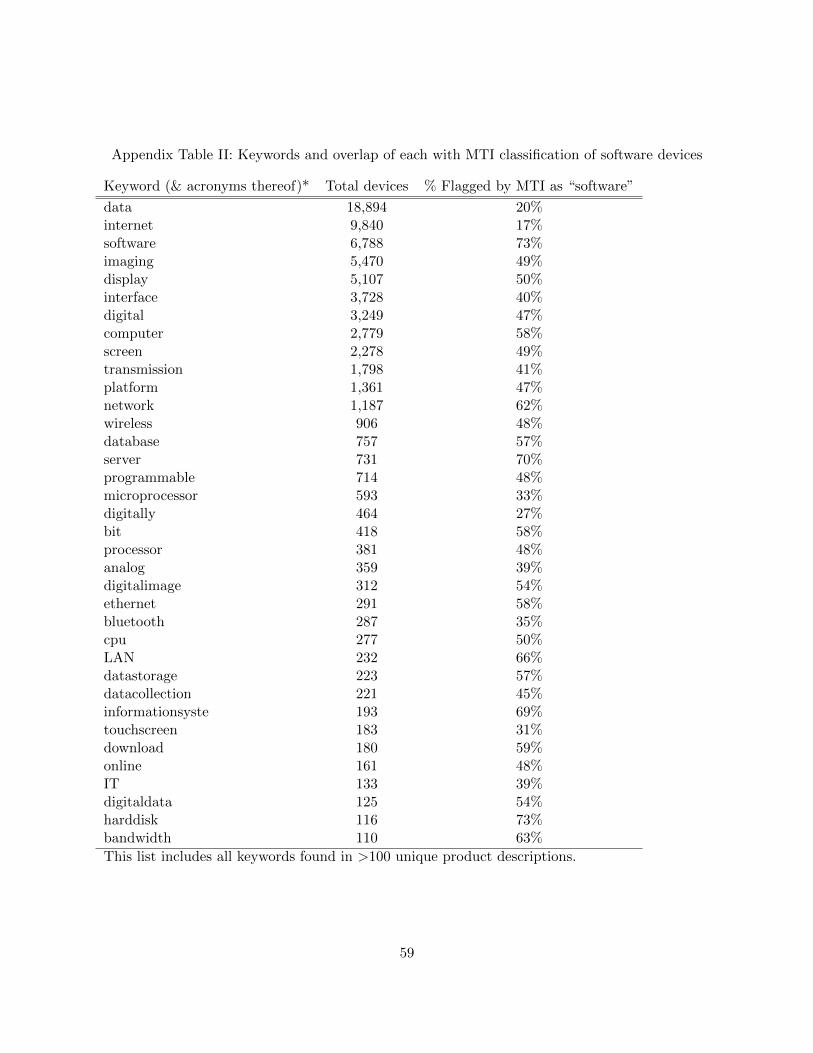
Appendix Table II: Keywords and overlap of each with MTI classification of software devices
Keyword (& acronyms thereof)* Total devices % Flagged by MTI as “software”
data 18,894 20%internet 9,840 17%software 6,788 73%imaging 5,470 49%display 5,107 50%interface 3,728 40%digital 3,249 47%computer 2,779 58%screen 2,278 49%transmission 1,798 41%platform 1,361 47%network 1,187 62%wireless 906 48%database 757 57%server 731 70%programmable 714 48%microprocessor 593 33%digitally 464 27%bit 418 58%processor 381 48%analog 359 39%digitalimage 312 54%ethernet 291 58%bluetooth 287 35%cpu 277 50%LAN 232 66%datastorage 223 57%datacollection 221 45%informationsyste 193 69%touchscreen 183 31%download 180 59%online 161 48%IT 133 39%digitaldata 125 54%harddisk 116 73%bandwidth 110 63%
This list includes all keywords found in >100 unique product descriptions.
59
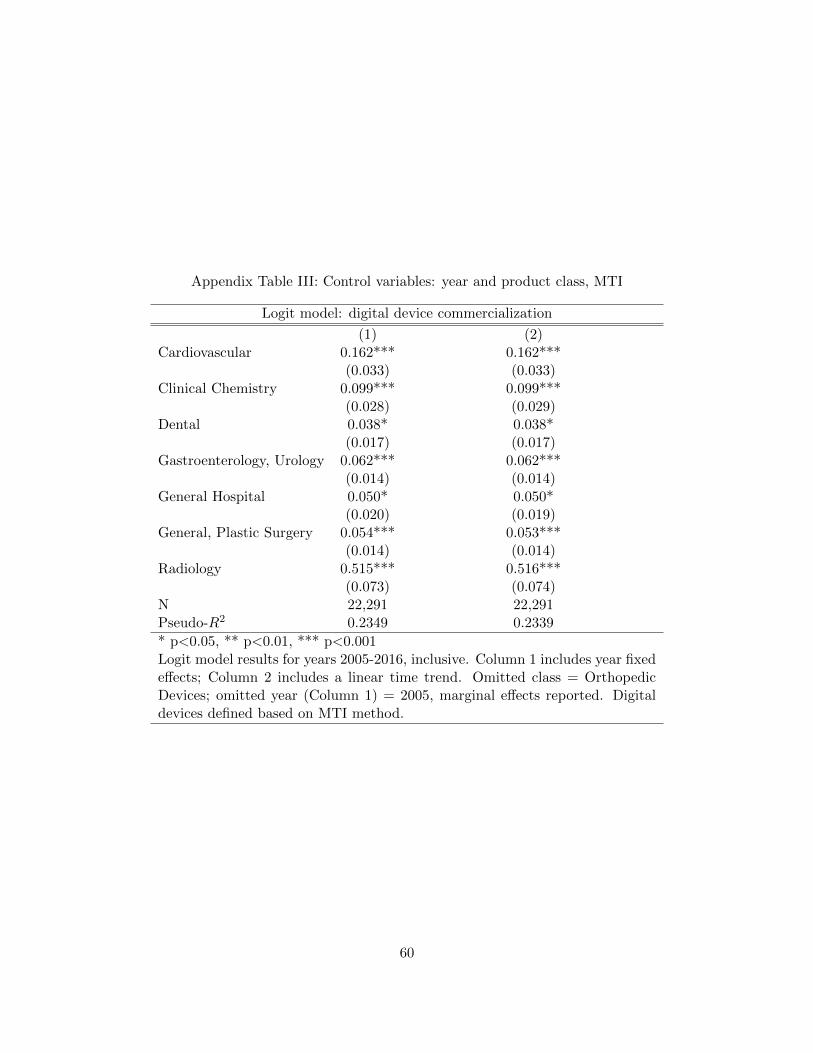
Appendix Table III: Control variables: year and product class, MTI
Logit model: digital device commercialization
(1) (2)Cardiovascular 0.162*** 0.162***
(0.033) (0.033)Clinical Chemistry 0.099*** 0.099***
(0.028) (0.029)Dental 0.038* 0.038*
(0.017) (0.017)Gastroenterology, Urology 0.062*** 0.062***
(0.014) (0.014)General Hospital 0.050* 0.050*
(0.020) (0.019)General, Plastic Surgery 0.054*** 0.053***
(0.014) (0.014)Radiology 0.515*** 0.516***
(0.073) (0.074)N 22,291 22,291Pseudo-R2 0.2349 0.2339
* p<0.05, ** p<0.01, *** p<0.001Logit model results for years 2005-2016, inclusive. Column 1 includes year fixedeffects; Column 2 includes a linear time trend. Omitted class = OrthopedicDevices; omitted year (Column 1) = 2005, marginal effects reported. Digitaldevices defined based on MTI method.
60
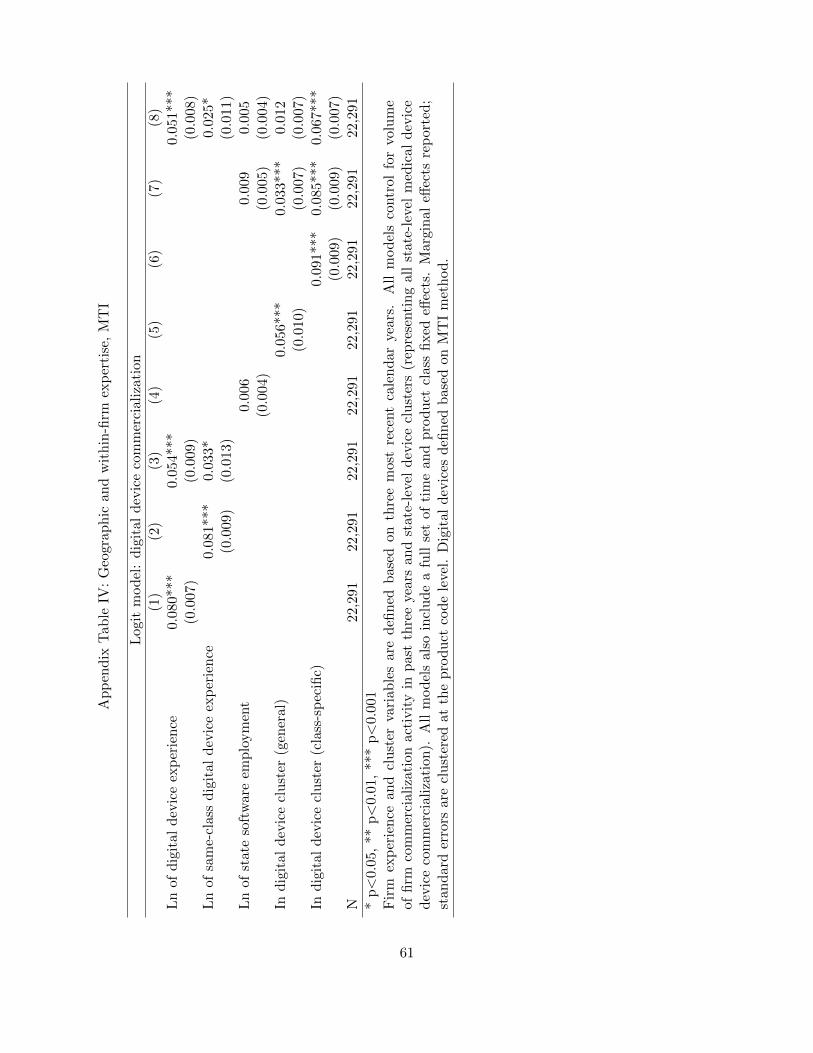
Ap
pen
dix
Tab
leIV
:G
eogr
aph
ican
dw
ith
in-fi
rmex
per
tise
,M
TI
Log
itm
od
el:
dig
ital
dev
ice
com
mer
cial
izat
ion
(1)
(2)
(3)
(4)
(5)
(6)
(7)
(8)
Ln
ofd
igit
ald
evic
eex
per
ien
ce0.
080*
**0.
054*
**0.0
51***
(0.0
07)
(0.0
09)
(0.0
08)
Ln
ofsa
me-
clas
sd
igit
ald
evic
eex
per
ien
ce0.
081*
**0.
033*
0.0
25*
(0.0
09)
(0.0
13)
(0.0
11)
Ln
ofst
ate
soft
war
eem
plo
ym
ent
0.00
60.0
09
0.0
05
(0.0
04)
(0.0
05)
(0.0
04)
Ind
igit
ald
evic
ecl
ust
er(g
ener
al)
0.05
6***
0.0
33***
0.0
12
(0.0
10)
(0.0
07)
(0.0
07)
Ind
igit
ald
evic
ecl
ust
er(c
lass
-sp
ecifi
c)0.
091***
0.0
85***
0.0
67***
(0.0
09)
(0.0
09)
(0.0
07)
N22
,291
22,2
9122
,291
22,2
9122
,291
22,2
91
22,2
91
22,2
91
*p<
0.05
,**
p<
0.01
,**
*p<
0.00
1F
irm
exp
erie
nce
and
clu
ster
vari
able
sar
ed
efin
edb
ased
onth
ree
mos
tre
cent
cale
nd
arye
ars.
All
mod
els
contr
ol
for
volu
me
offi
rmco
mm
erci
aliz
atio
nac
tivit
yin
pas
tth
ree
year
san
dst
ate-
leve
ld
evic
ecl
ust
ers
(rep
rese
nti
ng
all
state
-lev
elm
edic
al
dev
ice
dev
ice
com
mer
cial
izat
ion
).A
llm
od
els
also
incl
ud
ea
full
set
ofti
me
and
pro
duct
clas
sfi
xed
effec
ts.
Marg
inal
effec
tsre
port
ed;
stan
dar
der
rors
are
clu
ster
edat
the
pro
duct
cod
ele
vel.
Dig
ital
dev
ices
defi
ned
bas
edon
MT
Im
eth
od
.
61
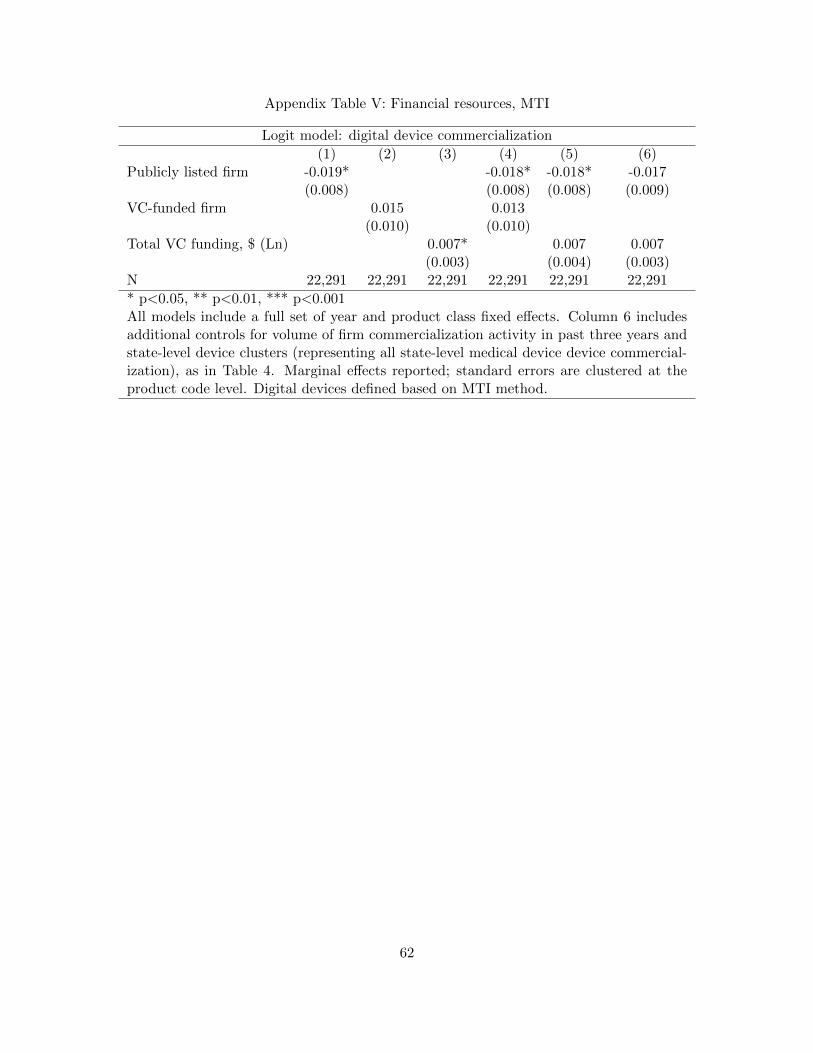
Appendix Table V: Financial resources, MTI
Logit model: digital device commercialization
(1) (2) (3) (4) (5) (6)Publicly listed firm -0.019* -0.018* -0.018* -0.017
(0.008) (0.008) (0.008) (0.009)VC-funded firm 0.015 0.013
(0.010) (0.010)Total VC funding, $ (Ln) 0.007* 0.007 0.007
(0.003) (0.004) (0.003)N 22,291 22,291 22,291 22,291 22,291 22,291
* p<0.05, ** p<0.01, *** p<0.001All models include a full set of year and product class fixed effects. Column 6 includesadditional controls for volume of firm commercialization activity in past three years andstate-level device clusters (representing all state-level medical device device commercial-ization), as in Table 4. Marginal effects reported; standard errors are clustered at theproduct code level. Digital devices defined based on MTI method.
62
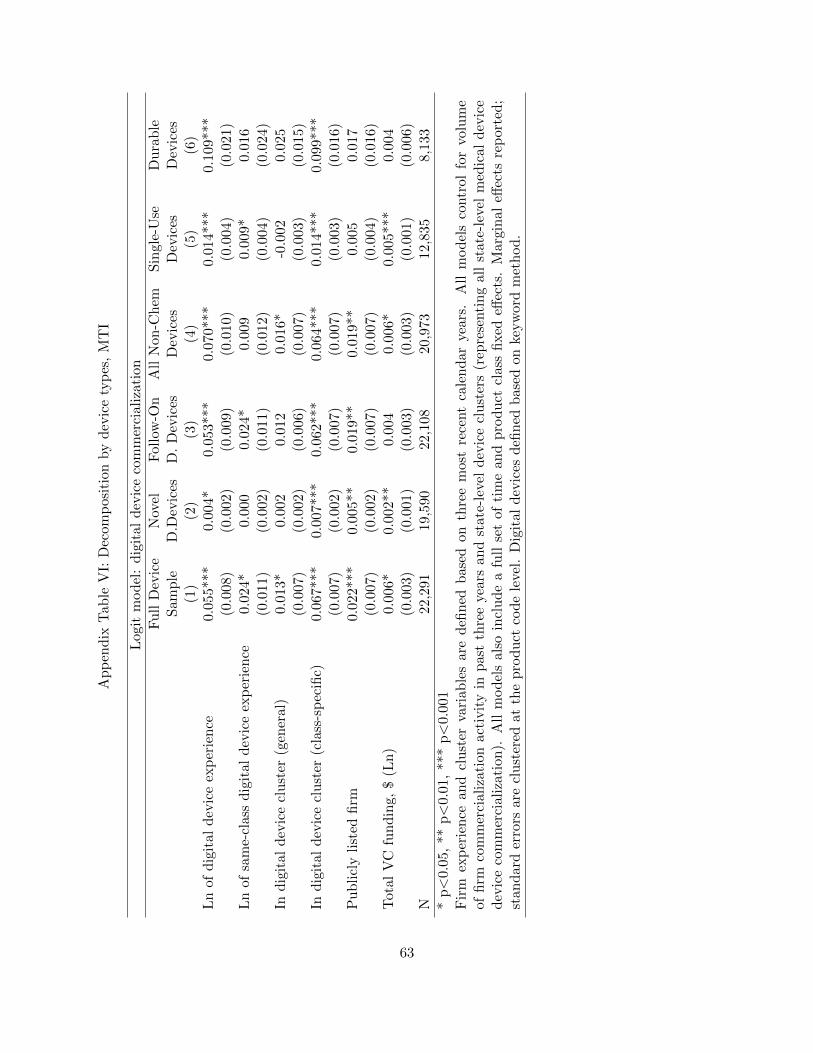
Ap
pen
dix
Tab
leV
I:D
ecom
pos
itio
nby
dev
ice
typ
es,
MT
I
Log
itm
od
el:
dig
ital
dev
ice
com
mer
cial
izat
ion
Fu
llD
evic
eN
ovel
Fol
low
-On
All
Non
-Ch
emS
ingle
-Use
Du
rab
leS
amp
leD
.Dev
ices
D.
Dev
ices
Dev
ices
Dev
ices
Dev
ices
(1)
(2)
(3)
(4)
(5)
(6)
Ln
ofd
igit
ald
evic
eex
per
ien
ce0.
055*
**0.
004*
0.05
3***
0.07
0***
0.0
14***
0.1
09***
(0.0
08)
(0.0
02)
(0.0
09)
(0.0
10)
(0.0
04)
(0.0
21)
Ln
ofsa
me-
clas
sd
igit
ald
evic
eex
per
ien
ce0.
024*
0.00
00.
024*
0.00
90.0
09*
0.0
16
(0.0
11)
(0.0
02)
(0.0
11)
(0.0
12)
(0.0
04)
(0.0
24)
Ind
igit
ald
evic
ecl
ust
er(g
ener
al)
0.01
3*0.
002
0.01
20.
016*
-0.0
02
0.0
25
(0.0
07)
(0.0
02)
(0.0
06)
(0.0
07)
(0.0
03)
(0.0
15)
Ind
igit
ald
evic
ecl
ust
er(c
lass
-sp
ecifi
c)0.
067*
**0.
007*
**0.
062*
**0.
064*
**0.0
14***
0.0
99***
(0.0
07)
(0.0
02)
(0.0
07)
(0.0
07)
(0.0
03)
(0.0
16)
Pu
bli
cly
list
edfi
rm0.
022*
**0.
005*
*0.
019*
*0.
019*
*0.0
05
0.0
17
(0.0
07)
(0.0
02)
(0.0
07)
(0.0
07)
(0.0
04)
(0.0
16)
Tot
alV
Cfu
nd
ing,
$(L
n)
0.00
6*0.
002*
*0.
004
0.00
6*0.0
05***
0.0
04
(0.0
03)
(0.0
01)
(0.0
03)
(0.0
03)
(0.0
01)
(0.0
06)
N22
,291
19,5
9022
,108
20,9
7312,8
35
8,1
33
*p<
0.05
,**
p<
0.01
,**
*p<
0.00
1F
irm
exp
erie
nce
and
clu
ster
vari
able
sar
ed
efin
edb
ased
onth
ree
mos
tre
cent
cale
nd
arye
ars.
All
mod
els
contr
ol
for
volu
me
offi
rmco
mm
erci
aliz
atio
nac
tivit
yin
pas
tth
ree
year
san
dst
ate-
leve
ld
evic
ecl
ust
ers
(rep
rese
nti
ng
all
state
-lev
elm
edic
al
dev
ice
dev
ice
com
mer
cial
izat
ion
).A
llm
od
els
also
incl
ud
ea
full
set
ofti
me
and
pro
duct
clas
sfi
xed
effec
ts.
Marg
inal
effec
tsre
port
ed;
stan
dar
der
rors
are
clu
ster
edat
the
pro
duct
cod
ele
vel.
Dig
ital
dev
ices
defi
ned
bas
edon
keyw
ord
met
hod
.
63


