48
carl de mare consult Why both Hydrogen and Carbon are Key for Carbon Neutral Steelmaking Key Note 2nd ESTEP Brokerage Event Carl De Maré November 17, 2021
carl de mare consult
Why both Hydrogen and Carbon are Key for Carbon Neutral Steelmaking
Key Note 2nd ESTEP Brokerage Event
Carl De Maré
November 17, 2021

carl de mare consult
Evolution of Annual CO2 emissions
CO2 emissions form fossil fuels and cement productionSource : Our World in Data
carl de mare consult
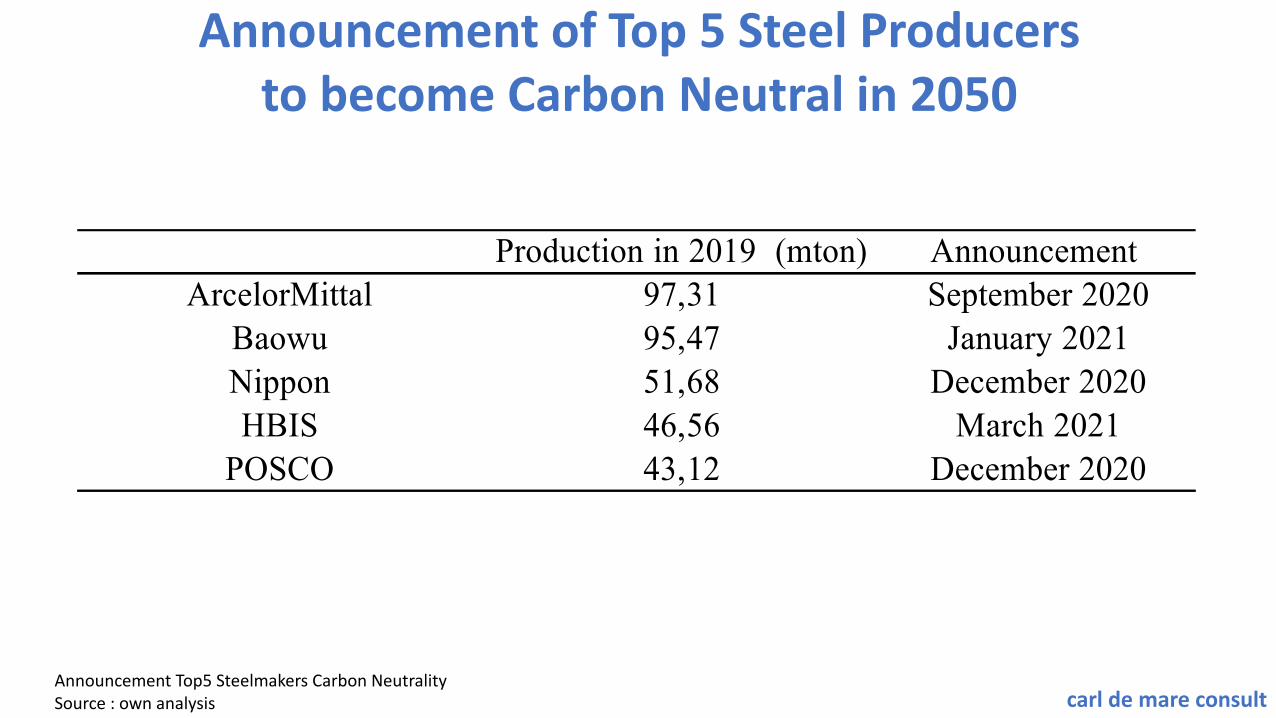
Announcement of Top 5 Steel Producers to become Carbon Neutral in 2050
Production in 2019 (mton) Announcement ArcelorMittal 97,31 September 2020
Baowu 95,47 January 2021Nippon 51,68 December 2020HBIS 46,56 March 2021
POSCO 43,12 December 2020
Announcement Top5 Steelmakers Carbon NeutralitySource : own analysis
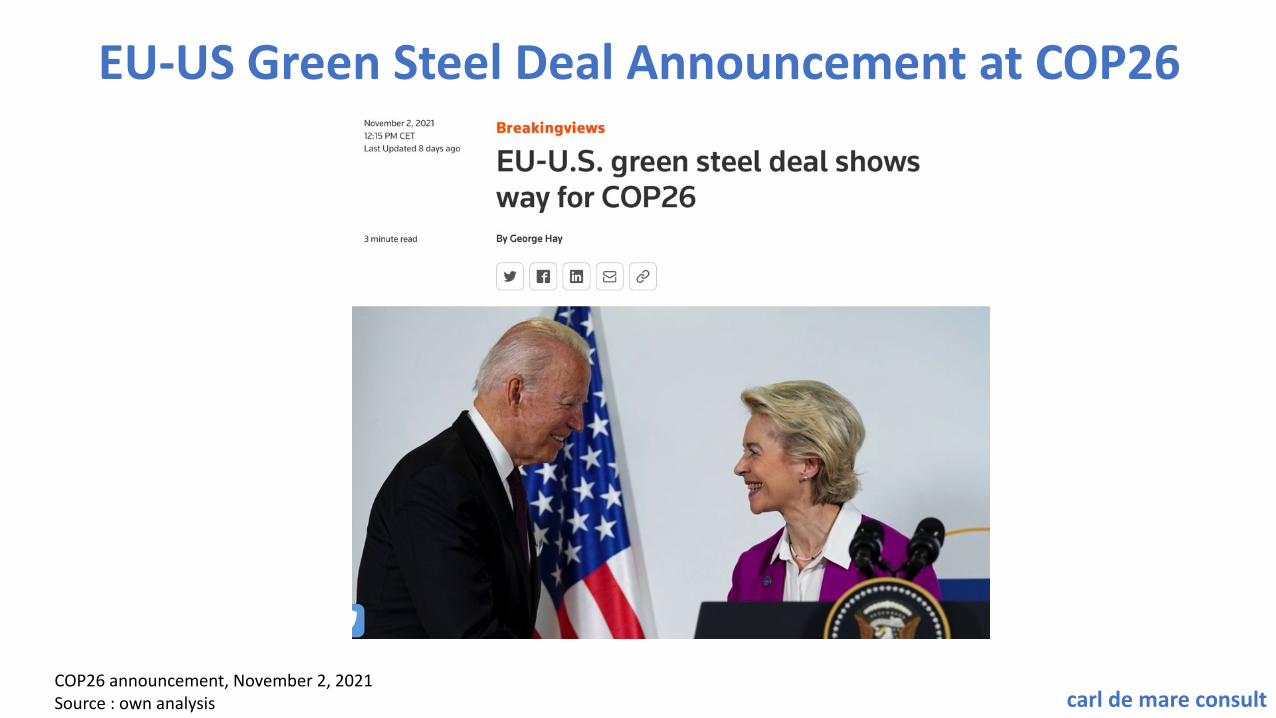
carl de mare consultCOP26 announcement, November 2, 2021Source : own analysis
EU-US Green Steel Deal Announcement at COP26
carl de mare consult
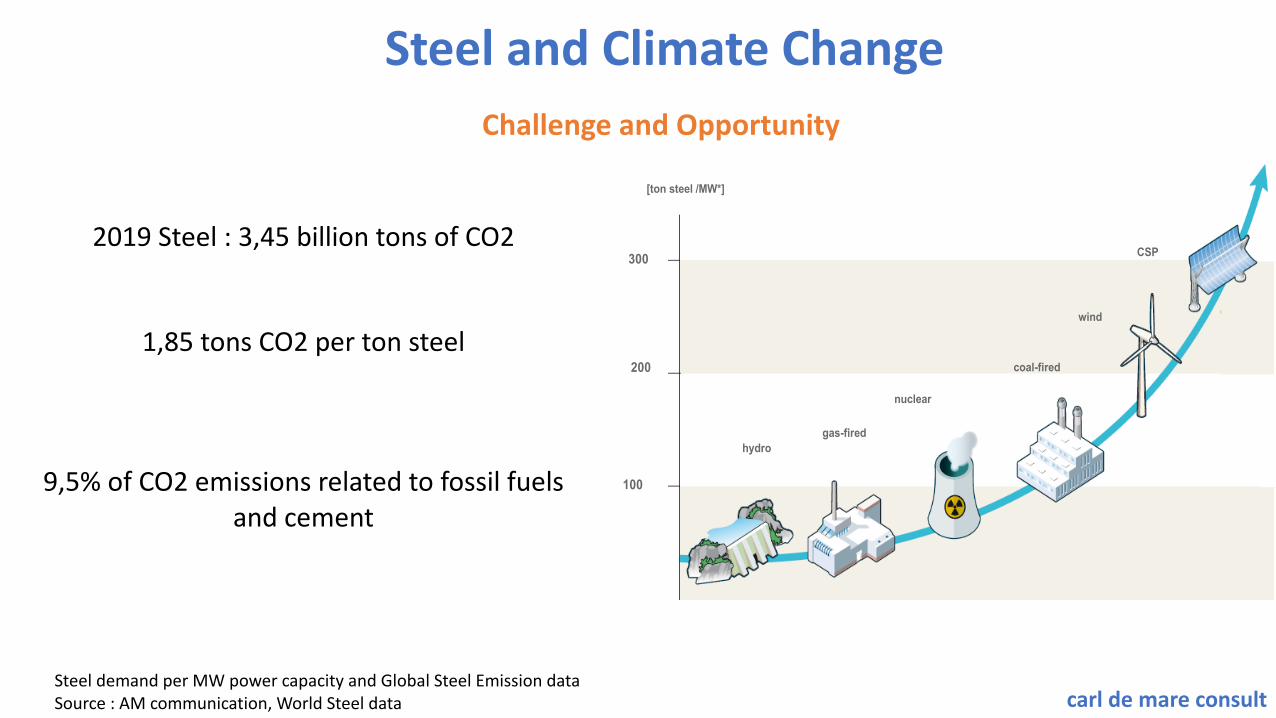
Steel and Climate Change
[ton steel /MW*]
300
200
100
hydrogas-fired
nuclear
coal-fired
wind
CSP2019 Steel : 3,45 billion tons of CO2
1,85 tons CO2 per ton steel
9,5% of CO2 emissions related to fossil fuels and cement
Challenge and Opportunity
Steel demand per MW power capacity and Global Steel Emission dataSource : AM communication, World Steel data
carl de mare consult
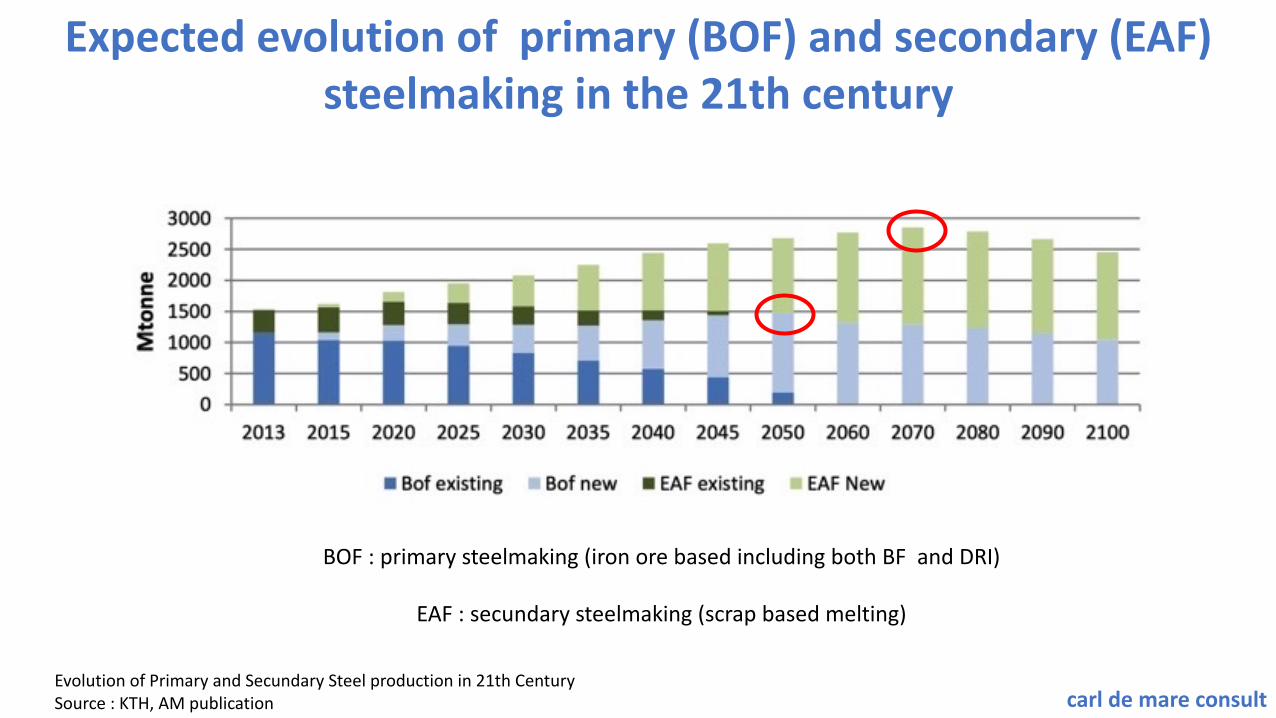
Expected evolution of primary (BOF) and secondary (EAF) steelmaking in the 21th century
BOF : primary steelmaking (iron ore based including both BF and DRI)
EAF : secundary steelmaking (scrap based melting)
Evolution of Primary and Secundary Steel production in 21th CenturySource : KTH, AM publication
carl de mare consult
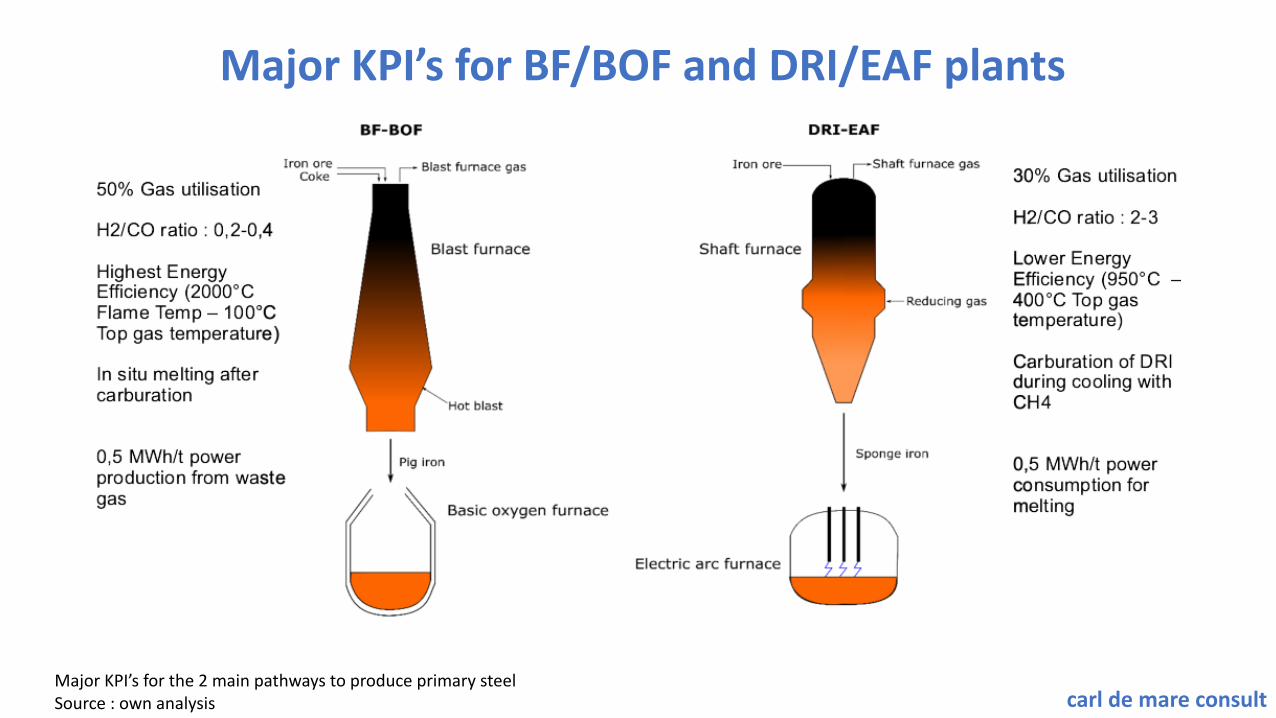
Major KPI’s for BF/BOF and DRI/EAF plants
Major KPI’s for the 2 main pathways to produce primary steelSource : own analysis

carl de mare consult
CO2 footprint per ton steel for BF/BOF and DRI /EAFwith the same system boundaries
1ton steel + 0,5MWh power +200kg cement clinker in case of natural gas based power as marginal power supply
BF/BOF DRI/EAF Coal Power
DRI/EAF Nat Gas Power
DRI/EAF Zero CO2
Power
0
500
1000
1500
2000
2500
CO-PRODUCTSPOWERPLANTREDUCTIONHEATING
CO
2 em
issi
on in
kg
per t
on c
rude
ste
el
1600
+25%
1600 +0%
-30%
Steel Footprint for BF/BOF and DRI/EAF for same system boundaries Source : own analysis
carl de mare consult
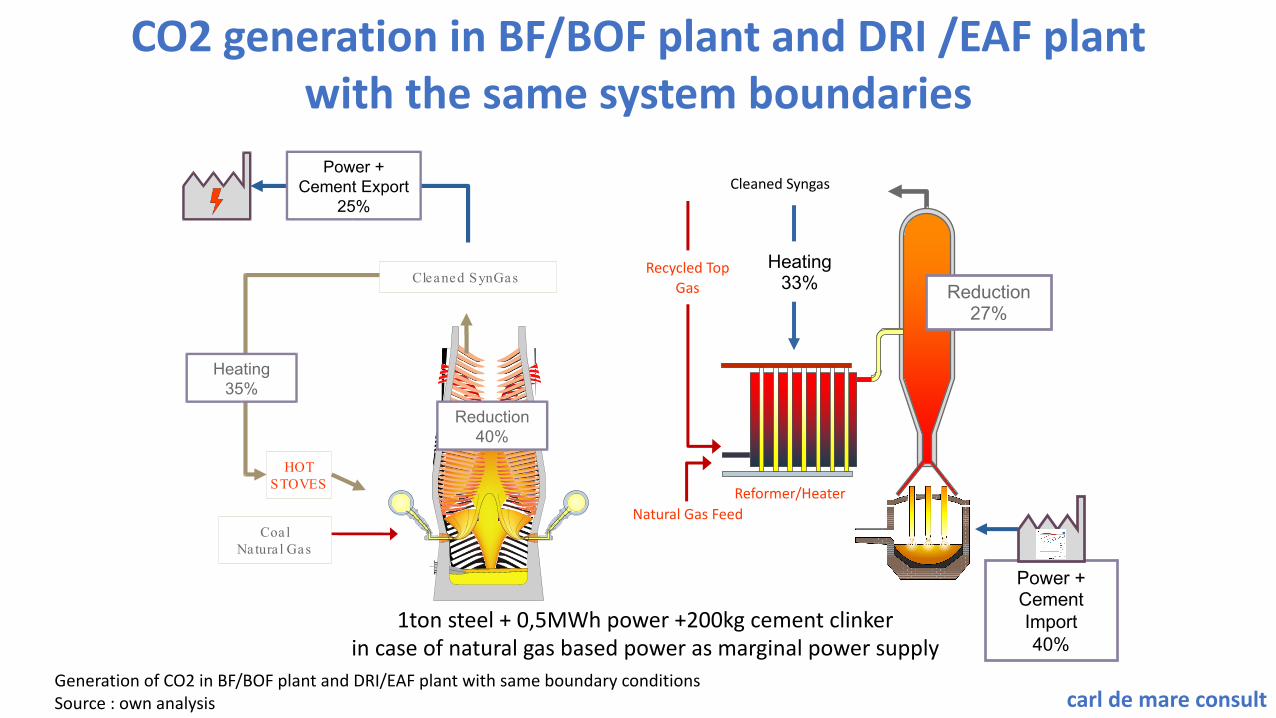
CO2 generation in BF/BOF plant and DRI /EAF plant with the same system boundaries
CoalNatura l Gas
Cleaned SynGas
HOT STOVES
Export Gas + Cement
Power + Cement Export
25%
Reduction40%
Heating35%
Power + Cement Import40%
Natural Gas Feed
Reduction27%
Recycled Top Gas
Heating33%
Cleaned Syngas
Reformer/Heater
1ton steel + 0,5MWh power +200kg cement clinker in case of natural gas based power as marginal power supply
Generation of CO2 in BF/BOF plant and DRI/EAF plant with same boundary conditionsSource : own analysis
carl de mare consult
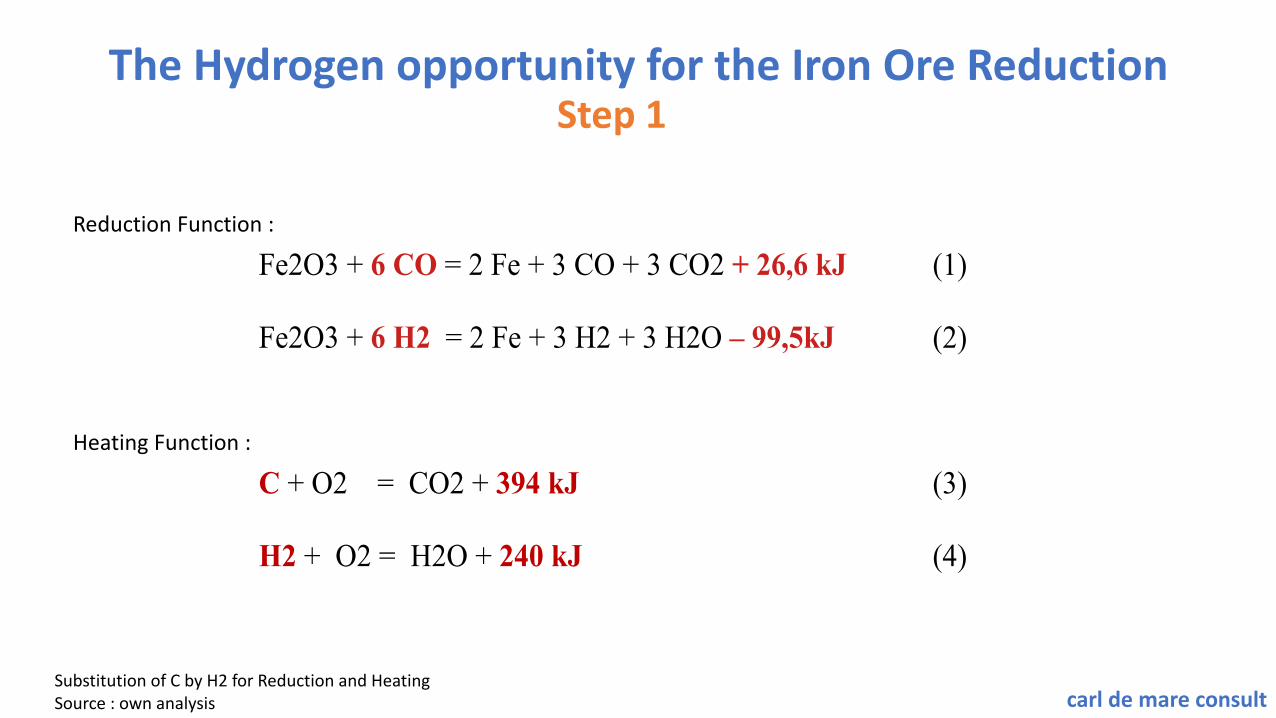
Fe2O3 + 6 CO = 2 Fe + 3 CO + 3 CO2 + 26,6 kJ (1) Fe2O3 + 6 H2 = 2 Fe + 3 H2 + 3 H2O – 99,5kJ (2) C + O2 = CO2 + 394 kJ (3) H2 + O2 = H2O + 240 kJ (4)
The Hydrogen opportunity for the Iron Ore Reduction
Reduction Function :
Heating Function :
Substitution of C by H2 for Reduction and HeatingSource : own analysis
Step 1
carl de mare consult
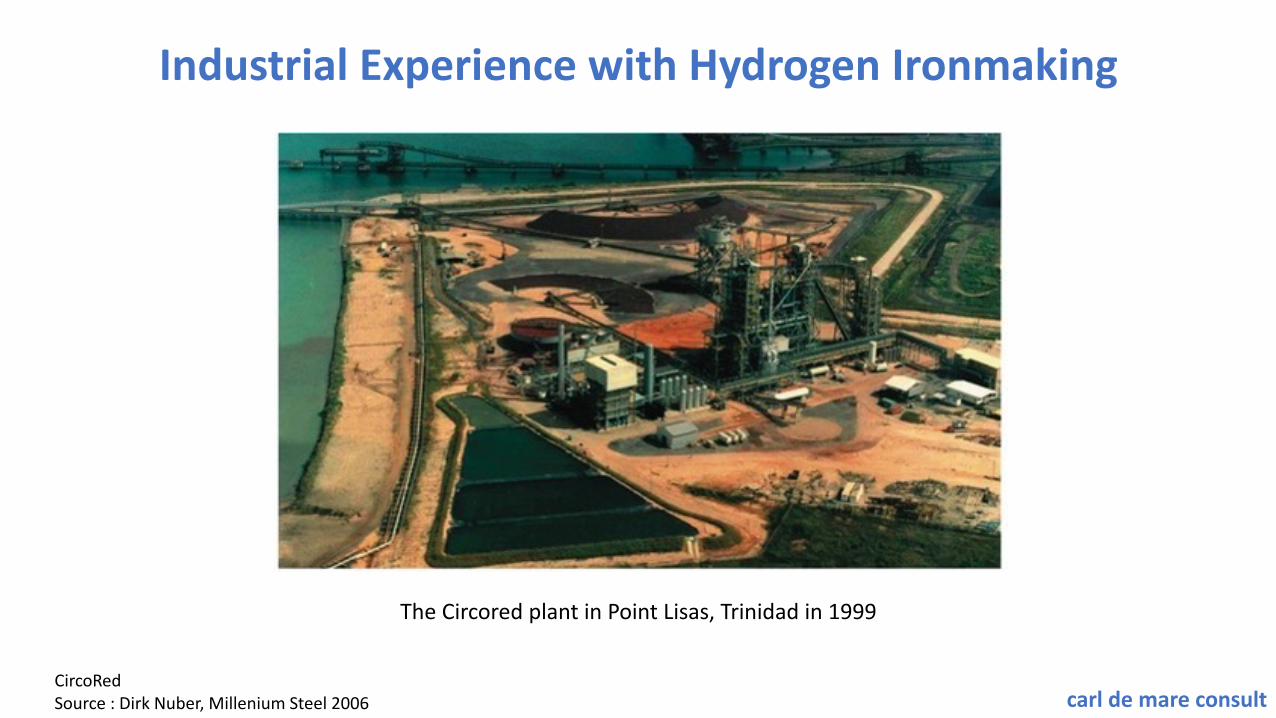
The Circored plant in Point Lisas, Trinidad in 1999
Industrial Experience with Hydrogen Ironmaking
CircoRed Source : Dirk Nuber, Millenium Steel 2006
carl de mare consult
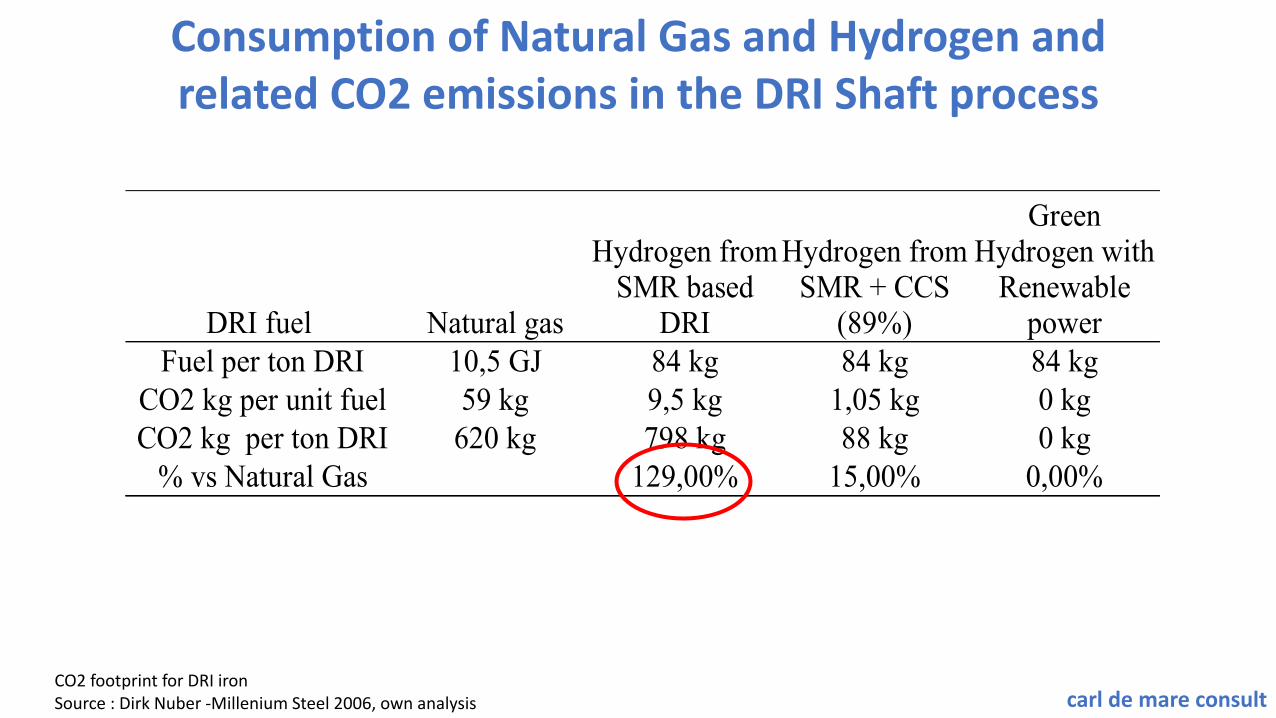
Consumption of Natural Gas and Hydrogen and related CO2 emissions in the DRI Shaft process
DRI fuel Natural gasFuel per ton DRI 10,5 GJ 84 kg 84 kg 84 kg
CO2 kg per unit fuel 59 kg 9,5 kg 1,05 kg 0 kgCO2 kg per ton DRI 620 kg 798 kg 88 kg 0 kg
% vs Natural Gas 129,00% 15,00% 0,00%
Hydrogen from SMR based
DRI
Hydrogen from SMR + CCS
(89%)
Green Hydrogen with
Renewable power
CO2 footprint for DRI ironSource : Dirk Nuber -Millenium Steel 2006, own analysis
carl de mare consult
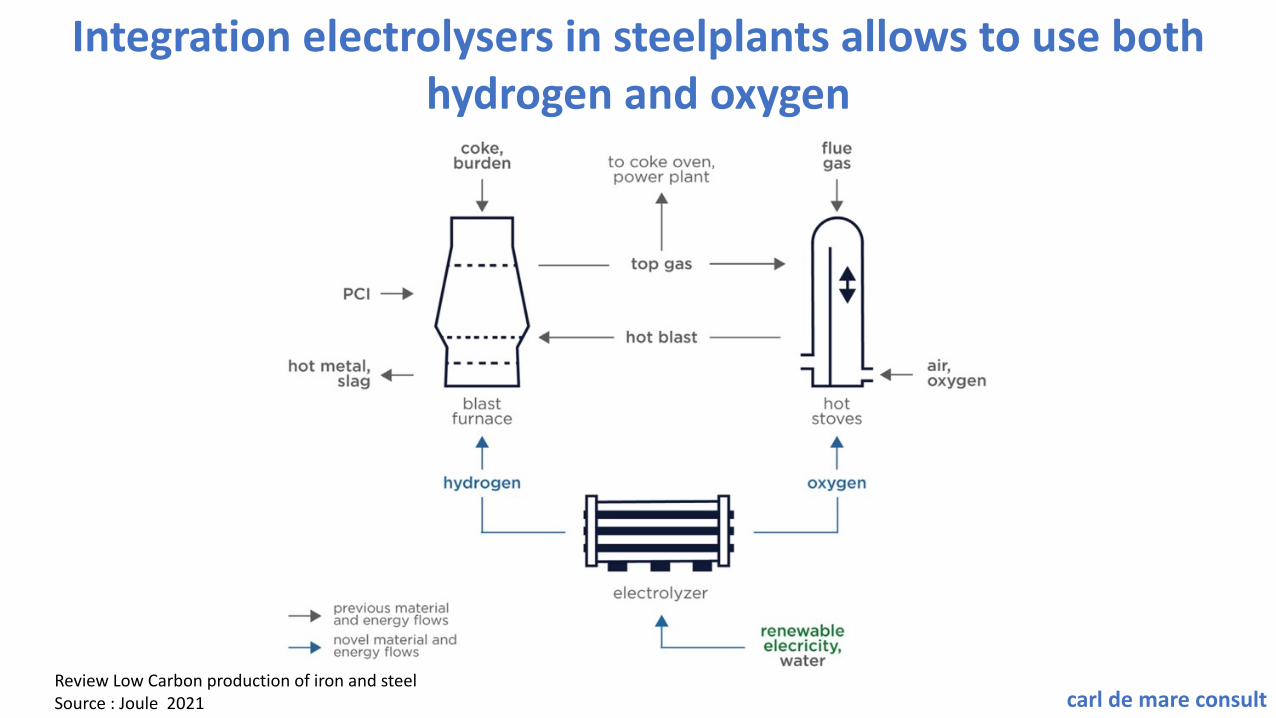
Integration electrolysers in steelplants allows to use both hydrogen and oxygen
Review Low Carbon production of iron and steel Source : Joule 2021

carl de mare consult
Thermodynamics of CO- versus H2-reduction
Hydrogen more efficient at high temperatures(dotted lines)
CO gas utilisation higher at lower temperatures
(full lines)
CO/CO2
CO/CO2
H2/H2O
H2/H2O
Hydrogen Ironmaking, How it worksSource : Metals 2020
The Baur-Glässner Diagram
carl de mare consult
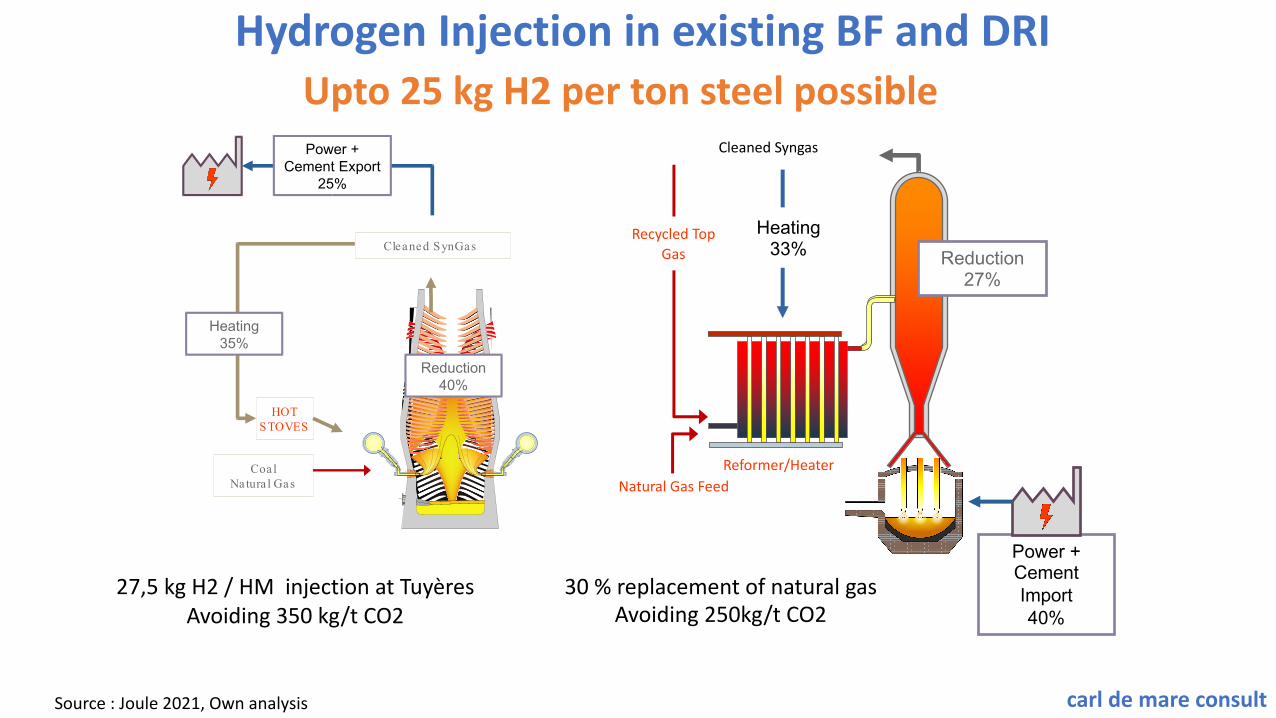
Hydrogen Injection in existing BF and DRI
CoalNatura l Gas
Cleaned SynGas
HOT STOVES
Export Gas + Cement
Power + Cement Export
25%
Reduction40%
Heating35%
27,5 kg H2 / HM injection at TuyèresAvoiding 350 kg/t CO2
30 % replacement of natural gasAvoiding 250kg/t CO2
Power + Cement Import40%
Natural Gas Feed
Reduction27%
Recycled Top Gas
Heating33%
Cleaned Syngas
Reformer/Heater
Source : Joule 2021, Own analysis
Upto 25 kg H2 per ton steel possible

carl de mare consult
Carbon Neutral Steelmaking
Hydrogeninjection
25 kg H2 injection-350 kg -250 kg
BF/BOF 1600 kg/t DRI/EAF 1100 kg/t
1250 kg 850 kg 80%
Today
2050
Step 1 – Hydrogen Injection
Does it make sense to move to Full-Hydrogen Steelmaking?
ResourcesRequired
carl de mare consult
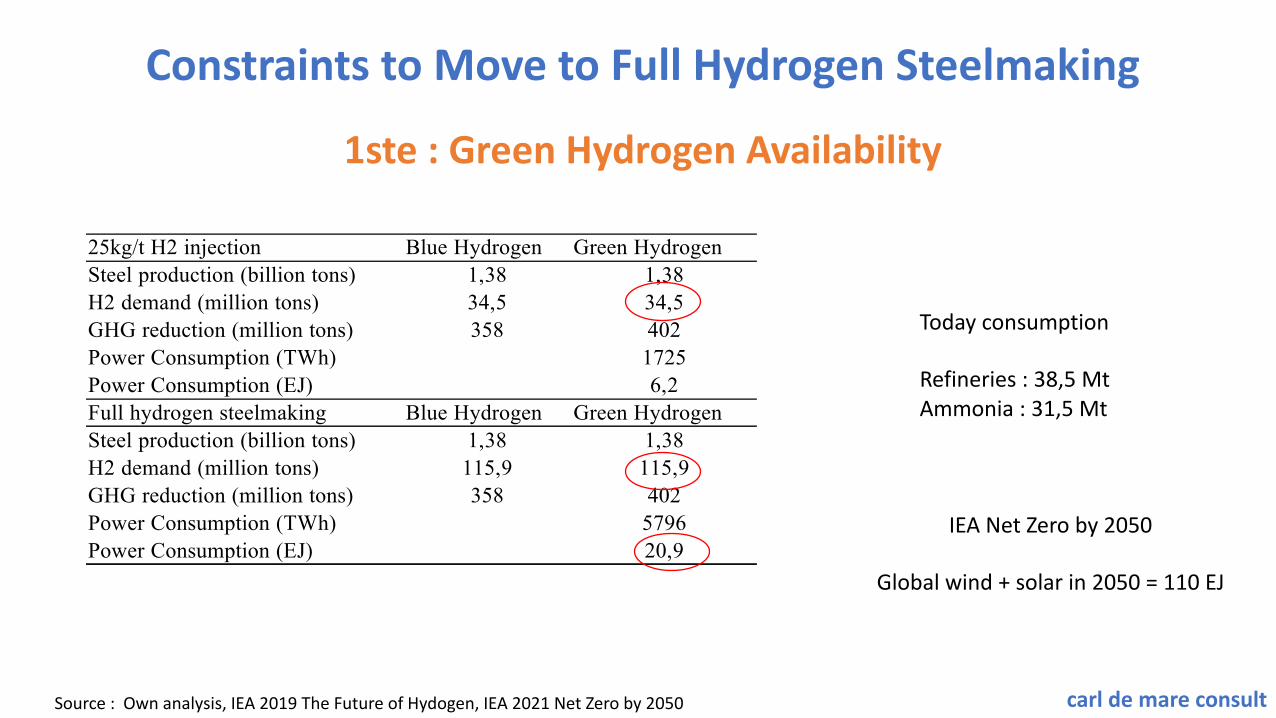
Constraints to Move to Full Hydrogen Steelmaking
1ste : Green Hydrogen Availability
25kg/t H2 injection Blue Hydrogen Green HydrogenSteel production (billion tons) 1,38 1,38H2 demand (million tons) 34,5 34,5GHG reduction (million tons) 358 402Power Consumption (TWh) 1725Power Consumption (EJ) 6,2Full hydrogen steelmaking Blue Hydrogen Green HydrogenSteel production (billion tons) 1,38 1,38H2 demand (million tons) 115,9 115,9GHG reduction (million tons) 358 402Power Consumption (TWh) 5796Power Consumption (EJ) 20,9
Today consumption
Refineries : 38,5 MtAmmonia : 31,5 Mt
IEA Net Zero by 2050
Global wind + solar in 2050 = 110 EJ
Source : Own analysis, IEA 2019 The Future of Hydogen, IEA 2021 Net Zero by 2050
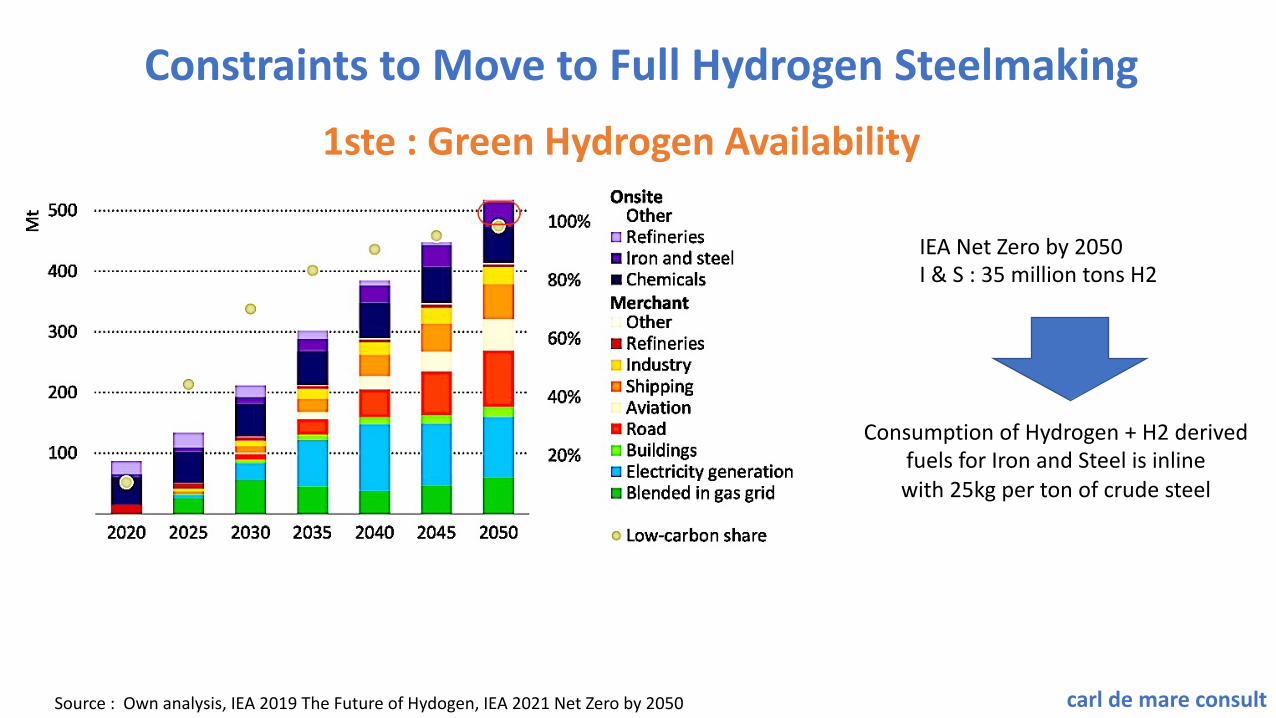
carl de mare consult
Constraints to Move to Full Hydrogen Steelmaking1ste : Green Hydrogen Availability
IEA Net Zero by 2050I & S : 35 million tons H2
Consumption of Hydrogen + H2 derived fuels for Iron and Steel is inline with 25kg per ton of crude steel
Source : Own analysis, IEA 2019 The Future of Hydogen, IEA 2021 Net Zero by 2050
carl de mare consult
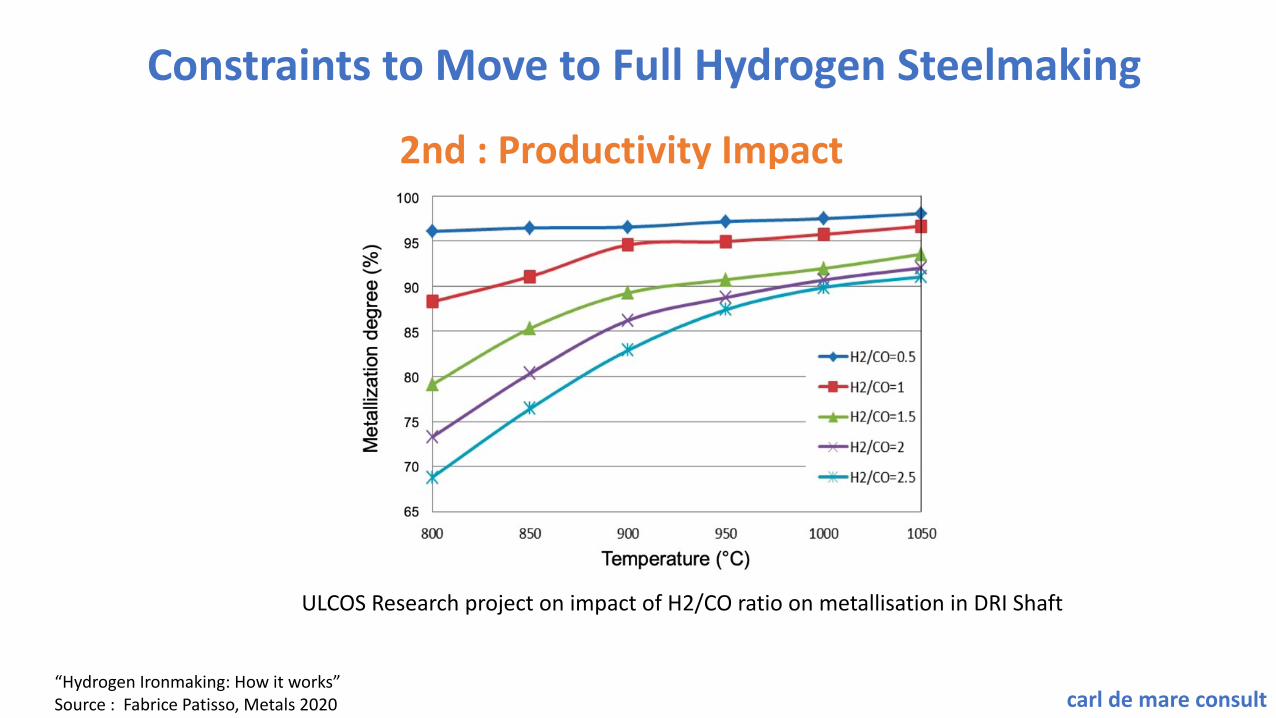
Constraints to Move to Full Hydrogen Steelmaking
2nd : Productivity Impact
ULCOS Research project on impact of H2/CO ratio on metallisation in DRI Shaft
“Hydrogen Ironmaking: How it works”Source : Fabrice Patisso, Metals 2020
carl de mare consult
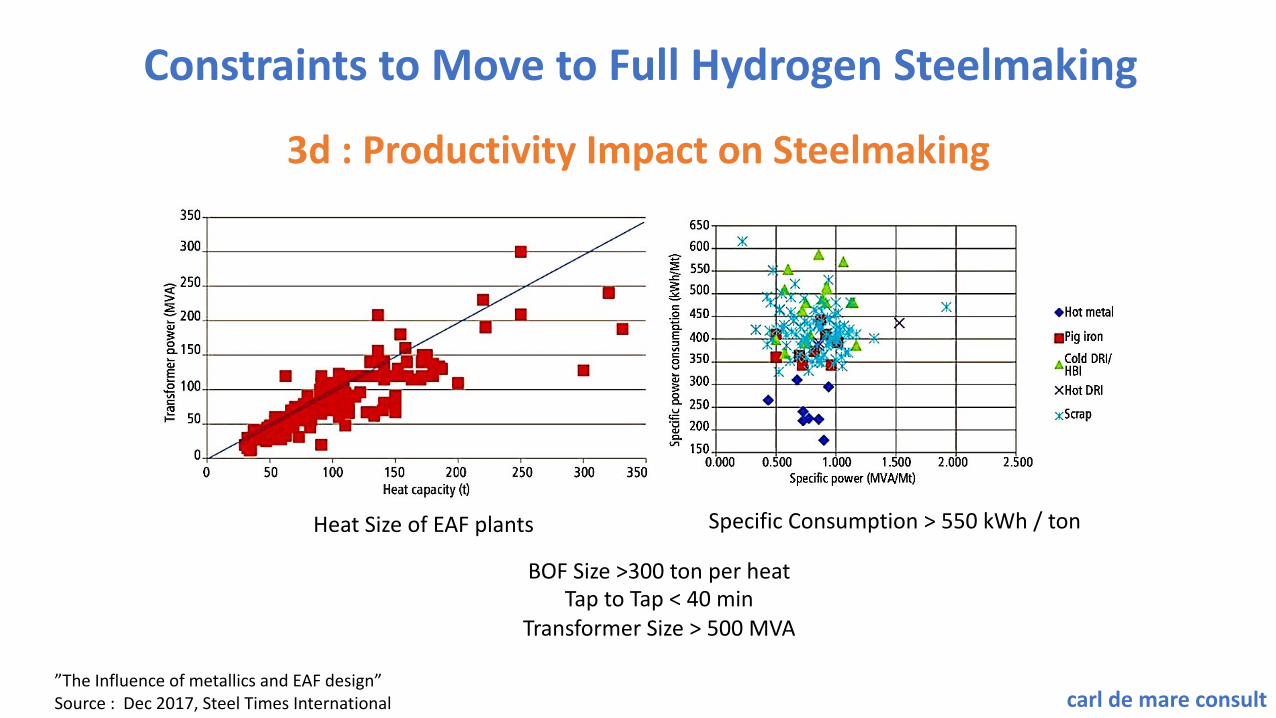
Constraints to Move to Full Hydrogen Steelmaking
3d : Productivity Impact on Steelmaking
BOF Size >300 ton per heatTap to Tap < 40 min
Transformer Size > 500 MVA
Specific Consumption > 550 kWh / ton Heat Size of EAF plants
”The Influence of metallics and EAF design”Source : Dec 2017, Steel Times International
carl de mare consult
Constraints to Move to Full Hydrogen Steelmaking
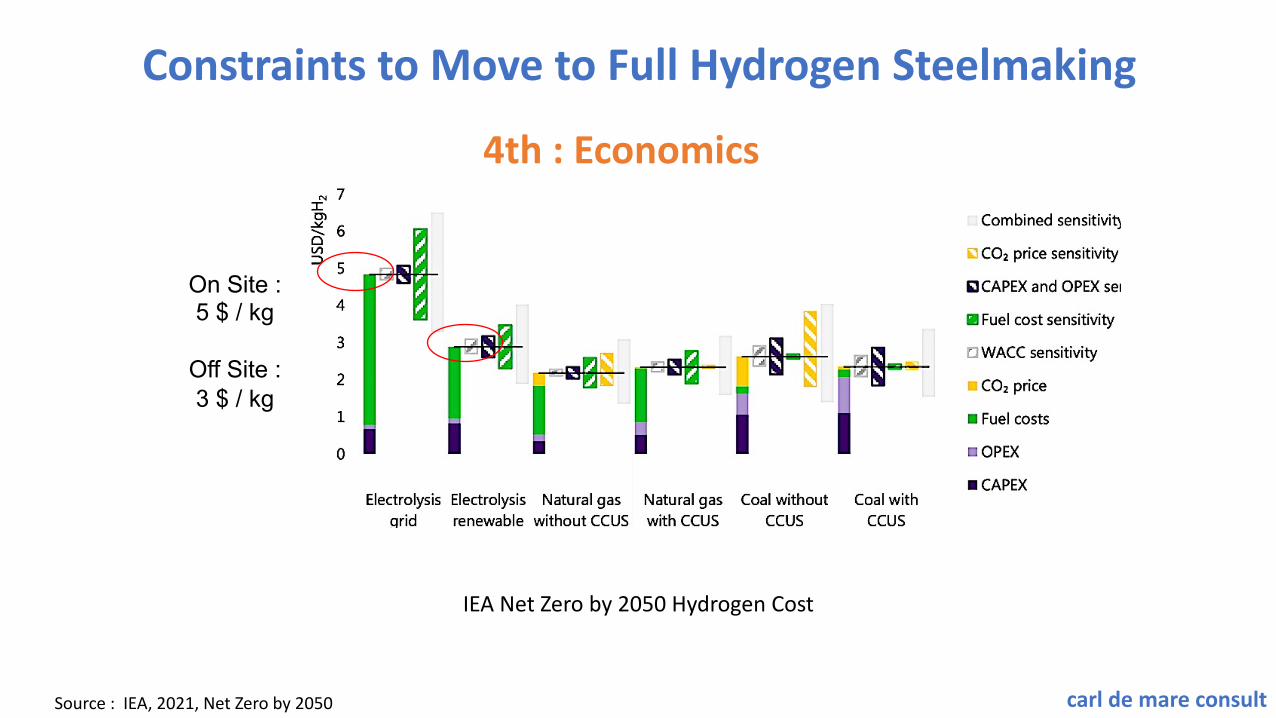
4th : Economics
IEA Net Zero by 2050 Hydrogen Cost
On Site : 5 $ / kg
Off Site : 3 $ / kg
Source : IEA, 2021, Net Zero by 2050

carl de mare consult
Constraints to Move to Full Hydrogen Steelmaking
4th : Economics
25kg Hydrogen InjectionCO2 abatement cost :342 to 474 $ per ton
IEA expected CO2 price in 2050 : 200 to 250 $ per ton
Per ton steel 25kg injection in BF 25 kg injection in DRIOff-side H2 generation from renewables (USD/kg) $3,00 $3,00H2 consumption for transport, temporary storage 44,00% 44,00%Total cost of Hydrogen`(USD/kg) $4,32 $4,32Green H2 cost` (USD/t steel) $113 $113Savings in coal and gas cost (USD/t steel) $10 $20CO2 abatement (kg/t steel) 300 195CO2 abatement cost (USD/t CO2) $342 $474
USD (2019) per tonne of CO2 2025 2030 2040 2050
Advanced economies 75 130 205 250
45 90 160 200
3 15 35 55
Selected emerging market and developing economies
Other emerging market and developing economies
Source : IEA, 2021, Net Zero by 2050

carl de mare consult
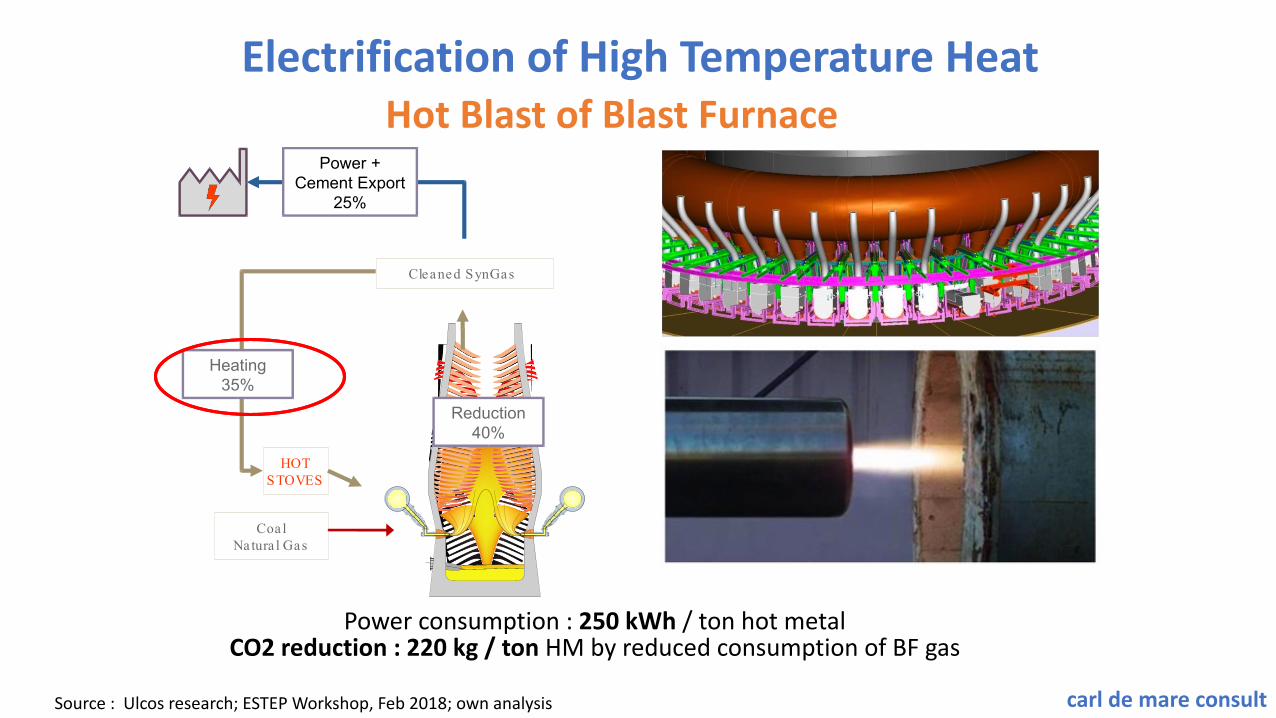
Electrification of High Temperature Heat
CoalNatura l Gas
Cleaned SynGas
HOT STOVES
Export Gas + Cement
Power + Cement Export
25%
Reduction40%
Heating35%
1ton steel + 0,5MWh power +200kg cement clinker in case of natural gas based power system
Power + Cement Import40%
Natural Gas Feed
Reduction27%
Recycled Top Gas
Heating33%
Cleaned Syngas
Reformer/Heater
Step 2
Generation of CO2 in BF/BOF plant and DRI/EAF plant with same boundary conditionsSource : own analysis
carl de mare consult
Electrification of High Temperature Heat
CoalNatura l Gas
Cleaned SynGas
HOT STOVES
Export Gas + Cement
Power + Cement Export
25%
Reduction40%
Heating35%
Power consumption : 250 kWh / ton hot metalCO2 reduction : 220 kg / ton HM by reduced consumption of BF gas
Source : Ulcos research; ESTEP Workshop, Feb 2018; own analysis
Hot Blast of Blast Furnace
carl de mare consult
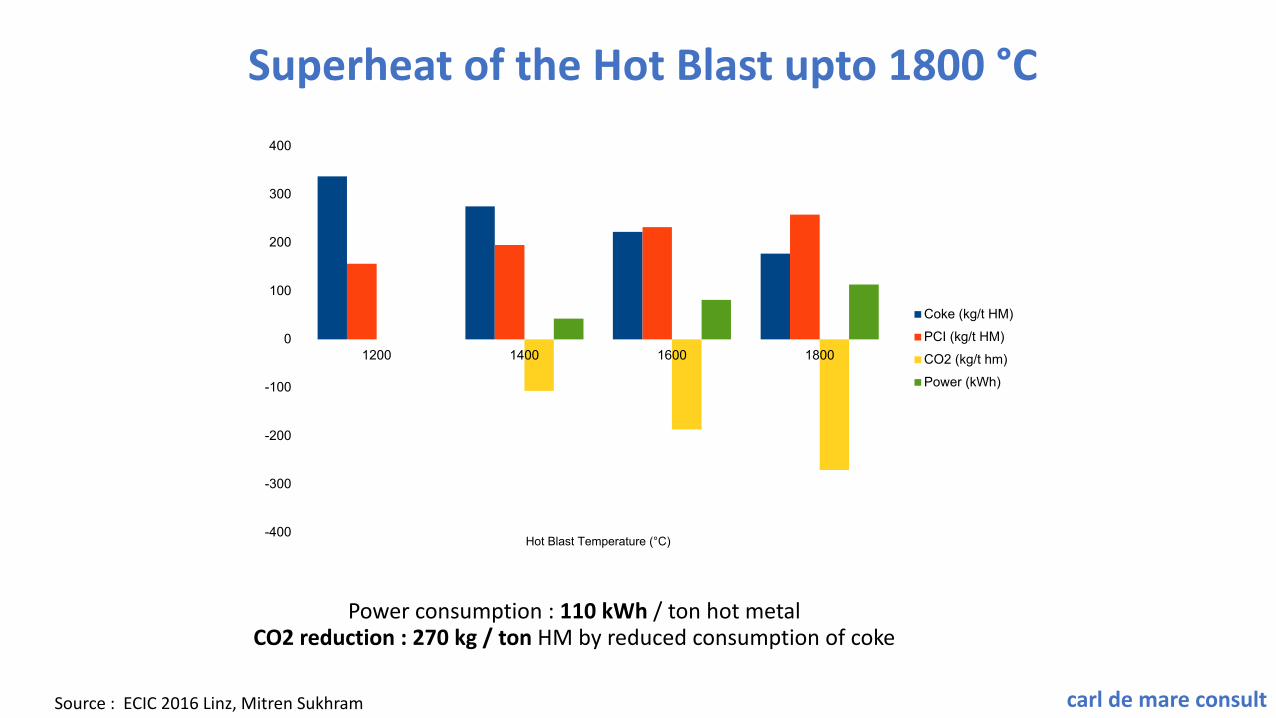
Superheat of the Hot Blast upto 1800 °C
-400
-300
-200
-100
0
100
200
300
400
1200 1400 1600 1800
Hot Blast Temperature (°C)
Coke (kg/t HM)PCI (kg/t HM)CO2 (kg/t hm)Power (kWh)
Power consumption : 110 kWh / ton hot metalCO2 reduction : 270 kg / ton HM by reduced consumption of coke
Source : ECIC 2016 Linz, Mitren Sukhram

carl de mare consult
Plasma Torch for Cracking and ReformingMonolith Materials – 16MW Plasma torch to
produce Carbon Black and HydrogenThermal Cracking of Methane
CH4 = C + 2 H2 – 74,5 kJ (4)
Thermal Reforming of Methane
CH4 + CO2 = 2 CO + 2 H2 – 247 kJ(5)
CH4 + H2O = CO + 3 H2 – 208 kJ (6)
Source : Ulcos research; ESTEP Workshop, Feb 2018; Monolith Materials
carl de mare consult
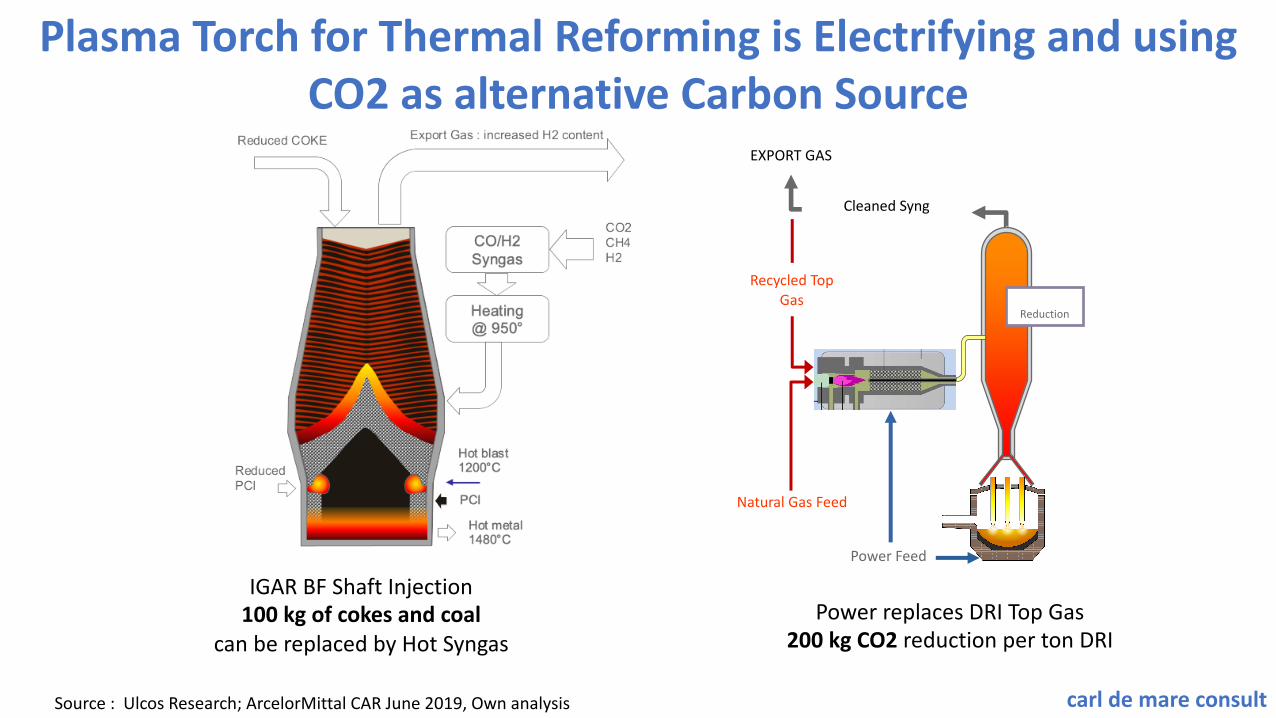
Plasma Torch for Thermal Reforming is Electrifying and using CO2 as alternative Carbon Source
Cleaned Syng
Plasma Reactor
Power Feed
Natural Gas Feed
Reduction
Recycled Top Gas
EXPORT GAS
Power replaces DRI Top Gas200 kg CO2 reduction per ton DRI
IGAR BF Shaft Injection100 kg of cokes and coal
can be replaced by Hot Syngas
Source : Ulcos Research; ArcelorMittal CAR June 2019, Own analysis

carl de mare consult
Carbon Neutral Steelmaking
Hydrogeninjection
ElectrificationHT Heat
25 kg H2 injection-350 kg -250 kg
BF/BOF 1600 kg/t DRI/EAF 1100 kg/t
1MWh RE -300 kg -200 kg
950 kg 650 kg
Can we replace fossil carbon by alternative sources?
Today
2050 60%
Step 2 – Electrification HT HeatResourcesRequired
carl de mare consult
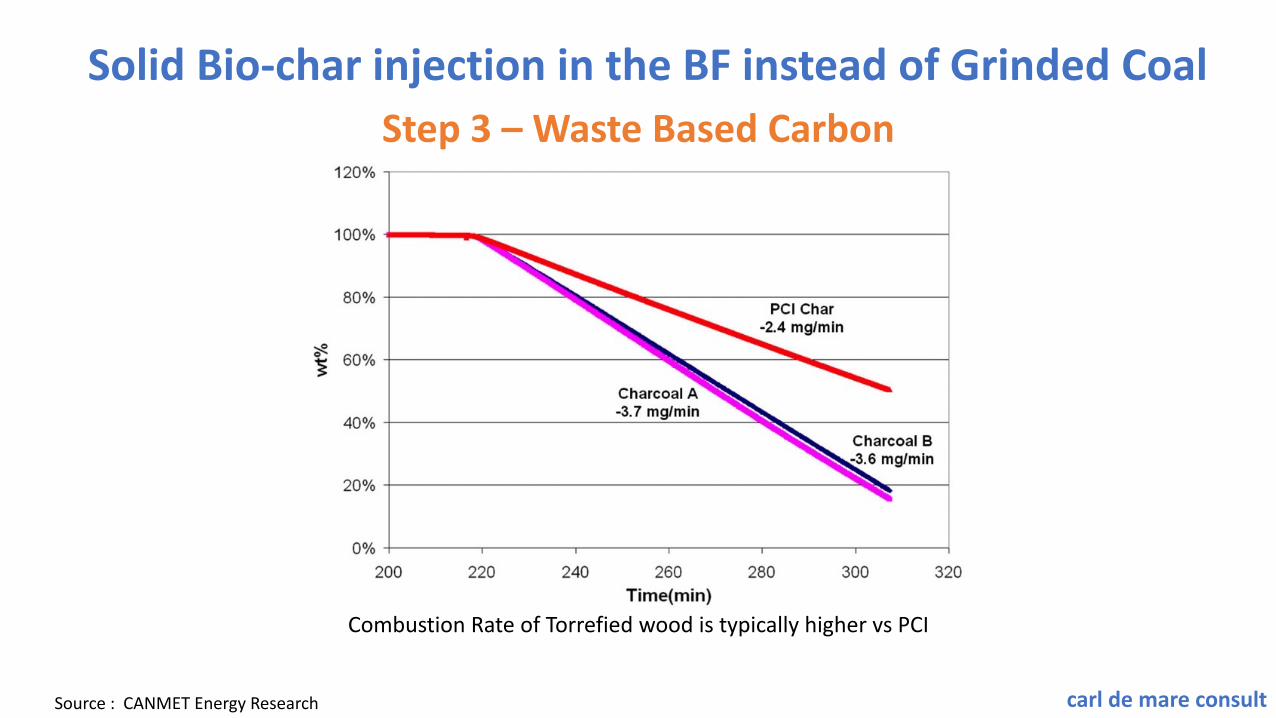
Solid Bio-char injection in the BF instead of Grinded Coal
Combustion Rate of Torrefied wood is typically higher vs PCI
Step 3 – Waste Based Carbon
Source : CANMET Energy Research
carl de mare consult
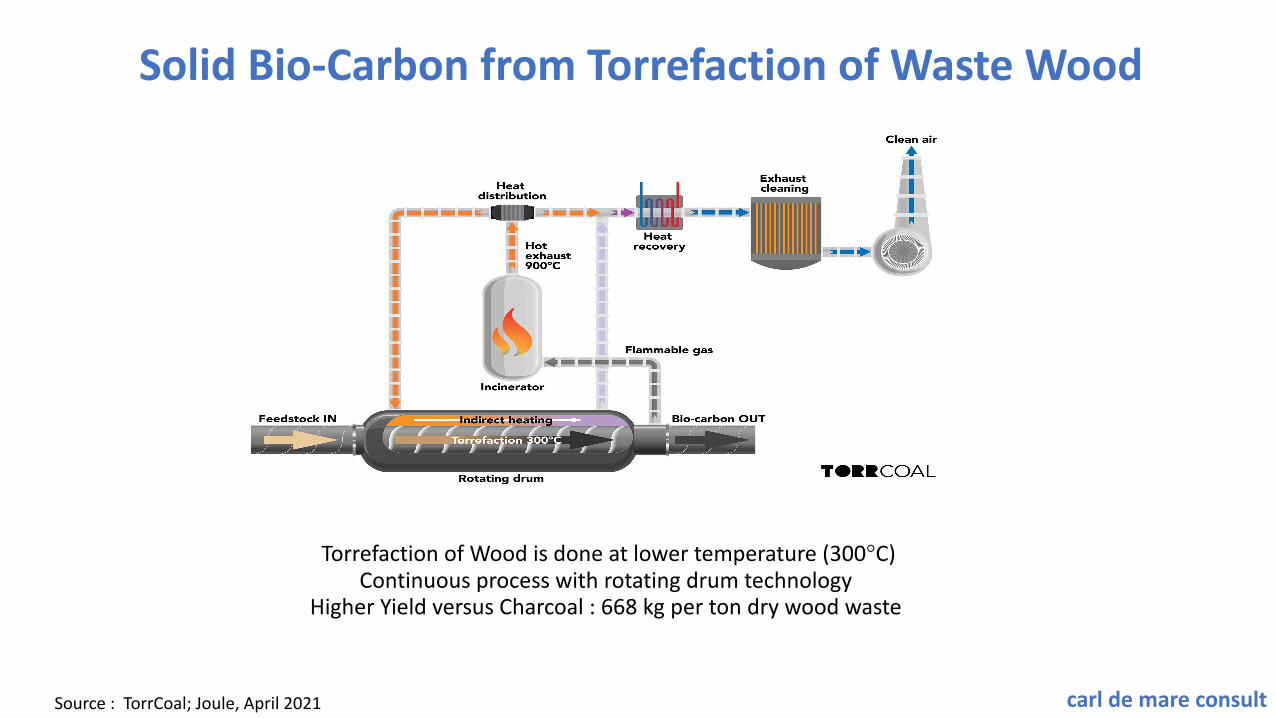
Solid Bio-Carbon from Torrefaction of Waste Wood
Torrefaction of Wood is done at lower temperature (300°C)Continuous process with rotating drum technology
Higher Yield versus Charcoal : 668 kg per ton dry wood waste
Source : TorrCoal; Joule, April 2021
carl de mare consult
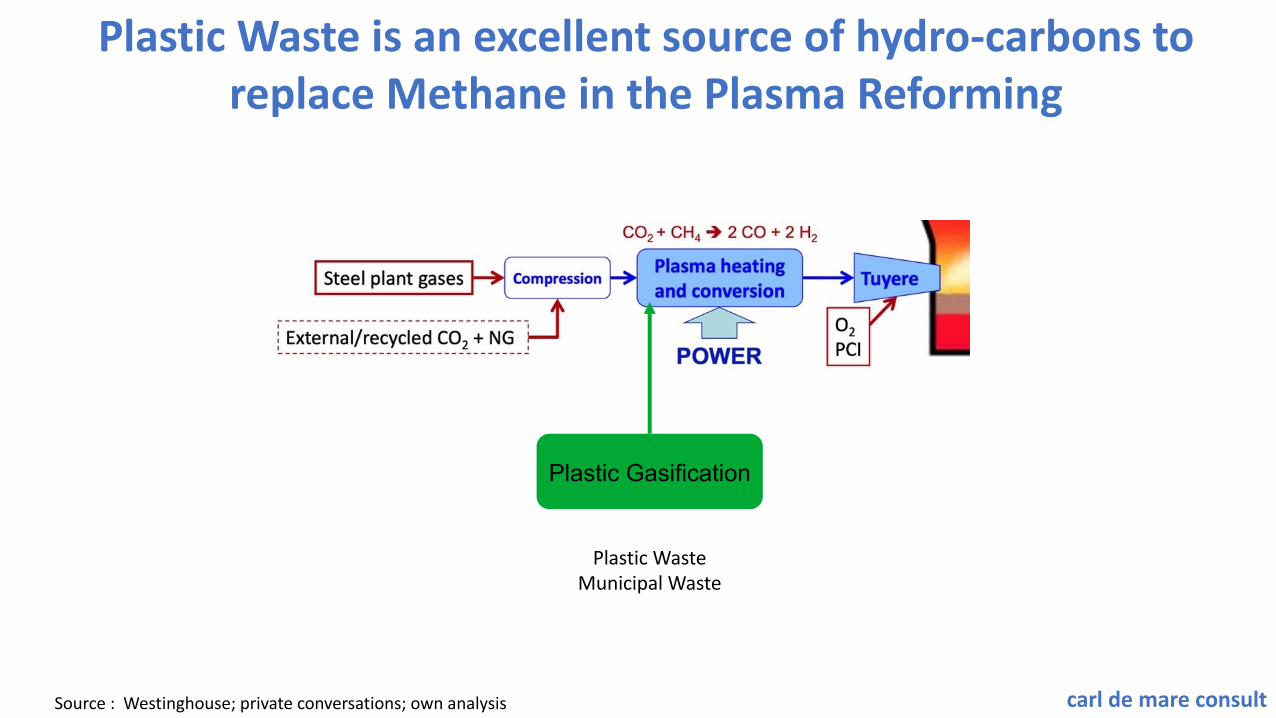
Plastic Waste is an excellent source of hydro-carbons to replace Methane in the Plasma Reforming
Plastic WasteMunicipal Waste
Plastic Gasification
Source : Westinghouse; private conversations; own analysis
carl de mare consult
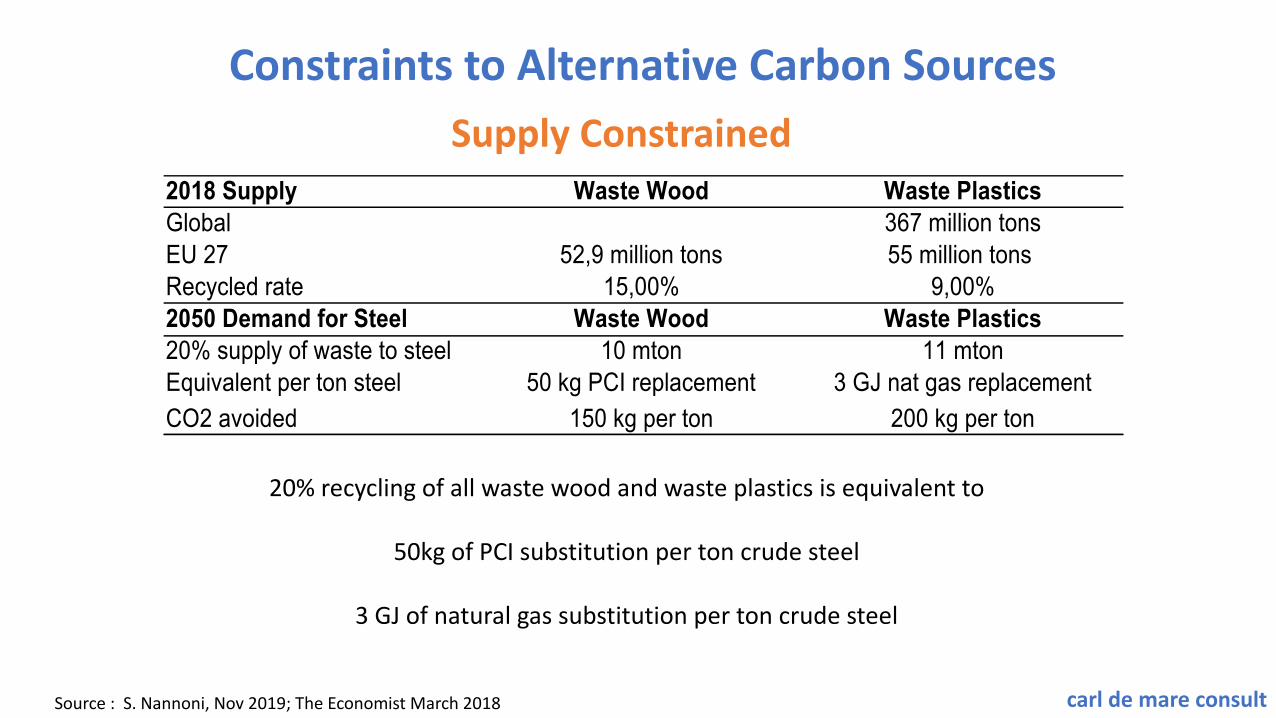
Constraints to Alternative Carbon SourcesSupply Constrained
20% recycling of all waste wood and waste plastics is equivalent to
50kg of PCI substitution per ton crude steel
3 GJ of natural gas substitution per ton crude steel
2018 Supply Waste Wood Waste PlasticsGlobal 367 million tonsEU 27 52,9 million tons 55 million tons Recycled rate 15,00% 9,00%2050 Demand for Steel Waste Wood Waste Plastics20% supply of waste to steel 10 mton 11 mtonEquivalent per ton steel 50 kg PCI replacement 3 GJ nat gas replacementCO2 avoided 150 kg per ton 200 kg per ton
Source : S. Nannoni, Nov 2019; The Economist March 2018
carl de mare consult
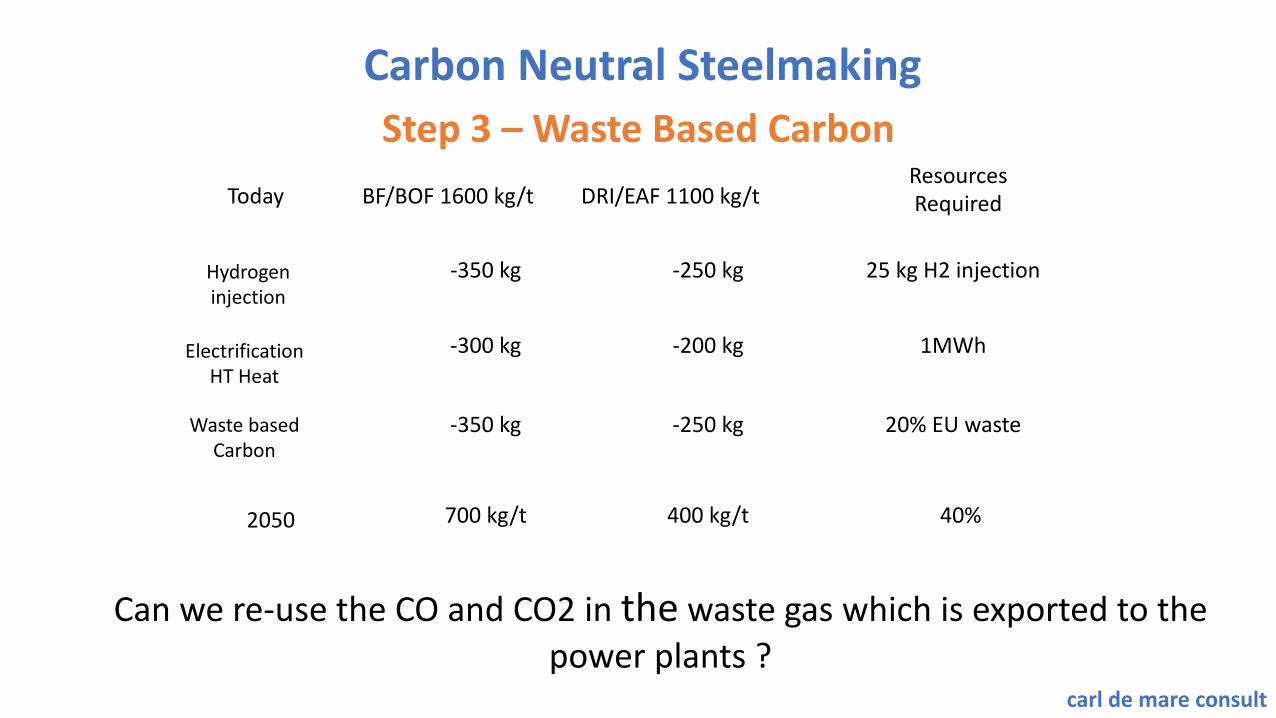
Carbon Neutral Steelmaking
Hydrogeninjection
ElectrificationHT Heat
Waste based Carbon
25 kg H2 injection-350 kg -250 kg
BF/BOF 1600 kg/t DRI/EAF 1100 kg/t
1MWh -300 kg -200 kg
20% EU waste-350 kg -250 kg
700 kg/t 400 kg/t
Can we re-use the CO and CO2 in the waste gas which is exported to the power plants ?
40%2050
Today
Step 3 – Waste Based CarbonResourcesRequired

carl de mare consult
Electrification is increasing the amount of export gas in steelmaking
After Electrification DRI plant : +4 GJ per ton export
gas
BF plant: 7 GJ per ton export gas
Syngas production of global steel sector is 3x larger vs
natural gas consumption of the Chemical Sector!
Example DRI plant
Source : own analysis
carl de mare consult
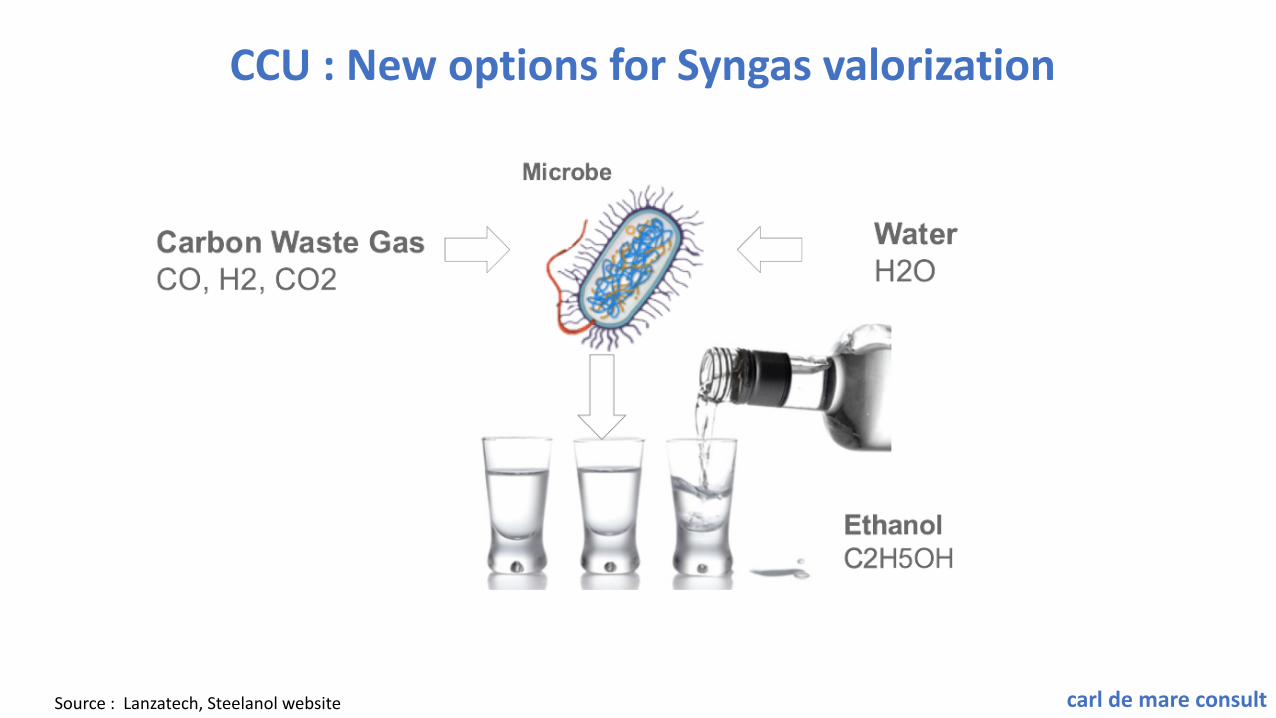
CCU : New options for Syngas valorization
Source : Lanzatech, Steelanol website
carl de mare consult
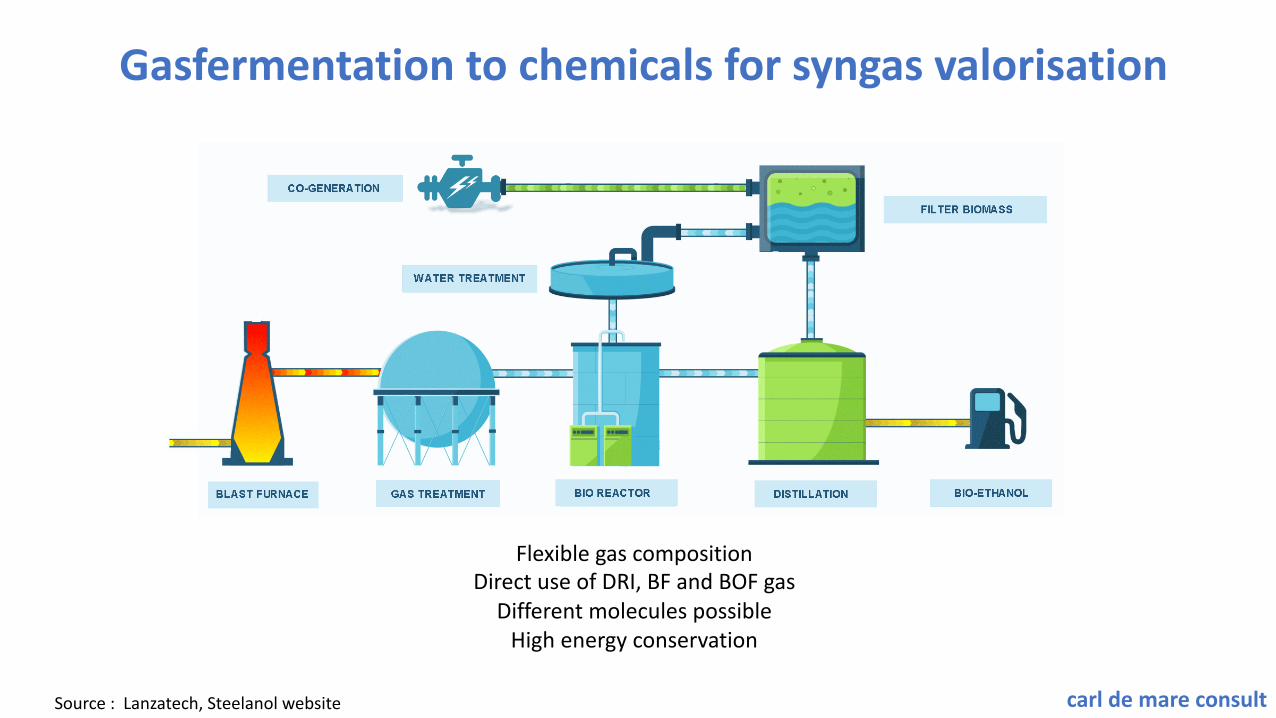
Gasfermentation to chemicals for syngas valorisation
Flexible gas compositionDirect use of DRI, BF and BOF gas
Different molecules possibleHigh energy conservation
Source : Lanzatech, Steelanol website
carl de mare consult
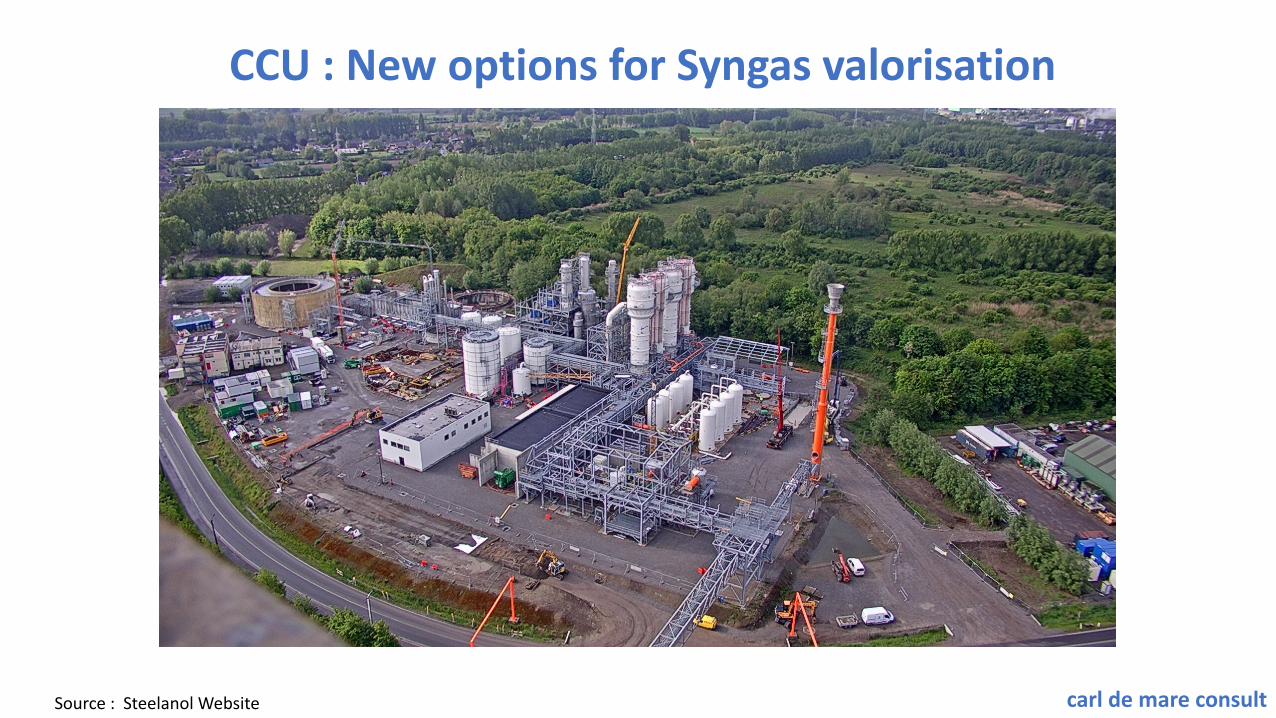
CCU : New options for Syngas valorisation
Source : Steelanol Website
carl de mare consult
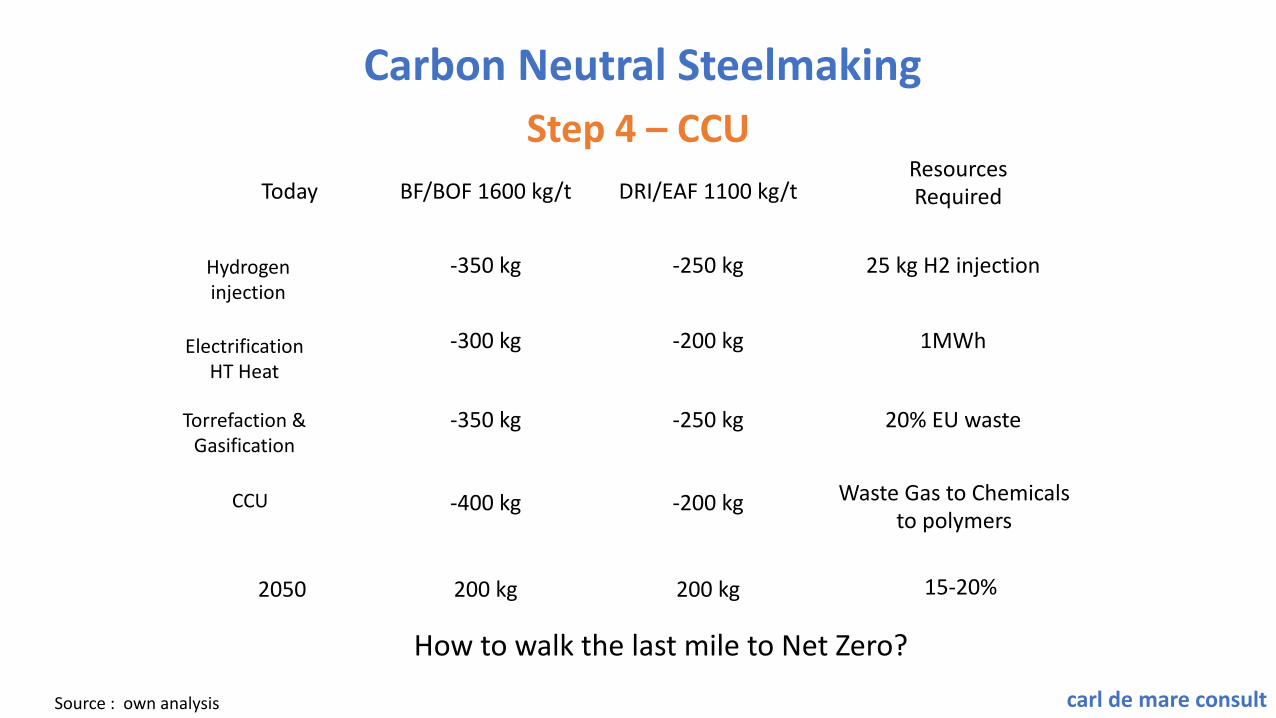
Carbon Neutral Steelmaking
Hydrogeninjection
ElectrificationHT Heat
Torrefaction &Gasification
CCU
25 kg H2 injection-350 kg -250 kg
BF/BOF 1600 kg/t DRI/EAF 1100 kg/t
1MWh -300 kg -200 kg
20% EU waste-350 kg -250 kg
Waste Gas to Chemicalsto polymers
-400 kg -200 kg
200 kg 200 kg
Today
2050 15-20%
Step 4 – CCU
Source : own analysis
How to walk the last mile to Net Zero?
ResourcesRequired
carl de mare consult
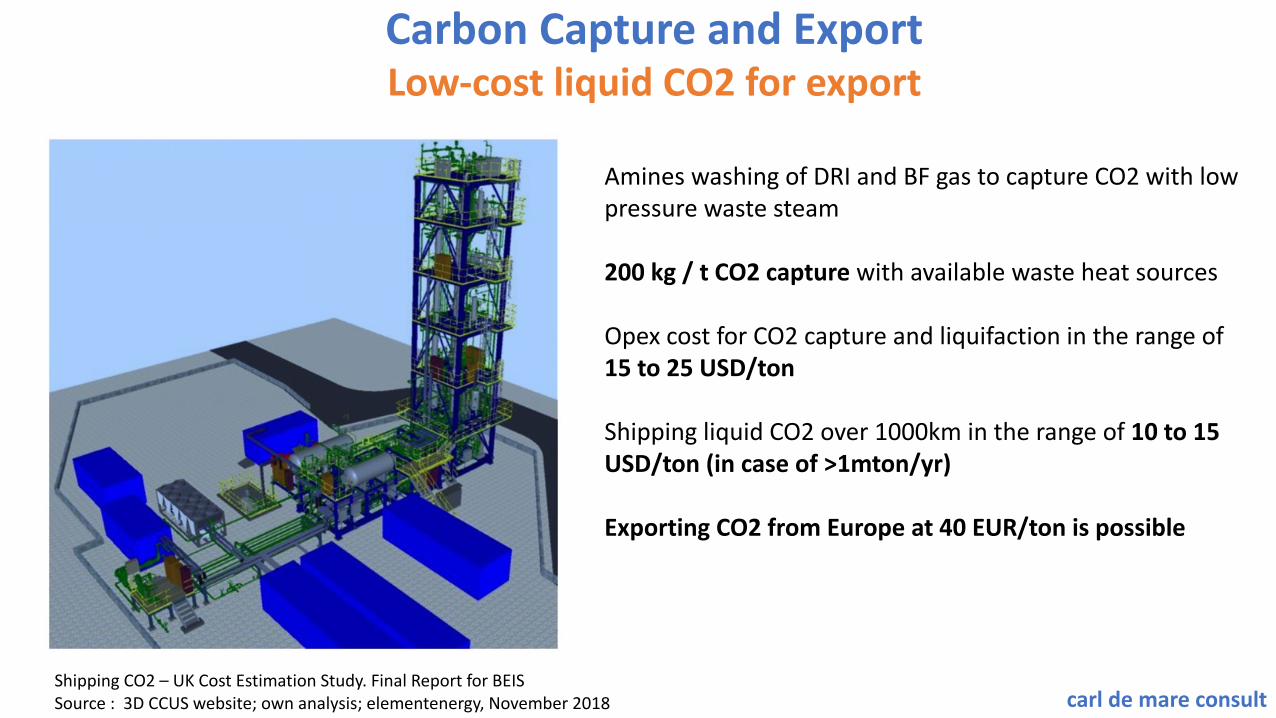
Carbon Capture and ExportLow-cost liquid CO2 for export
Amines washing of DRI and BF gas to capture CO2 with low pressure waste steam
200 kg / t CO2 capture with available waste heat sources
Opex cost for CO2 capture and liquifaction in the range of 15 to 25 USD/ton
Shipping liquid CO2 over 1000km in the range of 10 to 15 USD/ton (in case of >1mton/yr)
Exporting CO2 from Europe at 40 EUR/ton is possible
Shipping CO2 – UK Cost Estimation Study. Final Report for BEISSource : 3D CCUS website; own analysis; elementenergy, November 2018
carl de mare consult
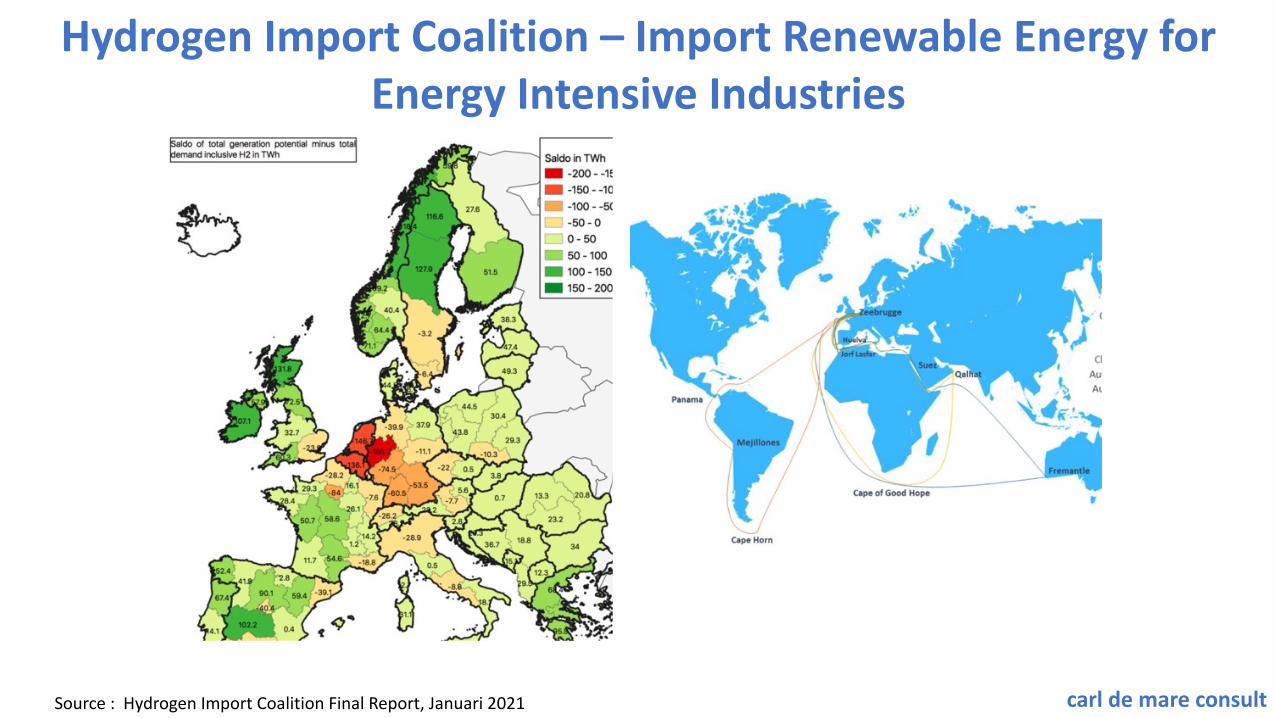
Hydrogen Import Coalition – Import Renewable Energy for Energy Intensive Industries
Source : Hydrogen Import Coalition Final Report, Januari 2021
carl de mare consult
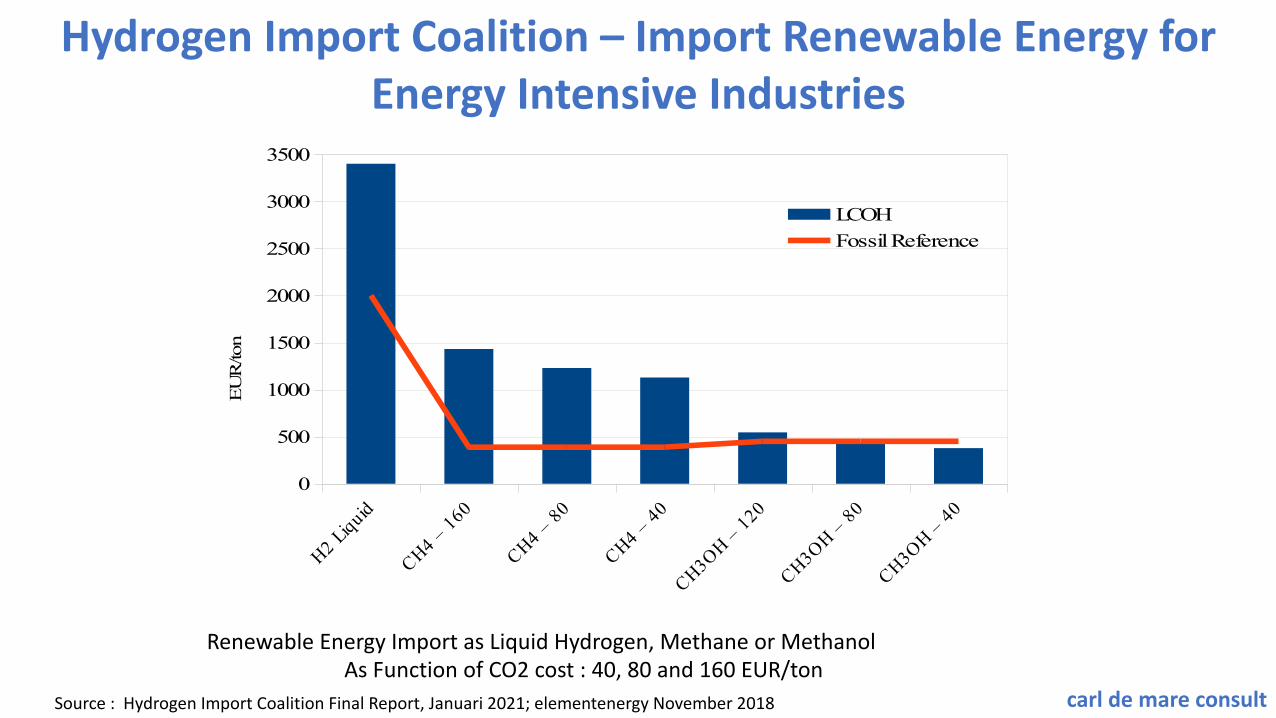
Hydrogen Import Coalition – Import Renewable Energy for Energy Intensive Industries
H2 Liquid
CH4 – 160
CH4 – 80
CH4 – 40
CH3OH – 120
CH3OH – 80
CH3OH – 400
500
1000
1500
2000
2500
3000
3500
LCOHFossil Reference
EU
R/to
n
Renewable Energy Import as Liquid Hydrogen, Methane or MethanolAs Function of CO2 cost : 40, 80 and 160 EUR/ton
Source : Hydrogen Import Coalition Final Report, Januari 2021; elementenergy November 2018
carl de mare consult
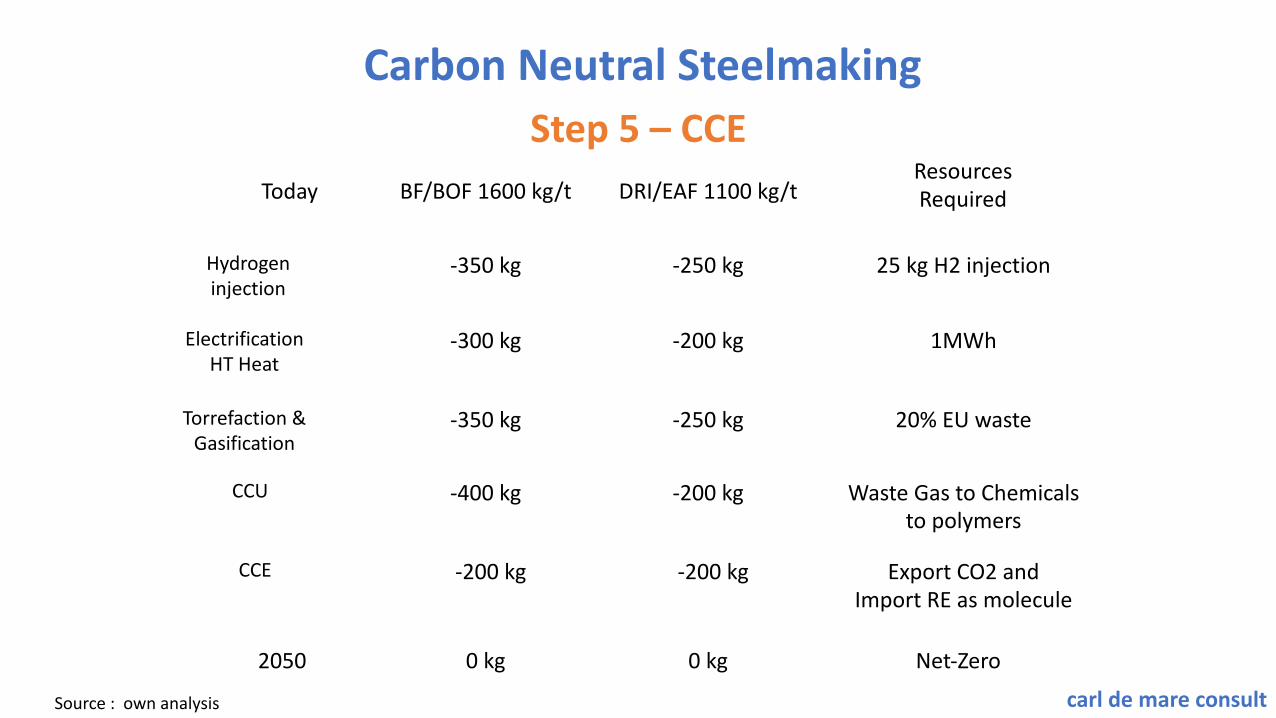
Carbon Neutral Steelmaking
Hydrogeninjection
ElectrificationHT Heat
Torrefaction &Gasification
CCU
25 kg H2 injection-350 kg -250 kg
BF/BOF 1600 kg/t DRI/EAF 1100 kg/t
1MWh -300 kg -200 kg
20% EU waste-350 kg -250 kg
Waste Gas to Chemicalsto polymers
-400 kg -200 kg
0 kg 0 kg
Today
2050 Net-Zero
Step 5 – CCE
Source : own analysis
CCE Export CO2 and Import RE as molecule
-200 kg -200 kg
ResourcesRequired
carl de mare consult
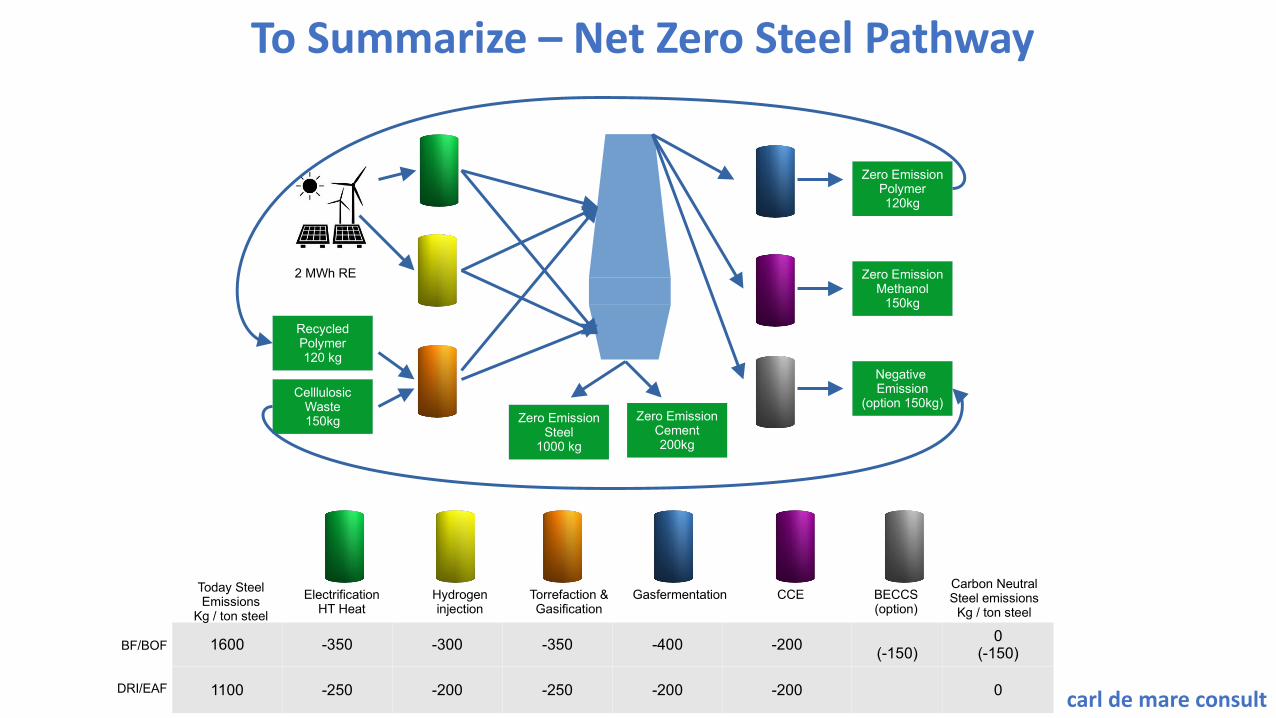
To Summarize – Net Zero Steel Pathway
ElectrificationHT Heat
Hydrogeninjection
Torrefaction &Gasification
Gasfermentation CCE
CelllulosicWaste150kg
RecycledPolymer120 kg
Zero EmissionPolymer120kg
Zero EmissionMethanol
150kg
Zero EmissionSteel
1000 kg
Zero EmissionCement200kg
BECCS(option)
Negative Emission
(option 150kg)
2 MWh RE
1600 -350 -300 -350 -400 -200(-150)
0(-150)
1100 -250 -200 -250 -200 -200 0
Today Steel Emissions
Kg / ton steel
BF/BOF
DRI/EAF
Carbon Neutral Steel emissions
Kg / ton steel

carl de mare consult
Net Zero Steel - Key Enabling Technologies
Are commercial or currently in demonstration at scale
Are compatible with both BF and DRI
Are scaled upto realistic supply constraintsat optimal costs
Can be deployed stepwise and in parallel without risk of carbon lock-ins
ElectrificationHT Heat
Hydrogeninjection
Torrefaction &Gasification
Gasfermentation CCE
CelllulosicWaste150kg
RecycledPolymer120 kg
Zero EmissionPolymer120kg
Zero EmissionMethanol
150kg
Zero EmissionSteel
1000 kg
Zero EmissionCement200kg
BECCS(option)
Negative Emission
(option 150kg)
2 MWh RE
1600 -350 -300 -350 -400 -200(-150)
0(-150)
1100 -250 -200 -250 -200 -200 0
Today Steel Emissions
Kg / ton steel
BF/BOF
DRI/EAF
Carbon Neutral Steel emissions
Kg / ton steel

carl de mare consult
Carbon Neutral Steelmaking needs a New Narrative
Two conflicting narratives are paralyzing climate actions in the Steel Industry
CCS Narrative Hydrogen Narrative
1. Lack of FlexibililtyDeterministic
Fit with 1 EndgameNot Robust for “Black Swans”
2. ”Law of Diminishing Return”Increasing costs with scaling up to 100%
Source : Int J. of Greenhouse Gas Control, December 2020

carl de mare consult
0 10 20 30 40 50 60 70 80 90 100
Abatement cost per ton steel
CO2 surplus to CCS
%H2 in the reduction gas
100% Carbon basedLow Revenu from CCUHigh cost for CO2 export
100% Hydrogen basedZero Revenue from CCUHigh cost of reduction gas
Optimal Carbon:Hydrogen MixHigh revenu from CCULow cost for CO2 export
The Smart Carbon Narrative
Source : own analysis
A.
Hydrogen Narrative (B)100% Hydrogen based
High cost H2 + costly adaptations to iron and steelmaking process
Zero revenu from CCU
Smart Carbon Narrative (C)Mixed carbon and hydrogen
High revenu from CCU and waste recyclingOptimal scale for each key enabling
technology
CCS Narrative (A)100% Carbon based
High cost for CCSLow revenu from CCU by-products
B.
C.
100% Carbon based 100% Hydrogen based

carl de mare consult
To Conclude
Carbon Neutral Steelmaking is creating new opportunities to use hydrogen and carbon.
Traditional CCS and Hydrogen Narratives are conflicting and paralyzing Climate Actions in the steel sector.
This new Smart Carbon Narrative is integrating existing key technologies at their optimal scale and bringing new solutions for Climate as well as for Circular Economy at the lowest cost for society.
Deployment of the key technologies is compatible with both BF as DRI plants and can be done stepwise and in parallel without risk of carbon lock-ins.
The Steel Sector will be in the center of the “Just Transition” to a Carbon Neutral Eco system, creating jobs and prosperity in a sustainable way.
“Why both Hydrogen and Carbon are Key for Carbon Neutral Steelmaking”
carl de mare consult
Thank you for your Attention
Mail: [email protected]
@carl_mare
LinkedIn: Carl De Maré


