Why data? Mississippi River Hills February 17, 2006 Amy Lake, Extension Associate Community Policy Analysis Center University of Missouri-Columbia 230 Middlebush Hall Columbia MO 65211 573-882-5412 [email protected]
Transcript
Why data?Mississippi River HillsFebruary 17, 2006
Amy Lake, Extension AssociateCommunity Policy Analysis Center
University of Missouri-Columbia230 Middlebush HallColumbia MO 65211
Community Policy Analysis CenterUniversity of Missouri-Columbia
CPAC's Mission:
To provide research, outreach and training that supports improved policy decisions
affecting communities
http:www.cpac.missouri.edu
CPAC partnerships with communities Objectives for Community Decision Support
Enhanced quality of community information Improved access to information for all citizens Broader participation in decision making Improved capacity for "what-if" analysis
Questions that Communities Ask Something just happened in our community. What does it mean? How important is this industry to our economy? What can we do to improve the quality of life in our community?
How CPAC Works with Communities The project is community-directed CPAC's objective is decision support A CPAC project is a partnership
Community Enterprise and Entrepreneurial Development
(CEED) New UMC Extension program Five pilot projects received grants in MO 2005 CEED interim director: Karen Dabson
Amy Lake’s role Mississippi River Hills’ CEED “Liaison” to the UMC
(member of CEED Core Team) Help MRH partners find necessary TA and information
available through UM Provide CEED Program with feedback from you
Letitia Johnson, Ste. Genevieve Extension, about MS River Hills Project“If there are only two words you remember from
this presentation, remember…
REGIONAL IDENTITY”
Regional identity means…
Need regional data,
research and evaluation to
1. Make better decisions
2. Show effectiveness of project
Dr. Ray Massey, MU Dept of Ag Economics, about Horizon Point Weather
“PRECISE” information “PROCESSED” information “For better MANAGEMENT decisions”
“Accurate information” is a relative term
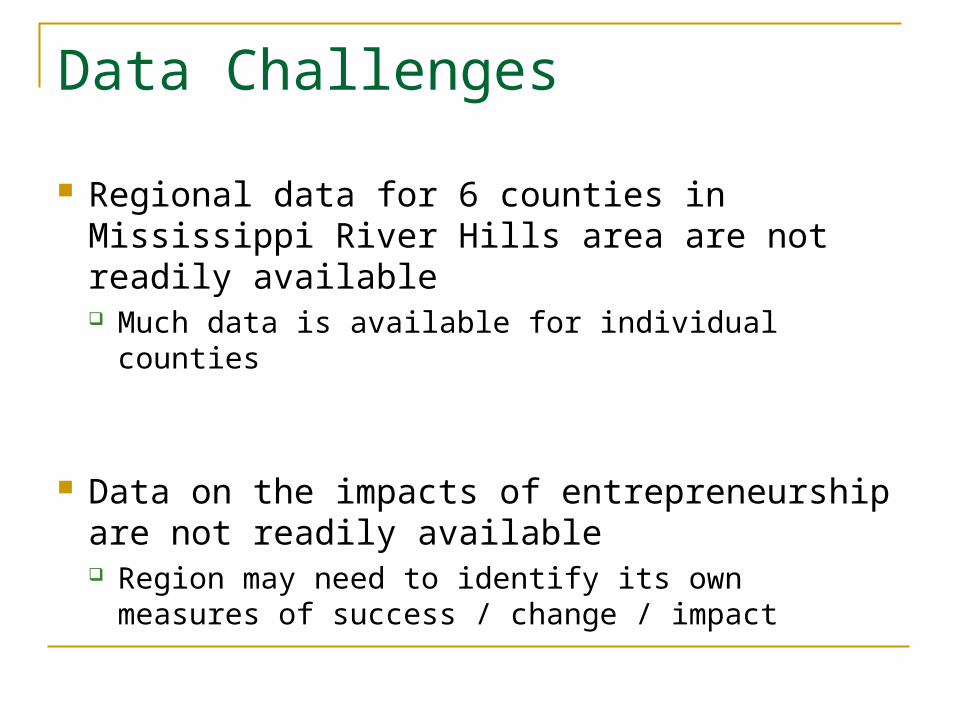
Data Challenges
Regional data for 6 counties in Mississippi River Hills area are not readily available Much data is available for individual counties
Data on the impacts of entrepreneurship are not readily available Region may need to identify its own measures of
success / change / impact
Data collection process
1. Review and summarize previously completed assessments / research on region
2. Conduct community or regional assessment General Focus: population, socioeconomic, business,
public revenue and expenses Specific Focus: Entrepreneurial Climate
3. Have public meeting to review data
4. Identify issues to follow up
5. Follow-up: primary data collection
6. REPORT INFO IN USABLE FORMAT
Source: Bureau of Economic Analysis BEARFACTS
Per Capita Personal Income 2003
$31,472$29,464
$27,895$26,352
$22,918$21,391
$23,254
$24,083
$-
$5,000
$10,000
$15,000
$20,000
$25,000
$30,000
$35,000
US MO CapeGirardeau
Jefferson Perry St.Francois
Ste.Genevieve
Scott
US
MO
Cape Girardeau
Jefferson
Perry
St. Francois
Ste. Genevieve
Scott
Source: Bureau of Economic Analysis BEARFACTS
Annual Average Growth for Per Capita Personal Income1993-2003
4.4%
4.0%4.0%
4.6%
4.5%
3.9%
4.3%
4.2%
3.4%
3.6%
3.8%
4.0%
4.2%
4.4%
4.6%
4.8%
US MO CapeGirardeau
Jefferson Perry St. Francois Ste.Genevieve
Scott
Place
Per
cen
tag
e
US
MO
Cape Girardeau
Jefferson
Perry
St. Francois
Ste. Genevieve
Scott
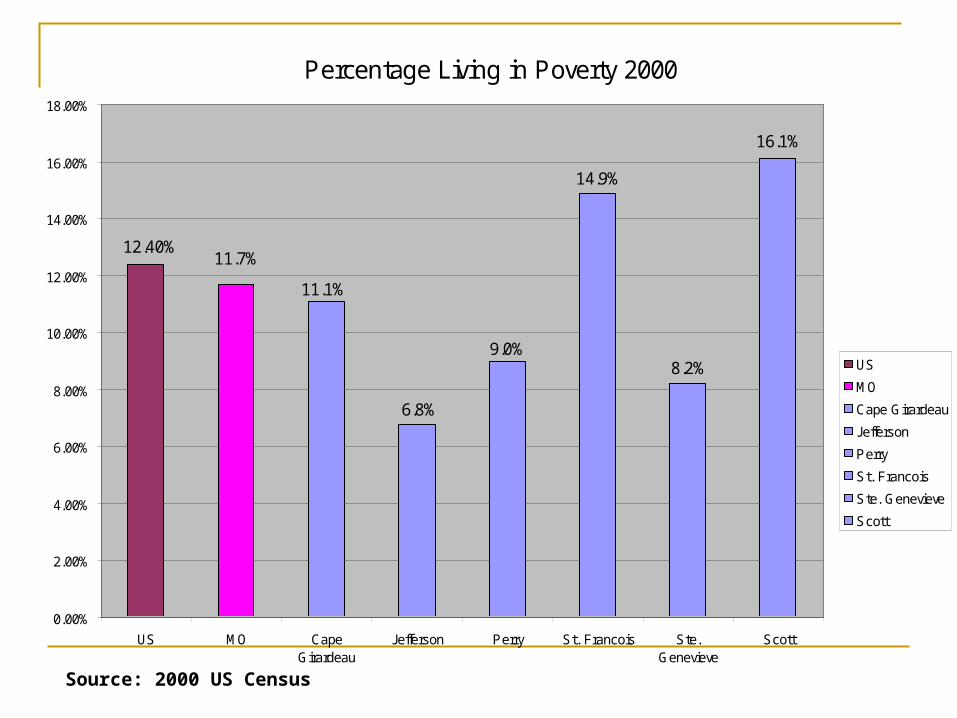
Percentage Living in Poverty 2000
16.1%
8.2%
14.9%
9.0%
6.8%
11.1%
11.7%12.40%
0.00%
2.00%
4.00%
6.00%
8.00%
10.00%
12.00%
14.00%
16.00%
18.00%
US MO CapeGirardeau
Jefferson Perry St. Francois Ste.Genevieve
Scott
US
MO
Cape Girardeau
Jefferson
Perry
St. Francois
Ste. Genevieve
Scott
Source: 2000 US Census
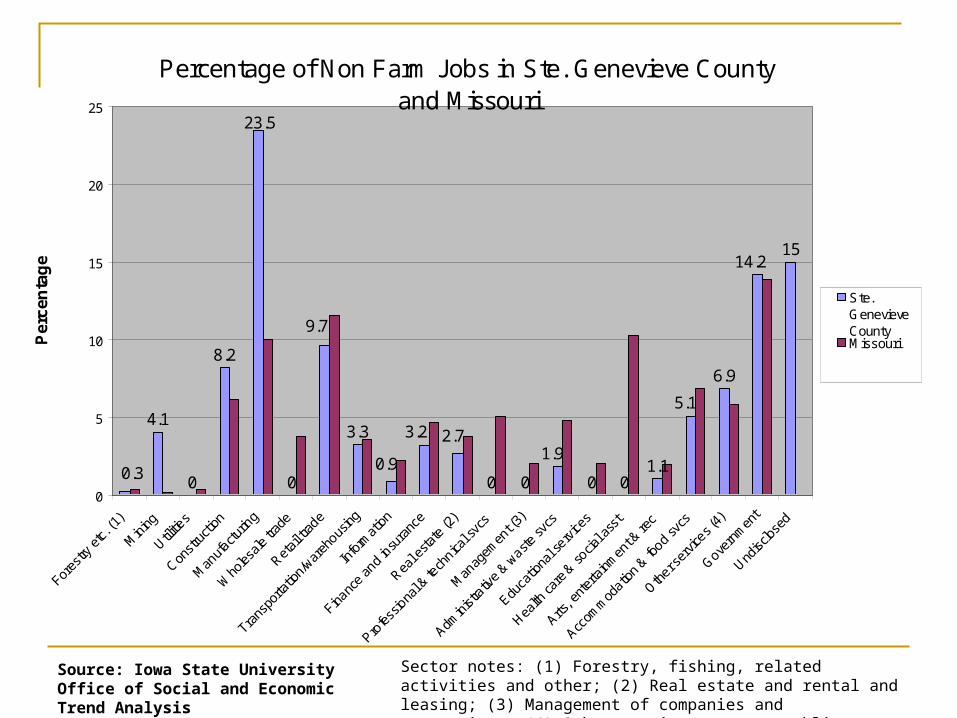
Source: Iowa State University Office of Social and Economic Trend Analysis
Sector notes: (1) Forestry, fishing, related activities and other; (2) Real estate and rental and leasing; (3) Management of companies and enterprises; (4) Other services, except public administration
Percentage of Non Farm Jobs in Ste. Genevieve County and Missouri
4.1
0
8.2
0
3.3
0 0 0 01.1
6.9
1514.2
5.1
23.5
2.73.2
0.31.9
0.9
9.7
0
5
10
15
20
25
Per
cen
tag
e
Ste.GenevieveCountyMissouri
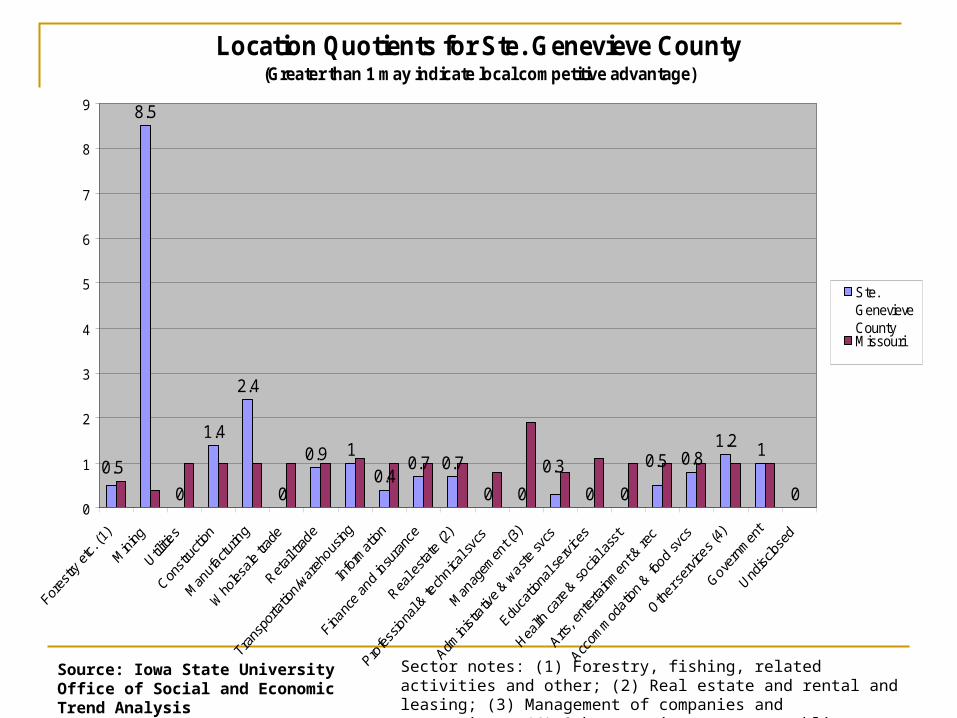
Location Quotients for Ste. Genevieve County(Greater than 1 may indicate local competitive advantage)
8.5
0
1.4
2.4
0
0.9 1
0.40.7 0.7
0 0 0 0
0.81.2 1
0
0.5 0.50.3
0
1
2
3
4
5
6
7
8
9
Ste.GenevieveCountyMissouri
Source: Iowa State University Office of Social and Economic Trend Analysis
Sector notes: (1) Forestry, fishing, related activities and other; (2) Real estate and rental and leasing; (3) Management of companies and enterprises; (4) Other services, except public administration
Farm Employment as a Total Employment
14.3%
11.7%
9.7%
3.5%
5.8%
4.3%
1.9%2.3%
3.3%
0.0%
2.0%
4.0%
6.0%
8.0%
10.0%
12.0%
14.0%
16.0%
1980 1990 2000
Pe
rce
nta
ge
Ste. Genevieve County
Missouri
United States
Source: Iowa State University Office of Social and Economic Trend Analysis
Source: Iowa State University Office of Social and Economic Trend Analysis
Source: Iowa State University Office of Social and Economic Trend Analysis
Source: Iowa State University Office of Social and Economic Trend Analysis
Source: Iowa State University Office of Social and Economic Trend Analysis
Source: Iowa State University Office of Social and Economic Trend Analysis
Source: Iowa State University Office of Social and Economic Trend Analysis
Recent research / secondary data
Entrepreneurship in Missouri
http://oseda.missouri.edu/meric/index.shtml
By
OSEDA
(Office of Social and Economic Data Analysis)
and
MERIC
(MO Economic Research and Information Center
MO Department of Economic Development)
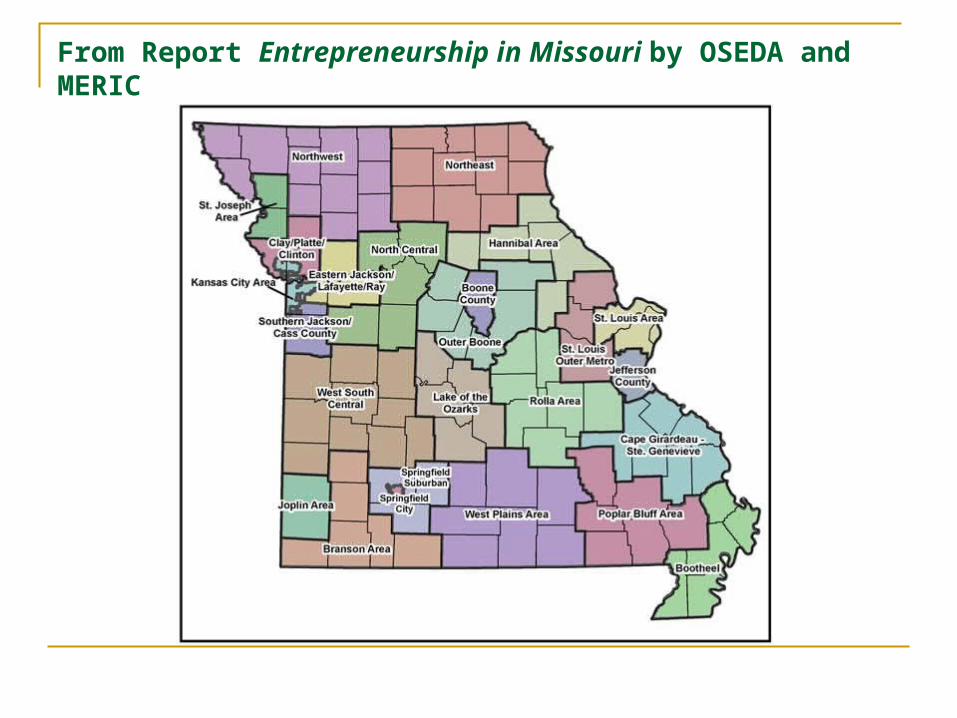
From Report Entrepreneurship in Missouri by OSEDA and MERIC
From Report Entrepreneurship in Missouri by OSEDA and MERIC
Definition of Entrepreneur
Full-Time Entrepreneurs are defined as those individuals who either report over 50 percent of their total income as self employment income or who classify themselves as self employed in either an incorporated or an unincorporated business.
Part-Time Entrepreneurs are defined as those individuals who report between 20 and 50 percent of their total income as self employment income. Since many full-time business owners begin with a part-time business, the goal of the part-time self employment classification is to identify industries and occupations within regions that have the potential for significant business ownership and self employment income.
From Report Entrepreneurship in Missouri by OSEDA and MERIC
Cape Girardeau-Ste. Genevieve PUMA
FULL-TIME E-ers
PART-TIME E-ers
Total PUMA Region Population over 18
Number 6,172 5,637 139,813
Income from self-employment $23,463 $3,074 $1,185
Total Income from all sources $25,961 $40,688 $22,582
Percentage below poverty 11.6% 8.3% 11.3%
High school graduate percentage 41.0% 36.8% 37.1%
Bachelors or Associate Degree percentage 14.4% 16.8% 14.0%
Do these data match our needs? Do these data answer our question? Region ? Definition of Entrepreneur ? What else do we want to know about
entrepreneurs in the region?
How can we get data that answers our questions?
CEED Project Data Questions
Is the number of entrepreneurs increasing? Are entrepreneurs’ sales/profits of local produced
products increasing as a result of the project? Is the region drawing more tourists for longer visits?
Are tourists aware of or visiting more regional businesses? How much money are they spending and what are they spending it on?
Are local residents purchasing locally produced products?
Is there potential to use internet to increase sales? If so, how?
Reasons for community (MS River Hills ) to analyze and collect data Learn more about yourself Understand the effects of your project (MO Regional
Cuisines Project / CEED grant) Understand change and trends over time Share information with others about the project Identify potential opportunities for collaboration and
challenges to be addressed collectively Human resources issues, marketing issues
Make better business / project / policy decisions Improve ability to access outside TA and grants
Outsiders’ reasons for collecting and analyzing data in MS River Hills Outside researcher reasons
Replicate project in other places Develop best practices to share with others Affect policy at local, state, regional level Develop professional research portfolio Institutional requirements of profession Job satisfaction
Outside funder / grantmakers’ reasons Ensure that investment will be / was worthy
Entrepreneurs:is the number increasing?
Who are the ENTREPRENEURS in the MS River Hills area? Secondary data: Age, residence, business type,
other employment, education, gender Primary data: Goals, experience, commitment to
MO products, marketing preferences, challenges ? Internet sales
Customers
Secondary data: local tourism boards Primary data:
Customer survey: Length of stay, residence, number, type and location of businesses visited, how found out about place/business, amount of money spent on different purchases (gas, hotel, gifts, etc), return customer/intent to return
Local business survey: customer base and draw, total sales, average sales amount, marketing strategies and goals, opportunity for cooperation


![de partido a su piscina… - BINDER · Tipo BGA 160 BGA 215 BGA 275 BGA 320 BGA 430 BGA 550 BGA 600 BGA 1200 Tensión de conexión [VAC] 230 230 230 230 230 230 230 230 Rango de frecuencia](https://static.documents.pub/doc/80x56/5c132e8509d3f26c7c8c5e0d/de-partido-a-su-piscina-binder-tipo-bga-160-bga-215-bga-275-bga-320-bga-430.jpg)


