Why did the Democrats Lose the South? Bringing New Data to an Old Debate PRELIMINARY DRAFT. PLEASE DO NOT CITE WITHOUT PERMISSION. COMMENTS WELCOME. Ilyana Kuziemko and Ebonya Washington * July 3, 2015 Abstract Did Southern whites leave the Democratic Party over Civil Rights or because eco- nomic development and other secular changes in the region made the party’s platform increasingly unattractive to them? Answering this central question in American po- litical economy has been hampered by lack of micro-data on racial attitudes from both before and after the Civil Rights era. Our contribution is to uncover and employ such measures, drawn from Gallup surveys dating back to 1958. From 1958 to 1961, conservative racial views strongly predict Democratic identification among Southern whites, a correlation that disappears after Democrats introduce sweeping Civil Rights legislation in 1963. Gallup’s monthly presidential approval surveys allow us to more finely link variation in white support for Kennedy (and Eisenhower before him) to episodes where newspapers linked his name to Civil Rights initiatives (and allows us to eliminate other policy initiatives and current events as drivers of white Southern dealignment from the Democrats). We conclude that the entire 17 percentage-point decline in relative white Southern Democratic identification between 1958 and 1980, and 75% of the 20 percentage-point decline from 1958 to 2000, is explained by racial attitudes, with little if any role for income growth or other observable secular changes. Keywords: Party identification; Civil Rights movement * We thank Frank Newport and Jeff Jones for answering our questions about the Gallup data. We are grateful to seminar participants at Middlebury, NYU, Pomona, Princeton, UBC, UCLA and Yale’s CSAP Summer conference, particularly discussant Georgia Kernell, for comments and feed- back. Khurram Ali, Jimmy Charit´ e, Jos´ ephine Gantois, Keith Gladstone, Meredith Levine, Chitra Marti, Jenny Shen and Timothy Toh provided truly exceptional research assistance. Kuziemko: [email protected]; Washington: [email protected].
Transcript
Why did the Democrats Lose the South? Bringing New
Data to an Old Debate
PRELIMINARY DRAFT. PLEASE DO NOT CITE WITHOUT
PERMISSION. COMMENTS WELCOME.
Ilyana Kuziemko and Ebonya Washington∗
July 3, 2015
Abstract
Did Southern whites leave the Democratic Party over Civil Rights or because eco-
nomic development and other secular changes in the region made the party’s platform
increasingly unattractive to them? Answering this central question in American po-
litical economy has been hampered by lack of micro-data on racial attitudes from
both before and after the Civil Rights era. Our contribution is to uncover and employ
such measures, drawn from Gallup surveys dating back to 1958. From 1958 to 1961,
conservative racial views strongly predict Democratic identification among Southern
whites, a correlation that disappears after Democrats introduce sweeping Civil Rights
legislation in 1963. Gallup’s monthly presidential approval surveys allow us to more
finely link variation in white support for Kennedy (and Eisenhower before him) to
episodes where newspapers linked his name to Civil Rights initiatives (and allows us
to eliminate other policy initiatives and current events as drivers of white Southern
dealignment from the Democrats). We conclude that the entire 17 percentage-point
decline in relative white Southern Democratic identification between 1958 and 1980,
and 75% of the 20 percentage-point decline from 1958 to 2000, is explained by racial
attitudes, with little if any role for income growth or other observable secular changes.
Keywords: Party identification; Civil Rights movement
∗We thank Frank Newport and Jeff Jones for answering our questions about the Gallup data.We are grateful to seminar participants at Middlebury, NYU, Pomona, Princeton, UBC, UCLA andYale’s CSAP Summer conference, particularly discussant Georgia Kernell, for comments and feed-back. Khurram Ali, Jimmy Charite, Josephine Gantois, Keith Gladstone, Meredith Levine, ChitraMarti, Jenny Shen and Timothy Toh provided truly exceptional research assistance. Kuziemko:[email protected]; Washington: [email protected].
1 Introduction
After nearly a century of loyalty and despite the general stability of Americans’ party iden-
tification in adulthood, Southern whites left the Democratic party en masse in the second
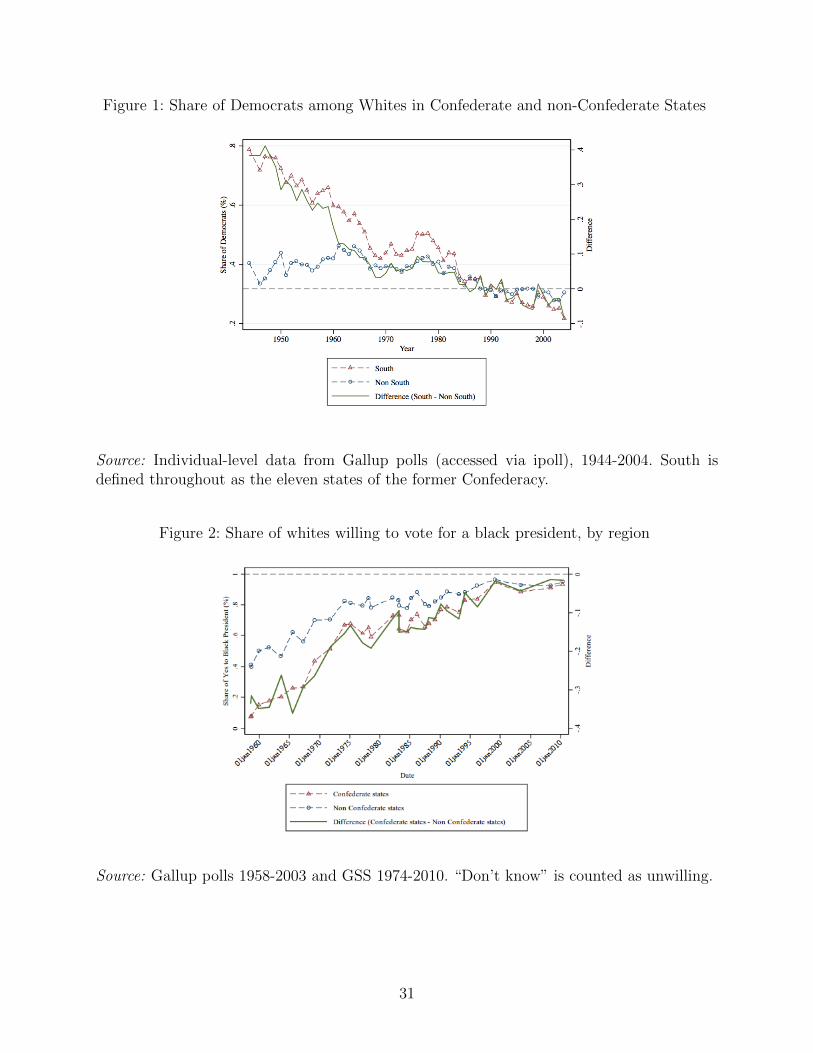
half of the twentieth century.1 As illustrated in Figure 1, at mid-century white Southerners
(defined throughout as residents of the eleven states of the former Confederacy) were 25
percentage points more likely to identify as Democrats than were other whites, a gap that
disappeared by the mid 1980s and has since flipped in sign.2 Despite the massive, concurrent
enfranchisement of Southern blacks, who overwhelmingly favored the Democrats from 1964
onward, the resulting shifts in aggregate Southern political outcomes were stark: to take but
one example, in 1960, all U.S. senators from the South were Democrats, whereas today all
but three (of 22) are Republican.
Did Southern whites leave the Democratic Party over Civil Rights or because economic
development and other secular changes in the South made the party’s platform increasingly
unattractive to them? This central question of American political economy remains unre-
solved. On one side of the argument are researchers who rely on more qualitative sources
(interviews, party platforms, correspondence and other historical sources) who conclude that
the Democratic Party’s liberal Civil Rights platform was the trigger for the exodus. On the
other side are scholars whose more quantitative methods (correlations using repeated cross-
sectional data, most typically cumulative file of the ANES, the American National Election
Surveys) point to other factors, chiefly economic development.
Indeed, the a priori case for factors besides Civil Rights is compelling. Southern dealign-
ment, though much accelerated during the 1960s, was (and perhaps still is) a slow moving
trend.3 As we detail in Section 4, voters viewed Civil Rights as the most important issue
facing the country for a fleeting two to three year period, undermining the case that it could
1Political scientists have found partisanship, like religion or ethnicity, to be a stable part ofan adult’s identity. The canonical reference is Campbell et al. (1966), with a more quantitativetreatment by Green et al. (2004).
2Authors’ calculation using Gallup micro data (more information on this data source is providedin Section 3). The eleven states of the former Confederacy are Alabama, Arkansas, Florida, Georgia,Louisiana, Mississippi, North Carolina, South Carolina, Tennessee, Texas and Virginia.
3We use the term “dealignment” instead of “realignment” in this paper as we focus on South-erners leaving the Democratic party—whether to join the Republicans, adopt independent status,or support third-party candidates such as Strom Thurmond or George Wallace. We therefore focuson the activities of the Democratic Party that repelled Southern voters rather than on efforts ofthe Republican Party to this population.
1
be the underlying cause of a fifty-year trend. Moreover, dealignment coincides with massive
economic catch-up in the region—from 1940 to 1980, per capita income in the South rose
from 60 to 89 percent of the U.S. average—which would predict a movement away from the
more redistributive party.4 Beyond economic catch-up, demographic change (driven by both
Northern Republican migrants and younger voters coming into the age of majority post-Jim
Crow) and the liberalization of the Democratic party on other issues such as abortion and
welfare may have pushed whites in the region out of the party.5
That such disagreement could remain on such a central question may seem surprising,
but data limitations have severely hampered research on this question. Until recently, survey
questions asked in a consistent manner from before and after the major Civil Rights victories
of the 1960s have not been widely available. For example, as we review in the next section,
those authors using the cumulative ANES to address the role of racial views on party align-
ment typically begin their analysis in the 1970s, well after the Civil Rights Act of 1964 and
the Voting Rights Act of 1965.
In this paper, we uncover and employ the missing measure of racial attitudes from both
before and after the Civil Rights movement, by turning to micro-data from Gallup surveys.
Beginning in 1958, Gallup asks respondents “Between now and ..[election]... there will be
much discussion about the qualifications of presidential candidates. If your party nominated
a well-qualified man for president, would you vote for him if he happened to be a Negro?”
Fortunately for our purposes, the wording has remained consistent and the question has been
asked repeatedly since that date.6 We refer to those who do not answer in the affirmative
to this question as having conservative racial views (“conservative” as in “believing in the
value of established and traditional practices in politics and society,” Merriam-Webster). To
our knowledge, these data represent the longest running time series on Americans’ attitudes
toward racial equality.
Having identified our measure of racial attitudes, we then define the pre- and post-periods
by determining the moment at which the Democratic Party is first seen as actively pursuing
a liberal Civil Rights agenda. Conventional wisdom of the race-as-cause view states that
President Johnson famously “lost the south” with his signing of the Civil Rights Act of
1964. However, marshaling contemporaneous sources, survey questions on issue importance
and views on political parties’ agendas as well as textual analysis of daily newspapers, we
4Authors’ calculation, Statistical Abstracts, various years.5We detail each of these arguments in the next Section.6Changes are very minor and are discussed in detail in Section 3.
2
identify the critical moment as Spring of 1963, during John F. Kennedy’s administration. In
Spring of 1963, Civil Rights is, for the first time, an issue of great importance to the majority
of Americans and an issue clearly associated with the Democratic Party.
The first part of our exploration on the role of racial views in explaining white Southern
dealignment focuses on a triple-difference analysis: how much of the post-period decrease
in Democratic party identification among Southern versus other whites is explained by the
differential decline among those Southerners with conservative racial attitudes? We find that
racial attitudes have little if any explanatory power for Northern whites’ party identification
in either period. In the South, conservative racial views strongly predict Democratic identifi-
cation in the pre-period, but this correlation is wiped out between August 1961 and August
1963 (the last poll of the pre- and the first poll of the post-period, respectively). Most im-
portant to the question at hand, the entire 17 percentage-point decline in Democratic party
identification between 1958 and 1980 is explained by the 19 percentage point decline among
Southern whites with conservative racial views. Extending the post-period through 2000,
77% of the 20 percentage-point drop is explained by the differential drop among Southern
whites with conservative racial views. This pattern of results is robust to controlling flexi-
bly for socioeconomic status measures included in the Gallup data and is highly evident in
event-time graphical analysis as well.
The second part of our exploration exploits higher-frequency variation provided again in
the Gallup micro data. Whereas Gallup only asks the black president question every one
to two years, it asks its signature “Presidential approval” question roughly once a month
during our sample period. We can thus perform a high-frequency analysis surrounding our
key moment of Spring of 1963 by correlating presidential approval (for John F. Kennedy)
in the South versus the non-South, with the daily count of newspaper articles that include
the President’s name along with terms related to Civil Rights. The most striking result is
the 35 percentage point drop in his support among whites in the South (compared to no
change in the North and a rise among blacks) between the April 6th and June 23rd 1963
Gallup polls (which corresponded to a surge of articles related to his support of protesters
during Martin Luther King’s Birmingham campaign in May and the president’s televised
announcement of the Civil Rights Bill on June 11th). This drop in support for Kennedy is
reflected in both survey data on his approval and on preferences in a hypothetical matchup
between Kennedy and Goldwater in anticipation of the following year’s presidential election.
Smaller Civil Rights moments (e.g., the integration of Ole Miss in September 1962) also
3
match up to significant dips in Kennedy’s relative approval among Southern whites.
In regression analysis, we find that relative white Southern approval of Kennedy is in-
versely related to the frequency with which the media mentions his name alongside Civil
Rights, but bears little relation to mentions of his name alongside other key issues of the day
(e.g., Cuba, tax policy), suggesting that our main results our unlikely driven by similarly
timed alternative policies or events. Moreover, a simple regression of approval on state fixed
effects and Civil Rights article counts explain over half the decline in relative white South-
ern approval of Kennedy during his administration, whereas no other issue (taxes, the Soviet
Union) explains more than 20%. Regressing the Republican Eisenhower’s approval on Civil
Rights-related article counts, we show that his smaller gestures toward Civil Rights cost him
among Southern whites as well.
Our work speaks to the large literature on whether political and policy preferences in the
US are motivated by class versus racial or ethnic identification. We find that, consistent with
work that argues that racial fractionalization helps explain “American exceptionalism” in
terms of limited redistribution (Alesina and Glaeser, 2004, Lee and Roemer, 2006, Luttmer,
2001), that during these key years racial attitudes explain the entire white Southern shift
away from the Democrats.
Our findings further shed light on redistributive patterns within the US. First, race-based
dealignment offers an explanation for why the poorest part of the country now serves as the
base for the anti-redistributive political party.7 Second, our findings provide an explanation
for why—in stark contrast to the median voter model’s prediction (Meltzer and Richard,
1981)— redistribution in the US has receded since the 1970s, even as income inequality has
risen. We show that a large voting bloc left the more redistributive political party over largely
non-economic issues, reducing political support for redistributive policies just when theory
would predict that they should begin to become more popular.
The paper proceeds as follows. In Section 2, we review the debate between the more
qualitative race-as-cause and more quantitative secular-trends-as cause sides of the literature.
In Section 3, we introduce the Gallup micro data, and in particular our key question on
racial attitudes. In Section 4, we justify our use of the Spring of 1963 as the key moment
that separates the “pre-” and “post-periods.” In Section 5, we present results both from
the triple-differences analysis as well as the high-frequency analysis on Kennedy’s approval.
7A recent policy manifestation of this pattern is the refusal of almost all Southern states toexpand Medicaid coverage to poor adults under the Affordable Care Act, despite the fact that theSouth remains the poorest region of the country (even when considering only whites).
4
In Section 6, we more directly address the remaining arguments of the research arguing for
causes besides Civil Rights. In Section 7 we offer some concluding thoughts and ideas for
future work.
2 Debate Over the Role of Race in Southern Dealignment
The literature on the role of race in Southern politics is vast, and our attempts to summarize
it here cannot do it proper justice. Almost all reviews start with V.O Key’s Southern Politics
in State and Nation. Key memorably wrote, “[w]hatever phase of the southern political
process one seeks to understand, sooner or later the trail of inquiry leads to the Negro”
(Key Jr, 1949). Drawing on hundreds of interviews with Southern politicians and journalists,
the book provides a state-by-state analysis of how race influenced Southern politics, but given
its 1949 publication cannot directly speak to the coming dealignment. Carmines and Stimson
(1989) is a modern update on this seminal work, using historical material (e.g., interviews,
party platforms, and speech transcripts) as well as some tabulations from the ANES to
argue that race was the motivating factor in the dealignment, as “racially conservative white
southerners felt betrayed” when President Lyndon Johnson, a Texan, navigated the passage
of the 1964 Civil Rights Act (CRA).8
Those who argue against race as the cause of dealignment emphasize the lack of quan-
titative backing for the race claim. Shafer and Johnston (2009) are quite emphatic in this
regard: “Yet if these propositions [our quantitative approach] appear almost elementary as
an analytic strategy, they bump up against an established literature of Southern politics—
charming and richly contextualized, but also unsystematic and deeply inbred.” But even on
the more quantitative side of the debate, few if any authors perform formal econometric
decompositions of the share of dealignment that can be explained by racial attitudes versus
other factors. The authors more typically employ the cumulative file of the ANES (and to a
somewhat lesser extent on the General Social Survey) to offer indirect evidence (often cross
tabulations) relating to the question.
8While this literature is primarily ethnographic, at times aggregate data are employed in adescriptive manner. For example, Carmines and Stimson point to the fact all five Deep South statesvoted majority Republican in 1964 (when Barry Goldwater, a staunch opponent of Civil Rightslegislation, was the candidate), four of which had not done so in 92 years. Authors exploring the“racial threat” hypothesis—the idea that whites fled the Democratic Party because of the threatposed by the inclusion of new black voters—support their argument with county-level negativecorrelations between the black population or black voter registration and white Democratic Partyregistration (see, for example, Kohfeld, 1989).
5
While some papers in the quantitative literature argue for the primacy of racial attitudes
in explaining dealignment, the majority argue that the role of Civil Rights and race has been
vastly overstated.9 We group these arguments into four main categories.
Economic growth in the South. Shafer and Johnston (2009) argue that income
growth in the South was the key driver of dealignment (and in fact contend that Civil
Rights, by introducing a strongly Democratic black voting bloc to the South, on net slowed
the natural process of dealignment). They show via cross tabulations that, relative to the
1950s, in more recent decades it is economically conservative Southern whites who identify as
Republican (they generally do not compare this trend to that among non-Southern whites).10
Also using the ANES cumulative file, Brewer and Stonecash (2001) run a regression
“horserace” between racial issues and income in predicting party identification and presiden-
tial and House support, again focusing on Southern whites in isolation. They find a larger
coefficient on income, though given limited ANES questions on race, their regression analysis
starts in the 1970s.11
Interestingly, economists who have studied the role of economic development in explaining
Southern dealignment have reached the opposite conclusion. Wright (2013) argues in fact
for a reverse causal chain. Using BEA annual data, he shows that while the South grew
rapidly during World War II, its growth stalled from 1945 until the late 1960s. He credits
the Civil Rights Act with the late-1960s economic surge in the South, meaning major exodus
of Southern whites from the Democratic party preceded the South’s real catch-up growth.12
Using IPUMS data, we find that the relative Southern catch-up is limited to 1960-1980,
9Quantitative papers that conclude that racial views are key to dealignment include Valentinoand Sears (2005), who use the GSS and cumulative ANES to show that, in the South relativeto elsewhere, whites report more racially conservative views and that racial views have greaterpredictive power for whites’ party identification. McVeigh et al. (2014) use county-level data toshow that the presence of a Ku Klux Klan (KKK) chapter in 1960 predicts higher vote shares forGoldwater (in 1964), George Wallace (in 1968), and more generally for Republicans in the electionssince.
10In a wide-ranging critique of Shafer and Johnston, Kousser (2010) argues that growing socialdesirability of progressive racial views may mean that in more recent years racially conservativewhites merely adapt the language of economic conservatism.
11Note that they are not decomposing what share of the change is explained by income versusracial views, but instead estimating which factor has greater explanatory power, separately bydecade.
12He argues that, before Civil Rights, Southern firms were in a bad equilibrium: they would havepreferred to sell to (hire from) both black and white clients (workers), but any one firm movingaway from the pre-1964 equilibrium might legitimately fear that its white clients (workers) couldabandon it for another firm.
6
consistent with this story (Appendix Figure A.1). Alston and Ferrie (1993) argue that the
sharp rise of mechanization in the cotton industry during the 1960s actually made Southern
elites more open to social insurance programs (and thus should have pushed them toward
the Democrats).13 Neither of these arguments would seem to imply that Southern economic
growth could have caused the mid-1960s nosedive in Democratic identification.14
Changing selection into the South. The South experienced net in-migration after
1960. Given the large Democratic advantage in the South during much of the 20th century, in-
migrants from the non-South would tend to be more Republican (Gimpel and Schuknecht,
2001 and Trende, 2012). However, Stanley (1988) uses ANES data to show that the vast
majority of the overall decline is accounted for by native Southern whites, as the migrant
population is simply too small to drive the effect. Age has also been considered as a dimension
of dealignment that weakens the race case: Wattenberg (1991) argues that Southern whites
who came of age since Jim Crow have in fact driven the dealignment, though Osborne et al.
(2011) finds that the shift has taken place among all cohorts.
Issues other than Civil Rights. Did Southern whites leave the Democratic Party, or
did the Democratic Party leave Southern whites, by taking more liberal positions on free
speech, abortion and issues other than Civil Rights? Abramowitz and Saunders (1998) lend
support for the latter view using the ANES to demonstrate that in the post-Civil Rights
period ideology (how liberal or conservative the respondent is), as well as views on social
welfare and security, are better predictors than racial views of Southern white partisanship.
Secular trend versus one-time decline. As we show in Section 4, Civil Rights was a
dominant issue for at most a few years in the mid-1960s. Trende (2012) argues that the secular
nature of Southern dealignment undermines the argument that Civil Rights was the prime
mover, driving home the point by highlighting the slow evolution of the relative Southern
Democratic vote share in presidential elections (which can be seen in Appendix Figure A.2).
He concludes that “the gradual realignment of the South had been going for nearly forty
years by 1964 and continued at a glacial pace after that.” He points to the 1960 election as a
key piece of evidence for secular causes: “That [Republican Richard] Nixon could do so well
in the South while part of an administration that had finished desegregating Washington,
13They argue that pre-mechanization, planter elites required a large, unskilled labor force, whichthey secured in part by providing informal social insurance (including physical protection fromother, more violent whites). They would lose the ability to uniquely provide this employmentbenefit were the government to universally guarantee it.
14Less quantitative work on the role of Southern economic development include Rorabaugh (2005)and Lassiter (2013).
7
argued that segregation was unconstitutional before the Supreme Court ... implemented
[desegregation] with a show of force in Little Rock, and pushed through the Civil Rights
Acts of 1957 and 1960 seems astonishing, until you realize that economics, rather than race,
was primarily driving the development of Southern politics at the time.” We discuss this
time series in detail in Section 6.1.
Although both large and contentious, the literature on the cause of dealignment has a
clear gap: Due to the limitations of standard data sets, existing quantitative work is unable
to examine racial attitudes before Civil Rights was a key political issue (and often several
years after that). Even Shafer and Johnston, the authors perhaps most associated with
the argument that economic development triggered dealignment, write: “Introducing racial
attitudes into the story of legal desegregation and a politics of race will prove more difficult
overall than introducing welfare attitudes into the story of economic development and a
politics of class, because there is less substantive consistency in the opinion items asked by
the [A]NES in the realm of race policy for the full postwar period.” Due to this limitation,
a standard econometric decomposition of the share of dealignment accounted for by those
with conservative racial views has not been possible.
As we describe in the following section, we have identified a consistent measure of racial
attitudes dating back to 1958 by turning to a data source little used by social scientists.
3 Data
An ideal research design would employ panel data on white voters to compare the extent
to which holding conservative racial views in the pre-period (before the Democratic party
is associated with Civil Rights) predicts leaving the Party in the post-period, in the South
versus the rest of the country. To the best of our knowledge, such panel data do not exist.
We instead use repeated cross-sectional surveys from Gallup (and later the restricted-access
version of the GSS) that each have the following key variables: a consistently worded measure
of racial attitudes, party identification, state of residence and race.
3.1 Gallup Surveys
Gallup, Harris and other commercial, academic and media surveys have been recently cata-
loged and in many cases made available for download on the website of the non-profit Roper
8
Center at the University of Connecticut.15 The 20,000 surveys deposited at Roper date as
far back as 1935 and cover topics such as foreign relations, health, economics, politics, and—
most relevant for our purposes—social issues including racial attitudes. It is our hope that
one contribution of this work will be to increase awareness and usage of Roper’s resources.
As noted in the introduction, beginning in 1958 Gallup repeatedly asks respondents
whether they would vote for a qualified man (“person,” in more recent years) who happened
to be Negro (“black”). While there are some small variations year to year, they are relatively
minor (e.g., sometimes specifying the “qualifications” in terms of age and education), espe-
cially compared to other surveys during this time (we detail the deficiencies of the ANES in
this regard in Appendix C). Appendix Table B.1 documents the exact wording of this item
separately by survey date, as well as the wording of the question preceding it (often asking
about willingness to vote for members of other demographic groups). For ease of exposition,
we refer to this survey item as the “black president question.”
In addition to consistency, a second advantage of the survey item is that Gallup fielded
it quite frequently during our key sample period. The question is asked in nine separate
surveys between 1958 and 1972. While the question is asked less frequently after 1972, we
are fortunate that beginning in 1974 we can use the GSS (see Appendix Table B.2 for exact
wording and preceding question in the GSS) to help fill gaps. As such, between 1958 and
1980 (2000), the black president item (as well as the other variables we need for the analysis)
was collected by either Gallup or GSS on 14 (29) separate occasions.16
A final strength of the black president item is its specificity: it refers to a single, hypo-
thetical (at least during our key sample period) concept. For example, the GSS has, since
1972, asked whether the government should “help” blacks, which is not only vague but also
might be interpreted differently in 1972 than in 2000. Similarly, Gallup also queries white
respondents—much less frequently—about whether they would move if blacks came to reside
next door or in their neighborhoods in great numbers.17 But responses to these questions
15See http://www.ropercenter.uconn.edu/. Access is free to affiliates of institutional sub-scribers.
16The GSS fields this question in 1972 as well, but only in 1974 are state identifiers available (andeven then only in the restricted-use version of the data). In addition to the 1983 black presidentsurvey that we employ, the Roper catalog lists two additional surveys from 1983 that include thequestion. In one case the survey is not available for download. In the second case the codebookshows that the question is not actually included in the survey.
17Gallup also poses, again less frequently than the black president question, questions on schoolintegration, but unfortunately only directs these questions to parents of school-aged children, whichgreatly reduces sample sizes.
9
will vary not only by feelings about racial equality but also by the actual integration of one’s
present neighborhood, not to mention housing density (“next door” is a different concept
in an apartment building versus a farm). The black president question suffers from no such
contextual bias: it should be interpreted similarly for Southerners and non-Southerners, rich
and poor, urban and rural. Nonetheless, as we demonstrate in Appendix Table A.4 black
president is highly correlated with other GSS measures of racial attitudes,including questions
on interracial socializing, school integration, government aid to blacks, and agreeing with the
sentiment that blacks shouldn’t push themselves where they are not wanted.
While we believe the Gallup data has allowed us to make an important step forward
in answering the question at hand, these data are not without their limitations. The most
important given our context is limited control variables for income and place of birth (given
the arguments that Southern income growth and Northern migrants played key roles in
dealignment). Only six of ten of our Gallup surveys from 1958-1980 have income information;
none records state of birth. To rule out income and migration as alternative hypotheses we
turn to alternative data sources, most frequently the ANES. Begun in 1948, ANES is a
nationally representative repeated cross-sectional survey of the political and social opinions
of voting age Americans conducted in the fall of both midterm and presidential election
years.18
As the Gallup data are not familiar to most researchers, Appendix Table A.1 compare its
summary statistics to the IPUMS, splitting the sample by region and decade. Comfortingly,
demographics for each of these subsamples are quite similar across surveys.
3.2 Summary statistics
Table 1 provides summary statistics for our basic Gallup analysis sample (whites age 21 and
above who live in the continental US and have non-missing state data) from 1958 to 1980
(our standard sample period, though we demonstrate robustness to various endpoints), by
pre-and post-period.19 We once again see the large decline in southern Democratic Party
18The survey was fielded in presidential election years only from 1948-1952. State identifiers aremissing in 1948, so 1952 is the first year we can include in regression analysis.
19Both Gallup and GSS claim to be nationally representative surveys of adult Americans. Weuse the provided survey weights—the GSS for all years and Gallup for 1968 forward—to adjustfor sampling error. We are indebted to Jeff Jones at Gallup for his instructions on weighting olderGallup surveys. The age and residency restrictions used in our analysis sample allow us to focus ona demographic group that is consistently eligible to vote for President throughout our time period(as those between 18 and 20 as well as Alaskans and Hawaiians are ineligible in early years). The
10
affiliation across the two time periods. Not surprisingly, we also see a concurrent increase
in education and urbanicity in both regions. The ANES columns of the table demonstrate
similar demographic shifts in our analysis sample drawn from that dataset.
In Appendix Figure A.3 we graph the responses to the black president over time in the
combined GSS and Gallup samples, denoting the data set from which each point is drawn.
Note that this figure includes non-whites, whereas most of the analysis that follows does
not. In years where we have both GSS and Gallup data, the shares willing to vote for a
black president are nearly identical, suggesting that both surveys are collecting data from
very similar (presumably representative) universes. The series as a whole depicts a marked
increase in stated views on racial equality, at least as measured by this question. In 1958
fewer than 40% say they would be willing to vote for an equally qualified black candidate,
where by 1974 that share has nearly doubled.20
While Appendix Figure A.3 is interesting in demonstrating the rapid change that occurred
in attitudes toward race relations nationally, Figure 2 introduces the views of our analysis
sample, separately for the South and non-South.21 While only about ten percent of white
Southerners are willing to vote for a black person at the series’ beginning (versus just under
forty percent elsewhere), whites in both regions increase at the same (rapid) rate through
about 1970, after which point there is more (though never complete) Southern catch-up.22
For completeness, in Appendix Figure A.4 and A.5 we graph for all available years the
other two Gallup survey questions on racial attitudes: the questions that ask whether the
respondent would move if a black person moved next door or if blacks moved into the
neighborhood in great numbers. The same pattern of substantial (but incomplete) Southern
convergence holds.
state variable is necessary to identify residents of the former Confederacy, our definition of theSouth.
20The percentage willing to vote for a black person continues to increase but never hits 100 evenin the present day, though it is difficult to determine whether this result is due to racial attitudesor measurement error.
21In this focal sample we have roughly 2,000 observations per survey in the Gallup data and1,200 observations per survey in the GSS data.
22The small percentage of respondents who answer don’t know are grouped with those unwillingto vote for a black president throughout the paper. Results are robust to grouping them with thosewilling to vote yes or dropping them entirely.
11
4 Methodological Approach
4.1 Defining pre- and post-periods
A necessary first step in gauging the role of racial attitudes in Southern dealignment is to
determine the point at which the Democratic Party became associated with meaningful pro-
Civil Rights initiatives. From our twenty-first century vantage point, it is easy to view the
Civil Rights Act of 1964 and the Voting Rights Act of 1965 as the inevitable culmination
of a decades-long process including the integration of the armed services in the 1940s, the
Montgomery bus boycott of 1955-56, the integration of Little Rock High School in 1957 and
the Freedom Rides of 1961. In fact, these events were interspersed with many setbacks for the
movement. Not only was there no sense of the inevitability of Civil Rights victories, by the
early 1960s voters did not connect the movement, such as it was, to the Democratic Party.
As late as April 1960, the plurality of voters (28%) said the Republican Party was “doing the
most for Negroes,” 25% said the Democrats, with 19% saying there was no difference and
the remainder saying they had no opinion.23 Nor did most Americans view Civil Rights as
a pressing issue: for example, in all four presidential debates of 1960, only a single question
on the issue was asked.
Thus rather than choose the transition date based on events that from our modern day
viewpoint seem important, we analyze contemporaneous media and polling sources.
4.1.1 Evidence from the ANES: The shift occurs between 1960 and 1964
To pin down the transition date we would ideally employ a consistent repeated survey ques-
tion that asks respondents which party they believe will do more to promote equality between
whites and blacks. Unfortunately we were unable to find such a question. We come close,
however. Using the individual-year files of the ANES, we can compare a 1960 item asking
“which party is more likely to stay out of the question of whether white and colored children
go to the same schools” with 1964 and 1968 items asking which party is more likely to “see
to it that white and negro children go to the same schools.” Figure 3 shows that in 1960,
only 13% of Southern whites see the Democrats as the party pushing for school integration,
22% say Republicans, and the rest see no difference. Non-Southern whites see essentially no
difference between the parties on this issue in 1960.
23Summary statistics from Gallup survey fielded March 30 to April 4, 1960, accessed online viaipoll. Dataset ID: 1960-0626.
12
A dramatic shift occurs sometime between 1960 and 1964. By 1964, 45% of Southern
whites now see the Democrats as more aggressive on this issue, whereas the share seeing
Republicans as more aggressive has fallen to 16%. Non-Southerners’ assessment shifts simi-
larly. The large gap in voters’ perception of the parties on school integration that emerges
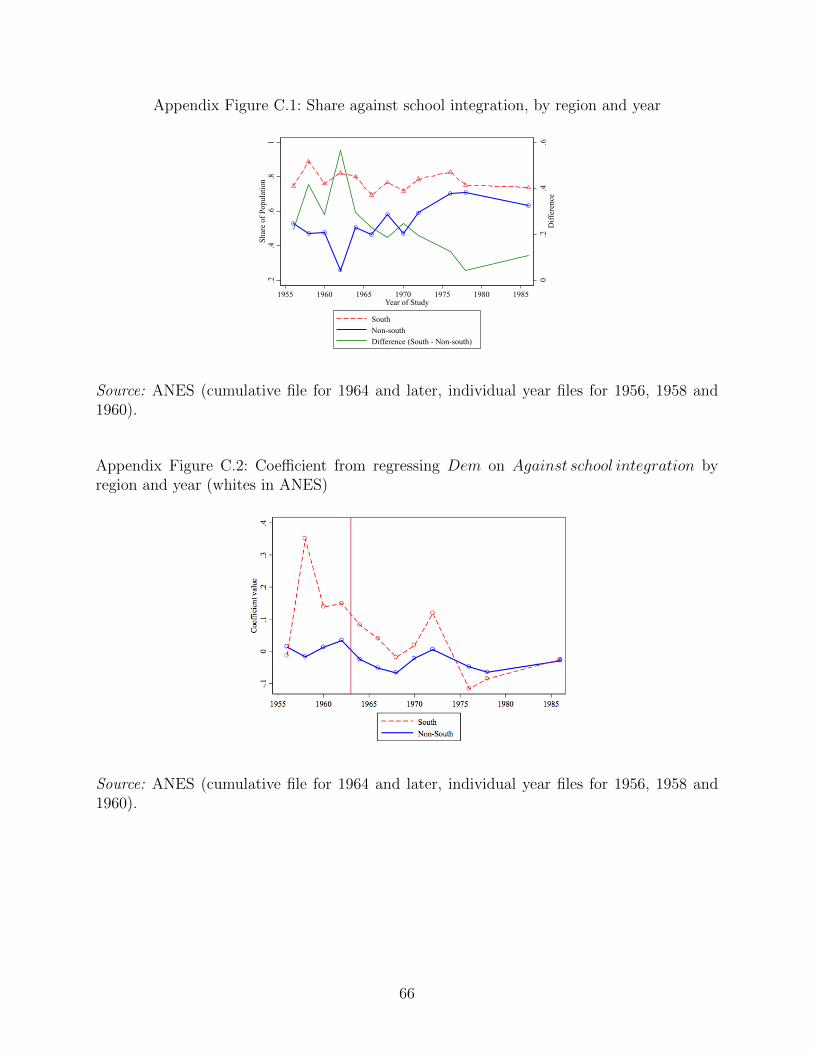
in 1964 holds steady in 1968.24 In Appendix Figure A.6 we show that the same shift occurs
on the question of which party most supports “fair” treatment for negroes in obtaining jobs
(and, in 1964, “jobs and housing”). The addition of “housing” in 1964 as well as the worry
that “fair” is interpreted differently in the South and elsewhere makes us prefer the school
integration question, but the result is robust to using this survey item.25
4.1.2 Evidence from newspapers: The shift occurs in Spring of 1963
The ANES, in asking views about parties’ positions on integration and racial equality, asks
almost the ideal question for helping us defne the moment when the Democrats become the
Civil Rights party in voters’ eyes. But unfortunately the question is asked so infrequently
that it only allows us to narrow down that critical date to somewhere between 1960 and 1964.
To further pinpoint that moment, we use higher-frequency data, but these data admittedly
provide somewhat less direct evidence.
The leader of the Democratic party during most of the 1960 to 1964 period was President
John F. Kennedy. Kennedy was not a consistent supporter of Civil Rights throughout his
presidency. Just as the Republican, Eisenhower, who preceded Kennedy, sent federal troops
to forcibly integrate Little Rock High School, Kennedy intervened to end both the violence
against the freedom riders in 1961 and attempts to bar James Meredith from integrating the
University of Mississippi in 1962. But Kennedy also disappointed movement leaders with his
inaction, including a January 1962 press conference pledging not to move ahead of public
opinion on Civil Rights and his appointment of segregationist federal judges in the South.
Thus it is not clear that voters could have predicted his June 1963 proposal of sweeping Civil
Rights legislation, even a few months before that date.26
24This result of a sharp mid-1960s change in the view of the Democratic Party’s position on CivilRights lends support to the Kousser (2010) crticism that by grouping data by decade Shafer andJohnston (2009) create a false image of continuity over a period in which there was actual a trendbreak.
25While there is an ANES fielded in 1962, it does not ask either of these questions.26Space constraints prevent us from detailing the relationship of President Kennedy (as well as
that of his brother Robert, the attorney general) to the Civil Rights movement. We direct readersto Branch (2007) and Perlstein (2009).
13
While we unfortunately do not have polling data that directly speaks to the evolution of
voters’ perception of Kennedy’s commitment to the issue, we turn to the NYT to track any
evolution he exhibited on the issue. In Figure 4 we tally daily counts of articles in which (1)
“President” and “Kennedy” and “civil rights” appear or (2) “President” and “Kennedy” and
any of the following terms: “civil rights,” “integrat*”, “segregat*,” where the asterisk is a
“wildcard.”27 While the former search hones in on the focal issue, it may miss articles related
to the civil rights that fail to use the stylized term. The expansivness of the second search is
both its advantage and disadvantage, because of the increasing likelihood of false positives.
The two series tell similar stories. Outside of two short-lived spikes–when the administration
intervenes on behalf of the freedom riders (Spring 1961) and James Meredith (fall 1962)—
the first two years of Kennedy’s administration see few mentions of his name alongside civil
rights terms.
It is not until May 1963—when Martin Luther King’s Birmingham campaign captured the
nation’s attention—that the number of articles begins a steep increase that hits a pinnacle
around the time of his televised proposal of Civil Rights legislation that June. And while the
number of articles drops slightly from that mid-June high it remains elevated above pre-May
1963 levels throughout the remainder of the presidency. Thus the NYT evidence points to
spring 1963 as the moment when Kennedy became linked with Civil Rights. The dramatic
change in voters’ views of his party’s position on Civil Rights in the ANES data suggests
that voters saw Kennedy’s evolution as reflecting that of the Democratic party more broadly.
4.1.3 Further corroborating evidence
The NYT data may reflect the views of a narrow, elite group of East Coast editors and may
not reach, much less reflect, average voters. In fact, Civil Rights coverage explodes in the
Spring of 1963 for the two largest Southern papers for which we can do a textual analysis:
the Dallas Morning News and the New Orleans Times-Picayune. In Appendix Figures A.7
we tally the number of articles with the term “civil rights” for these papers. Within the
year 1963, monthly searches of “civil rights” and “President Kennedy” demonstrate the
robustness of spring (in particular June) of that year as the time at which the number of the
articles linking the president to the issue skyrockets.28
27We searched for words “President” and “Kennedy” to exclude articles that only mention RobertKennedy, though in practice there is little difference.
28We performed this search in the summer of 2014 using Library of Congress state newspapersas well as Yale University subscriptions to ProQuest Historical Newspapers and 20th Century
14
A related concern is that newspapers, regardless of their regional focus, reflect the deci-
sions of editors, not the sentiment of the general public. We thus complement our newspaper
analysis with polling data. In the years 1950-1980, Gallup asks over 100 times “What do you
think is the most important problem facing this country today?” The responses are open
ended. This item has at least four limitations for our purposes. First, it is not asked on a
regular schedule. The question is fielded six times in 1962 but only once in the key year of
1963. Second, we are unable to produce analysis by race and region. In order to retain as
many data points as possible, we graph the frequencies using the website Gallup Brain rather
than reading in the data ourselves, which would mean losing those surveys without usable
data on ipoll. Third, in some surveys Gallup allows individuals to provide more than one
response to the most important problem question, which adds noise to our analysis. Finally,
Gallup does not code the responses consistently from survey to survey. In some surveys the
frequency responding “civil rights” is reported alone. In other surveys “civil rights” responses
are grouped with, for example, “racial problems, discrimination and states rights,” in other
surveys with “integration,” and in still others with “demonstrations.” For each survey, we
graph the frequency responding to the category that includes “civil rights,” so inconsistencies
arise year-to-year.
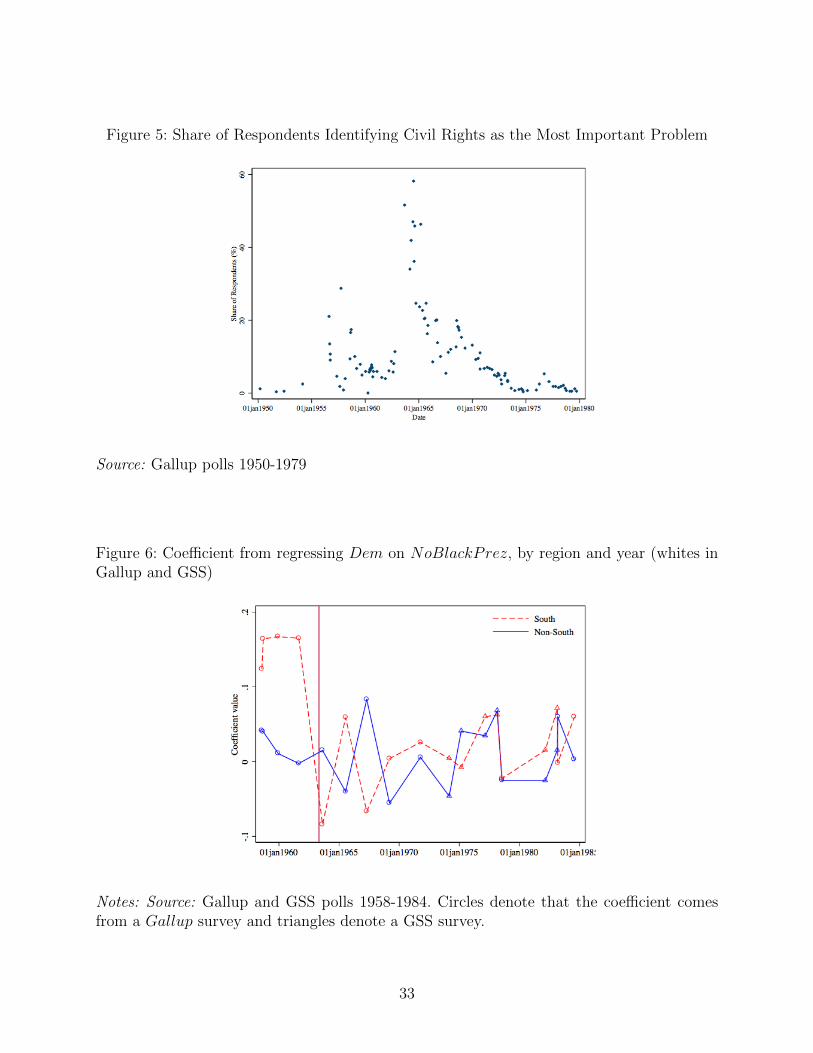
Those caveats notwithstanding, Figure 5 points once again to the great importance of
civil rights as an issue in the mid 1960s. Few respondents cite civil rights as important in
the early fifties. That number increases to as much as 20 and 30 percent in some surveys
in the late fifties. But it is in 1963 when the frequency reporting civil rights crosses the
50 percent threshold for the first time. Given the data limitations mentioned above, we
cannot replicate the analysis for all surveys by race and region, but in Appendix Table A.3
we do so for four key surveys: two from the low-importance early 1960s and two from the
high-importance mid-1960s. The levels differ in the expected manner—Southern whites and
all blacks care more about the issue than do non-Southern whites—and the issue takes on
heightened importance in the mid-1960s for all subgroups.
In summary, the ANES data show that views on the parties’ racial policies shift dramati-
cally between 1960 and 1964. Such a shift is unlikely to occur without important events that
generate media and public interest. Indeed, we show that in the Spring of 1963, the media
begins to link the Democratic president with Civil Rights in a heightened and sustained
manner unequaled before in his presidency. Moreover, media coverage of the issue as well as
American Newspapers.
15
public interest in Civil Rights explodes in 1963, suggesting that the shift in the positions of
the parties on this issue would be hard for voters to miss.
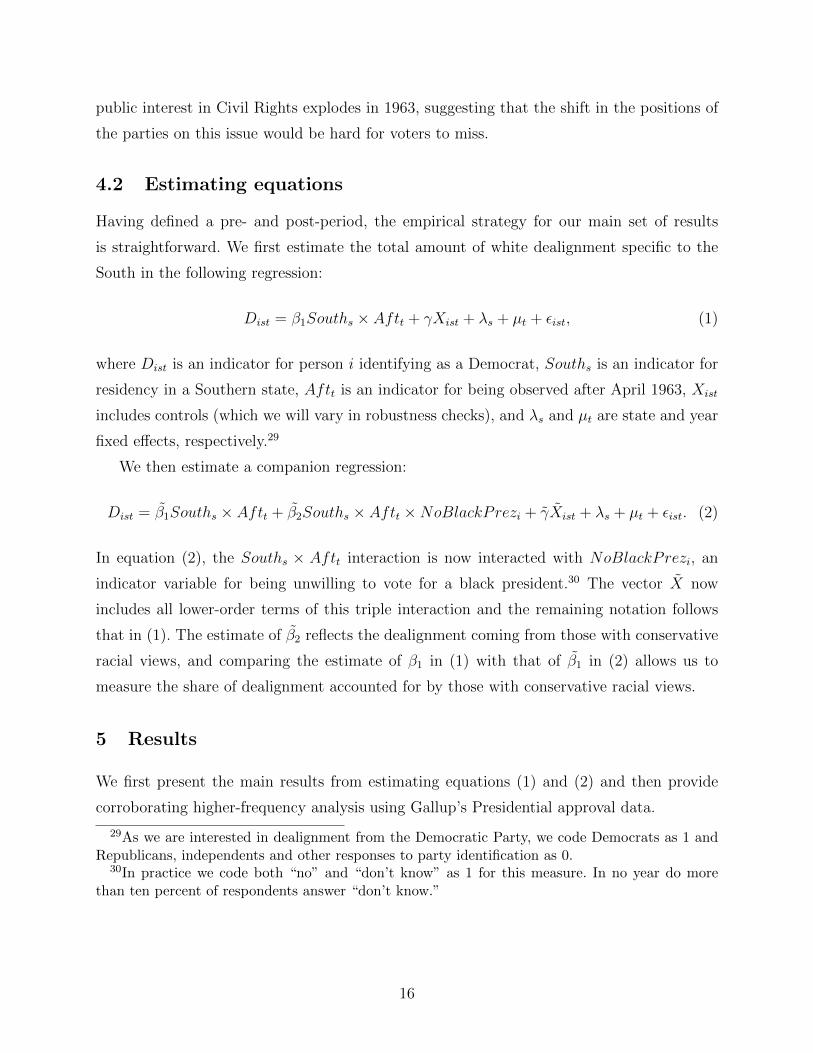
4.2 Estimating equations
Having defined a pre- and post-period, the empirical strategy for our main set of results
is straightforward. We first estimate the total amount of white dealignment specific to the
In equation (2), the Souths × Aftt interaction is now interacted with NoBlackPrezi, an
indicator variable for being unwilling to vote for a black president.30 The vector X now
includes all lower-order terms of this triple interaction and the remaining notation follows
that in (1). The estimate of β2 reflects the dealignment coming from those with conservative
racial views, and comparing the estimate of β1 in (1) with that of β1 in (2) allows us to
measure the share of dealignment accounted for by those with conservative racial views.
5 Results
We first present the main results from estimating equations (1) and (2) and then provide
corroborating higher-frequency analysis using Gallup’s Presidential approval data.
29As we are interested in dealignment from the Democratic Party, we code Democrats as 1 andRepublicans, independents and other responses to party identification as 0.
30In practice we code both “no” and “don’t know” as 1 for this measure. In no year do morethan ten percent of respondents answer “don’t know.”
16
5.1 Results using the “black president” question
5.1.1 Regression results
Table 2 presents the main results of the paper. For completeness and to provide a baseline,
col. (1) replaces state fixed effects with a South dummy and uses only Gallup (as opposed
to GSS) data from 1958 to 1980. Whereas Democrats had a 23 percentage point advantage
among whites in the South relative to the rest of the country, that advantage fell by 65%
in the post-period. In col. (2), we show that the South × Aft coefficient falls by 99% once
the triple interaction term is added, which is itself highly significant and negative, indicating
that essentially all the decline in Democratic Party alignment among white Southerners
comes from those with conservative racial views. The lower-order terms are of interest in
their own right. While not significant, whites outside the South who hold conservative racial
views move slightly away from the Democrat party, though neither in the pre- or post-period
are racial views highly predictive of white partisanship outside the South. The significant,
positive coefficient on South × NoBlack Prez highlights the strongly conservative racial
views that characterized the Southern Democratic party in the pre-period.
In the remainder of Table 2 we explore the robustness of this result. Gallup does not con-
sistently sample all states in all years, thus in cols. (3) and (4) as well as all remaining columns
we add state fixed effects to adjust for this variation. The comparison of South×After across
specifications is even more striking: In col (3) the coefficient is larger in magnitude than in
col(1). Yet the inclusion of NoBlackPrez and its interactions in the state fixed effect model
actually makes the South × After coefficient flip signs (though its magnitude is tiny). We
take these results are our “preferred specifications” and the resulting point estimates suggest
that the 18.6 point decline among Southerners with conservative racial views (very) slightly
overpredicts the full 16.7 point relative decline among white Southerners. In Cols. (5) and (6)
we add basic controls (age, city-size fixed effects, and educational attainment fixed effects)
to this specification, which barely moves the coefficients of interest.
Col. (7) adds interactions of South×Aft with, respectively, age, a high school completion
dummy, and a city size (categorical) variable (as well as all lower-order terms). While the
South×Aft interaction no longer has any meaningful interpretation, this specification tests
whether the strong, negative coefficient on South × Aft × NoBlackPrez is merely picking
up differential trends along these other dimensions. For example, perhaps rural Southerners
have more conservative racial views but differentially turn against the Democrats in the
17
post-period for reasons independent of Civil Rights (but for whatever reason do not outside
the South). In fact, even after allowing these covariates to have different effects in the South,
different effects in the post-period, and different effects in the South in the post-period, the
coefficient of interest again barely moves.
In the remaining columns, we add the GSS data (as control variables are not consistent
across the two datasets, we do not include them). Comparing cols. (8) and (9) to cols. (3) and
(4) shows that the results are nearly identical in this larger dataset. The final two columns
we keep the GSS data and extend the series to 2000. The point estimates suggest that the
decline among those with conservative racial views explains three-fourths of the 19.5 point
relative decline in the South over this longer period.31
5.1.2 Graphical results
Figure 6 shows our regression results in an event-time figure. Specifically, for each survey
date, we present the coefficient from regressing Democratic party ID on NoBlackPrez,
separately for the South versus others. The figure echoes the regression results (conservative
racial views strongly predict Democratic party identification in the South in the pre-period,
an association that is wiped out in the post-period) but unlike those results can show the
shift is better described as a one-time decline—occurring sometime between the 1961 and
1963 survey dates—and not a secular trend. Throughout the sample period, racial views
have limited predictive power over party identification among whites outside the South.
5.1.3 Robustness checks
Perhaps the key concern about our approach so far is that while the black president question
is worded consistently over time, the true attitudes of those who respond “yes” may change
because of the decreasing social desirability of conservative racial views over the sample
period.32 If socially desirable responses are increasing similarly in both the South and non-
31We conclude our analysis period in 2000. After Illinois State Senator Barack Obama’s 2004Democratic convention speech, heightened talk of his Presidential bid may have transformed theblack president item from a hypothetical question to a referendum on a particular individual.
32This concern is not merely hypothetical. For example, Kuklinski et al. (1997) use a cleverbetween-subject approach whereby the racial views of any one individual cannot be detected butthe racial views of large groups can be. They show that these “unobtrusive” measures of racialattitudes show white Southerners to have significantly more conservative racial views than otherwhites (at least in the mid-1990s), whereas standard survey questions (subject to social desirabilitybias) show much smaller differences.
18
South, then state fixed effects address this concern. But to the extent that our measure of
conservative racial views is increasingly poor in one region over the other, our results will be
biased.
We address this concern in two ways in Table 3. First, Figure 2 shows that from 1958 to
about 1970, the South non-South gap on this question remains relatively stable, suggesting
that social desirability bias may work similarly by region during these earlier years (and
it seems fair to assume this bias was simply smaller during earlier years and thus less
concerning). Cols. (1) and (2) demonstrate that our main result barely changes when we
restrict observations to this shorter period, not surprising given the patterns presented in
Figure 6.
Second, we use pre-1963 data to predict conservative racial views and then substitute this
predicted black president response for the actual response. The predicted conservative racial
views analysis of Cols (3) and (4) suggests an even larger role for racial views, suggesting,
perhaps, that social desirability adds noise to the actual black president question and thus
attenuates the results of the first two columns. The analysis suggests that Southerners with-
out (predicted) conservative racial views in fact increased their allegiance to the Democratic
party. Note that using the predicted instead of actual answer to the black president question
means we can expand the sample to the (many more) surveys that have the regressors used
in the prediction equation but do not have the black president question itself. In cols. (5)
and (6) we show that adding controls for predicted attitudes erases the negative coefficient
on South× After in this larger sample as well.
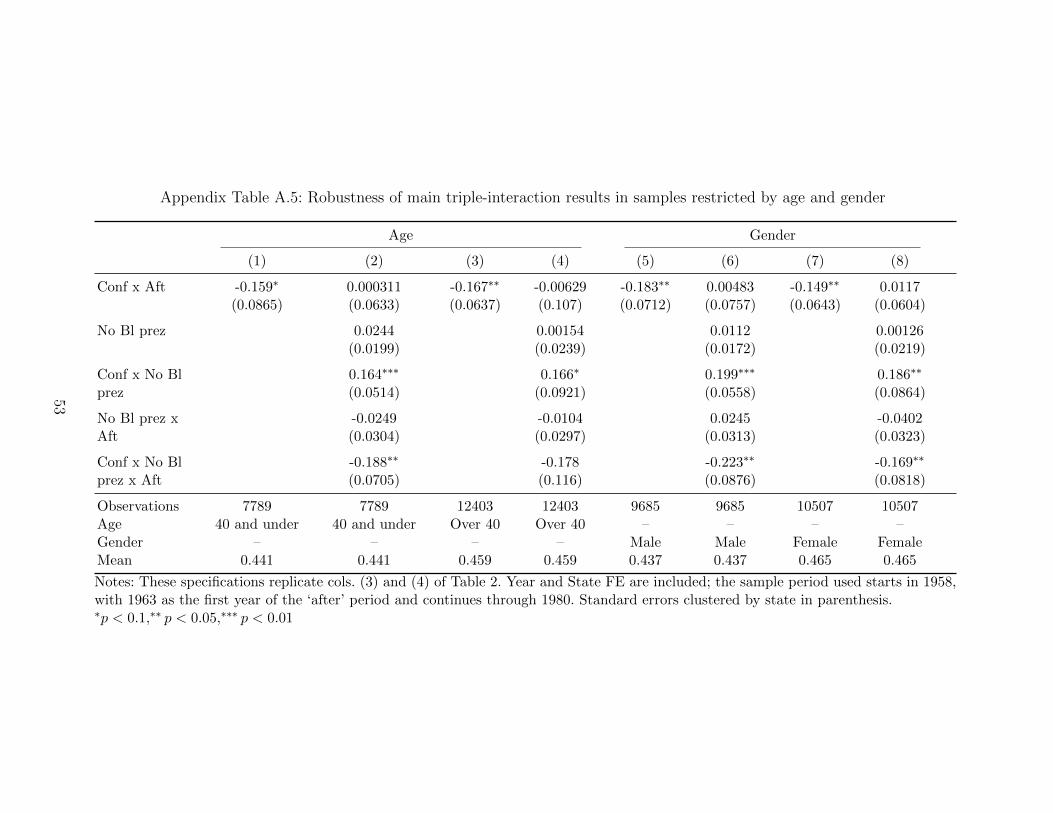
As final checks, in Appendix Table A.4 we demonstrate robustness of our preferred spec-
ification (cols. 3 and 4 of Table 2) to using a probit specification, breaking the non-South
control group into separate Census regions, and substituting “Republican ID” for the out-
come variable. In Appendix Table A.5 we show that results are qualitiatvely similar across
age (under and over 40) and gender.
5.2 Higher-frequency results from Gallup
The results of Figure 6 point to a sharp decline in the association of conservative racial
attitudes and white Southern identification with the Democratic Party between the summers
of 1961 and 1963, the time of the last pre-period and first post-period surveys that include
the black president question, respectively. Gallup does not ask the black president question at
a sufficiently high frequency that we can pin the key shift to the Spring of 1963, the moment
19
when, we earlier argued, voters first connect the Democrats to Civil Rights. We now turn to
alternative Gallup questions and a modified empirical strategy to more finely pinpoint the
transition moment of white Southern Democratic allegiance. We lose the ability to stratify the
analysis by racial attitudes, but we gain higher-frequency measures of Americans’ responses
to political news.
5.2.1 Presidential approval
During the 1960s, Gallup asked the following question roughly every month: “Do you approve
or disapprove of the way President is handling his job as President?”33 We find 25 usable
surveys that ask Kennedy approval, a question we use to examine how Southern white
approval (relative to non-Southern white approval) responds to presidential Civil Rights
news.34
Figure 7 tracks Kennedy’s approval among whites, separately for the South and non-
South. The most striking element of the figure is the more than 35 percentage point drop in
Southern approval around our critical period, the Spring of 1963, a period during which non-
Southern white approval is flat and black approval (Appendix Figure A.8) is increasing.35
More than half of this decrease occurs between the two polls (May 25 and June 23) that
surround Kennedy’s televised June 11 Civil Rights address. Thus this high frequency data
provides evidence to pinpoint spring 1963 as the critical date for dealignment.
In addition to allowing us to focus in on particular moments, these high frequency data,
along with our NYT searches on the mentions of Kennedy and Civil Rights allow us to ex-
pand our focus beyond Spring 1963 and ask how presidential approval correlates more gen-
erally with Civil Rights mentions. In Figure 8 we plot the difference in presidential approval
by region (South minus non-South) against the frequency of articles mentioning President
Kennedy and Civil Rights terms.36 We see of course that the large spike in articles in the
spring of 1963 is accompanied by a large decline in relative approval. However it is notable
33In most surveys the possible valid responses are only approve or disapprove.34According to the Roper catalog, Gallup asks about Kennedy (Eisenhower) approval 39 (119)
times, all of which are downloadable. However only 25 (52) were originally entered in ASCII for-mat. We eliminate files that were originally entered in binary format as Roper’s binary to ASCIIconversion resulted in several strange characters in variable fields such that we cannot match ourfrequencies to that in the codebook.
35This drop occurs between the April 5 and June 23 polls.36The figure shows the hits for the expanded definition of Civil Rights (including segregation,
integration and their variants). Results, available upon request, are similar for the more narrowsearch.
20
that even smaller events in the Civil Rights timeline lead to wobbles in Kennedy’s popularity
among whites in the South relative to elsewhere.
We formalize the analysis of Figure 8 in the regression analysis of Table 5. We regress
approval on the number of articles per day linking the president and Civil Rights during
the week of the survey.37 We begin with the more narrow, “Civil Rights” classification. The
negative coefficient on articles mentioning “Civil Rights” in col. (1) indicates that Kennedy’s
approval falls in both regions the more his name is mentioned alongside the issue. However,
the interaction term indicates that the decrease is nearly four times larger amongst South-
erners. The point estimates suggest that, if a week were to average an additional article
per day that mentions JFK and civil rights than some baseline period, we should expect
non-Southern white approval to fall by 1.53 percentage points and white Southern approval
to fall by 7.13 percentage points relative to the baseline.
In col. (2) we add date fixed effects, controls for the number of articles mentioning
Kennedy alongside “placebo” issues, along with their interactions with South, so as to test
whether the association between Civil Rights coverage and differential Southern approval is
merely picking up coincident events or policy initiatives (the main effects of these placebo
issues are absorbed by the survey-date fixed effects). Consistent with divergent regional
interests, Southerners not only differentially react to Civil Rights but also mentions of the
USSR and agricultural policy (consistent with the region’s large share of rural residents
and its reputation for hawkish foreign policy views). However, adding these controls only
increases the magnitude of the association between Civil Rights mentions and relatively
lower approval among Southerners. In col. (3) we repeat the col. (2) analysis using the more
expanded “Civil Rights terms” search. The interaction term remains negative and significant,
though is about one-fourth smaller.
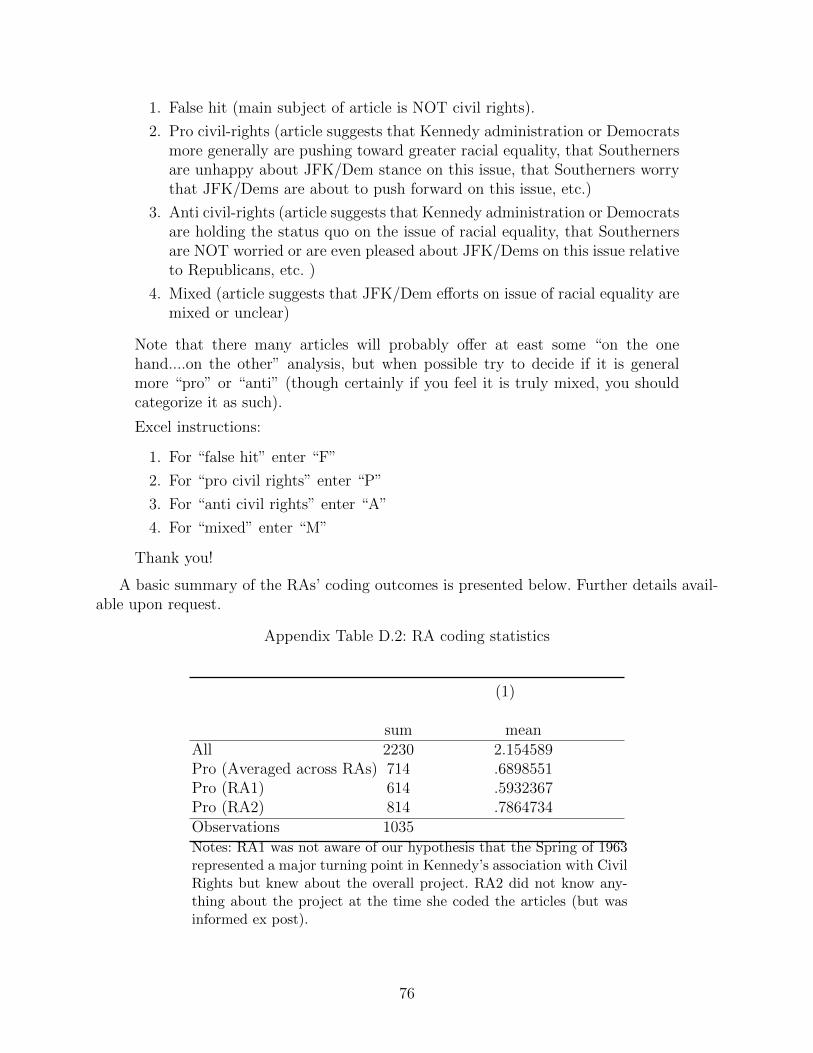
False positives, especially for the expanded “Civil Rights terms” search, could attenuate
results. We thus had two RAs ascertain whether each article actually suggests that Kennedy
was on the side of Civil Rights. In fact, they classify roughly two-thirds of the “expanded”
search as false hits.38 Col. (4) suggests that, relative to baseline, an additional article per
37The modal survey is in the field for six days. However, we do not know on which day eachrespondent is interviewed. We match the midpoint of the survey date to the number of hits duringthe period four days before through two days after the midpoint.
38In practice, we sum by day each article either RA denotes as pro Civil Rights, and then divideby two to keep coefficients comparable. See Appendix D for the instructions we gave to the RAs.Neither knew that we hypothesized Spring of 1963 as the turning point. The most common falsehit was “integration” referring to European integration, NATO, etc.
21
day placing Kennedy on the side of Civil Rights reduces his relative support among white
Southerners by over eleven percentage points, consistent with substantial attenuation bias
in col. (3). Finally, in another attempt to address false positives but without relying on
labor-intensive and potentially subjective hand coding, in col. (5) we show that our col. (3)
specification is robust to using the search term “Negro” instead of Civil Rights terms. In
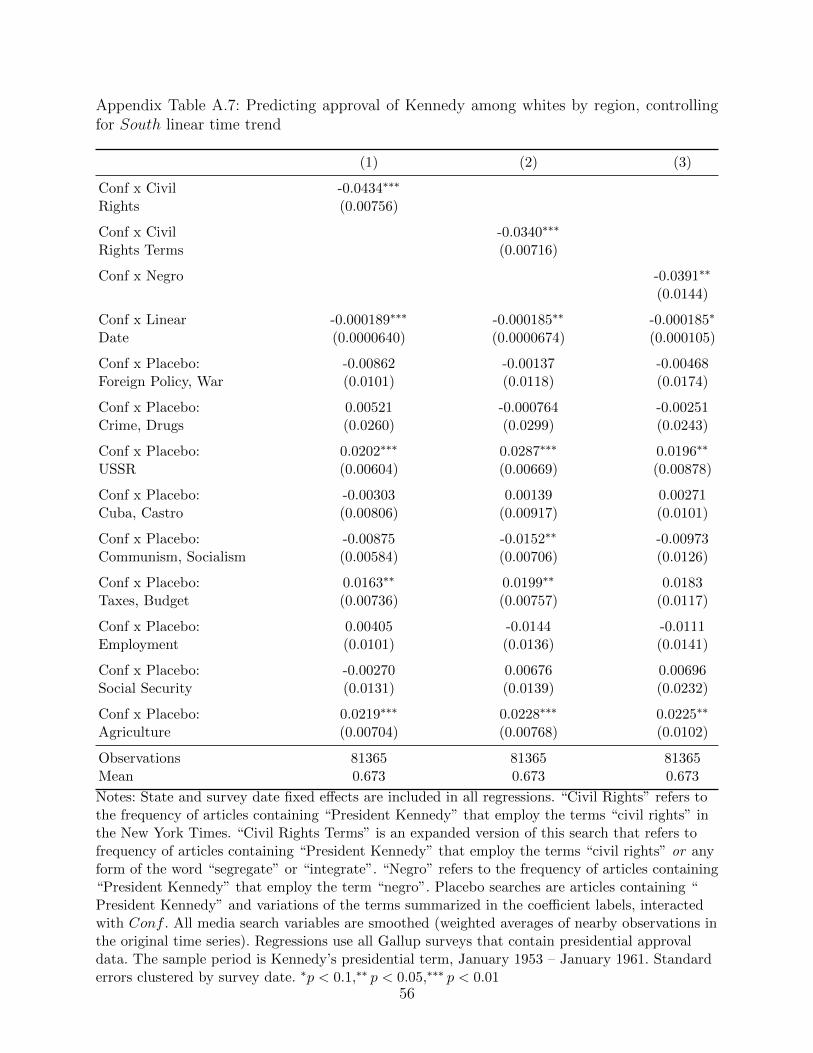
Appendix Tables A.6 and A.7 we show that our results are robust to normalizing the number
of hits by total number of articles and to including a South linear time trend.39
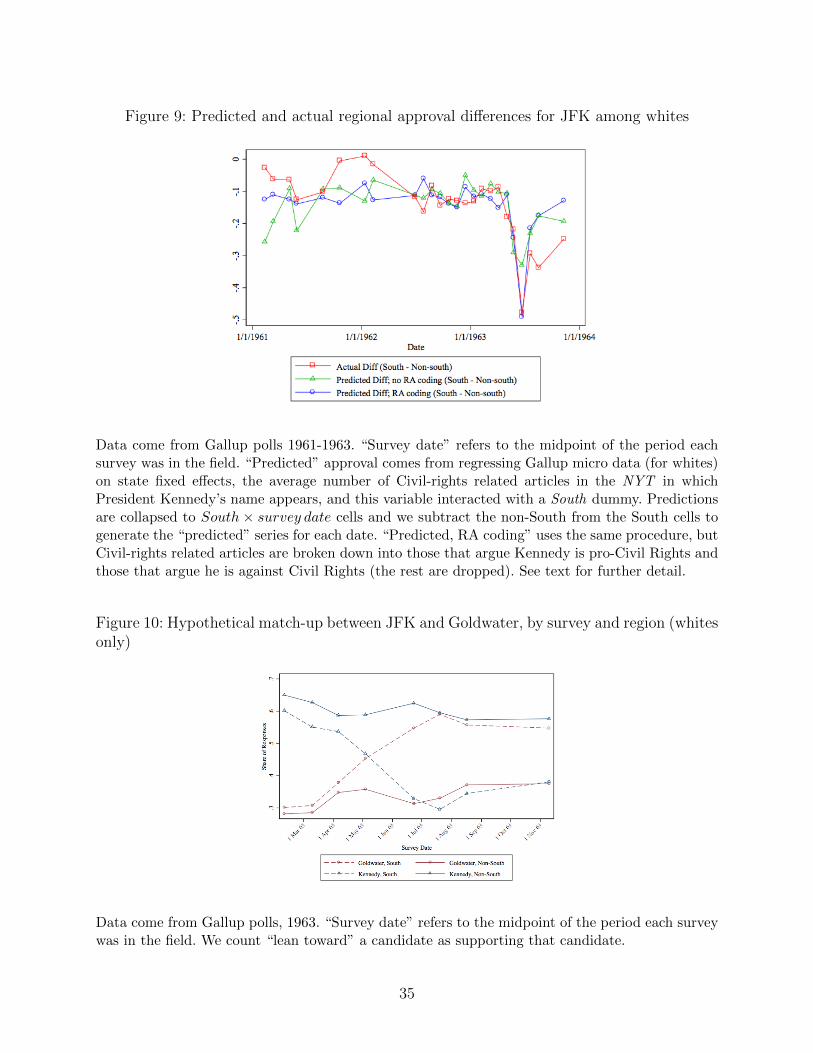
We provide a final piece of evidence against alternative issues as drivers of Southern
dealignment by quantifying the share of the variation over JFK’s administration in the
South-versus-elsewhere difference in presidential approval that can be explained by Civil
Rights relative to placebo issues. Separately for each issue (each of the placebos as well
as civil rights) we use our micro data to regress whites’ approval on state fixed effects,
the number of hits for the expanded “Civil Rights” Kennedy search (from col. 3, without
RA coding), and the interaction of this variable with South. We then predict approval and
collapse both the predicted and actual approval to South × survey date cells. Figure 9 shows
the actual South-versus-elsewhere approval differences (already depicted in Figures 7 and 8)
as well as our predicted differences, generated from the parsimonious regression described
above. The series line up quite well and in fact our predicted series explains 51% of the total
variation in the actual South-nonSouth difference over time.40 The best performing placebo
category (social security and safety net issues) explains only twenty percent (see Appendix
Figure A.9) and completely misses the huge decline in relative approval in the Spring of
1963. In fact seven of nine placebo issues explain under five percent of the South-nonSouth
variation over time. Consistent with the results in Table 5, when we use the RA-coded version
of the broad search in the same prediction exercise, the relationship appears even tighter (the
third series of 9) and now explains 56 percent of the variation. The overwhelming predictive
power of Civil Rights in explaining regional differences in approval for JFK undercuts the
argument that other issues were triggering dealignment during this period.
39We have also explored robustness of these results to varying the search window. When weincrease the window to allow articles to impact approval with a lag of as much as 30 days, thecoefficient on South×Articlecount and its significance increase to a lag of about two weeks beforeprecision starts to fall. When we include additional lags of search terms, the association of hits andapproval is smaller in magnitude in lagged weeks.
40When we instead use the more narrow “Civil Rights” search in our prediction exercise, it alsoexplains 51%. The “negro” search explains 54%.
22
5.2.2 Hypothetical presidential match-ups
Another familiar Gallup question asks voters whom they would prefer in hypothetical election
match-ups. We examine how Kennedy fairs in these match-ups against Barry Goldwater, the
Republican candidate most identified with Civil Rights opposition. Gallup asks this question
roughly monthly beginning in February 1963, with the final poll less than two weeks before
Kennedy’s assassination.
Figure 10 shows Goldwater’s support among white Southerners at around 30% through
the first week of March. Goldwater then enjoys a steady increase in support through the
Spring of 1963, reaching a plateau of around 60% in July. During our key period of the Spring
of 1963, JFK goes from having a healthy, thirty percentage point lead over Goldwater to being
thirty points behind him. White non-Southerners remain rather aloof toward Goldwater.
Over the same February to July period when JFK’s support plummets in the South, in the
non-South it falls modestly from 65 to 60%, while support for Goldwater shows a similarly
small gain from 28 to 33%.
The result from the presidential match-ups suggests that JFK’s decline in approval docu-
mented in the previous subsection did not reflect mere short term annoyance. Within months
of Kennedy’s association with Civil Rights, half of his Southern white supporters shifted their
backing to a candidate who was from a party they had shunned for a century but who was
not believed to support Civil Rights. As noted in the introduction, those arguing for Civil
Rights as the trigger for dealignment typically point to Johnson as the catalyst—our results
suggest that JFK has been given too little credit (or blame?) for losing the South for his
party.
6 Addressing alternative hypotheses
We think of the previous section as our “positive case” for Civil Rights as the prime mover
of Southern whites out of the Democratic Party. In this section, we more directly address
the most commonly raised alternative hypotheses.
6.1 Is dealignment “too smooth” to be explained by Civil Rights?
Was the South moving toward the Republicans long before Civil Rights, in particular from
1952 to 1960, when the party had a similar if not more liberal position on Civil Rights than
did the Democrats? As noted, Trende (2012) points out that the decline in the advantage
23
Democrats enjoyed in the South during Presidential elections was not a one-time decline after
1963, but more slow-moving (a pattern we indeed confirm using election returns data, see
Appendix Figure A.2). Of course, composition effects plague this type of analysis: Southern
black registration rose from essentially zero to roughly 20% between 1940 and 1960 (when
they leaned Republican) and then shot up to 65% after the Voting Rights Act (when they
essentially voted as a Democratic bloc).41
As the dealignment hypothesis concerns only whites, in Appendix Figure A.10 we repli-
cate this figure using individual-level data from ANES, excluding non-whites. The ANES
limits us to a start date of 1952, after the precipitous drop in the Southern Democratic
vote share in 1948. This lack of coverage for the 1940s is not a threat to our conclusion as
race as cause as historians link this drop to the Democrats taking their first cautious steps
toward a more liberal Civil Rights position.42 Indeed, Strom Thurmond left the Democrats
and created the splinter Dixiecrat party explicitly over this issue; he went on to win four of
the five states of the Deep South in the 1948 election. That some white Southerners gave
the Republicans another look after 1948 does not contradict the primacy of Civil Rights as
the key driver of dealignment.
However, Appendix Figure A.10 does suggest a threat to our hypothesis. The shorter
time-series points to a key break in relative white Southern Democratic Party support in
the 1960 election, not 1964 as our definition of the post-period would predict. This decline
in 1960 has led to two key arguments among scholars arguing against Civil Rights as the
trigger for dealignment: 1) The Democratic party’s liberal Civil Rights agenda could not
be the cause of dealignment as it post-dated this key, 1960 drop. 2) Southern whites were
approving or at least not disapproving of Eisenhower’s Civil Rights initiatives as evidenced
by the increased attraction to the Republican Party in the first presidential election following
the events in Little Rock. We address each in turn.
Kennedy’s Catholicism was a key factor in the election, especially in the South, to the
point that he felt compelled to give a speech to Southern ministers reaffirming his commit-
ment to secular government. Indeed, Gallup asked in 1958 whether respondents would vote
for a well-qualified candidate if he happened to be Catholic. In the South, 48 percent of
whites explicitly say no, compared to only 22 percent of whites elsewhere.
On the other hand, Catholic voters (94% of whom lived outside the South) mobilized
41Registration statistics can be found in Stanley (1987).42See Black (1987). They point to Truman’s liberalization of the armed services and the intro-
duction of a Civil Rights plank of the party’s platform in 1948.
24
in support of Kennedy.43 Appendix Figure A.11 shows what an extreme outlier 1960 was
in terms of white Catholic support for the Democratic presidential nominee. While in the
other presidential elections from 1952 to 2000, white Catholics, relative to other whites,
favor Democrats by roughly eleven percentage points, the advantage in 1960 was over 45
percentage points. While the ANES does not ask about anti-Catholic sentiment and thus
we cannot account for the votes Kennedy lost in the South to anti-Catholic sentiment, we
can account for the votes he gained among Catholics (disproportionately outside the South)
by excluding all Catholics in the ANES. Figure 11 shows that, among non-Catholic whites,
the clear break in Southern white relative support of Democratic candidates occurs between
1960 and 1964, consistent with Civil Rights events of 1963 as the cause. That nearly half
of Southern whites openly admit to being unwilling to vote for a Catholic suggests that if
Kennedy’s religion had not been an issue, the drop between 1960 and 1964 would have been
even more dramatic.
We address the question of Southern support of Eisenhower’s Civil Rights initiatives by
conducting an analysis of Eisenhower’s approval in the style of our earlier Kennedy analysis.
While historians have debated the ultimate importance of Civil Rights initiatives under
Eisenhower (e.g., the 1957 and 1960 Civil Rights Acts famously had no federal enforcement
provisions), we put that debate to the side and instead focus on the contemporaneous reaction
to these episodes amongst white Southerners relative to other whites.
Figure 12 is the Eisenhower analogue to Figure 8. The red line shows the difference (South
minus non-South) in presidential approval by region. Consistent with our claim that Civil
Rights is not salient for most Americans until the 1960s, the overall article counts are much
lower than in the analogous Kennedy graph. There is a clear increase in Eisenhower’s con-
nection to Civil Rights issues in two periods: the fall of 1956 during his reelection campaign
and the summer and fall of 1957 when the 1957 Civil Rights Bill was making its way through
Congress and to the president’s desk that September, the same month in which Eisenhower
sent federal troops to escort the Little Rock Nine. Only the latter of the two events is concur-
rent with a large drop in relative approval. Most notably there is a 25-point drop between the
polls of September 21 and October 12, a period which encompasses the forcible integration
of Little Rock Central High School. The relationship between Civil Rights and Eisenhower
approval more generally is quantified in the regression analysis shown in Appendix Table
A.8. And just like for Kennedy, we see that Eisenhower paid an approval penalty in the
43State residence of Catholic voters is based on authors’ calculation from the 1960 ANES.
25
South when the news made mention of him alongside Civil Rights (regardless of the search
terms we use to identify articles).
Finally, in a more general test of the secular trend hypothesis, we return to the Gallup
data to examine whether 1963 is actually a break or a continuation of a longer trend. (We note
that the graphical evidence of Figure 6 demonstrating an abrupt halt to the conservative-
racial-attitude-Democratic-identification connection between 1961 and 1963 already suggests
against 1963 as merely a part of a more general trend.) In col. (1) of Appendix Table A.9
we replicate our baseline specification from equation (1). Because we do not need racial
attitudes for this analysis, in col. (2) we augment the black president sample to include all
Gallup surveys in the sample period and find the same, 17 percentage point relative decline
in Democratic identification among Southern whites. Finally, we add a linear South trend
to the specification. Its negative and significant coefficient suggests a longer run trend of
Southern whites turning away from the Democratic Party. Nonetheless the coefficient on
South × Aft remains large and significant: 1963 does reflect a trend break with Southern
whites fleeing the Democratic Party in larger numbers than previously. Although it is harder
to separately identify a linear time trend alongside a one-time decline over a shorter time
period, the 1963 trend break result remains significant as we shrink the post-period window
in the remaining columns of Appendix Table A.9.
6.2 Can economic development or changing demographics explain
dealignment?
Income is a strong, negative predictor of Democratic party identification. During our study
period, the South and non-South exhibited differential economic growth rates. While our
main results were robust to flexibly controlling for education, age and urbanicity, it is pos-
sible that they are confounded by insufficient controls for income. Therefore we explore the
alternative hypothesis of income as the cause of dealignment in this section.
As noted, only six of the ten Gallup surveys from 1958 through 1980 include an income
control, and in fact only one of the six is from the pre-period. Given the limitations of income
measures in Gallup, our main approach to addressing this concern is to return to the ANES,
the dataset authors tend to use in support of the income argument.44 From 1952 onward,
44When we perform our standard analysis on the subsample of Gallup surveys that include theincome variable, the coefficient of interest on our triple interaction term is not affected by whetherincome is included as a control.
26
the ANES has the needed state identifiers as well as a consistent income measure: grouping
households by where they fall in the U.S. income distribution (bottom 16 percent, between
the 17 and 33 percentiles, the middle third, between the 67th and 95th percentiles, or the
top five percent).
As noted in Section 2, most of the work that finds evidence of income as a driver actually
uses cross tabulations and does not, in a regression sense, partial out what share of the
total dealignment is explained by the South’s economically catching up with the rest of
the country. We perform this exercise in Table 6, again defining the post-period as years
after 1963 (1964 being the first post-period year in the ANES) and otherwise following the
specification in equation (1).
To establish a baseline, col. (1) shows the results with no controls except year and state
fixed effects, and we find a 14 percentage-point relative decline in Southern Democratic
identification (similar, as we would expect, to the analogous results from Gallup, col. 3 of
Table 2).45 Col. (2) shows that this estimate barely changes after adding fixed effects for
each of the ANES income categories. Those arguing for economic development as the prime
mover often refer not only to income growth per se, but also the decline in the rural share
of the Southern population. Col. (3) adds fixed effects for the three urbanicity categories in
the ANES, and again the coefficient on South×Aft barely changes. Finally, Col. (4) allows
urbanicity and income to have different effects in the South and in the post-period (i.e., fully
interacting dummies for each of the urbanicity and income categories with both South and
After). The magnitude of the coefficient on South × After in fact increases. In short, we
find no role for economic development in explaining the differential decline in Democratic
allegiance among Southern whites after 1963.
As detailed in Section 2, other authors argue that Northern migrants and younger
cohorts—two groups which should have little loyalty to Jim Crow—drive dealignment. In
col. (5) we introduce a “restricted sample”: we drop all respondents (in the South and non-
South) born after 1941 as well as all respondents living in the South at the time of the
survey but born elsewhere. Relative to the baseline in col. (1), our restrictive sample shows
a post-period drop in Southern Democratic attachment that is 91% of the size of the drop
in the full sample. The estimated dealignment in fact grows in size when in col. (6) we add
the flexible controls for income and urbanicity included in col. (4).
45All results in Table 6 are robust to using “voted for the Democratic nominee in most recentpresidential election” as the outcome instead of Democratic identification. Results available uponrequest.
27
A final exercise we perform in Table 6 is to ask whether richer and less rural Southerners—
i.e., the so-called “New South”—were more likely to leave the party in the post-period.46 In
col. (7) we define Rich as being in the top third of the U.S. income distribution. Besides
its main effect (strongly negative, as expected) the interactions with Rich have very little
explanatory power and while rich Southerners appear somewhat more likely to leave the
party in the post-period, this effect is very small and insignificant. There is similarly no
differential decline in Democratic identification among non-rural Southerners (col. 8).
7 Conclusion
The exodus of Southern whites from the Democratic party is one of the most transforma-
tive, and controversial, political developments in twentieth century U.S. history. While the
qualitative literature pointed to the Democratic Party’s 1960s Civil Rights initiatives as the
cause, quantitative analysts have challenged this conclusion. Gallup microdata on racial at-
titudes dating back to the 1950s have allowed us to make progress on resolving the question
of why this exodus occurred. Using their consistent, frequent and cross-contextually relevant
question on whether the respondent would vote for a qualified black candidate for president,
we find that 100% (75%) of dealignment from 1958 to 1980 (2000) can be explained, in a
regression sense, by the movement of racially conservative whites away from the Democratic
Party, after it became the party of Civil Rights in 1963. Gallup’s higher frequency presiden-
tial approval data allow us to more finely pinpoint the large drop in Southern support for
President Kennedy to the timing of his proposal of Civil Rights legislation. More generally,
for both Kennedy and Eisenhower, we find a negative correlation between Southern white
approval and the mention of the president alongside Civil Rights initiatives in the media, a
correlation that survives even after allowing white Southerners to have differential reactions
to other key events in these administrations.
While we have focused on the effects of the most salient Civil Rights period on parti-
sanship, quantifying the impact of race on political and policy preferences in other contexts
is an interesting direction for future research. In concurrent work, we are examining the
reactions of white voters to school busing initiatives, which were most prominent outside of
the South in the 1970s. A greater challenge given the current social desirability bias against
admitting conservative racial views (see Stephens-Davidowitz, 2014, Mas and Moretti, 2009
46This exercise is of course different than asking whether economic development can explaindealignment, which col. (1) through (4) suggests it cannot.
28
and Greenwald et al., 2009 on whether racism cost Barack Obama votes in his presidential
elections), is to measure the extent to which racial views continue to shape our political
outcomes today.
References
Abramowitz, A. I. and Saunders, K. L. (1998). Ideological realignment in the us elec-torate. The Journal of Politics, 60 (03), 634–652.
Alesina, A. and Glaeser, E. L. (2004). Fighting poverty in the US and Europe: A worldof difference, vol. 26. Oxford University Press Oxford.
Alston, L. J. and Ferrie, J. P. (1993). Paternalism in agricultural labor contracts in theus south: Implications for the growth of the welfare state. The American economic review,pp. 852–876.
Black, E. (1987). Politics and Society in the South. Harvard University Press.
Branch, T. (2007). Parting the waters: America in the King years 1954-63. Simon andSchuster.
Brewer, M. D. and Stonecash, J. M. (2001). Class, race issues, and declining whitesupport for the democratic party in the south. Political Behavior, 23 (2), 131–155.
Campbell, A., Converse, P. E., Miller, W. E. and Donald, E. (1966). Stokes. 1960.the american voter.
Carmines, E. G. and Stimson, J. A. (1989). Issue evolution: Race and the transformationof American politics. Princeton University Press.
Gimpel, J. G. and Schuknecht, J. E. (2001). Interstate migration and electoral politics.Journal of Politics, 63 (1), 207–231.
Green, D. P., Palmquist, B. and Schickler, E. (2004). Partisan hearts and minds:Political parties and the social identities of voters. Yale University Press.
Greenwald, A. G., Smith, C. T., Sriram, N., Bar-Anan, Y. and Nosek, B. A.(2009). Implicit race attitudes predicted vote in the 2008 us presidential election. Analysesof Social Issues and Public Policy, 9 (1), 241–253.
Key Jr, V. O. (1949). Southern politics. new york: Alfred a.
Kohfeld, C. (1989). Race and the decline of class in American politics. University of IllinoisPress.
Kousser, J. M. (2010). The immutability of categories and the reshaping of southernpolitics. Annual Review of Political Science, 13, 365–383.
Kuklinski, J. H., Cobb, M. D. and Gilens, M. (1997). Racial attitudes and the ‘newsouth. The Journal of Politics, 59 (02), 323–349.
Lassiter, M. D. (2013). The silent majority: Suburban politics in the sunbelt south. Prince-ton University Press.
Lee, W. and Roemer, J. E. (2006). Racism and redistribution in the United States: A
29
solution to the problem of American exceptionalism. Journal of Public Economics, 90 (6),1027–1052.
Luttmer, E. (2001). Group loyalty and the taste for redistribution. Journal of PoliticalEconomy, 109 (3), 500–528.
Mas, A. and Moretti, E. (2009). Racial bias in the 2008 presidential election. The Amer-ican Economic Review, pp. 323–329.
McVeigh, R., Cunningham, D. and Farrell, J. (2014). Political polarization as a socialmovement outcome: 1960s Klan activism and its enduring impact on political realignmentin Southern counties, 1960 to 2000. American Sociological Review, p. 0003122414555885.
Meltzer, A. and Richard, S. (1981). A rational theory of the size of government. TheJournal of Political Economy, 89 (5), 914–927.
Osborne, D., Sears, D. O. and Valentino, N. A. (2011). The end of the solidly demo-cratic south: The impressionable-years hypothesis. Political Psychology, 32 (1), 81–108.
Perlstein, R. (2009). Before the storm: Barry Goldwater and the unmaking of the Amer-ican consensus. Nation Books.
Rorabaugh, W. (2005). Critical perspectives: Did prosperity contribute to the south’sabandonment of the democratic party? Journal of Policy History, 17 (04), 425–432.
Shafer, B. E. and Johnston, R. (2009). The end of Southern exceptionalism: class, race,and partisan change in the postwar South. Harvard University Press.
Stanley, H. W. (1987). Voter Mobilization and the Politics of Race: The South and Uni-versal Suffrage, 1952-1984. Praeger Publishers.
— (1988). Southern partisan changes: Dealignment, realignment or both? The Journal ofPolitics, 50 (01), 64–88.
Stephens-Davidowitz, S. (2014). The cost of racial animus on a black candidate: Evidenceusing google search data. Journal of Public Economics, 118, 26–40.
Trende, S. (2012). The Lost Majority: Why the Future of Government Is Up for Grabs-andWho Will Take It. Macmillan.
Valentino, N. A. and Sears, D. O. (2005). Old times there are not forgotten: Race andpartisan realignment in the contemporary south. American Journal of Political Science,49 (3), 672–688.
Wattenberg, M. P. (1991). The building of a republican regional base in the south theelephant crosses the mason-dixon line. Public Opinion Quarterly, 55 (3), 424–431.
Wright, G. (2013). Sharing the Prize. Harvard University Press.
30
Figure 1: Share of Democrats among Whites in Confederate and non-Confederate States
Source: Individual-level data from Gallup polls (accessed via ipoll), 1944-2004. South isdefined throughout as the eleven states of the former Confederacy.
Figure 2: Share of whites willing to vote for a black president, by region
Source: Gallup polls 1958-2003 and GSS 1974-2010. “Don’t know” is counted as unwilling.
31
Figure 3: Whites’ views of which party will ensure school integration, by year and region
Source: ANES 1960, 1964, and 1968 individual year files. “No difference between the two par-ties” is not plotted, but can be derived by substacting the sum of the Republican and Demo-cratic shares from one. We have dropped missing observations, soDem+Rep+Nodifferencesum to 100%.
Figure 4: Frequency of Articles Mentioning “Kennedy” and Civil Rights terms in The NewYork Times, 1961-1963
Source: New York Times and Gallup Polls
32
Figure 5: Share of Respondents Identifying Civil Rights as the Most Important Problem
Source: Gallup polls 1950-1979
Figure 6: Coefficient from regressing Dem on NoBlackPrez, by region and year (whites inGallup and GSS)
Notes: Source: Gallup and GSS polls 1958-1984. Circles denote that the coefficient comesfrom a Gallup survey and triangles denote a GSS survey.
33
Figure 7: White approval of President Kennedy by region, 1961-1963
Source: Gallup polls 1961-1963
Figure 8: Frequency of Articles Mentioning “President Kennedy” with Civil Rights termsand relative Presidential approval (whites in South versus non-South)
Notes: “Civil Rights terms” include the term “civil rights” and any form of the word “inte-gration” and “segregation.” In the approval data, “approve” is coded as one, and disapproveor no opinion is coded as zero.Source: New York Times and Gallup Polls.
34
Figure 9: Predicted and actual regional approval differences for JFK among whites
Data come from Gallup polls 1961-1963. “Survey date” refers to the midpoint of the period eachsurvey was in the field. “Predicted” approval comes from regressing Gallup micro data (for whites)on state fixed effects, the average number of Civil-rights related articles in the NYT in whichPresident Kennedy’s name appears, and this variable interacted with a South dummy. Predictionsare collapsed to South × survey date cells and we subtract the non-South from the South cells togenerate the “predicted” series for each date. “Predicted, RA coding” uses the same procedure, butCivil-rights related articles are broken down into those that argue Kennedy is pro-Civil Rights andthose that argue he is against Civil Rights (the rest are dropped). See text for further detail.
Figure 10: Hypothetical match-up between JFK and Goldwater, by survey and region (whitesonly)
Data come from Gallup polls, 1963. “Survey date” refers to the midpoint of the period each surveywas in the field. We count “lean toward” a candidate as supporting that candidate.
35
Figure 11: Share of Democratic votes in Presidential Election among White non-Catholicsin South versus non-South
Source: ANES 1952-2008
Figure 12: Frequency of Articles Mentioning “President Eisenhower” with Civil Rights termsand relative Presidential approval (whites in South versus non-South)
Source: New York Times and Gallup Polls
36
Table 1: Comparison of Summary Statistics for Whites by Time Period and Region (Gallup—ANES)
1958-1962 1963-1980
Gallup ANES Gallup ANES
Non Confederate States
Completed high school .479 .541 .546 .686Democrat .436 .430 .412 .364Female .516 .526 .526 .561Resident in urban area .672 .590 .731 .659Observations 10148 2622 32027 10369
Confederate States
Completed high school .362 .533 .452 .602Democrat .641 .622 .490 .467Female .513 .568 .523 .552Resident in urban area .449 .329 .592 .379Observations 2384 8030 9885 3185
Notes: Summary statistics are weighted using surveyweights. Urban areas are defined as areas with popula-tions of at least 2,500, although the variable varies inconstruction from survey to survey in the ANES.
Notes: See text for details on the Gallup and ANES data. “Urban area” in Galluprefers to areas with a population greater than 2,500. “Urban area” in ANES refers to“central cities” and “suburban areas” as defined in the original ANES variable VCF0111. These definitions have changed over time. In general, what we code as an “urbanarea” designates a Census-defined Metropolitan Statistical Area (MSA). A full accountof how the original ANES variable is coded can be found in the ANES Cumulative DataFile (ICPSR 8475) codebook.
37
Table 2: Democratic Party identification among whites as a function of region and racial views
Mean, dep. var. 0.452 0.452 0.452 0.452 0.451 0.451 0.451 0.435 0.435 0.391 0.391State FE? No No Yes Yes Yes Yes Yes Yes Yes Yes YesControls? No No No No No Yes Yes No No No NoInteractions? No No No No No No Yes No No No NoMax year 1980 1980 1980 1980 1980 1980 1980 1980 1980 2000 2000GSS? No No No No No No No Yes Yes Yes YesObservations 20192 20192 20192 20192 19787 19787 19787 25235 25235 41588 41588
Notes: Year fixed effects included in all regressions, and state fixed effects in column (3) and beyond. After is an indicator variablefor being surveyed after April 1963. “No Bl prez” is an indicator variable for reporting unwillingness to vote for a qualified blackpresidential candidate (“don’t know” and “no” are both coded as one). “Controls” indicate that age (in ten-year intervals), gender,education categories and city-size categories have been added. “Interactions” includes these controls as well as their interactions withConferderate and After. “Max year” indicates the end point of the sample period (in all cases, the first year of the sample period is 1958)and “GSS” indicates where GSS data have been added to the regression. Standard errors clustered by state. ∗p < .1,∗∗ p < .05,∗∗∗ p < 0.01
38
Table 3: Testing for composition bias in main regression results
Notes: Year and state fixed effects are included in all regressions. After is an indicator variable forbeing surveyed after April 1963. “No Bl prez” is an indicator variable for reporting unwillingnessto vote for a qualified black presidential candidate (“don’t know” and “no” are both coded as one).“No Bl prez (pr.)” refers to the predicted values from a regression of “No Bl prez” on state andoccupation fixed effects, gender, city-size categories, and age (in ten-year intervals) interacted witheducation categories. The “Gallup” dataset refers to Gallup surveys in which the black presidentsurvey question is asked, and the “Gallup all” dataset refers to all Gallup surveys for which there wassufficient data to estimate “No Bl prez (pr.)”, including survey years in which the black presidentquestion was not asked. The sample period is 1958-1969. Standard errors clustered by state. ∗p <.1,∗∗ p < .05,∗∗∗ p < 0.01
39
Table 4: Predicting approval of JFK among whites by region
(1) (2) (3) (4) (5) (6)
Civil Rights -0.0153∗∗
(0.00693)
Conf x Civil -0.0560∗∗∗ -0.0591∗∗∗
Rights (0.00743) (0.00441)
Civil Rights -0.00999∗∗
Terms (0.00451)
Conf x Civil -0.0359∗∗∗ -0.0465∗∗∗
Rights Terms (0.0125) (0.00484)
Negro -0.0197∗∗∗
(0.00702)
Conf x Negro -0.0556∗∗∗ -0.0587∗∗∗
(0.0139) (0.00743)
Conf x Placebo: 0.0101 0.0197∗∗ 0.0162Foreign Policy, War (0.00832) (0.00816) (0.0121)
Conf x Placebo: -0.00720 -0.0147 -0.0136Crime, Drugs (0.0272) (0.0354) (0.0249)
Conf x Placebo: 0.0208∗∗∗ 0.0323∗∗∗ 0.0194∗∗
USSR (0.00677) (0.00751) (0.00901)
Conf x Placebo: -0.0147 -0.00849 -0.00657Cuba, Castro (0.00941) (0.00957) (0.0100)
Conf x Placebo: -0.00353 -0.0125∗ -0.00583Communism, Socialism (0.00683) (0.00662) (0.0129)
Conf x Placebo: 0.0136 0.0183∗∗ 0.0147Taxes, Budget (0.00894) (0.00870) (0.0122)
Conf x Placebo: 0.00288 -0.0220 -0.0172Employment (0.0120) (0.0151) (0.0144)
Conf x Placebo: -0.00576 0.00706 0.00685Social Security (0.0132) (0.0124) (0.0227)
Conf x Placebo: 0.0178∗∗ 0.0191∗∗ 0.0182∗
Agriculture (0.00721) (0.00731) (0.00964)
Observations 81365 81365 81365 81365 81365 81365Survey Date FE No Yes No Yes No YesMean 0.673 0.673 0.673 0.673 0.673 0.673
Notes: State fixed effects are included in all regressions. “Civil Rights” denotes frequency NYT ofarticles containing “President Kennedy” and“civil rights.” “Civil Rights Terms” denotes frequencyof articles containing “President Kennedy” and “civil rights” or any form of the word “segre-gate” or “integrate”. “Negro” refers to the frequency of articles containing “President Kennedy”and“negro”. Placebo searches are articles containing “ President Kennedy” and variations of theterms summarized in the coefficient labels. All media search variables are smoothed (weighted av-erages of nearby observations in the original time series). Regressions use all Gallup surveys thatcontain presidential approval question between January 1961 and November 1963. Standard errorsclustered by survey date. ∗p < 0.1,∗∗ p < 0.05,∗∗∗ p < 0.01
40
Table 5: White approval of JFK as function of Civil Rights coverage (NYT )
Search terms employed: “President Kennedy” and...
“Civil rights” Civil rights terms “Negro”
(1) (2) (3) (4) (5)
Article count -0.0153∗∗
[0.00693]
Article count x South -0.0560∗∗∗ -0.0591∗∗∗ -0.0465∗∗∗ -0.114∗∗∗ -0.0587∗∗∗
[0.00743] [0.00441] [0.00484] [0.00863] [0.00743]
Conf x Placebo: Foreign 0.0101 0.0197∗∗ 0.00623 0.0162Policy, War [0.00832] [0.00816] [0.00914] [0.0121]
Mean, dept. var. 0.673 0.673 0.673 0.673 0.673Survey date FE? No Yes Yes Yes YesRA coding? No No No Yes NoObservations 81365 81365 81365 81365 81365
Notes: State fixed effects are included in all regressions. “Civil Rights” denotes frequency NYT ofarticles containing “President Kennedy” and“civil rights.” “Civil Rights Terms” denotes frequencyof articles containing “President Kennedy” and “civil rights” or any form of the word “segre-gate” or “integrate”. “Negro” refers to the frequency of articles containing “President Kennedy”and“negro”. Placebo searches are articles containing “ President Kennedy” and variations of theterms summarized in the coefficient labels. All media search variables are smoothed (weighted av-erages of nearby observations in the original time series). Regressions use all Gallup surveys thatcontain presidential approval question between January 1961 and November 1963. Standard errorsclustered by survey date. ∗p < 0.1,∗∗ p < 0.05,∗∗∗ p < 0.01
41
Table 6: Explanatory power of income and urbanicity on Democratic identification (ANES,1952-1980)
Observations 19158 19158 19158 19158 15240 15240 19158 19158Sample All All All All Restricted Restricted All AllIncome FE No Yes Yes Yes No Yes No NoCity Type FE No No Yes Yes No Yes No NoInteractions No No No Yes No Yes No NoMean 0.418 0.418 0.418 0.418 0.441 0.441 0.418 0.418
Notes: Year and state fixed effects are included in all regressions. After is an indicator variablefor being surveyed after April 1963. “Rich” is an indicator variable for being in the 68th to 100thpercentile of family income. “Non Rural” is an indicator variable for being a resident of “centralcities” or “suburban areas” as defined in the ANES. The “Restricted” sample used in columns 5 and6 excludes those aged below 21 in 1963 and migrants to the Confederate states. Income categoryand city-type fixed effects are included where specified in the table footer. Where “Interactions”are included, income category and city-type fixed effects have each been interacted with Confand (separately) with Aft. The sample period is 1952-1980. Standard errors clustered by state.∗p < 0.1,∗∗ p < 0.05,∗∗∗ p < 0.01
42
Appendix A. Supplementary figures and tables noted in the text
Appendix Figure A.1: Mean Personal Income by Race in Confederate and non ConfederateStates
Source: Census IPUMS files 1950-1990. Absolute differences (in 2013 dollars) are plotted onthe left-hand side and the ratio on the right-hand side.
43
Appendix Figure A.2: Democratic share of votes in Presidential Elections
Source: U.S. election returns data as tabulated by David Leip voting, 1900-2012. Data avail-able for purchase here: http://uselectionatlas.org/.
44
Appendix Figure A.3: Would Vote for a black president, full sample (including non-whiterespondents)
Source: Gallup polls 1958-2003 and GSS surveys 1974-2010
45
Appendix Figure A.4: Share of whites who would not move if black family moved next door
Source: Gallup polls 1958-1978
Appendix Figure A.5: Share of whites who would not move if neighborhood became halfblack
Source: Gallup polls 1958-1978
46
Appendix Figure A.6: Whites’ views of which party will ensure blacks get fair treatment inobtaining jobs, by year and region
Source: ANES 1960, 1964, and 1968 individual year files. “No difference between the two par-ties” is not plotted, but can be derived by substacting the sum of the Republican and Demo-cratic shares from one. We have dropped missing observations, soDem+Rep+Nodifferencesum to 100%. In 1960, the question actually refers to “jobs and housing,” whereas in 1964and 1968 only jobs are mentioned.
Appendix Figure A.7: Frequency of articles mentioning “Civil Rights” in 1963, Southernnewspapers
(a) Dallas Morning News (b) New Orleans Times-Picayune
47
Appendix Figure A.8: Approval of JFK among black Gallup respondents, 1961-1963
Appendix Figure A.9: Predicted and actual regional approval differences for JFK amongwhites (Social Security and safety net issues)
Notes: Data come from Gallup polls 1961-1963. “Survey date” refers to the midpoint of theperiod each survey was in the field. “Predicted” approval comes from regressing Gallup microdata (for whites) on state fixed effects, the average number of Social Security and safety netarticles in the NYT in which President Kennedy’s name appears, and this variable interactedwith a South dummy. Predictions are collapsed to South×survey date cells and we subtractthe non-South from the South cells to generate the “predicted” series for each date. See textfor further detail.
48
Appendix Figure A.10: Democratic share of white votes in presidential elections in Confed-erate and non Confederate States
Source: ANES 1952-2008
Appendix Figure A.11: White Catholic support for Democratic presidential candidates rel-ative to other whites
Source: ANES 1952-2008
49
Appendix Table A.1: Comparison of Summary Statistics for Whites by Time Period andRegion (Gallup—IPUMS)
1960 1970 1980
Gallup IPUMS Gallup IPUMS Gallup IPUMS
Non Confederate States
Completed high school .479 .458 .570 .586 .655 .715Female .516 .517 .523 .527 .529 .526Resident in urban area .671 .718 .732 .737 .726 .749Observations 10263 772823 6374 848060 1956 974156
Confederate States
Completed high school .362 .418 .478 .516 .552 .650Female .514 .516 .526 .524 .523 .523Resident in urban area .448 .603 .581 .652 .704 .672Observations 2416 199391 1962 244145 5820 327401
Notes: Summary statistics are weighted using survey weights. Years re-ported are census years. For each census year, Gallup statistics are drawnfrom surveys in the 5-year period around the census year. E.g. for censusyear 1960, Gallup surveys 1958-1962 are used.
Notes: See text for details on the Gallup data. The years reported in the table refer tocensus years. For each census year, Gallup statistics are drawn from surveys in the 5-year period around the census year. E.g. for census year 1960, Gallup surveys 1958-1962are used. “Urban area” in Gallup refers to areas with a population greater than 2,500.The definition of “Urban area” in IPUMS has changed over time. A full account ofhow the variable has been defined can be found in the IPUMS documentation (https://usa.ipums.org/usa/). Summary statistics are weighted using survey weights.
50
Appendix Table A.2: Whites’ opinions on race-related questions, by response to black pres-ident question (GSS, 1972-1980)
Would vote for a Would not vote fora black president a black president
Strongly agree that blacks shouldn’t push .3671737 .6797642themselves where they are not wanted [N=2827] [N=1018]
Agree that government does too much to .2325276 .4933712improve condition of blacks [N=3806] [N=1056]
Against busing of black and white school .8347466 .9147287children from one district to another [N=4835] [N=1548]
Agree that white and black children should .0562566 .3559557go to separate schools [N=1902] [N=722]
Object to sending children to a school where .0278278 .1737747a few of the children are black? [N=4995] [N=1571]
Favors laws against marriages between blacks .2575914 .640031and whites [N=3886] [N=1289]
Would object to family member bringing black .1835052 .561245friend for dinner [N=2910] [N=996]
Appendix Table A.3: Share of Gallup respondents naming “Civil Rights” the country’s “mostimportant problem,” by race and region
Pre-period Post-period
February 1961 June-July 1962 April 1964 June 1964
Whites, Confederate States .095 .140 .400 .510Blacks, Confederate States .310 .270 .640 .730Whites, Non-Confederate States .036 .058 .380 .420Blacks, Non-Confederate States .170 .230 .650 .670
Notes: See text for details on the Gallup data. “Pre” and “Post” indicate before and after April1963, respectively. Surveys used are restricted to the survey dates indicated.
51
Appendix Table A.4: Robustness of main triple-interaction results to estimating model, control group and outcome variable
No Bl prez x -0.0326 0.0198 -0.0523 -0.0319 0.0862∗ 0.0121Aft (0.0630) (0.0690) (0.0324) (0.0199) (0.0442) (0.0237)
Conf x No Bl -0.492∗∗ -0.210∗ -0.132 -0.177∗∗ -0.262∗∗∗ 0.0606prez x Aft (0.198) (0.107) (0.0808) (0.0718) (0.0884) (0.0784)
Observations 20192 20192 9660 9660 7651 7651 10639 10639 5511 5511 20192 20192Control Group All All Northeast Northeast West West Midwest Midwest Other South Other South All AllModel Probit Probit OLS OLS OLS OLS OLS OLS OLS OLS OLS OLSMean 0.452 0.452 0.478 0.478 0.504 0.504 0.459 0.459 0.565 0.565 0.296 0.296
Notes: These specifications replicate cols. (3) and (4) of Table 2. Year and State FE are included; the sample period used starts in 1956,with 1963 as the first year of the ‘after’ period and continues through 1980. Probit specifications report marginal effects. Standard errorsclustered by state in parenthesis. ∗p < 0.1,∗∗ p < 0.05,∗∗∗ p < 0.01
52
Appendix Table A.5: Robustness of main triple-interaction results in samples restricted by age and gender
No Bl prez 0.0244 0.00154 0.0112 0.00126(0.0199) (0.0239) (0.0172) (0.0219)
Conf x No Bl 0.164∗∗∗ 0.166∗ 0.199∗∗∗ 0.186∗∗
prez (0.0514) (0.0921) (0.0558) (0.0864)
No Bl prez x -0.0249 -0.0104 0.0245 -0.0402Aft (0.0304) (0.0297) (0.0313) (0.0323)
Conf x No Bl -0.188∗∗ -0.178 -0.223∗∗ -0.169∗∗
prez x Aft (0.0705) (0.116) (0.0876) (0.0818)
Observations 7789 7789 12403 12403 9685 9685 10507 10507Age 40 and under 40 and under Over 40 Over 40 – – – –Gender – – – – Male Male Female FemaleMean 0.441 0.441 0.459 0.459 0.437 0.437 0.465 0.465
Notes: These specifications replicate cols. (3) and (4) of Table 2. Year and State FE are included; the sample period used starts in 1958,with 1963 as the first year of the ‘after’ period and continues through 1980. Standard errors clustered by state in parenthesis.∗p < 0.1,∗∗ p < 0.05,∗∗∗ p < 0.01
53
Appendix Table A.8: Predicting approval of Eisenhower among whites by region
(1) (2) (3) (4) (5) (6)
Civil Rights -0.0167(0.0128)
Conf x Civil -0.0225 -0.0369∗∗
Rights (0.0142) (0.0145)
Civil Rights -0.0186∗∗∗
Terms (0.00668)
Conf x Civil -0.0282∗∗ -0.0290∗∗∗
Rights Terms (0.0113) (0.00789)
Negro -0.0145(0.0129)
Conf x Negro -0.0585∗∗ -0.0527∗∗∗
(0.0232) (0.0149)
Conf x Placebo: 0.0172∗∗∗ 0.0167∗∗∗ 0.0130∗∗∗
Foreign Policy, War (0.00570) (0.00484) (0.00453)
Conf x Placebo: 0.0505 0.0410 0.0316Crime, Drugs (0.0385) (0.0312) (0.0325)
Conf x Placebo: -0.0315∗∗∗ -0.0276∗∗∗ -0.0222∗∗∗
USSR (0.00868) (0.00724) (0.00583)
Conf x Placebo: -0.00386 -0.00959 -0.00745Cuba, Castro (0.00726) (0.00763) (0.00571)
Conf x Placebo: -0.00841 -0.00460 -0.00430Communism, Socialism (0.00943) (0.00792) (0.00689)
Conf x Placebo: 0.00122 -0.00370 -0.00719Taxes, Budget (0.00702) (0.00760) (0.00634)
Conf x Placebo: -0.00345 0.00226 -0.00846Employment (0.0101) (0.0106) (0.0100)
Conf x Placebo: 0.00659 0.00231 0.00660Social Security (0.0137) (0.0125) (0.0118)
Conf x Placebo: 0.000470 0.00314 0.00168Agriculture (0.0105) (0.00987) (0.00900)
Conf x Placebo: 0.0112 0.00784 0.0181∗∗
Korea (0.00948) (0.00842) (0.00783)
Conf x Placebo: 0.0798∗ 0.0686∗ 0.0832∗∗
Highways (0.0435) (0.0377) (0.0341)
Observations 82508 82508 82508 82508 82508 82508Survey Date FE No Yes No Yes No YesMean 0.651 0.651 0.651 0.651 0.651 0.651
Notes: State fixed effects are included in all regressions. “Civil Rights” refers to the frequency ofarticles containing “President Eisenhower” that employ the terms “civil rights” in the New YorkTimes. “Civil Rights Terms” is an expanded version of this search that refers to frequency ofarticles containing “President Eisenhower” that employ the terms “civil rights” or any form of theword “segregate” or “integrate”. “Negro” refers to the frequency of articles containing “PresidentEisenhower” that employ the term “negro”. Placebo searches are articles containing “ PresidentEisenhower” and variations of the terms summarized in the coefficient labels, interacted with Conf .All media search variables are smoothed (weighted averages of nearby observations in the originaltime series). Regressions use all Gallup surveys that contain presidential approval data. The sampleperiod is Eisenhower’s presidential term, January 1953 – January 1961. Standard errors clusteredby survey date. ∗p < 0.1,∗∗ p < 0.05,∗∗∗ p < 0.01
54
Appendix Table A.6: Predicting approval of Kennedy among whites by region – Regress onArticles as Fraction of Total Daily Article Count
(1) (2) (3)
Conf x Share of -21.66∗∗∗
Civil Rights (3.050)
Conf x Share of -15.51∗∗∗
Civil Rights Terms (3.571)
Conf x Share of -21.09∗∗∗
Negro (5.234)
Conf x Share of 0.637 1.656 0.280Placebo: Foreign Policy, War (4.887) (4.663) (5.323)
Conf x Share of 17.71 24.98 16.01Placebo: Crime, Drugs (13.37) (15.03) (14.19)
Conf x Share of -0.596 0.0608 -1.960Placebo: USSR (2.412) (2.767) (2.786)
Conf x Share of -4.706 -2.353 -1.858Placebo: Cuba, Castro (4.517) (4.518) (4.782)
Conf x Share of 5.468 5.641 5.998Placebo: Communism, Socialism (4.208) (5.223) (6.177)
Conf x Share of -2.149 -4.374 -2.953Placebo: Taxes, Budget (3.018) (2.939) (2.975)
Conf x Share of 2.484 -1.473 1.022Placebo: Employment (5.377) (5.810) (6.048)
Conf x Share of 6.919 14.39 9.777Placebo: Social Security (8.607) (8.634) (10.06)
Conf x Share of 2.760 3.487 3.373Placebo: Agriculture (4.557) (4.833) (5.296)
Notes: State and survey date fixed effects are included in all regressions. “Civil Rights” refers tothe frequency of articles containing “President Kennedy” that employ the terms “civil rights” inthe New York Times. “Civil Rights Terms” is an expanded version of this search that refers tofrequency of articles containing “President Kennedy” that employ the terms “civil rights” or anyform of the word “segregate” or “integrate”. “Negro” refers to the frequency of articles containing“President Kennedy” that employ the term “negro”. Placebo searches are articles containing “President Kennedy” and variations of the terms summarized in the coefficient labels, interactedwith Conf . All media search variables are smoothed (weighted averages of nearby observations inthe original time series). Regressions use all Gallup surveys that contain presidential approvaldata. The sample period is Kennedy’s presidential term, January 1953 – January 1961. Standarderrors clustered by survey date. ∗p < 0.1,∗∗ p < 0.05,∗∗∗ p < 0.01
55
Appendix Table A.7: Predicting approval of Kennedy among whites by region, controllingfor South linear time trend
(1) (2) (3)
Conf x Civil -0.0434∗∗∗
Rights (0.00756)
Conf x Civil -0.0340∗∗∗
Rights Terms (0.00716)
Conf x Negro -0.0391∗∗
(0.0144)
Conf x Linear -0.000189∗∗∗ -0.000185∗∗ -0.000185∗
Date (0.0000640) (0.0000674) (0.000105)
Conf x Placebo: -0.00862 -0.00137 -0.00468Foreign Policy, War (0.0101) (0.0118) (0.0174)
Conf x Placebo: 0.00521 -0.000764 -0.00251Crime, Drugs (0.0260) (0.0299) (0.0243)
Conf x Placebo: 0.0202∗∗∗ 0.0287∗∗∗ 0.0196∗∗
USSR (0.00604) (0.00669) (0.00878)
Conf x Placebo: -0.00303 0.00139 0.00271Cuba, Castro (0.00806) (0.00917) (0.0101)
Conf x Placebo: -0.00875 -0.0152∗∗ -0.00973Communism, Socialism (0.00584) (0.00706) (0.0126)
Conf x Placebo: 0.0163∗∗ 0.0199∗∗ 0.0183Taxes, Budget (0.00736) (0.00757) (0.0117)
Conf x Placebo: 0.00405 -0.0144 -0.0111Employment (0.0101) (0.0136) (0.0141)
Conf x Placebo: -0.00270 0.00676 0.00696Social Security (0.0131) (0.0139) (0.0232)
Notes: State and survey date fixed effects are included in all regressions. “Civil Rights” refers tothe frequency of articles containing “President Kennedy” that employ the terms “civil rights” inthe New York Times. “Civil Rights Terms” is an expanded version of this search that refers tofrequency of articles containing “President Kennedy” that employ the terms “civil rights” or anyform of the word “segregate” or “integrate”. “Negro” refers to the frequency of articles containing“President Kennedy” that employ the term “negro”. Placebo searches are articles containing “President Kennedy” and variations of the terms summarized in the coefficient labels, interactedwith Conf . All media search variables are smoothed (weighted averages of nearby observations inthe original time series). Regressions use all Gallup surveys that contain presidential approvaldata. The sample period is Kennedy’s presidential term, January 1953 – January 1961. Standarderrors clustered by survey date. ∗p < 0.1,∗∗ p < 0.05,∗∗∗ p < 0.01
56
Appendix Table A.9: Regressing Democrat on Conf × After with and without Confederate time trend
Observations 18921 521874 521874 18921 632494 632494 20192 755560 755560Max Year 1972 1972 1972 1976 1976 1976 1980 1980 1980Dataset Gallup Gallup all Gallup all Gallup Gallup all Gallup all Gallup Gallup all Gallup allMean 0.453 0.432 0.432 0.453 0.425 0.425 0.452 0.427 0.427
Notes: Year and state fixed effects are included in all regressions. After is an indicator variable for being surveyed after April 1963.A time trend in included in the regression wherever the variable Conf × Y ear, an interaction between Confed and survey year, isspecified. The “Gallup all” includes survey years in which the “black president” question was not asked. The “Gallup” dataset restrictsthe sample to only survey years in which the “black president” question was asked, in line with the main results tables. “Max year”indicates the end point of the sample period (in all cases, the first year of the sample period is 1958). Standard errors clustered by state.∗p < 0.1,∗∗ p < 0.05,∗∗∗ p < 0.01
57
Appendix B. Details on “black president” questions from Gallup and GSS
Appendix Table B.1: Details on the Gallup “black president question”
58
Appendix Table B.1: Details on the Gallup “black president question” (continued)
59
Appendix Table B.1: Details on the Gallup “black president question” (continued)
60
Appendix Table B.2: Details on the GSS “black president question”
61
Appendix Table B.2: Details on the GSS “black president question” (continued)
62
Appendix C. ANES analysis
In this section, we detail the questions that the ANES includes on racial equality during theCivil Rights era and explore how viable they are to use in an analysis similar to that in themain text of the paper.
C.1. Questions on school integration
As noted earlier, the ANES cumulative file includes questions from its individual year files ifthose questions are deemed reasonably comparable and were repeated with sufficient frequency.The only question related to civil rights that spans our pre- and post-periods that the ANESdeems comparable over time is on school integration. It covers only a single pre-period year(1962) and is then asked most years from 1964 through 2000. Appendix Table C.1 gives theexact wording of the question each year it is asked (ignore 1956–1960 for the moment). Eventhough the ANES deems the question comparable from 1962 onward, non-trivial differencesarise year to year. For example, in 1962 supporting integration but “not by force” is an option(and coded as support), whereas in 1964 that option is not offered. In 1964, the justificationof it not being the “government’s business” is introduced, but this wording is not includedin 1962.
These caveats aside, in Appendix Table C.2 we replicate our main analysis, using oppo-sition to school integration in the same manner we used refusal to vote for a black president(those who answer “don’t know” or “unsure” are coded as being against integration). Again,we use only data from the ANES cumulative file. Col. (1) shows that the decline in Southernwhite support for the Democrats relative to other whites is smaller when we use this veryabbreviated pre-period. As noted in Section 6, Catholics (almost all of whom lived outsidethe South) reacted to JFK’s administration with unprecedented support, whereas nearly halfof white Southerners told Gallup they would never vote for a Catholic. As such, the smallcoefficient on South × After is likely an artifact of our single pre-period year being 1962(the middle of JFK’s administration).
Nonetheless, while the small sample size reduces precision, the sign and magnitude of thetriple interaction term reported in col. (2) supports the Gallup analysis. Relative to 1962,white Southerners against integration are nine percentage points less likely to identify asDemocrats in 1964-1980, compared to their non-Southern counterparts. Whereas the Gallupanalysis showed non-Southern whites with conservative racial views only slightly movingaway from the party, the effect in the ANES is larger and achieves significance. These patternsof coefficients hold in when we extend the post-period to 2000 (cols. 3 and 4) or end it in1970 (cols. 5 and 6).
The key drawback to restricting ourselves to the cumulative file is that its one questionon racial attitudes that spans our two periods provides only a single pre-period year. Wethus explore the viability of adding additional data from the individual year files, eventhough ANES did not deem these questions sufficiently comparable. The closest candidateis a question asked in 1956, 1958 and 1960. As detailed in Appendix Table C.1 , the questionasks for respondents’ agreement with the statement: “The government in Washington shouldstay out of the question of whether white and colored children go to the same school” andunlike the version in the cumulative file offers respondents five possible answers based on the
63
strength of their opinion.Given evidence that framing significantly affects survey answers, flipping the default
between 1960 and 1962 is certainly not ideal (agreement with the pre-1962 statement wouldgenerally signal opposition to integration, whereas agreement with the 1962 and later versionswould signal support of integration). Moreover, especially in 1956, it is not clear whether thegovernment in Washington “staying out” of the question would signal opposition or supportof school integration. In reaction to Brown, U.S. Senators and Representatives from theSouth drafted the Southern Manifesto in March of 1956, calling on all possible legal actionto circumvent Brown.47 It is thus quite possible that Southerners especially could interpretWashington “staying out” as in fact allowing Brown to progress.
These caveats notwithstanding, we attempt to combine these additional years, codingany degree of agreement that the government should “stay out” as opposition to integration.Appendix Figure C.1 plots the share of whites against integration by year and region. Overall,those outside the South are uniformly more in support of integration throughout the sampleperiod. In 1956, the difference between regions is unusually small, consistent with someSoutherners assuming federal intervention might be on the side of school segregation. Thereis a very large decline in support for segregation among non-Southerners in 1962, perhapsdue to the change in the way the question is asked.
Cols. (7) through (12) of Appendix Table C.2 replicate the analysis in the first sixcolumns, but include the three additional pre-period years from the individual year datafiles. Adding these additional years adds power as well as makes the South × After co-efficient larger in magnitude. Essentially, the results look very similar to the main Gallupanalysis.
However, examining coefficients year-by-year paints a noisier picture (Appendix FigureC.2). Perhaps because of the Southern Manifesto, 1956 appears to be an extreme outlier,where white Southerners who wanted the government to involve themselves in school integra-tion were also staunchly Democratic. Nor do we see a sharp drop in the Southern coefficientestimate between 1962 and 1964. Overall, however, we continue to see that in the pre-period,opposition to integration positively predicts Democratic identification in the South relativeto elsewhere, and that this difference for the most part disappears in the post-period.
Given that the ANES cautions against longitudinal analysis with variables they do notinclude in the cumulative file, we show these results mostly for the sake of completenessand emphasize that we prefer the Gallup given the serious issues of question consistencyhighlighted above.
C.2. Questions on jobs and housing
The ANES cumulative file contains two questions on fair treatment of blacks in the areas ofemployment and housing (pre 1964) and employment alone (1964 and beyond), and thus inisolation we cannot use them to replicate the Gallup analysis. As Appendix Table C.3 shows,besides the inconsistent inclusion of housing, there are other non-trivial differences betweenthese two series, likely the reason why ANES does not combine them into a single questionin the cumulative file. First, whereas before 1964 it is left unclear as to which level (federal,
47Richard Russell (D-GA) was its main author.
64
state or local) “the government” refers, the “the federal government” is specified in 1964 andlater. Second, as with the school integration question, more flexibility on the degree of one’sagreement or disagreement are offered in the earlier years. Third, though not a fault of thequestion, the way that one answers is likely very different before and after the Civil RightsBill of 1964, which in principle would have addressed many of these issues.
A final issue with this question unrelated to its consistency across time is that “fairtreatment” is vague. If one believes that blacks are innately inferior or that the races shouldnot mix, then limiting blacks to low-status jobs and segregated housing could be viewed as“fair.” Indeed, in 1958, the ANES specifically asks respondents to explain their views aboutschool integration. Among those whose views were classified by ANES as “anti-Negro,” stillonly 32% percent disagreed that government should ensure “fair treatment” for blacks inthe area of jobs and housing.48 This cross-tabulation suggests the notion of fairness in thejobs/housing question may be so vague as to be meaningless.
Indeed, Appendix Figure C.3 is consistent with many of these concerns. First, regionaldifferences on this question are very small relative to those for school integration. A sizablemajority of Southerners agree that the government should guarantee “fair” treatment injobs and housing, suggesting the notion is vague enough for most people to support. Unlikethe black president question, whites in both regions become less supportive of the idea oftime, perhaps because of a presumption CRA64 took care of the problem or because theunderstanding of “fair treatment” became broader over time. In any case, whether it is theaddition of “federal government” to the wording of the question, the change in the number ofoptions given as potential answers, or the passage of the CRA that summer, the new versionof the question beginning in 1964 elicits significantly less support among whites than did theolder question.
Despite these serious reservations and ANES classifying them as incomparable ques-tions, for the sake of completeness we replicate our standard analysis by combining thesetwo jobs/housing questions in Appendix Table C.4. Not surprising given that the questionchanges just at the point when our post-period begins, we do not find that including ourtriple interaction decreases the coefficient on South×After nor is the triple interaction termitself significant.
48Authors’ calculation from 1958 ANES individual year file.
65
Appendix Figure C.1: Share against school integration, by region and year
0.2
.4.6
Diff
eren
ce
.2.4
.6.8
1Sh
are
of P
opul
atio
n
1955 1960 1965 1970 1975 1980 1985Year of Study
SouthNon-southDifference (South - Non-south)
Source: ANES (cumulative file for 1964 and later, individual year files for 1956, 1958 and1960).
Appendix Figure C.2: Coefficient from regressing Dem on Against school integration byregion and year (whites in ANES)
Source: ANES (cumulative file for 1964 and later, individual year files for 1956, 1958 and1960).
66
Appendix Figure C.3: Share against government guaranteeing “fair” treatment of blacks forjobs/housing
.1.1
5.2
.25
Diff
eren
ce
.2.4
.6.8
Shar
e of
Pop
ulat
ion
1955 1960 1965 1970 1975 1980 1985Year of Study
SouthNon-southDifference (South - Non-south)
Source: ANES cumulative file. For 1956-1960, the question asks about jobs and housing. For1964 onward, the question asks only about jobs. See details in Appendix Table C.3.
67
Appendix Table C.1: ANES school integration questions
68
Appendix Table C.1: ANES school integration questions (cont’d)
69
Appendix Table C.1: ANES school integration questions (cont’d)
70
Appendix Table C.2: Regressing Democrat identification on views on school integration, by time and region
Cumulative File Only Cumulative File + Indiv. Year Files
Notes: Year and State FE are included in all columns. “After” is 1963 and later (so, in ANES, first post-period year is 1964).∗p < 0.1,∗∗ p < 0.05,∗∗∗ p < 0.01
Notes: Year and State FE are included in all columns. “After” is 1963 and later (so, in ANES,first post-period year is 1964). ∗p < 0.1,∗∗ p < 0.05,∗∗∗ p < 0.01
74
Appendix D. Details on media searches
D.1. NYT searches
The full code (in R) used to generate the article counts is available upon request. The tablebelow provides the exact search terms used for each of the Civil Rights searches as wellas the searches for “placebo issues.” Searches were performed for each date of Kennedy’sadministration.
Appendix Table D.1: Details on NYT article searches
Employment “Employment”,“recession”,“unemployment”,“cost of living”,“wages”,“inflation”
Social Security “Social security”,“social services”,“welfare”,“old age”
Agriculture “farm”,“agriculture”,“agricultural”
For each search, “President” and “Kennedy” was also appended. Full code available upon request.Searches are not case-sensitive.
D.2. Research assistant article coding
Each RA received a spreadsheet that included the title of the article and its link (which theyread via the NYT TimesMachine option).
The instructions were given via email as follows (note that, sadly, typos indeed appearin the original):
Please skim each article. We are interested in your assessment of the article afterreading the headline, first few paragraphs, and skimming the rest.
Please categorize each article into one of the following four categories:
75
1. False hit (main subject of article is NOT civil rights).
2. Pro civil-rights (article suggests that Kennedy administration or Democratsmore generally are pushing toward greater racial equality, that Southernersare unhappy about JFK/Dem stance on this issue, that Southerners worrythat JFK/Dems are about to push forward on this issue, etc.)
3. Anti civil-rights (article suggests that Kennedy administration or Democratsare holding the status quo on the issue of racial equality, that Southernersare NOT worried or are even pleased about JFK/Dems on this issue relativeto Republicans, etc. )
4. Mixed (article suggests that JFK/Dem efforts on issue of racial equality aremixed or unclear)
Note that there many articles will probably offer at east some “on the onehand....on the other” analysis, but when possible try to decide if it is generalmore “pro” or “anti” (though certainly if you feel it is truly mixed, you shouldcategorize it as such).
Excel instructions:
1. For “false hit” enter “F”
2. For “pro civil rights” enter “P”
3. For “anti civil rights” enter “A”
4. For “mixed” enter “M”
Thank you!
A basic summary of the RAs’ coding outcomes is presented below. Further details avail-able upon request.
Appendix Table D.2: RA coding statistics
(1)
sum meanAll 2230 2.154589Pro (Averaged across RAs) 714 .6898551Pro (RA1) 614 .5932367Pro (RA2) 814 .7864734Observations 1035Notes: RA1 was not aware of our hypothesis that the Spring of 1963represented a major turning point in Kennedy’s association with CivilRights but knew about the overall project. RA2 did not know any-thing about the project at the time she coded the articles (but wasinformed ex post).