27
Why Energy Storage ? Dr Grant Wilson The University of Sheffield EPSRC’s Energy Storage for Low Carbon Grids consortium [email protected] #driagwilson
| Date post: | 15-Jul-2015 |
| Category: |
Environment |
| Upload: | icarb |
| View: | 400 times |
| Download: | 1 times |

Why Energy Storage ?
Dr Grant Wilson
The University of Sheffield
EPSRC’s Energy Storage for Low Carbon Grids consortium
#driagwilson

09/01/2015 © The University of Sheffield 2
• The talks this morning have provided details on
several different uses and technologies of
energy storage
• They all have a common goal to provide a
buffer, a balance between the supply of energy
and the demand of that energy – the differences
are in the scale, type of energy transformation or
final energy use, and the timeframes that the
energy is expected to be stored for

09/01/2015 © The University of Sheffield 3
• This has always been the case - energy
networks have always depended on energy
storage to help match supply with demand over
different timescales
• It is a question of where the boundary is drawn
for analysis – this presentation considers grid
level energy flows
• So rather than imagine that a large amount of
energy storage is something novel – let us
rather imagine that the tasks we wish energy
storage to fulfill are changing

09/01/2015 © The University of Sheffield 4
• The ‘Why Energy Storage ?’ question may be
easy to answer - we have always had it – and
will always need it – but it depends
• Energy systems are changing, and that change
is providing some challenges that different types
of energy storage may help to mitigate

09/01/2015 © The University of Sheffield 5
• Main driver for change: to decarbonise the
electrical network – the UK seems likely to have
a combination of Nuclear, Onshore and Offshore
Wind, Coal & Gas with Carbon Capture
• Nuclear, Coal & Gas are dispatchable to a
degree, but dependent on the technology and
the carbon capture process too
• On electrical demand – lets have a look at
recent history for some indication of the
challenges for balancing within a day
Electrical network

09/01/2015 © The University of Sheffield
GB electrical load curve

09/01/2015 © The University of Sheffield
GB electrical load curve

09/01/2015 © The University of Sheffield
GB Daily energy graph
Each box on the grid is ~ 6,000
GWh = 600 Dinorwigs
8

09/01/2015 © The University of Sheffield
Nov
Dec
Jan
Feb Mar
Apr
May
Jun
Jul
Aug
Sep
Oct
Nov
Dec
Jan
Feb Mar
Apr
May
Jun
Jul
Aug
Sep
Oct
Nov
Dec
2013 2014
200 GWh/day
400 GWh/day
600 GWh/day
800 GWh/day
1000 GWh/day
30GWh/day
Gas and electrical data derived from National Grid plc website.
Transport fuels derived from Table 3.13 Deliveries of petroleum products for inland consu mption from DECC website
2000 GWh
3000 GWh
GB Daily energy graph
Each box on the grid is ~ 6,000
GWh
9

09/01/2015 © The University of Sheffield 10
• Energy storage has vastly different types of
scale. At the 1000s of GWh size – (fossil) fuels
are the usual choice for stored energy
• Immensely useful – risks are well known
• However, they cause greenhouse gas emissions
when combusted and are finite
• Can be thought of as pre-conversion storage
(electricity or indeed heat)
A matter of scale

09/01/2015 © The University of Sheffield 11
Total existing
(30GWh) and
potential (60GWh)
would be less than
100 GWh of
electrical energy
storage
Currently Scotland
has nearly 60% of
GB’s energy
capacity of PS,
and if schemes
are built – it would
have over 85%
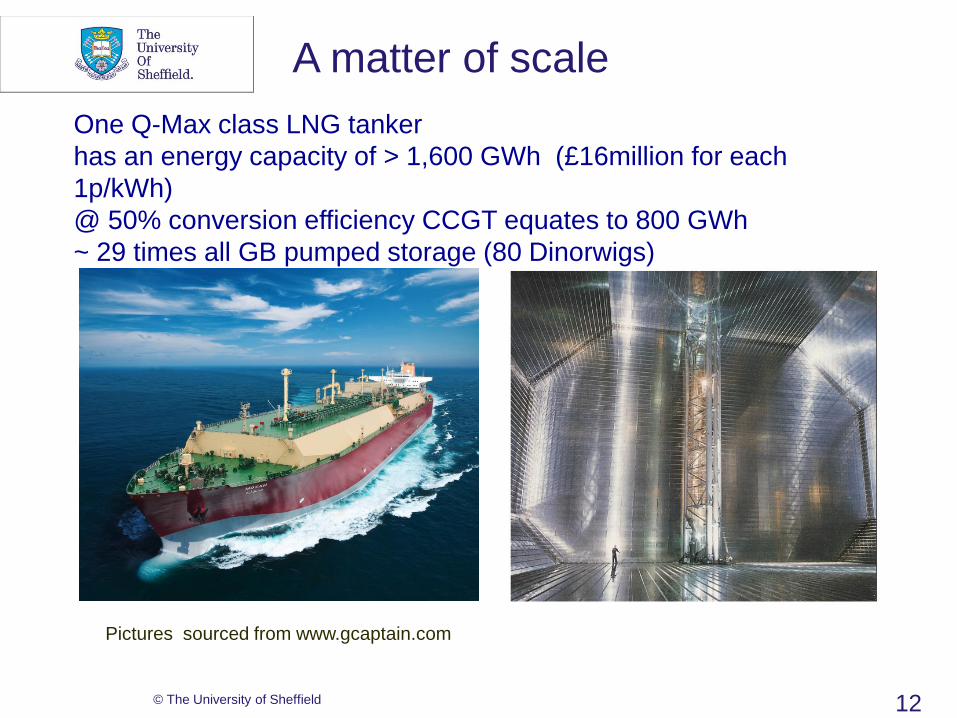
© The University of Sheffield 12
One Q-Max class LNG tanker
has an energy capacity of > 1,600 GWh (£16million for each
1p/kWh)
@ 50% conversion efficiency CCGT equates to 800 GWh
~ 29 times all GB pumped storage (80 Dinorwigs)
Pictures sourced from www.gcaptain.com
A matter of scale

09/01/2015 © The University of Sheffield 13
A matter of scale
Mild winter caused
less draw down on
coal stocks ?

09/01/2015 © The University of Sheffield 14
• GB’s electrical demand follows a daily cycle
• Within day storage/balancing is a focus for much
research and pilot stage activity
• Any mention of seasonal storage is well into the
TWh region – which suggests fuels or thermal
storage rather than electrochemical storage
• 1 GWh of storage at £300 per kWh is
£300million
• 1 TWh of storage at $100 per kWh is $100billion
A matter of timescale

09/01/2015 © The University of Sheffield
Nov
Dec
Jan
Feb Mar
Apr
May
Jun
Jul
Aug
Sep
Oct
Nov
Dec
Jan
Feb Mar
Apr
May
Jun
Jul
Aug
Sep
Oct
Nov
Dec
2013 2014
200 GWh/day
400 GWh/day
600 GWh/day
800 GWh/day
1000 GWh/day
30GWh/day
Gas and electrical data derived from National Grid plc website.
Transport fuels derived from Table 3.13 Deliveries of petroleum products for inland cons umption from DECC website
A matter of timescale
15
Each box on the grid is ~ 6,000
GWh

09/01/2015 © The University of Sheffield
Nov
Dec
Jan
Feb Mar
Apr
May
Jun
Jul
Aug
Sep
Oct
Nov
Dec
Jan
Feb Mar
Apr
May
Jun
Jul
Aug
Sep
Oct
Nov
Dec
2013 2014
200 GWh/day
400 GWh/day
600 GWh/day
800 GWh/day
1000 GWh/day
30GWh/day
Gas and electrical data derived from National Grid plc website.
Transport fuels derived from Table 3.13 Deliveries of petroleum products for inland cons umption from DECC website
A matter of timescale
16
Each box on the grid is ~ 6,000
GWh

09/01/2015 © The University of Sheffield
Nov
Dec
Jan
Feb Mar
Apr
May
Jun
Jul
Aug
Sep
Oct
Nov
Dec
Jan
Feb Mar
Apr
May
Jun
Jul
Aug
Sep
Oct
Nov
Dec
2013 2014
200 GWh/day
400 GWh/day
600 GWh/day
800 GWh/day
1000 GWh/day
30GWh/day
Gas and electrical data derived from National Grid plc website.
Transport fuels derived from Table 3.13 Deliveries of petroleum products for inland cons umption from DECC website
A matter of timescale
Purple line is gas to gas storage
17
Each box on the grid is ~ 6,000
GWh

09/01/2015 © The University of Sheffield
EV sales in UK
Plug-In Car Grant: Since the launch of the Plug-In Car Grant in January 2011,
there have been 14,274 eligible cars registered
There are approximately 29 million cars registered in the UK
What about electric vehicles ?
18

09/01/2015 © The University of Sheffield 19
• Lets take 1/10th of a round figure of 30 million
vehicles = 3 million vehicles
• Lets take an average battery pack of 33 kWh
• This gives a value of 99 GWh – in daily terms a
sizeable manageable demand but in weekly or
seasonal terms – not very much at GB level
• Also – this presumes that each battery would
require charging every day (unlikely) e.g. if 20%
of the charge was used each day on average –
the figure would be even lower at 20 GWh
What about electric vehicles ?

09/01/2015 © The University of Sheffield
Nov
Dec
Jan
Feb Mar
Apr
May
Jun
Jul
Aug
Sep
Oct
Nov
Dec
Jan
Feb Mar
Apr
May
Jun
Jul
Aug
Sep
Oct
Nov
Dec
2013 2014
200 GWh/day
400 GWh/day
600 GWh/day
800 GWh/day
1000 GWh/day
30GWh/day
Gas and electrical data derived from National Grid plc website.
Transport fuels derived from Table 3.13 Deliveries of petroleum products for inland cons umption from DECC website
A matter of timescale
99 GWh per day is half of the difference between a
week day and a weekend or roughly half the UK’s
nuclear output (before the drop off this August)
20
Each box on the grid is ~ 6,000
GWh

09/01/2015 © The University of Sheffield 21
• Cheapest post conversion storage is pumped
hydro
• Coire Glas suggested price of £800 million
equates to <£30 per kWh installed
• Order of magnitude less than battery based
systems
A matter of cost
09/01/2015 © The University of Sheffield 22
• If storage is providing a service of matching
demand and supply – what else can help ?
• And what are the comparative advantages and
disadvantages ?
• Does it compete or complement
• Interconnection to enlarge the network (same
energy carrier)
• Demand side management
• Interconnection (change of energy carrier)
A matter of what else is available

09/01/2015 © The University of Sheffield
Scotland gas transit
Each rectangle on the grid is ~ 6,000 GWh

09/01/2015 © The University of Sheffield 24
• Up to 800 GWh per day transmitted to England,
equating to equivalent power of 33 GW
• Electrical connection between Scotland and
England is thought to be 3.3 GW – but
increasing to 6.5 GW by end of 2015
A matter of what else is available

09/01/2015 © The University of Sheffield
GB electrical load curve

09/01/2015 © The University of Sheffield
GB electrical load curve
Each rectangle on the grid is ~ 100 MWh
09/01/2015 © The University of Sheffield 27
• We have not mentioned frequency control or
distributed energy storage – which are both
likely to be major areas of growth
• Also – if an energy system is to be
decarbonised, it needs low-carbon energy
sources and low carbon balancing
• Finally, there is the question of access to any
large storage scheme – maybe lessons to be
learnt from interconnectors ?


