WHY WE ARE, WHO WE ARE... OUR CULTURE A culture of dotting the i’s and crossing the t’s… Of doing the right things and doing things right… A culture of growth – individual and as a company. It’s who we are. It’s because of who we are. It’s a result of living our Basic Beliefs… Our Commitment to Each Other. To our consumers and to our customers. As we look to the future of unlimited possibilities, we recognize the principles that are instrumental to our success… A culture deeply rooted in our Basic Beliefs… Guideposts for decisions at every level… Why we are who we are. A culture that encourages commitment to each other… Clear communication and collaboration… Vision…A culture of appreciation. A family-sense of sharing in a job well done… Where every person makes a difference.
Transcript
Why We Are, Who We Are... our Culture
A culture of dotting the i’s and crossing the t’s…
Of doing the right things and doing things right…
A culture of growth – individual and as a company.
It’s who we are. It’s because of who we are.
It’s a result of living our Basic Beliefs…
Our Commitment to Each Other. To our consumers and to our customers.
As we look to the future of unlimited possibilities,
we recognize the principles that are instrumental to our success…
A culture deeply rooted in our Basic Beliefs…
Guideposts for decisions at every level…
Why we are who we are.
A culture that encourages commitment to each other…
Clear communication and collaboration…
Vision…A culture of appreciation.
A family-sense of sharing in a job well done…
Where every person makes a difference.
ContentsU.S. Retail Coffee 6 | U.S. Retail Consumer Foods 10 | International, Foodservice, and Natural Foods 14 | Sustainability at Smucker 18 | Financial Review 21 Management’s Discussion and Analysis 24 | Consolidated Financial Statements 41 Notes to Consolidated Financial Statements 46
Our PurPOseHelping to bring families together to
share memorable meals and moments.
our Brands
For more than 115 years, The J. M. Smucker Company has been committed to offering consumers quality products that help bring families together to share memorable meals and moments.
Knott’s Buff Black PMS 871
2 The J. M. Smucker Company
Our family Of brands
We are honored to own and market trusted
iconic food brands and greatly appreciate
consumers including our portfolio of products
as part of their family meals.
4 The J. M. Smucker Company 2013 Annual Report 5
We are privileged to be a part of the vitally important food industry. Our family of nearly 5,000 employees recognizes we can have a positive and meaningful impact on society through our continued focus on Our Purpose of helping to bring families together to share memorable meals and moments.
We are honored that consumers choose our iconic brands and portfolio of trusted products as part of their everyday meals, snacks shared with friends, and family celebrations. It is through these times that we connect with each other, nurture relationships, build meaningful traditions, and create lasting bonds with those most special to us.
At Smucker, we have always believed that how we do things is as important as what we do, and by seeking to fulfill Our Purpose, sales and earnings will follow. Our shared Purpose, combined with the implementation of our clear Strategy, enables us to best serve our constituents and has ensured that we continue to deliver strong results, as we delivered record sales, earnings, and cash flow in fiscal 2013.
Among the highlights of our record fiscal year:
• Net sales were up 7 percent to $5.9 billion.• Non-GAAP earnings per share rose 14 percent to $5.37.• Cash generated from operations increased 17 percent
to $856 million, with free cash flow increasing to almost $650 million.
• We repurchased nearly 4 percent of our shares, utilizing nearly $360 million in cash.
• The annual dividend paid per share increased approximately 9 percent.
These results were achieved while introducing a number of innovative new products, successfully capitalizing on new businesses, and making significant investments toward our future growth.
Innovating for ConsumersOur commitment to innovation allows us to continue to meet the ever-changing needs of consumers. New products introduced in the past three years delivered net sales of $530 million in fiscal 2013. This includes more than 60 new products launched in fiscal 2012 and 70 new products in fiscal 2013.
These innovative offerings include our Folgers Gourmet Selections ® and Millstone® K-Cup® pack product lines, which generated sales of nearly $290 million in fiscal 2013. In addition, Folgers® Fresh Breaks®, a premium, single-serve instant coffee with a more roast-and-ground taste; Jif ® Hazelnut, our first specialty nut spread offering; new Pillsbury ® seasonal baking products; new Dunkin’ Donuts® seasonal coffee flavors; and a line of Smucker’s ® Natural fruit spreads were introduced.
We also have a robust innovation lineup heading into fiscal 2014. We look forward to introducing the Dunkin’ Donuts ® Bakery Series™ of flavored coffees, the 100 percent UTZ Certified premium coffee line under the Life is good® brand, and expanding our presence in the peanut butter and specialty nut butter segment through Jif Whips and Jif Almond and Jif Cashew butters.
The success of our product innovations is the result of a strong commitment to quality and innovative marketing programs. Our marketing initiatives strive to connect with consumers at the right time and where they are, which is increasingly online. Digital efforts make up approximately 15 percent of our total U.S. Retail marketing spending.
Traditional marketing vehicles, such as television advertising, consumer promotions, and sponsorships, remain a strong focus as well. Twenty-five new television commercials were developed in fiscal 2013. An exciting new marketing initiative is the sponsorship of the 2014 Winter and 2016 Summer U.S. Olympic and Paralympic teams. We are honored to be associated with, and help support, the dreams of U.S. athletes. Related initiatives will span TV advertising, retailer and consumer promo-tions, product packaging, and digital support behind our participating brands – Folgers, Jif, Smucker’s, and Smucker’s ® Uncrustables ®.
Investing in Our Future Our record financial results were achieved while also making significant investments toward future growth at our manufacturing facilities and within our supply chain. Restructuring of coffee and fruit spreads operations was largely completed in fiscal 2013, with a goal of making us as efficient and agile as possible. This restructuring is expected to yield $60 million in run-rate savings in fiscal 2014 and is on track to achieve the full $70 million in fiscal 2015.
Acquisitions have also been proven strategic growth drivers that have contributed to sustained growth in recent years. We spent much of fiscal 2013 integrating the Sara Lee foodservice coffee and hot beverage business — that was acquired in January 2012.
The Sara Lee foodservice coffee and hot beverage acquisition has provided the scale necessary for our Foodservice business to generate additional opportunities. One of these is a multiyear licensing and distribution agreement with Cumberland Packing Corp. for its line of tabletop sweeteners including Sweet’N Low ® and Sugar In The Raw ®. These products will complement our Foodservice beverage business in the U.S. and Canada, while also expanding our tabletop presence. The addition of these brands also adds to our retail presence in Canada.
Moving ForwardLooking ahead, we expect to continue to invest in our business to build our iconic brands. We will also continue to look for acquisitions that fit our Strategy and contribute to long-term growth. These initiatives should enable us to continue returning value to our shareholders.
In addition to continuing our steady history of dividend growth, we also repurchased approximately 12 percent of our shares outstanding during the past three years. In total, more than $2 billion has been returned to our shareholders since fiscal 2008.
Our achievements demonstrate that our commitment to “doing the right things and doing things right” as we seek to fulfill Our Purpose benefits all our constituents — consumers, customers, employees, suppliers, communities, and shareholders.
The confidence to grow our business and deliver shareholder value is based on our unique culture, guided by our Basic Beliefs — Quality, People, Ethics, Growth, and Independence. Our Basic Beliefs help us preserve a culture where collaboration is valued, meaningful relationships are built, and the ability to implement with excellence is expected and recognized.
We especially want to thank our dedicated employees, whose unwavering commitment is an essential element to our success. Additionally, we greatly appreciate the loyalty of our consumers, customers, suppliers, and communities, and are thankful for the continued support from you, our shareholders.
Sincerely,
Tim Smucker Richard Smucker
June 19, 2013
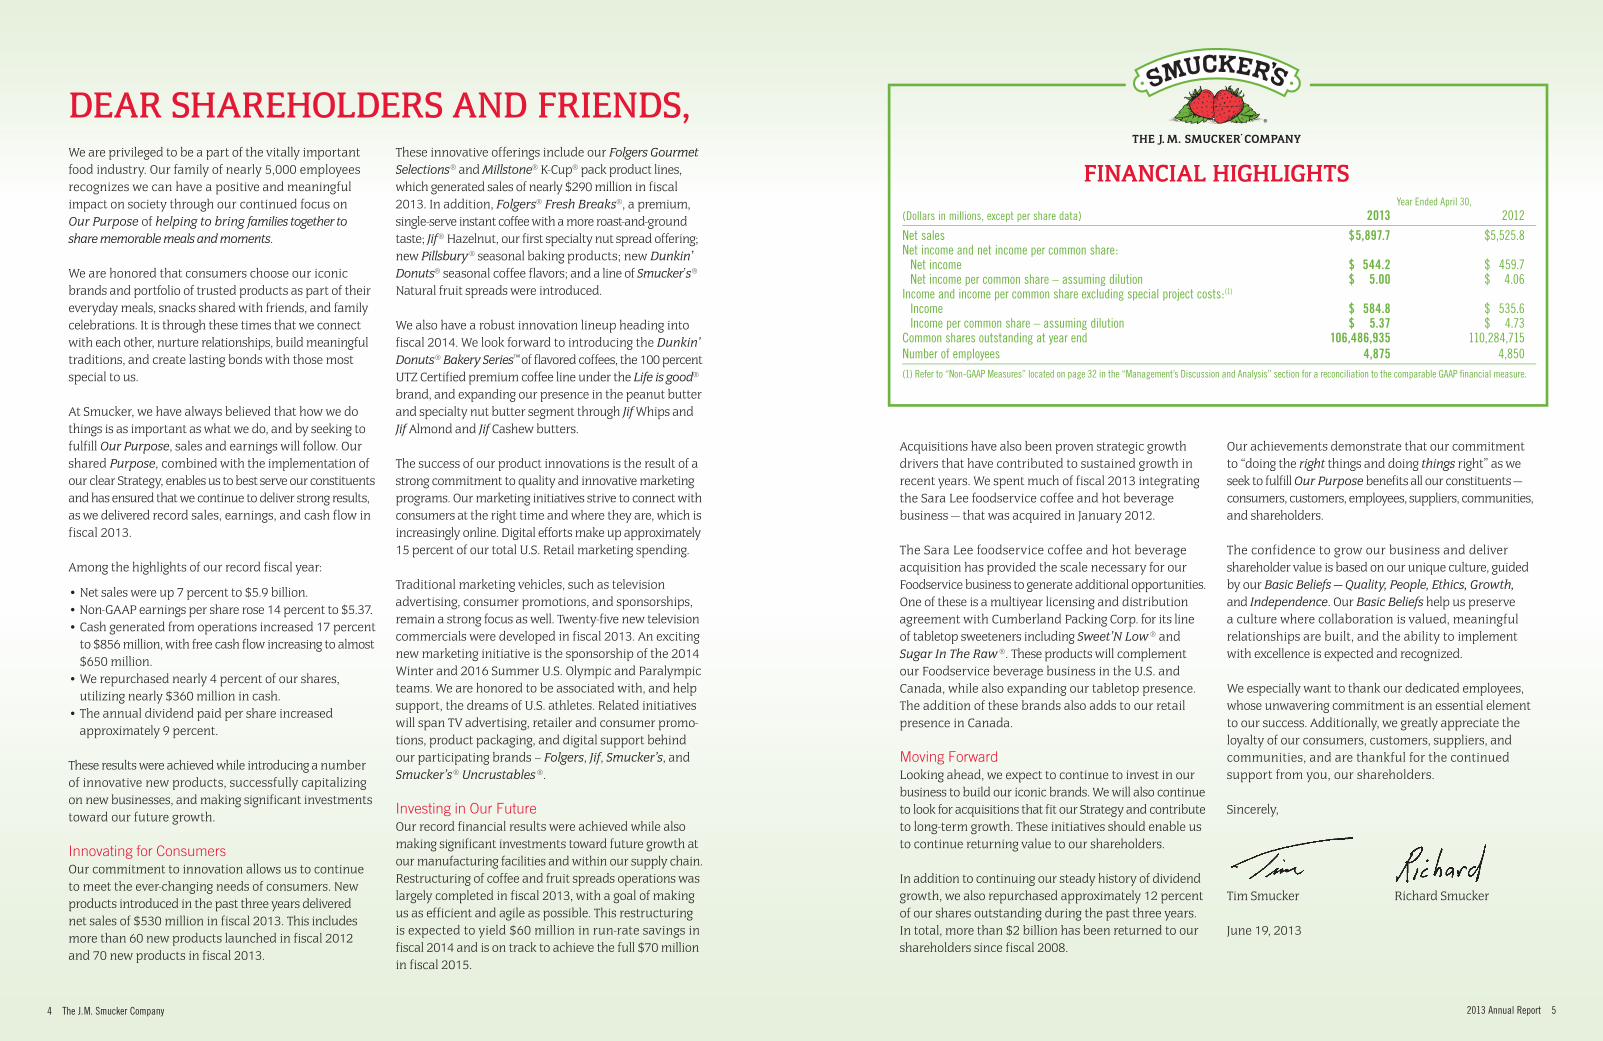
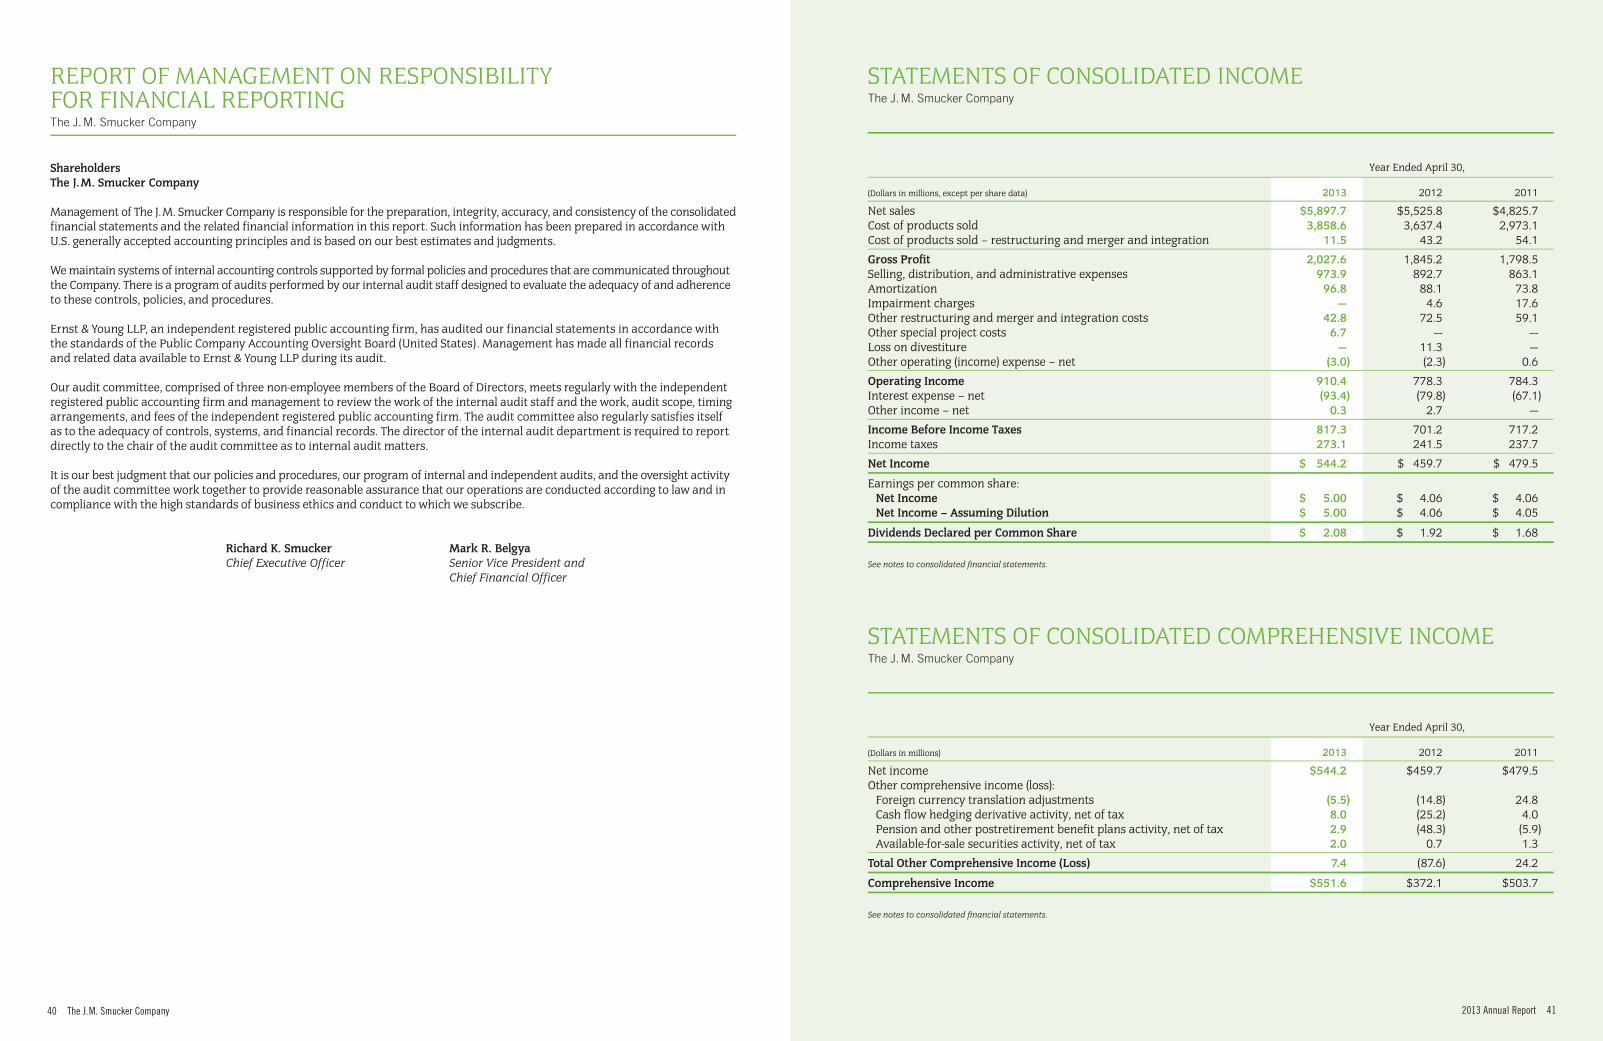
Year Ended April 30,(Dollars in millions, except per share data) 2013 2012
Net sales $ 5,897.7 $ 5,525.8Net income and net income per common share: Net income $ 544.2 $ 459.7 Net income per common share – assuming dilution $ 5.00 $ 4.06Income and income per common share excluding special project costs:(1)
Income $ 584.8 $ 535.6 Income per common share – assuming dilution $ 5.37 $ 4.73Common shares outstanding at year end 106,486,935 110,284,715Number of employees 4,875 4,850(1) Refer to “Non-GAAP Measures” located on page 32 in the “Management’s Discussion and Analysis” section for a reconciliation to the comparable GAAP financial measure.
Dear ShareholDerS anD FrienDS,
financial highlights
6 The J. M. Smucker Company 2013 Annual Report 7
U.S. retail coFFeeAs the market leader in the U.S. at-home
coffee category, Smucker competes in all key
segments of retail coffee. With a diverse portfolio
of brands, product types, packaging forms, and
price points, we are able to meet the evolving
needs of coffee consumers and to capitalize
on growth opportunities. The at-home category
has grown into an $8 billion market recognizing
significant growth from the single-serve
coffee segment.
oUr branDS
8 The J. M. Smucker Company
Offering Consumers Variety and Convenience
As the U.S. retail coffee market continues to evolve and expand, the depth and breadth of our coffee portfolio provides consumers with choices to meet every taste and need. In fiscal 2013, our U.S. Retail Coffee segment net sales were comparable to the prior year at $2.3 billion, while segment profit grew 12 percent to $608 million. A moderation in green coffee costs provided the opportunity to lower pricing during the year. This, along with our brand-building initiatives, contributed to a 4 percent increase in volume for the year.
The Folgers brand enjoyed solid performance with volume increasing 3 percent during the year. The strength and relevance of this iconic brand was recently underscored when Folgers was named “Coffee Brand of the Year” in the 2013 Harris Poll EquiTrend Rankings. Mainstream roast and ground remains the core of the at-home coffee business, and we sell more mainstream coffee than all other brands combined.
We are focused on building upon our leading market position in mainstream roast and ground coffee. This effort includes the introduction of our Hispanic brands, Café Bustelo® and Café Pilon®, into new markets.
Much of the growth in the at-home coffee market is occurring as a result of the popularity of single-serve coffee, especially K-Cup® packs. Our K-Cup® pack net sales approached $290 million in fiscal 2013. During the year we expanded our K-Cup® pack product line to 10 varieties, with plans to add two more in fiscal 2014.
Smucker participates in the premium roast and ground coffee category with our Dunkin’ Donuts, Folgers Gourmet Selections, and Millstone brands. Volume for the Dunkin’ Donuts brand grew 11 percent during the year, driven by lower pricing, brand building, and the introduction of new seasonal offerings. During fiscal 2014, we will also launch the year-round Dunkin’ Donuts Bakery Series, inspired by the brand’s bakery heritage. This series features five unique flavors and expands our total Dunkin’ Donuts offerings to nearly 20 varieties.
Our presence in the premium segment of the coffee market will expand in fiscal 2014 with the launch of the Life is good coffee brand. This licensed brand appeals to new consumer groups, including millennials. Its simple message of “the power of optimism” ties in well with our sustainability focus and, as our first brand sourced from 100 percent UTZ Certified coffee, will expand our green coffee sustainability initiatives.
Finally, we recently completed the $70 million expansion of two of our New Orleans coffee manufacturing facilities and look forward to the growth opportunities these expansions will provide.
coFFee ServeD yoUr waySmucker competes in all key coffee segments and forms across a variety of price points.
Folgers Classic Roast ®
Folgers ® Instant
Folgers ® Instant Sticks
Dunkin’ Donuts ®
CoffeeFolgers ®
Fresh Breaks ®
Folgers Gourmet Selections ® K-Cup® Packs
2013 Annual Report 9
Segment aS a Percentage oF net SaleS
39%
U.S. RETAIL COFFEE
U.S. Retail Coffee is our largest segment in terms of net sales and segment profit.
10 The J. M. Smucker Company 2013 Annual Report 11
U.S. retail conSUmer FooDS
Our consumer foods business competes in
a number of large and consumer-relevant
categories including peanut butter, fruit spreads,
baking mixes and frostings, oils, and sweetened
condensed milk. Led by the Jif brand, we hold
the #1 position in the $2 billion peanut butter
category. Pillsbury also competes in a $2 billion
category. Our namesake, Smucker’s fruit spreads,
competes in a $1 billion category, holding the
leading market position.
oUr branDS
12 The J. M. Smucker Company
Segment aS a Percentage oF net SaleS
Chocolate Hazelnut Peanut Butter Pinwheel Cookies recipe can be found on jif.com under recipes.
38%
U.S. RETAIL CONSUMER FOODS
With a portfolio of leading brands, U.S. Retail Consumer Foods comprises more than one-third of consolidated sales.
2013 Annual Report 13
PeanUt bUtter never lookeD So gooDSmucker offers an unmatched breadth of peanut butter and specialty nut butter offerings.
Stabilized
Fortified
Natural
Reduced FatConvenienceSpecialty
Nut Butter
WhippedOrganicCombination PB&J
Natural Stabilized
Discovering New Takes on Family Favorites
Innovation continues to be a key focus for the U.S. Retail Consumer Foods segment. Net sales grew 6 percent to $2.2 billion in fiscal 2013, while segment profit increased 6 percent to $415 million.
To build upon Jif’s position as consumers’ favorite peanut butter brand, we introduced new products, as well as new flavors. Jif® To Go® , a convenient snacking alternative to peanut butter in a jar, continued to grow during the year, with significant growth coming from the successful launch of Natural and Chocolate Silk varieties. We will further leverage our convenient snack offerings through the upcoming introduction of Jif Whips, a line of peanut butter products that is lighter and fluffier for easier dipping and spreading.
We entered the rapidly growing specialty nut spreads category in fiscal 2013 with Jif Hazelnut spreads. In fiscal 2014, we will expand our presence with the launch of Jif Almond and Jif Cashew butters. These innovations within the Jif brand strengthen our position as a category leader participating in all nut butter segments.
Expansion through new products extends to the fruit spreads category, where we introduced Smucker’s Natural fruit spreads. This new line consisting of four flavors with all-natural ingredients, sweetened with sugar, and with no preservatives, provides an additional platform from which to grow our namesake brand.
Building on the iconic Smucker’s brand, the continued growth of our Smucker’s Uncrustables sandwiches remains a key focus of growth. Net sales of these convenient, easy-to-serve peanut butter and jelly sandwiches grew 23 percent within the U.S. Retail Consumer Foods segment in fiscal 2013.
We are also making capital investments in our peanut butter and fruit spreads businesses to support future growth.
A new fruit spreads plant in our hometown of Orrville, Ohio, is now operational. Looking ahead, we will also be converting our fruit spreads facility in Memphis, Tennessee, to a peanut butter manufacturing facility that will result in increased peanut butter capacity. We also are expanding our Scottsville, Kentucky, manufac-turing plant to accommodate the growing popularity of Smucker’s Uncrustables sandwiches.
In the baking aisle, innovation and creativity are generating strong momentum for our Pillsbury brand, which has launched approximately 60 new items during the past three years. Pillsbury’s line of seasonal offerings has been especially well-received and has helped drive growth in the baking aisle for our retail customers.
14 The J. M. Smucker Company 2013 Annual Report 15
international, FooDService, anD
natUral FooDSOur International, Foodservice, and Natural Foods
businesses encompass sales outside of the
U.S. retail markets. Our International operations
consist of our Canadian business as well as
operations in Mexico and a presence in China.
In addition, we are a leading supplier to North
American foodservice operators, with a growing
line of products. Our R.W. Knudsen Family ®
and Santa Cruz Organic ® brands also continue
to be leaders in the natural foods category.
oUr branDS
16 The J. M. Smucker Company
Extending Our Reach and Capabilities
Net sales for our International, Foodservice, and Natural Foods segment increased 21 percent to $1.4 billion, and segment profit grew 18 percent to $198 million driven by the additional eight months of the acquired Sara Lee foodservice coffee and hot beverage business. With the business integrated, our priority has shifted to growing our liquid coffee concentrate business. This includes the introduction of the trusted Folgers brand into the liquid coffee concentrate foodservice market, which should position us to grow our Foodservice business.
In the International area, our minority interest in Seamild, a leader in China’s expanding oats category and our partner since fiscal 2012, extended our presence beyond North America and provided us with an entry into this rapidly growing region. Like Smucker, Seamild invests in growth through innovation. It has recently constructed a new state-of-the-art manufacturing campus in northern China to accommodate growth in and around Beijing.
The Seamild collaboration offers the opportunity for us to educate ourselves about the important Chinese market as we seek to identify future categories for expansion, either through acquisi-tions, additional joint ventures, or by importing our products into China. As part of this learning process, we have established offices in Shanghai and Beijing to facilitate expansion.
In Canada, the majority of our categories achieved volume and share growth during the year. Our coffee business was particularly strong, with our K-Cup® pack offerings in Canada continuing to gain market share in the single-serve segment. Our Canadian baking business also experienced solid growth as consumers turn to trusted brands, like Robin Hood ® flour, to support their baking needs.
Within Natural Foods, natural and organic beverages sold in the U.S. also enjoyed another year of solid growth, driven by new products and single-fruit offerings like the R.W. Knudsen Family ® Just Juice® line.
international FooDService natUral FooDS
The majority of our categories in Canada achieved volume and share growth during the year.
Our acquisition of the Sara Lee foodservice coffee and hot beverage business was key to growth in fiscal 2013.
Leading natural and organic brands enjoyed another year of solid growth.
2013 Annual Report 17
Segment aS a Percentage oF net SaleS
23% INTERNATIONAL, FOODSERVICE,AND NATURAL FOODS
This segment represents leading brands sold outside U.S. retail markets.
18 The J. M. Smucker Company
meaSUring oUr imPact
Responsibility and citizenship have defined Smucker
since our founding. Today, we are pleased to report
ongoing and positive progress relating to our
Economic, Environmental, and Social impacts.
In fiscal 2013, we became the largest U.S. purchaser
of UTZ Certified green coffee, expanded our
participation in the Carbon Disclosure Project,
measured our progress toward our 2014
sustainability goals, and helped achieve an
industry goal to remove a combined 1.5 trillion
calories from products as a member of the
Healthy Weight Commitment Foundation. Read
about these accomplishments and more in our
2013 Corporate Responsibility Report available
at smuckers.com/investors.
SUStainability at SmUcker
Create a better tomorrow by focusing on preserving
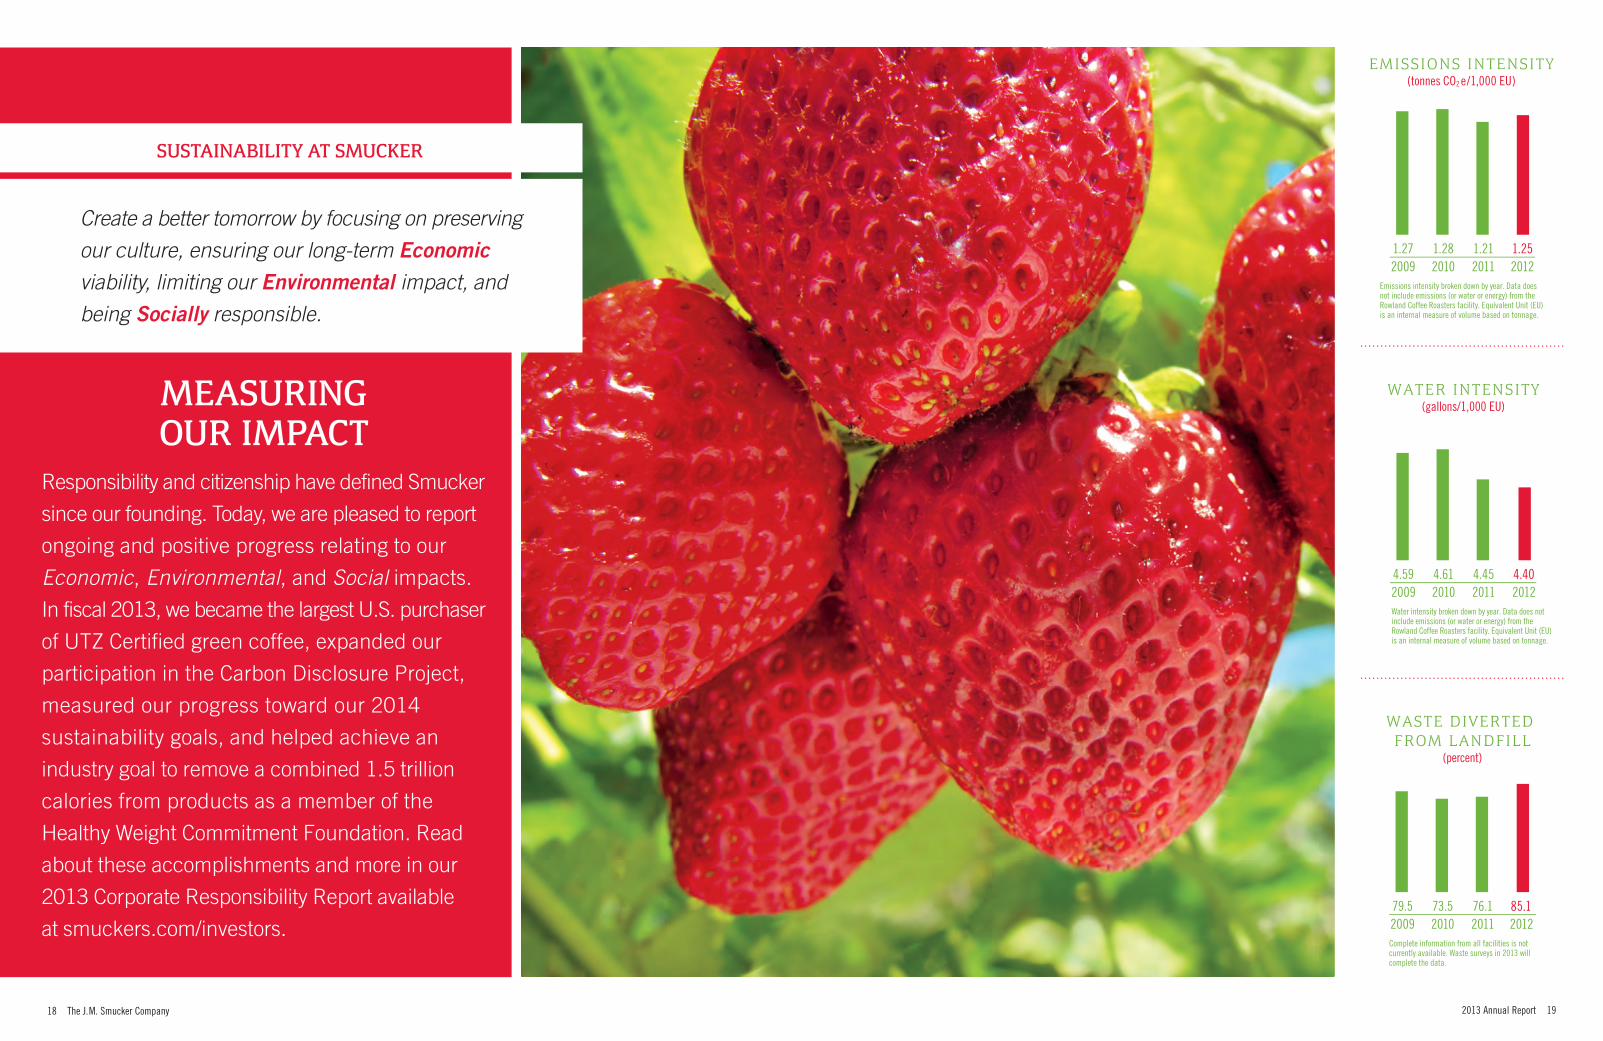
Emissions intensity broken down by year. Data does not include emissions (or water or energy) from the Rowland Coffee Roasters facility. Equivalent Unit (EU) is an internal measure of volume based on tonnage.
1.21 1.252011 2012
1.282010
1.272009
WATER INTENSITY(gallons/1,000 EU)
Water intensity broken down by year. Data does not include emissions (or water or energy) from the Rowland Coffee Roasters facility. Equivalent Unit (EU) is an internal measure of volume based on tonnage.
4.45 4.402011 2012
4.612010
4.592009
WASTE DIVERTED FROM LANDFILL
(percent)
Complete information from all facilities is not currently available. Waste surveys in 2013 will complete the data.
76.1 85.12011 2012
73.52010
79.52009
20 The J. M. Smucker Company
DirectorS anD oFFicerSThe J. M. Smucker Company
DirectorsVincent c. byrdPresident and Chief Operating Officerthe J. M. smucker company
r. douglas cowan a
Director and Retired Chairman and Chief Executive Officerthe Davey tree expert companyKent, ohio
Kathryn W. dindo a, E
Retired Vice President and Chief Risk OfficerFirstenergy corp.Akron, ohio
Paul J. dolan E
Chairman and Chief Executive Officercleveland indianscleveland, ohio
Elizabeth Valk long a, E
Former Executive Vice Presidenttime inc.New York, New York
nancy lopez Knight g
FounderNancy Lopez Golf companyAuburn, Alabama
gary a. Oatey g
Executive Chairman oatey co.cleveland, ohio
alex shumate g
Managing Partner, North Americasquire sanders (Us) LLPcolumbus, ohio
mark t. smuckerPresident, U.S. Retail Coffeethe J. M. smucker company
richard K. smuckerChief Executive Officerthe J. M. smucker company
timothy P. smuckerchairman of the Boardthe J. M. smucker company
William h. steinbrink g
PrincipalUnstuk LLcshaker Heights, ohio
Paul smucker WagstaffPresident, U.S. Retail Consumer Foodsthe J. M. smucker company
execUtive oFFicerstimothy P. smuckerChairman of the Board
richard K. smuckerChief Executive Officer
dennis J. armstrongSenior Vice President, Logistics and Operations Support
mark r. belgyaSenior Vice President and Chief Financial Officer
James a. brownVice President, U.S. Grocery Sales
Vincent c. byrdPresident and Chief Operating Officer
John W. denmanVice President, Controller and Chief Accounting Officer
barry c. dunawaySenior Vice President and Chief Administrative Officer
tamara J. fynanVice President, Marketing Services
Jeannette l. KnudsenVice President, General Counsel and Corporate Secretary
david J. lemmonVice President and Managing Director, Canada
John f. mayerVice President, U.S. Retail Sales
Kenneth a. millerVice President and General Manager, Foodservice
steven OaklandPresident, International, Foodservice, and Natural Foods
andrew g. PlattVice President, Enterprise Analytics and Insights
christopher P. resweberSenior Vice President, Corporate Communications and Public Affairs
Julia l. sabinVice President, Industry and Government Affairs
mark t. smuckerPresident, U.S. Retail Coffee
Paul smucker WagstaffPresident, U.S. Retail Consumer Foods
Lemonade Flavored Cookie Mix • 1/2 cup butter softened• 1/3 cup Smucker’s® Seedless Red
Raspberry Jam
• 1 (8 oz.) package cream cheese • 1/4 cup sugar • 1 large egg
direCtionS
1. HEAT oven to 350°F. Line 9-inch square baking pan with foil, extending foil over edge of pan. Coat with no-stick cooking spray.
2. COMBINE cookie mix and butter in large bowl with fork until mixture resembles coarse crumbs. Reserve 3/4 cup crumbs for topping. Press remaining mixture evenly into bottom of prepared baking pan. Bake 10 minutes.
3. SPREAD jam evenly over partially baked crust. Beat cream cheese, sugar and egg in medium bowl with electric mixer until smooth. Spoon over jam to cover. Sprinkle with reserved crumbs.
4. BAKE 20 to 25 minutes. Cool completely. Chill 1 hour. Remove from pan using edges of foil. Peel away foil from sides. Cut into bars.
RASPBERRY LEMONADE BARSPREP TIME: 15 MIN MAKES: 30 BARS
• 3/4 cup Smucker’s® Simply Fruit® Orange Marmalade Spreadable Fruit
• 1/4 cup soy sauce • 1/4 cup honey • 2 tablespoons fresh lemon juice • 1 teaspoon garlic powder
1. COMBINE orange marmalade, soy sauce, honey, lemon juice, garlic powder and ginger in 8-inch square glass baking dish. Add fish and turn to coat. Marinate in refrigerator 1 to 2 hours, turning occasionally.
2. HEAT broiler. Remove fish from marinade. Place on broiler pan. Place marinade in small saucepan and boil one minute. Broil fish about 6-inches from heat, 4 to 6 minutes per side until just opaque in center, basting occasionally with marinade. Place fish on plates. Serve with rice.
Strawberry Jam or 1 cup Smucker’s® Low Sugar™ Reduced Sugar Strawberry Preserves
• 1 cup Smucker’s® Sugar Free Orange Marmalade
• 1 1/2 tablespoons minced fresh basil • 1/8 teaspoon salt • 1/8 teaspoon ground black pepper
direCtionS
1. BLEND together strawberries, yogurt, jam and orange marmalade in an electric blender until smooth.
2. STIR in basil, salt and pepper. Chill for 2 hours.
3. SERVE chilled with a dollop of yogurt and sprig of basil.
PREP TIME: 10 MIN MAKES: 2 qUARTS PreP Time: 30 min makes: 16 skewers
• Crisco® Original No-Stick Cooking Spray • 1 cup Hungry Jack® Complete Buttermilk
Pancake & waffle mix (Just add water) • 3/4 cup water • 1 (8 oz.) container mascarpone cheese
softened or 1 (8 oz.) package cream cheese softened
• 1/4 cup powdered sugar
• 1 teaspoon vanilla extract • 16 medium strawberries sliced into
3 pieces• 16 blueberries • 16 (5 to 6 in.) decorative skewers • Hungry Jack® Original Syrup
direCtionS
1. COaT griddle or large skillet with no-stick cooking spray. Heat to medium heat (325°F).
2. STIR together pancake mix and water in medium bowl until smooth. Let stand 3 minutes. Pour 1 teaspoon batter on hot griddle. Cook 1 minute; flip. Cook additional 30 seconds. Repeat to make 45 mini pancakes.
3. BEAT mascarpone, powdered sugar and vanilla in medium bowl with electric mixer on medium speed until smooth. Spread mascarpone mixture evenly onto one side of each pancake. Stack strawberry slice on top of mascarpone. Place another pancake on strawberry. Repeat to make three layers. Top with blueberry. Insert skewer through blueberry into pancake stack. repeat to make 16 pancake skewers. serve with syrup.
• 1/3 cup unsweetened cocoa • 1/4 teaspoon salt • 1 teaspoon ground cinnamon • 1 (14 oz.) can eagle Brand®
Sweetened Condensed Milk
• 5 cups water • 1 1/3 cups strong brewed Folgers
Classic roast® Coffee
direCtionS
1. COMBINE cocoa, salt and cinnamon in 3-quart saucepan. Add sweetened condensed milk; mix well.
2. SLOWLY stir in water and coffee over medium heat; heat thoroughly but do not boil. Serve warm.
3. Brazilian coffee may be stored in refrigerator up to 5 days. Mix well and reheat before serving.
PASTA PRIMAVERA WITH LEMON-CAPER SAUCEPreP Time: 30 min makes: 4 servinGs
• 1/4 cup Crisco® Pure Olive Oil • 1 large red or yellow onion, chopped • 1 pound fresh asparagus spears,
trimmed, cut into 1-inch pieces • 1 medium yellow squash or zucchini,
quartered lengthwise, sliced 1/4-inch thick
• 1/4 teaspoon salt • 1/2 teaspoon coarsely ground pepper • 8 ounces uncooked linguine pasta • 1 cup frozen peas and carrots
Lemon-Caper Sauce • 1/4 cup butter • 2 tablespoons Pillsbury BeSt® All
Purpose Flour • 1 1/2 teaspoons minced fresh garlic • 1 (14 1/2 oz.) can chicken broth • 3 tablespoons Santa Cruz organic® Pure
Lemon Juice • 1/4 cup Crosse & Blackwell® Capers
drained• 1/4 cup minced fresh parsley • 1 cup finely shredded Parmesan cheese
direCtionS
1. HEAT oil in large skillet over medium heat. Add onion. Cook over medium-low heat 7 minutes or until soft. add asparagus, yellow squash, salt and pepper. Cook an additional 5 minutes or until crisp-tender.
2. COOK pasta in salted water according to package directions, adding frozen peas and carrots during last 5 minutes of cooking time. Drain.
3. HEAT butter in medium saucepan over medium heat. Stir in flour and garlic until blended. Gradually stir in chicken broth until smooth. Bring to a boil over high heat, stirring constantly. Reduce heat to low; simmer 5 minutes. Stir in lemon juice and capers.
4. COMBINE pasta, vegetable and sauce mixtures in pasta pot. Add parsley; stir until blended. Sprinkle individual servings with cheese.
Five-Year SummarY oF Selected Financial datathe following table presents selected financial data for each of the five years in the period ended april 30, 2013. the selected financial data should be read in conjunction with the “results of operations” and “Financial condition” sections of “management’s discussion and analysis” and the consoli-dated financial statements and notes thereto.
Year ended April 30,
(Dollars in millions, except per share data) 2013 2012 2011 2010 2009
statements of income: Net sales $ 5,897.7 $ 5,525.8 $ 4,825.7 $ 4,605.3 $ 3,757.9 Gross profit $ 2,027.6 $ 1,845.2 $ 1,798.5 $ 1,786.7 $ 1,251.4 % of net sales 34.4% 33.4% 37.3% 38.8% 33.3% operating income $ 910.4 $ 778.3 $ 784.3 $ 790.9 $ 452.3 % of net sales 15.4% 14.1% 16.3% 17.2% 12.0% Net income $ 544.2 $ 459.7 $ 479.5 $ 494.1 $ 266.0
financial Position: cash and cash equivalents $ 256.4 $ 229.7 $ 319.8 $ 283.6 $ 456.7 total assets 9,031.8 9,115.2 8,324.6 7,974.9 8,192.2 total long-term debt, including current portion 2,017.8 2,070.5 1,304.0 910.0 1,536.7 shareholders’ equity 5,148.8 5,163.4 5,292.3 5,326.3 4,939.9
Earnings per common share: Net income $ 5.00 $ 4.06 $ 4.06 $ 4.15 $ 3.11 Net income – assuming dilution 5.00 4.06 4.05 4.15 3.11
Other non-gaaP measures: (2)
Gross profit excluding special project costs $ 2,039.1 $ 1,888.4 $ 1,852.6 $ 1,790.6 $ 1,251.4 % of net sales 34.6% 34.2% 38.4% 38.9% 33.3% operating income excluding special project costs $ 971.4 $ 894.0 $ 897.5 $ 830.3 $ 535.2 % of net sales 16.5% 16.2% 18.6% 18.0% 14.2% income and income per common share excluding special project costs: income $ 584.8 $ 535.6 $ 555.1 $ 520.8 $ 321.6 income per common share – assuming dilution $ 5.37 $ 4.73 $ 4.69 $ 4.37 $ 3.76
(1) Refer to “Liquidity” located on page 30 in the “Management’s Discussion and Analysis” section for a reconciliation to the comparable GAAP financial measure.(2) Refer to “Non-GAAP Measures” located on page 32 in the “Management’s Discussion and Analysis” section for a reconciliation to the comparable GAAP financial measure.
NET SALES(Dollars in billions)
2009 2013
$5.5$4.8$4.6
2010 2011 2012
$3.8
$5.9
NON-GAAPINCOME PER COMMON SHARE–
ASSUMING DILUTION (2)
2009 2013
$4.73$4.69$4.37
2010 2011 2012
$3.76
$5.37
ASSETS(Dollars in billions)
2009 2013
$9.1
$8.3$8.0
2010 2011 2012
$8.2
$9.0
2013 Financial reviewThe J. M. Smucker Company
2013 Annual Report 21
22 The J. M. Smucker Company 2013 Annual Report 23
$300
$250
$150
$100
$200
$50
$0
4/08 4/09 4/10 4/11 4/12 4/13
S&P Packaged Foods & Meats
S&P 500
The J. M. Smucker Company
Summary of Quarterly reSultS of operationSThe J. M. Smucker Company
Stock price Data
compariSon of five-year cumulative total ShareholDer returnThe J. M. Smucker Company
The following is a summary of unaudited quarterly results of operations for the years ended April 30, 2013 and 2012.
Net Income per Net Income per Common Share – (Dollars in millions, except per share data) Quarter Ended Net Sales Gross Profit Net Income Common Share Assuming Dilution
2013 July 31, 2012 $1,369.7 $469.8 $110.9 $1.00 $1.00 October 31, 2012 1,628.7 541.9 148.8 1.36 1.36 January 31, 2013 1,559.6 536.2 154.2 1.42 1.42 April 30, 2013 1,339.7 479.7 130.3 1.22 1.22
2012 July 31, 2011 $1,188.9 $431.1 $111.5 $0.98 $0.98 October 31, 2011 1,513.9 498.7 127.2 1.12 1.12 January 31, 2012 1,467.6 465.7 116.8 1.03 1.03 April 30, 2012 1,355.4 449.7 104.2 0.93 0.93
Annual net income per common share may not equal the sum of the individual quarters due to differences in the average number of shares outstanding during the respective periods.
Our common shares are listed on the New York Stock Exchange – ticker symbol SJM. The table below presents the high and low market prices for the shares and the quarterly dividends declared. There were approximately 360,200 shareholders of record as of June 14, 2013, of which approximately 49,500 were registered holders of common shares.
Quarter Ended High Low Dividends
2013 July 31, 2012 $ 80.31 $73.20 $0.52 October 31, 2012 87.81 74.60 0.52 January 31, 2013 90.31 81.60 0.52 April 30, 2013 105.18 88.38 0.52
2012 July 31, 2011 $ 80.26 $73.76 $0.48 October 31, 2011 78.62 66.43 0.48 January 31, 2012 81.40 71.24 0.48 April 30, 2012 81.97 70.50 0.48
Among The J. M. Smucker Company, the S&P Packaged Foods & Meats Index, and the S&P 500 Index
April 30,
2008 2009 2010 2011 2012 2013
The J. M. Smucker Company $100.00 $89.12 $142.02 $179.35 $195.00 $259.16S&P Packaged Foods & Meats 100.00 79.15 110.82 128.84 145.67 186.51S&P 500 100.00 64.69 89.81 105.28 110.29 128.91
The above graph compares the cumulative total shareholder return for the five years ended April 30, 2013, for our common shares, the S&P Packaged Foods & Meats Index, and the S&P 500 Index. These figures assume all dividends are reinvested when received and are based on $100 invested in our common shares and the referenced index funds on April 30, 2008.
24 The J. M. Smucker Company 2013 Annual Report 25
management’S DiScuSSion anD analySiSThe J. M. Smucker Company
ExECuTivE SuMMaryFor more than 115 years, The J. M. Smucker Company (“Company,” “ we,” “us,” or “our”) headquartered in Orrville, Ohio, has been committed to offering consumers quality products that bring families together to share memorable meals and moments. Today, we are a leading marketer and manufacturer of fruit spreads, retail packaged coffee, peanut butter, shortening and oils, ice cream toppings, sweetened condensed milk, and health and natural foods beverages in North America.
Our family of brands includes Smucker’s®, Folgers®, Dunkin’ Donuts®, Jif®, Crisco®, Pillsbury®, Eagle Brand®, R.W. Knudsen Family®, Hungry Jack®, Café Bustelo®, Café Pilon®, White Lily®, and Martha White® in the United States, along with Robin Hood®, Five Roses®, Carnation®, and Bick’s® in Canada. In addition to these brands, we market products under numerous other brands, including Millstone®, Dickinson’s®, Laura Scudder’s®, Adams®, Double Fruit® (Canada), and Santa Cruz Organic®.
We have three reportable segments: U.S. Retail Coffee, U.S. Retail Consumer Foods, and International, Foodservice, and Natural Foods. The two U.S. retail market segments in total comprised over 75 percent of net sales in 2013 and represent a major portion of our strategic focus – the sale of branded food products with leadership positions to consumers through retail outlets in North America. The International, Foodservice, and Natural Foods segment represents sales outside of the U.S. retail market segments, and has grown over the past year, primarily due to the full-year contribution from the acquisition of the majority of the North American foodservice coffee and hot beverage business from Sara Lee Corporation (“Sara Lee foodservice business”) in 2012.
In both of the U.S. retail market segments, our products are sold primarily to food retailers, food wholesalers, drug stores, club stores, mass merchandisers, discount and dollar stores, and military commissaries. In the International, Foodservice, and Natural Foods segment, our products are distributed domestically and in foreign countries through retail channels, foodservice distributors and operators (e.g., restaurants, lodging, schools and universities, health care operators), and health and natural foods stores and distributors.
STraTEgiC ElEMEnTSWe remain rooted in our Basic Beliefs of Quality, People, Ethics, Growth, and Independence, established by our founder and namesake, Jerome Smucker, more than a century ago. Today, these Basic Beliefs are the core of our unique corporate culture and serve as a foundation for decision making and actions. We have been led by four generations of family leadership, having had only five chief executive officers in 116 years. This continuity of management and thought extends to the broader leadership team that embodies the values and embraces the business practices that have contributed to our consistent growth.
Our strategic vision is to own and market food brands which hold the #1 market position in their category, with an emphasis on North America while embracing a global perspective.
Our strategic long-term growth objectives are to increase net sales by 6 percent and earnings per share by greater than 8 percent annually on average. While the net sales contribution from acquisitions will vary from year to year, we expect organic growth, including new products, to add 3 to 4 percent per year and acquisitions to contribute the remainder over the long term.
(Dollars in millions, unless otherwise noted, except per share data)
rESulTS of opEraTionSOn January 3, 2012, we completed the acquisition of the Sara Lee foodservice business. The acquisition was accounted for as a purchase business combination and the results of the Sara Lee foodservice business are included in our consolidated
financial statements from the date of acquisition. Because the transaction closed during the third quarter of 2012, incremental Sara Lee foodservice business, approximating eight months of operations, is included in 2013.
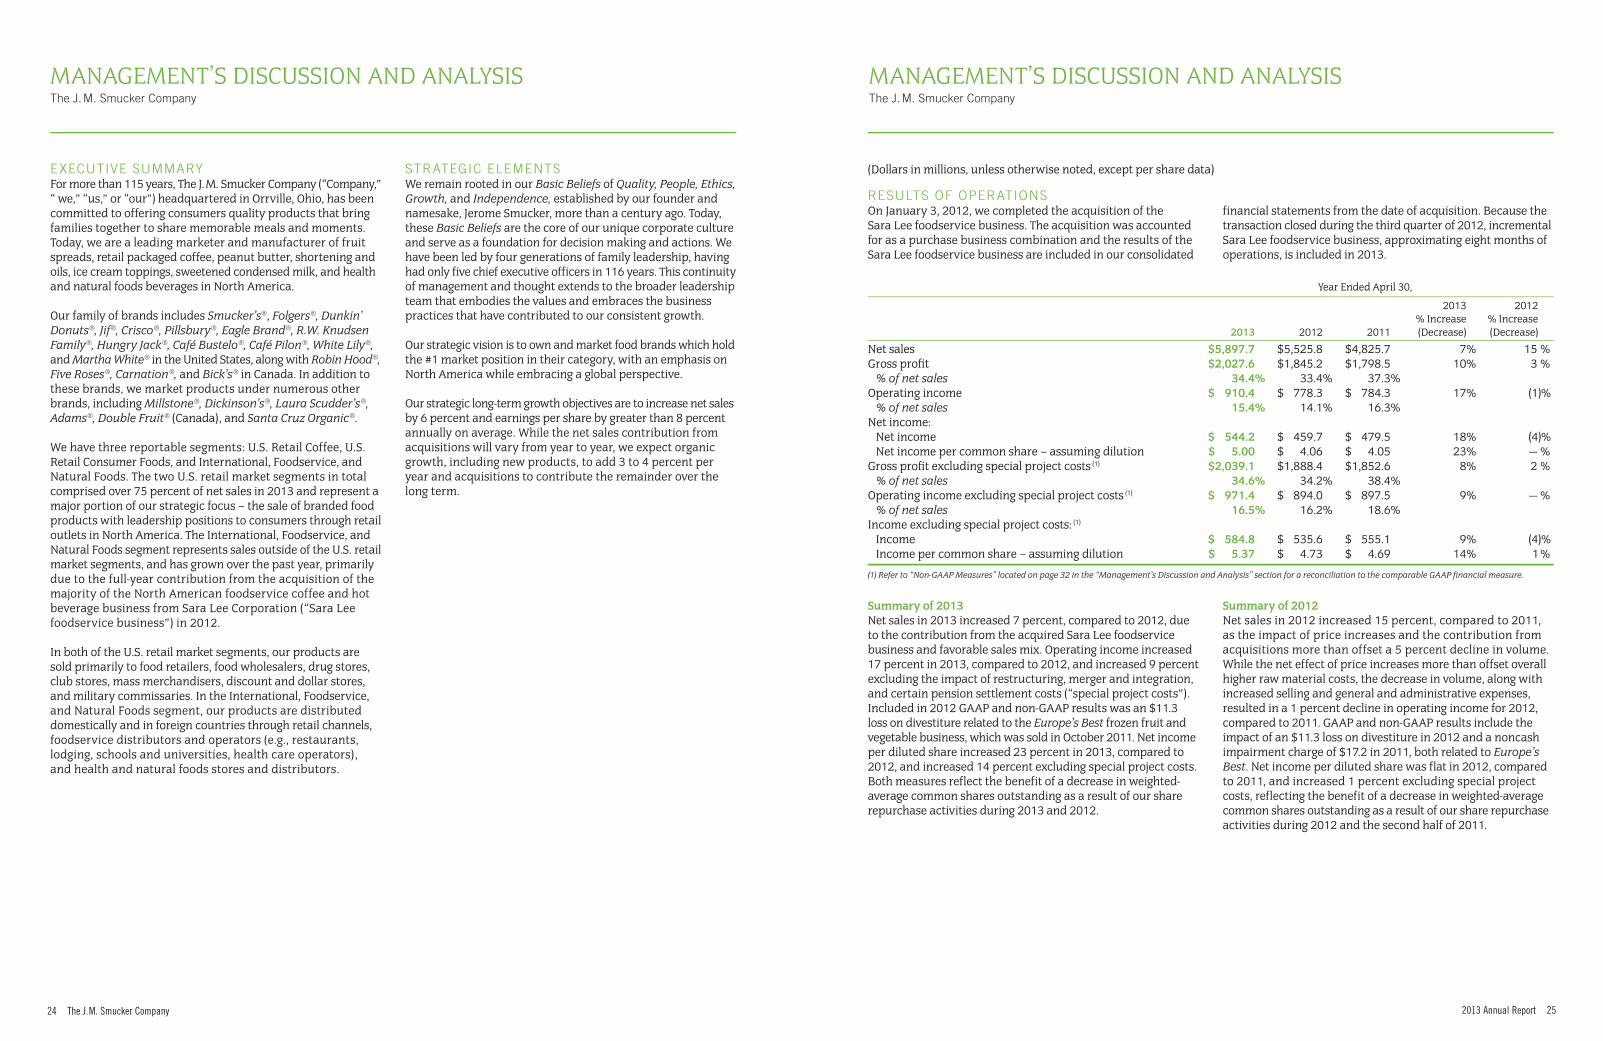
Net sales $5,897.7 $5,525.8 $4,825.7 7% 15 %Gross profit $2,027.6 $1,845.2 $1,798.5 10% 3 % % of net sales 34.4% 33.4% 37.3%Operating income $ 910.4 $ 778.3 $ 784.3 17% (1)% % of net sales 15.4% 14.1% 16.3%Net income: Net income $ 544.2 $ 459.7 $ 479.5 18% (4)% Net income per common share – assuming dilution $ 5.00 $ 4.06 $ 4.05 23% — %Gross profit excluding special project costs (1) $2,039.1 $1,888.4 $1,852.6 8% 2 % % of net sales 34.6% 34.2% 38.4%Operating income excluding special project costs (1) $ 971.4 $ 894.0 $ 897.5 9% — % % of net sales 16.5% 16.2% 18.6%Income excluding special project costs: (1) Income $ 584.8 $ 535.6 $ 555.1 9% (4)% Income per common share – assuming dilution $ 5.37 $ 4.73 $ 4.69 14% 1 %
(1) Refer to “Non-GAAP Measures” located on page 32 in the “Management’s Discussion and Analysis” section for a reconciliation to the comparable GAAP financial measure.
Summary of 2013Net sales in 2013 increased 7 percent, compared to 2012, due to the contribution from the acquired Sara Lee foodservice business and favorable sales mix. Operating income increased 17 percent in 2013, compared to 2012, and increased 9 percent excluding the impact of restructuring, merger and integration, and certain pension settlement costs (“special project costs”). Included in 2012 GAAP and non-GAAP results was an $11.3 loss on divestiture related to the Europe’s Best frozen fruit and vegetable business, which was sold in October 2011. Net income per diluted share increased 23 percent in 2013, compared to 2012, and increased 14 percent excluding special project costs. Both measures reflect the benefit of a decrease in weighted-average common shares outstanding as a result of our share repurchase activities during 2013 and 2012.
Summary of 2012Net sales in 2012 increased 15 percent, compared to 2011, as the impact of price increases and the contribution from acquisitions more than offset a 5 percent decline in volume. While the net effect of price increases more than offset overall higher raw material costs, the decrease in volume, along with increased selling and general and administrative expenses, resulted in a 1 percent decline in operating income for 2012, compared to 2011. GAAP and non-GAAP results include the impact of an $11.3 loss on divestiture in 2012 and a noncash impairment charge of $17.2 in 2011, both related to Europe’s Best. Net income per diluted share was flat in 2012, compared to 2011, and increased 1 percent excluding special project costs, reflecting the benefit of a decrease in weighted-average common shares outstanding as a result of our share repurchase activities during 2012 and the second half of 2011.
management’S DiScuSSion anD analySiSThe J. M. Smucker Company
ManageMent’s Discussion anD analysisThe J. M. Smucker Company
ManageMent’s Discussion anD analysisThe J. M. Smucker Company
26 The J. M. Smucker Company 2013 Annual Report 27
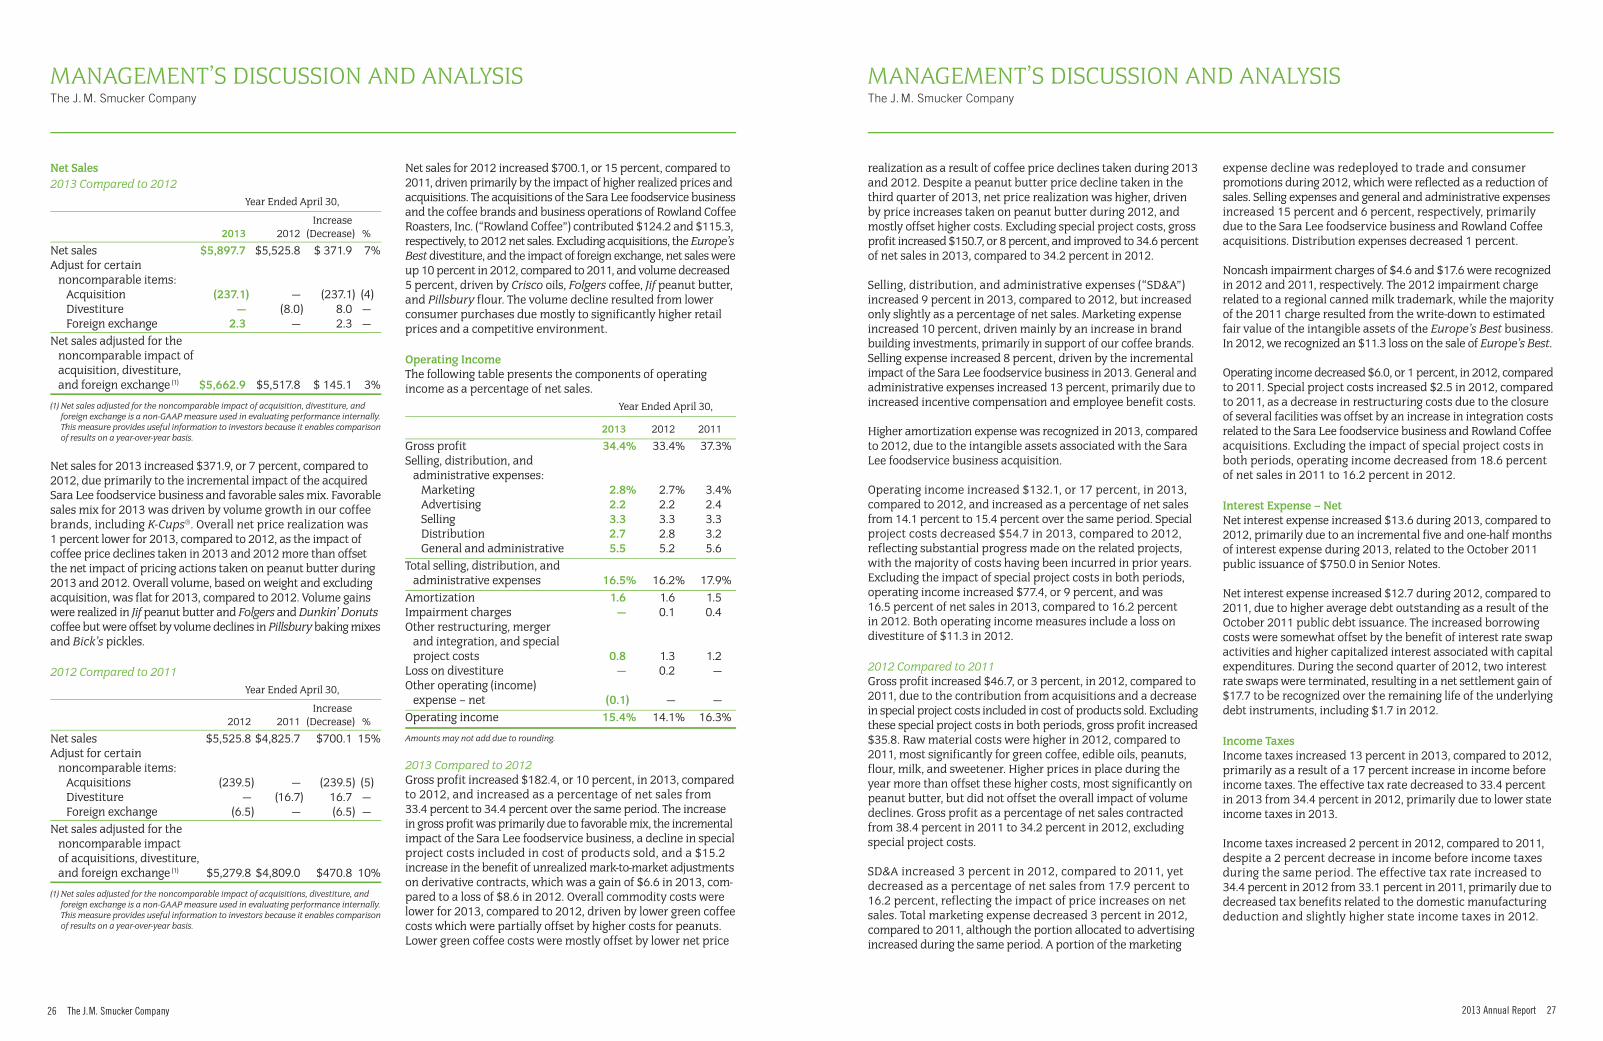
Net Sales2013 Compared to 2012 Year Ended April 30,
Increase 2013 2012 (Decrease) %
Net sales $5,897.7 $5,525.8 $ 371.9 7%Adjust for certain noncomparable items: Acquisition (237.1) — (237.1) (4) Divestiture — (8.0) 8.0 — Foreign exchange 2.3 — 2.3 —Net sales adjusted for the noncomparable impact of acquisition, divestiture, and foreign exchange (1) $5,662.9 $5,517.8 $ 145.1 3%
(1) Net sales adjusted for the noncomparable impact of acquisition, divestiture, and foreign exchange is a non-GAAP measure used in evaluating performance internally. This measure provides useful information to investors because it enables comparison of results on a year-over-year basis.
Net sales for 2013 increased $371.9, or 7 percent, compared to 2012, due primarily to the incremental impact of the acquired Sara Lee foodservice business and favorable sales mix. Favorable sales mix for 2013 was driven by volume growth in our coffee brands, including K-Cups®. Overall net price realization was 1 percent lower for 2013, compared to 2012, as the impact of coffee price declines taken in 2013 and 2012 more than offset the net impact of pricing actions taken on peanut butter during 2013 and 2012. Overall volume, based on weight and excluding acquisition, was flat for 2013, compared to 2012. Volume gains were realized in Jif peanut butter and Folgers and Dunkin’ Donuts coffee but were offset by volume declines in Pillsbury baking mixes and Bick’s pickles.
2012 Compared to 2011 Year Ended April 30,
Increase 2012 2011 (Decrease) %
Net sales $5,525.8 $4,825.7 $700.1 15%Adjust for certain noncomparable items: Acquisitions (239.5) — (239.5) (5) Divestiture — (16.7) 16.7 — Foreign exchange (6.5) — (6.5) —Net sales adjusted for the noncomparable impact of acquisitions, divestiture, and foreign exchange (1) $5,279.8 $4,809.0 $470.8 10%
(1) Net sales adjusted for the noncomparable impact of acquisitions, divestiture, and foreign exchange is a non-GAAP measure used in evaluating performance internally. This measure provides useful information to investors because it enables comparison of results on a year-over-year basis.
Net sales for 2012 increased $700.1, or 15 percent, compared to 2011, driven primarily by the impact of higher realized prices and acquisitions. The acquisitions of the Sara Lee foodservice business and the coffee brands and business operations of Rowland Coffee Roasters, Inc. (“Rowland Coffee”) contributed $124.2 and $115.3, respectively, to 2012 net sales. Excluding acquisitions, the Europe’s Best divestiture, and the impact of foreign exchange, net sales were up 10 percent in 2012, compared to 2011, and volume decreased 5 percent, driven by Crisco oils, Folgers coffee, Jif peanut butter, and Pillsbury flour. The volume decline resulted from lower consumer purchases due mostly to significantly higher retail prices and a competitive environment.
Operating IncomeThe following table presents the components of operating income as a percentage of net sales. Year Ended April 30,
2013 2012 2011
Gross profit 34.4% 33.4% 37.3%Selling, distribution, and administrative expenses: Marketing 2.8% 2.7% 3.4% Advertising 2.2 2.2 2.4 Selling 3.3 3.3 3.3 Distribution 2.7 2.8 3.2 General and administrative 5.5 5.2 5.6Total selling, distribution, and administrative expenses 16.5% 16.2% 17.9%Amortization 1.6 1.6 1.5Impairment charges — 0.1 0.4Other restructuring, merger and integration, and special project costs 0.8 1.3 1.2Loss on divestiture — 0.2 —Other operating (income) expense – net (0.1) — —Operating income 15.4% 14.1% 16.3%
Amounts may not add due to rounding.
2013 Compared to 2012Gross profit increased $182.4, or 10 percent, in 2013, compared to 2012, and increased as a percentage of net sales from 33.4 percent to 34.4 percent over the same period. The increase in gross profit was primarily due to favorable mix, the incremental impact of the Sara Lee foodservice business, a decline in special project costs included in cost of products sold, and a $15.2 increase in the benefit of unrealized mark-to-market adjustments on derivative contracts, which was a gain of $6.6 in 2013, com-pared to a loss of $8.6 in 2012. Overall commodity costs were lower for 2013, compared to 2012, driven by lower green coffee costs which were partially offset by higher costs for peanuts. Lower green coffee costs were mostly offset by lower net price
realization as a result of coffee price declines taken during 2013 and 2012. Despite a peanut butter price decline taken in the third quarter of 2013, net price realization was higher, driven by price increases taken on peanut butter during 2012, and mostly offset higher costs. Excluding special project costs, gross profit increased $150.7, or 8 percent, and improved to 34.6 percent of net sales in 2013, compared to 34.2 percent in 2012.
Selling, distribution, and administrative expenses (“SD&A”) increased 9 percent in 2013, compared to 2012, but increased only slightly as a percentage of net sales. Marketing expense increased 10 percent, driven mainly by an increase in brand building investments, primarily in support of our coffee brands. Selling expense increased 8 percent, driven by the incremental impact of the Sara Lee foodservice business in 2013. General and administrative expenses increased 13 percent, primarily due to increased incentive compensation and employee benefit costs.
Higher amortization expense was recognized in 2013, compared to 2012, due to the intangible assets associated with the Sara Lee foodservice business acquisition.
Operating income increased $132.1, or 17 percent, in 2013, compared to 2012, and increased as a percentage of net sales from 14.1 percent to 15.4 percent over the same period. Special project costs decreased $54.7 in 2013, compared to 2012, reflecting substantial progress made on the related projects, with the majority of costs having been incurred in prior years. Excluding the impact of special project costs in both periods, operating income increased $77.4, or 9 percent, and was 16.5 percent of net sales in 2013, compared to 16.2 percent in 2012. Both operating income measures include a loss on divestiture of $11.3 in 2012. 2012 Compared to 2011Gross profit increased $46.7, or 3 percent, in 2012, compared to 2011, due to the contribution from acquisitions and a decrease in special project costs included in cost of products sold. Excluding these special project costs in both periods, gross profit increased $35.8. Raw material costs were higher in 2012, compared to 2011, most significantly for green coffee, edible oils, peanuts, flour, milk, and sweetener. Higher prices in place during the year more than offset these higher costs, most significantly on peanut butter, but did not offset the overall impact of volume declines. Gross profit as a percentage of net sales contracted from 38.4 percent in 2011 to 34.2 percent in 2012, excluding special project costs.
SD&A increased 3 percent in 2012, compared to 2011, yet decreased as a percentage of net sales from 17.9 percent to 16.2 percent, reflecting the impact of price increases on net sales. Total marketing expense decreased 3 percent in 2012, compared to 2011, although the portion allocated to advertising increased during the same period. A portion of the marketing
expense decline was redeployed to trade and consumer promotions during 2012, which were reflected as a reduction of sales. Selling expenses and general and administrative expenses increased 15 percent and 6 percent, respectively, primarily due to the Sara Lee foodservice business and Rowland Coffee acquisitions. Distribution expenses decreased 1 percent.
Noncash impairment charges of $4.6 and $17.6 were recognized in 2012 and 2011, respectively. The 2012 impairment charge related to a regional canned milk trademark, while the majority of the 2011 charge resulted from the write-down to estimated fair value of the intangible assets of the Europe’s Best business. In 2012, we recognized an $11.3 loss on the sale of Europe’s Best.
Operating income decreased $6.0, or 1 percent, in 2012, compared to 2011. Special project costs increased $2.5 in 2012, compared to 2011, as a decrease in restructuring costs due to the closure of several facilities was offset by an increase in integration costs related to the Sara Lee foodservice business and Rowland Coffee acquisitions. Excluding the impact of special project costs in both periods, operating income decreased from 18.6 percent of net sales in 2011 to 16.2 percent in 2012.
Interest Expense – NetNet interest expense increased $13.6 during 2013, compared to 2012, primarily due to an incremental five and one-half months of interest expense during 2013, related to the October 2011 public issuance of $750.0 in Senior Notes.
Net interest expense increased $12.7 during 2012, compared to 2011, due to higher average debt outstanding as a result of the October 2011 public debt issuance. The increased borrowing costs were somewhat offset by the benefit of interest rate swap activities and higher capitalized interest associated with capital expenditures. During the second quarter of 2012, two interest rate swaps were terminated, resulting in a net settlement gain of $17.7 to be recognized over the remaining life of the underlying debt instruments, including $1.7 in 2012. Income Taxes Income taxes increased 13 percent in 2013, compared to 2012, primarily as a result of a 17 percent increase in income before income taxes. The effective tax rate decreased to 33.4 percent in 2013 from 34.4 percent in 2012, primarily due to lower state income taxes in 2013.
Income taxes increased 2 percent in 2012, compared to 2011, despite a 2 percent decrease in income before income taxes during the same period. The effective tax rate increased to 34.4 percent in 2012 from 33.1 percent in 2011, primarily due to decreased tax benefits related to the domestic manufacturing deduction and slightly higher state income taxes in 2012.
ManageMent’s Discussion anD analysisThe J. M. Smucker Company
ManageMent’s Discussion anD analysisThe J. M. Smucker Company
28 The J. M. Smucker Company 2013 Annual Report 29
RestructuringIn calendar 2010, plans were announced to restructure our coffee, fruit spreads, and Canadian pickle and condiments operations as part of our ongoing efforts to enhance the long-term strength and profitability of our leading brands. The initiative is a long-term investment to optimize production capacity and lower our overall cost structure, and includes capital investments for a new state-of-the-art food manufacturing facility in Orrville, Ohio; consolidation of coffee production in New Orleans, Louisiana; and the transition of pickle and condiments production to third-party manufacturers.
In addition, during 2013, we announced plans to expand capacity in order to support our growth objectives for the peanut and other nut butter businesses, including efforts to grow the Jif brand. Production expansion will include converting the Memphis, Tennessee fruit spreads facility into a peanut butter plant. The Memphis facility was originally scheduled to close as part of the fruit spreads portion of the restructuring plan. Upon completion of the conversion of the Memphis facility, we intend to relocate natural peanut butter production, currently produced at the New Bethlehem, Pennsylvania facility to the Memphis facility. The New Bethlehem facility will then be converted to produce specialty nut butters, which are currently produced by third-party manufacturers. The total capital investment for this peanut and nut butter project is estimated at approximately $70.0. Additional restructuring costs will approximate $15.0, increasing the total estimated restructuring costs to approximately $260.0. We expect the majority of the expenditures related to this initiative to occur through 2015.
Upon completion, the restructuring plan will result in a reduction of approximately 850 full-time positions. As of April 30, 2013, approximately 80 percent of the 850 full-time positions have been reduced and the Sherman, Texas; Dunnville, Ontario; Delhi Township, Ontario; and Kansas City, Missouri facilities have been closed. The Ste. Marie, Quebec facility is anticipated to close in 2014. Pickle and condiments production was transitioned to third-party manufacturers during 2012. The consolidation of coffee production in New Orleans related to these restructuring initiatives is complete. The majority of retail fruit spreads volume is being produced at the new manufacturing facility in Orrville, while production of foodservice fruit spreads is expected to be transitioned to the new facility by the end of calendar 2013. Through 2013, the overall restructuring initiative has delivered almost two-thirds of the $70.0 in annual savings originally estimated. We expect to realize the remainder of the savings by the end of 2015.
Cumulative costs of $227.6 have been incurred through April 30, 2013, including $38.8 in 2013 consisting primarily of $13.4 of site preparation and equipment relocation costs and $10.8 of production start-up costs. The majority of the remaining costs are anticipated to be recognized through 2015.
Commodities Overview The raw materials we use are primarily commodities, agricultural-based products, and packaging materials. The most significant of these materials are green coffee, peanuts, edible oils, plastic, and wheat. Green coffee, edible oils, and wheat are traded on active exchanges and the price of these commodities fluctuates based on market conditions. Derivative instruments, including futures and options, are used to minimize price volatility for these commodities.
We source green coffee from more than 20 coffee producing countries. Its price is subject to high volatility due to factors such as weather, global supply and demand, pest damage, investor speculation, and political and economic conditions in the source countries.
We source peanuts, edible oils, and wheat mainly from North America. We are one of the largest procurers of peanuts in the U.S. and frequently enter into long-term purchase contracts for various periods of time to mitigate the risk of a shortage of this key commodity. The edible oils we purchase are mainly soybean and canola. The price of peanuts, edible oils, and wheat are driven primarily by weather, which impacts crop sizes and yield, as well as global demand, especially from large importing countries such as China and India. In addition, edible oil prices have been impacted by soybean and canola demand from the biofuels industry.
We frequently enter into long-term contracts to purchase plastic containers, which are sourced mainly from within the U.S. Plastic resin is made from petrochemical feedstock and natural gas feedstock, and the price can be influenced by feedstock, energy, and crude oil prices, as well as global economic conditions.
In 2013, our overall commodity costs were lower than in 2012, driven primarily by lower green coffee costs, which were partially offset by higher costs for peanuts.
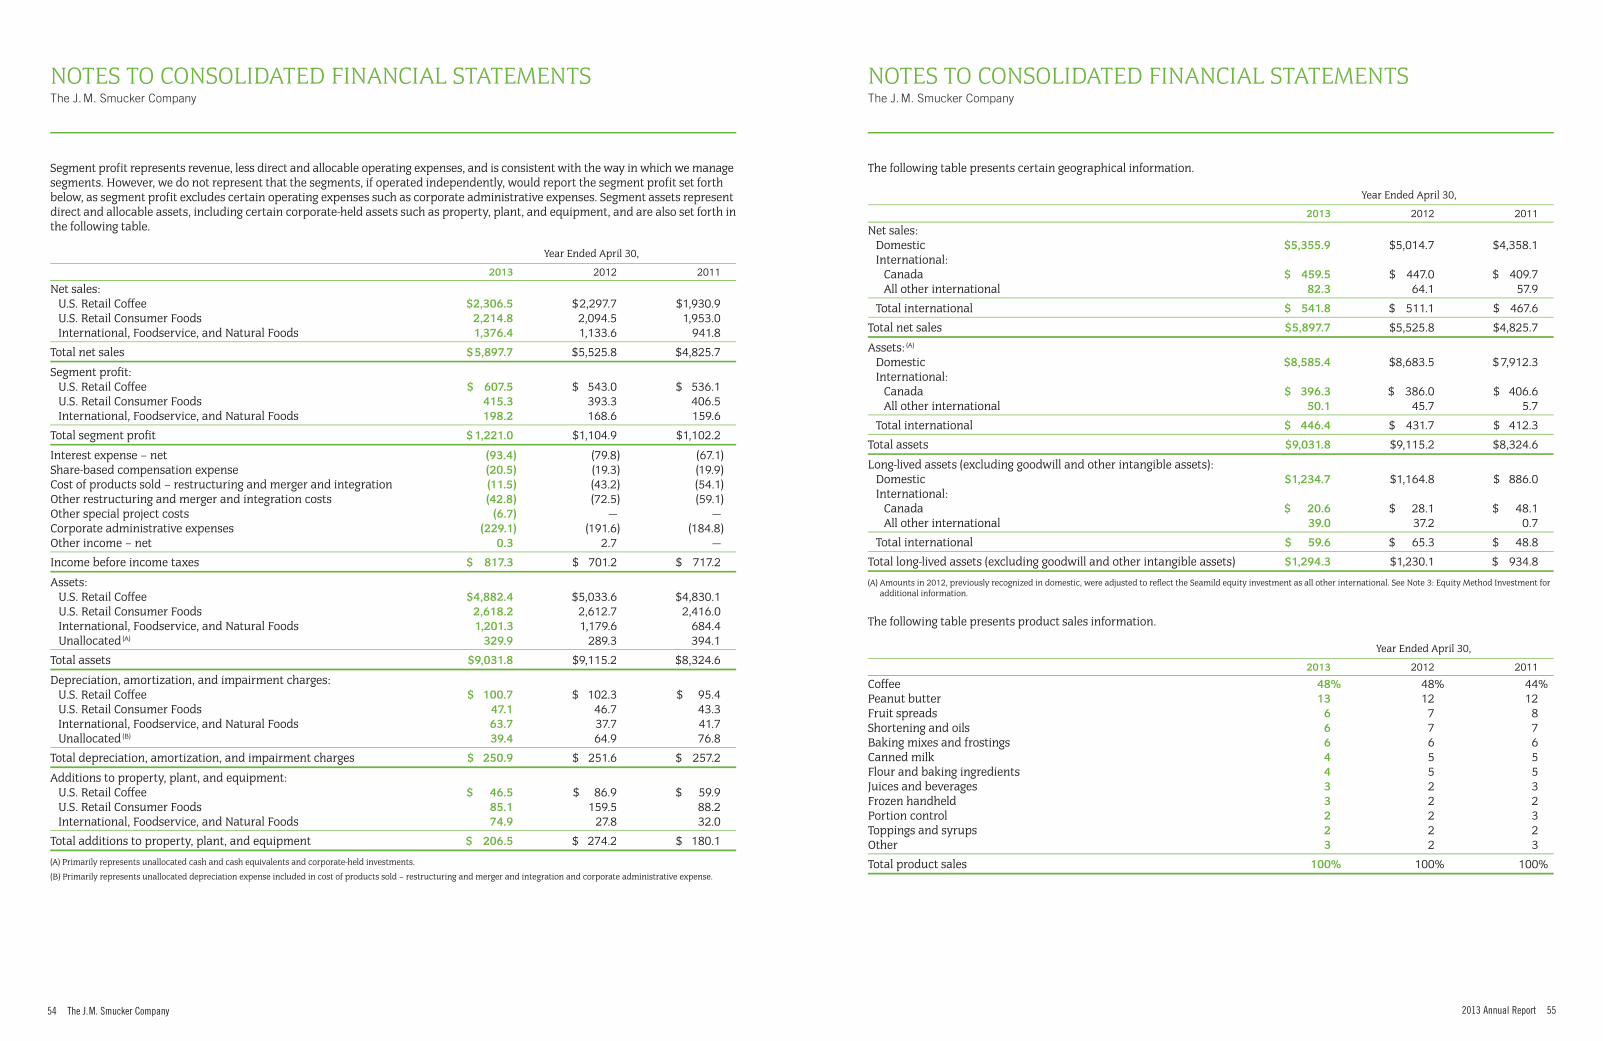
Segment ResultsWe have three reportable segments: U.S. Retail Coffee, U.S. Retail Consumer Foods, and International, Foodservice, and Natural Foods. The U.S. Retail Coffee segment primarily represents the domestic sales of Folgers, Dunkin’ Donuts, Millstone, Café Bustelo, and Café Pilon branded coffee; the U.S. Retail Consumer Foods segment primarily includes domestic sales of Jif, Smucker’s, Pillsbury, Crisco, Martha White, Hungry Jack, and Eagle Brand branded products; and the International, Foodservice, and Natural Foods segment is comprised of products distributed domestically and in foreign countries through retail channels, foodservice distributors and operators (e.g., restaurants, lodging, schools and universities, health care operators), and health and natural foods stores and distributors.
Net sales: U.S. Retail Coffee $2,306.5 $2,297.7 $1,930.9 —% 19% U.S. Retail Consumer Foods 2,214.8 2,094.5 1,953.0 6 7 International, Foodservice, and Natural Foods 1,376.4 1,133.6 941.8 21 20Segment profit: U.S. Retail Coffee $ 607.5 $ 543.0 $ 536.1 12% 1% U.S. Retail Consumer Foods 415.3 393.3 406.5 6 (3) International, Foodservice, and Natural Foods 198.2 168.6 159.6 18 6Segment profit margin: U.S. Retail Coffee 26.3% 23.6% 27.8% U.S. Retail Consumer Foods 18.8 18.8 20.8 International, Foodservice, and Natural Foods 14.4 14.9 16.9
U.S. Retail CoffeeNet sales for the U.S. Retail Coffee segment were flat in 2013, compared to 2012, as favorable sales mix driven primarily by K-Cups and increased volume offset the impact of price declines taken during 2013 and 2012. Segment volume increased 4 percent in 2013, compared to 2012, as the Folgers, Dunkin’ Donuts, and Café Bustelo brands increased 3 percent, 11 percent, and 16 percent, respectively. Net sales of K-Cups increased $108.0, or 61 percent, compared to 2012, and contributed 5 percentage points of growth to segment net sales, while representing only 1 percentage point of volume growth. Segment profit increased 12 percent in 2013, compared to 2012, while segment profit margin increased to 26.3 percent from 23.6 percent in 2012. The increase in segment profit was primarily due to volume growth and favorable mix, partially offset by increased market-ing expense. Green coffee costs were lower in 2013, compared to 2012, but were mostly offset by lower net price realization and did not contribute significantly to the increase in segment profit.
Net sales for the U.S. Retail Coffee segment increased 19 percent in 2012, compared to 2011, including the net realization of price increases. The acquisition of Rowland Coffee contributed $99.3 to segment net sales, representing 5 percentage points of the increase. Excluding Rowland Coffee, segment volume decreased 8 percent. Volume declined for the Folgers brand in line with the overall segment, and was primarily attributed to consumer response to higher prices and aggressive private label price points by certain key retailers. Additionally, volume decreased 5 percent for Dunkin’ Donuts packaged coffee. Contributing to favorable sales mix in 2012, net sales of K-Cups totaled $178.2, an increase of $125.2, compared to 2011, and represented 6 percent-age points of segment net sales growth, but contributed only 1 percentage point growth to volume. Segment profit increased 1 percent in 2012, compared to 2011, despite volume declines, due to the Rowland Coffee acquisition, while segment profit
margin declined to 23.6 percent from 27.8 percent in 2011. Price increases realized during the year more than offset higher green coffee costs and, along with a decrease in segment marketing and distribution expenses, also contributed to segment profit.
U.S. Retail Consumer FoodsNet sales for the U.S. Retail Consumer Foods segment increased 6 percent in 2013, compared to 2012, due primarily to higher net price realization and favorable sales mix, offset partially by a 1 percent decline in segment volume. Jif brand net sales increased 21 percent in 2013, compared to 2012, reflecting overall higher net price realization and an 8 percent increase in volume. The overall higher net price realization resulted from price increases taken during 2012, which were only partially offset by a price decline taken in the third quarter of 2013. Smucker’s fruit spreads net sales were down 1 percent, while volume was flat. Net sales and volume of Smucker’s Uncrustables® frozen sandwiches increased 24 percent and 23 percent, respectively, in 2013, compared to 2012, benefiting from new distribution. Crisco brand net sales and volume decreased 5 percent and 3 percent, respectively, in 2013, compared to 2012, resulting from declines at a key retailer. For the same period, net sales for the Pillsbury brand increased 8 percent, while volume decreased 4 percent mainly due to the tonnage impact of a cake mix downsizing made early in 2013. Segment profit increased 6 percent in 2013, compared to 2012, while segment profit margin was 18.8 percent of net sales in both periods. The increase in segment profit was primarily due to favorable mix and a decrease in marketing expense. Overall raw material costs were higher for 2013, driven by peanuts, but were mostly offset by higher net price realization. The peanut butter price decline in the third quarter of 2013 was taken in anticipation of lower peanut costs in 2014, and resulted in higher peanut costs not being fully recovered during 2013.
ManageMent’s Discussion anD analysisThe J. M. Smucker Company
ManageMent’s Discussion anD analysisThe J. M. Smucker Company
30 The J. M. Smucker Company 2013 Annual Report 31
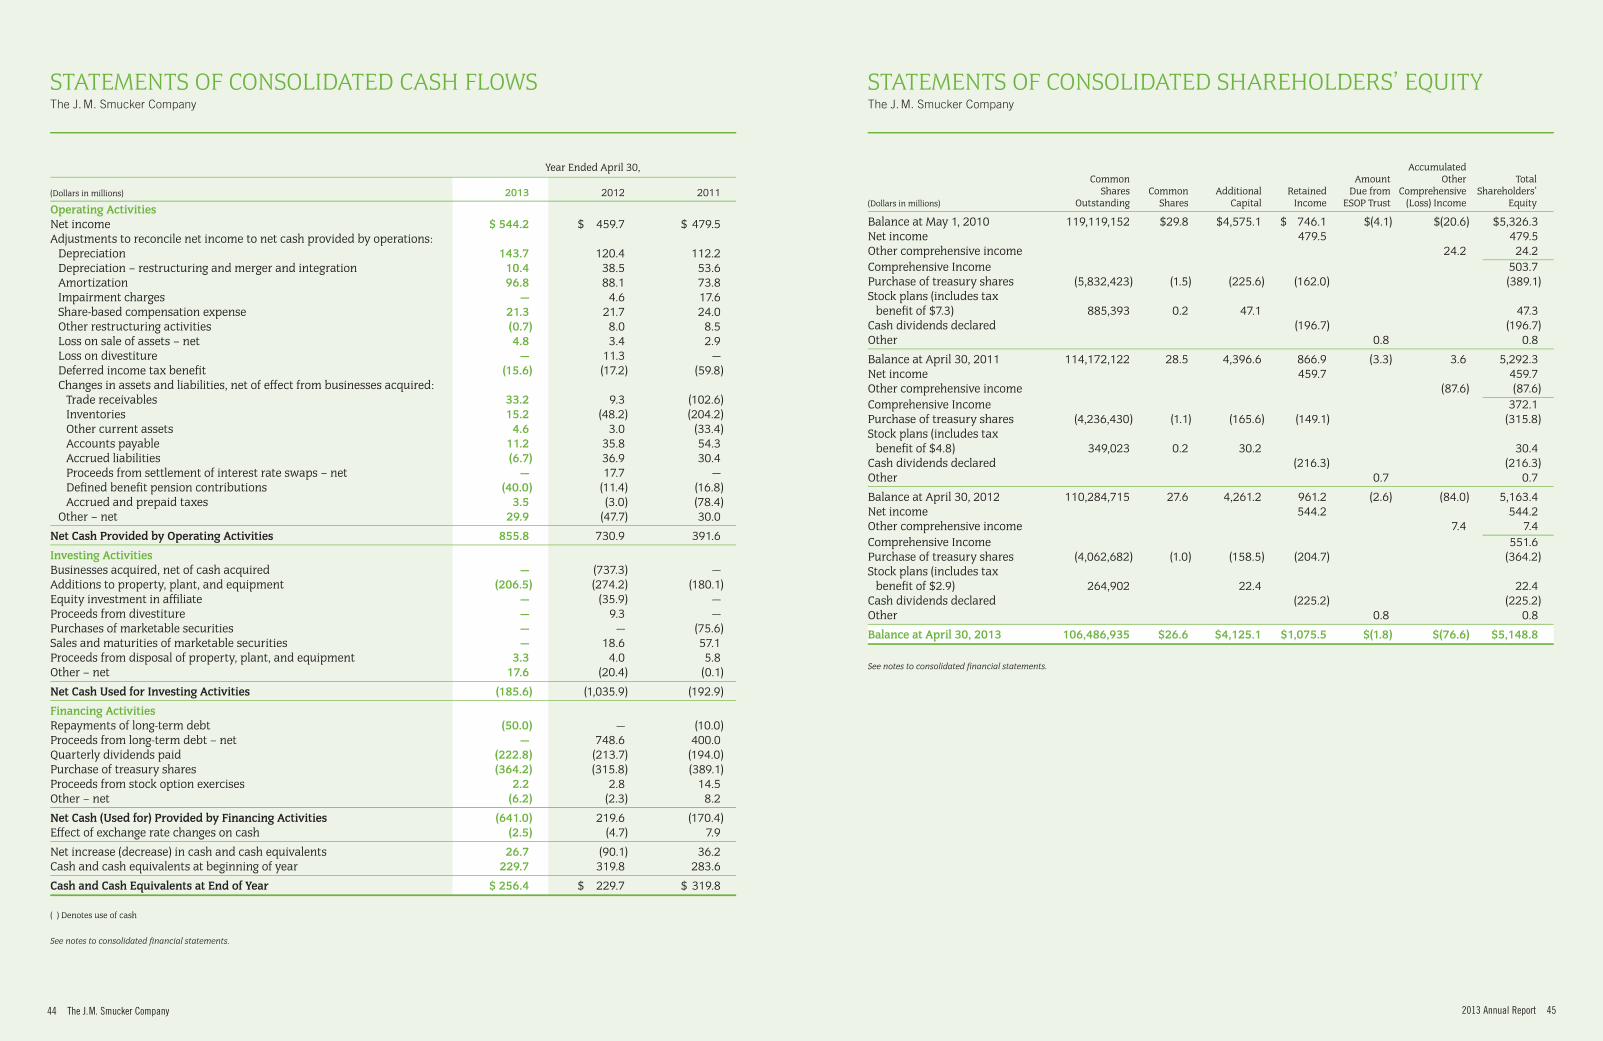
The following table presents selected cash flow information.
Year Ended April 30,
2013 2012 2011
Net cash provided by operating activities $ 855.8 $ 730.9 $ 391.6 Net cash used for investing activities (185.6) (1,035.9) (192.9)Net cash (used for) provided by financing activities (641.0) 219.6 (170.4)
Net cash provided by operating activities $ 855.8 $ 730.9 $ 391.6 Additions to property, plant, and equipment (206.5) (274.2) (180.1)
Free cash flow (1) $ 649.3 $ 456.7 $ 211.5
(1) Free cash flow is a non-GAAP measure used by management to evaluate the amount of cash available for debt repayment, dividend distribution, acquisition opportunities, share repurchases, and other corporate purposes.
Cash provided by operating activities was $855.8, $730.9, and $391.6 in 2013, 2012, and 2011, respectively. The increase in cash provided by operating activities in 2013, compared to 2012, was primarily due to higher net income in 2013 and a reduction in the use of cash required to fund inventory. This reduction in the use of cash was mainly the result of lower green coffee costs and a reduction in inventory levels. The increase in cash provided by operating activities in 2012, compared to 2011, was primarily related to a decrease in working capital require-ments due to lower inventory levels and a decrease in income tax payments. Additionally, as the Easter holiday occurred later in 2011, more of the collection cycle occurred during 2012 than it did during 2011.
Cash used for investing activities was $185.6, $1,035.9, and $192.9 in 2013, 2012, and 2011, respectively. In 2013, cash used for investing activities consisted mainly of $206.5 in capital expen-ditures, including approximately $43.5 related to expenditures associated with the restructuring program. Cash used for investing activities in 2012 consisted primarily of $737.3 related to the Sara Lee foodservice business and Rowland Coffee acquisitions and $274.2 in capital expenditures, including approximately $134.2 related to expenditures associated with the restructuring program. In 2011, cash used for investing activities consisted primarily of $180.1 in capital expenditures and the purchase of $75.6 of marketable securities.
Cash used for financing activities during 2013 was $641.0, consisting of the purchase of treasury shares for $364.2, primarily representing the repurchase of 4.0 million common shares available under Board of Directors’ authorizations, quarterly dividend payments of $222.8, and a Senior Notes principal payment of $50.0. Cash provided by financing activities during 2012 was $219.6. Proceeds of $748.6 related to the October 2011 public debt issuance were partially offset by quarterly dividend payments of $213.7 and the purchase of treasury shares for
$315.8, primarily representing the repurchase of approximately 4.1 million common shares. Cash used for financing activities during 2011 was $170.4. The issuance of $400.0 in Senior Notes was more than offset by quarterly dividend payments of $194.0 and the purchase of treasury shares for $389.1, including the repurchase of approximately 5.7 million common shares.
Capital ResourcesThe following table presents our capital structure.
April 30,
2013 2012
Current portion of long-term debt $ 50.0 $ 50.0Long-term debt 1,967.8 2,020.5
Total long-term debt $2,017.8 $2,070.5Shareholders’ equity 5,148.8 5,163.4
Total capital $7,166.6 $7,233.9
We have available a $1.0 billion revolving credit facility with a group of nine banks that matures in July 2016. There was no balance outstanding under the revolving credit facility at April 30, 2013.
Our debt instruments contain certain financial covenant restric-tions including consolidated net worth, a leverage ratio, and an interest coverage ratio. We are in compliance with all covenants.
During 2013, we repurchased 4.0 million common shares for $359.4. At April 30, 2013, approximately 4.9 million common shares were available for repurchase under the Board of Directors’ most recent authorization.
Subsequent to April 30, 2013, we repurchased approximately 0.6 million common shares for $60.8, utilizing proceeds of $29.0 from our revolving credit facility. Approximately 4.3 million shares remain available for repurchase as of June 18, 2013. There is no guarantee as to the exact number of shares that may be repurchased or when such purchases may occur.
Cash requirements for 2014 will include capital expenditures of approximately $270.0, including amounts related to the restructuring program, quarterly dividend payments of approximately $220.0 based on current rates and common shares outstanding, and interest and principal payments on debt obligations of approximately $95.0 and $50.0, respectively. Absent any further acquisitions or other significant investments, we believe that cash on hand, combined with cash provided by operations and borrowings available under our credit facility, will be sufficient to meet cash requirements for the next 12 months. As of April 30, 2013, approximately $147.2 of total cash and cash equivalents was held by our international subsidiaries. We do not intend to repatriate these funds to meet these obliga-tions. Should we repatriate these funds, we will be required to provide taxes based on the applicable U.S. tax rates net of any foreign tax credit consideration.
Net sales for the U.S. Retail Consumer Foods segment increased 7 percent in 2012, compared to 2011, as the impact of price increases more than offset a 6 percent decline in segment volume. Jif peanut butter net sales increased 16 percent in 2012, compared to 2011, reflecting price increases taken during 2012, somewhat offset by a 6 percent volume decline. The overall decline in peanut butter volume was due to consumer response to significantly higher retail prices, lost peanut butter distribution with a key retailer during the year, and competitive activity. Smucker’s fruit spreads net sales increased 1 percent and volume was down 4 percent during the same period, primarily due to competitive activity, as well as fewer cross-promotional activities with peanut butter. Crisco brand net sales, including the realization of higher prices, increased 5 percent, while volume was down 15 percent as the brand experienced substantial price competition with private label offerings by certain retailers. For the same period, net sales for the Pillsbury brand increased 9 percent and volume was flat, as declines in flour were offset by increases in baking mixes. Canned milk net sales increased 3 percent and volume decreased 4 percent during 2012, compared to 2011. Segment profit decreased 3 percent in 2012, compared to 2011, primarily due to an impairment charge of approximately $4.6 related to a regional canned milk trademark and higher segment distribution and selling expenses. Price increases taken during 2012, most notably on peanut butter, essentially offset both higher commod-ity costs and the volume decline. Segment profit margin was 18.8 percent in 2012, compared to 20.8 percent in 2011.
International, Foodservice, and Natural FoodsNet sales for the International, Foodservice, and Natural Foods segment increased 21 percent in 2013, compared to 2012, due to the impact of the additional eight months of the acquired Sara Lee foodservice business, which contributed $237.1, representing virtually all of the net sales growth. Excluding the impact of the acquisition, the Europe’s Best divestiture in Canada, and foreign exchange, segment net sales and volume both increased 1 percent over the same period last year. Volume gains were realized in nonbranded beverages and the Robin Hood and Five Roses Canadian flour brands, while volume declines were realized in Bick’s pickles. Segment profit increased 18 percent in 2013, compared to 2012, while segment profit margin declined to 14.4 percent from 14.9 percent over the same period. Excluding an $11.3 loss on divestiture in 2012, segment profit increased 10 percent, driven primarily by the incremental impact of the Sara Lee foodservice business, price increases, and favorable mix. During the second quarter of 2013, we announced our plan to exit the private label roast and ground coffee portion of the acquired Sara Lee foodservice business which is expected to reduce annual net sales by approximately $100.0. Although the exit began in the third quarter, it did not have a material impact on 2013 results. We expect to complete the exit during 2014.
During the fourth quarter of 2013, we began our planned exit of a portion of the Smucker’s Uncrustables frozen sandwich schools business. We anticipate the exit will reduce annual net sales for the International, Foodservice, and Natural Foods segment by approximately $25.0 to $35.0, although we expect that a portion of this decrease will eventually be offset by increased sales of Smucker’s Uncrustables in the U.S. Retail Consumer Foods segment.
Also during the fourth quarter of 2013, we entered into a multi-year licensing and distribution agreement with Cumberland Packing Corp. (“Cumberland”) whereby, beginning in July 2013, we will market and distribute Cumberland’s branded tabletop sweeteners (“Cumberland products”) to foodservice customers in the U.S. and to retail and foodservice customers in Canada. The Cumberland products include the Sweet‘N Low®, NatraTaste®, Sugar In The Raw®, and other “In The Raw” brands. On a full-year basis, net sales of Cumberland products are expected to approximate $40.0 million.
Net sales for the International, Foodservice, and Natural Foods segment increased 20 percent in 2012, compared to 2011. The acquisition of the Sara Lee foodservice business contributed $124.2 to segment net sales, while Rowland Coffee contributed $16.0. In total, the impact of the acquisitions represented 15 percentage points of the increase in segment net sales. Excluding the impact of acquisitions, divestiture, and foreign exchange, segment net sales increased 7 percent compared to the same period last year and volume declined 2 percent. Segment profit increased 6 percent, but declined to 14.9 percent of net sales in 2012 from 16.9 percent of net sales in 2011, partially reflecting the acquisition of the lower-margin Sara Lee foodservice business. An $11.3 loss was recognized on the Europe’s Best divestiture in 2012, while a $17.2 noncash impairment charge related to Europe’s Best intangible assets was recognized in 2011.
finanCial CondiTionLiquidityOur principal source of funds is cash generated from operations, supplemented by borrowings against our revolving credit facility. Total cash and cash equivalents increased to $256.4 at April 30, 2013, compared to $229.7 at April 30, 2012.
We typically expect a significant use of cash to fund working capital requirements during the first half of each fiscal year, primarily due to seasonal fruit procurement, the buildup of inventories to support the Fall Bake and Holiday period, and the additional increase of coffee inventory in advance of the Atlantic hurricane season. We expect cash provided by opera-tions in the second half of the fiscal year to significantly exceed the amount in the first half of the year, upon completion of the Fall Bake and Holiday period.
ManageMent’s Discussion anD analysisThe J. M. Smucker Company
ManageMent’s Discussion anD analysisThe J. M. Smucker Company
32 The J. M. Smucker Company 2013 Annual Report 33
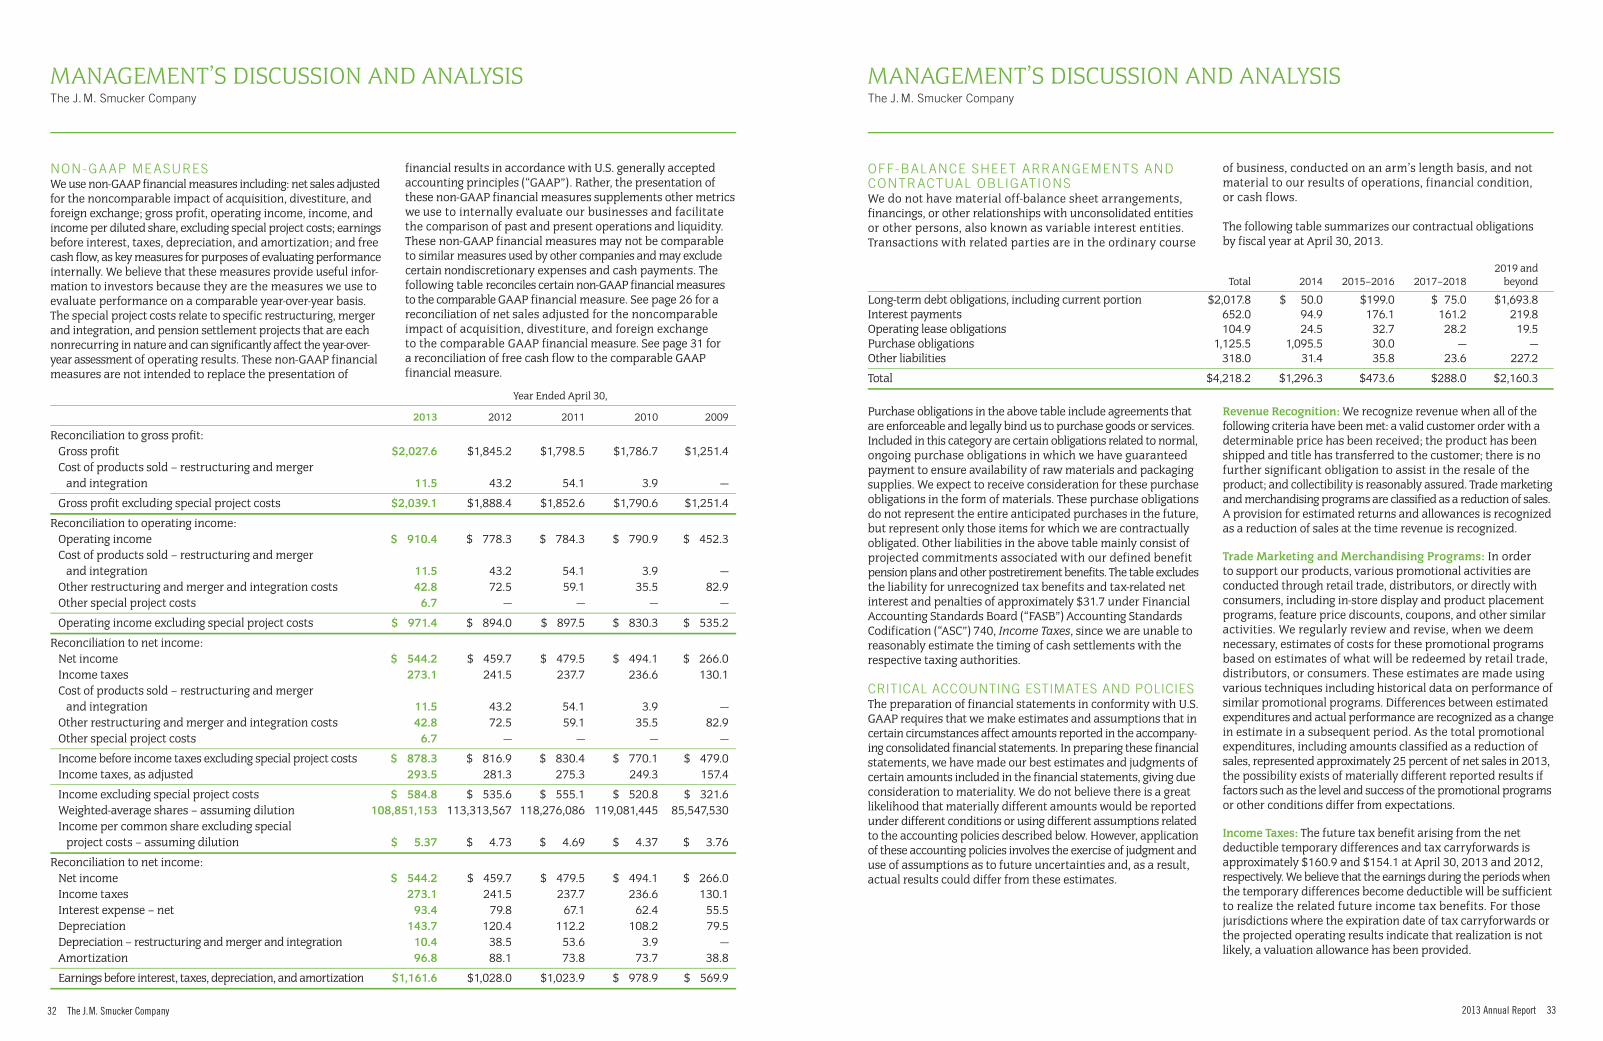
non-gaap MEaSurES We use non-GAAP financial measures including: net sales adjusted for the noncomparable impact of acquisition, divestiture, and foreign exchange; gross profit, operating income, income, and income per diluted share, excluding special project costs; earnings before interest, taxes, depreciation, and amortization; and free cash flow, as key measures for purposes of evaluating performance internally. We believe that these measures provide useful infor-mation to investors because they are the measures we use to evaluate performance on a comparable year-over-year basis. The special project costs relate to specific restructuring, merger and integration, and pension settlement projects that are each nonrecurring in nature and can significantly affect the year-over-year assessment of operating results. These non-GAAP financial measures are not intended to replace the presentation of
financial results in accordance with U.S. generally accepted accounting principles (“GAAP”). Rather, the presentation of these non-GAAP financial measures supplements other metrics we use to internally evaluate our businesses and facilitate the comparison of past and present operations and liquidity. These non-GAAP financial measures may not be comparable to similar measures used by other companies and may exclude certain nondiscretionary expenses and cash payments. The following table reconciles certain non-GAAP financial measures to the comparable GAAP financial measure. See page 26 for a reconciliation of net sales adjusted for the noncomparable impact of acquisition, divestiture, and foreign exchange to the comparable GAAP financial measure. See page 31 for a reconciliation of free cash flow to the comparable GAAP financial measure.
Year Ended April 30,
2013 2012 2011 2010 2009
Reconciliation to gross profit: Gross profit $2,027.6 $1,845.2 $1,798.5 $1,786.7 $1,251.4 Cost of products sold – restructuring and merger and integration 11.5 43.2 54.1 3.9 —
Reconciliation to operating income: Operating income $ 910.4 $ 778.3 $ 784.3 $ 790.9 $ 452.3 Cost of products sold – restructuring and merger and integration 11.5 43.2 54.1 3.9 — Other restructuring and merger and integration costs 42.8 72.5 59.1 35.5 82.9 Other special project costs 6.7 — — — —
Operating income excluding special project costs $ 971.4 $ 894.0 $ 897.5 $ 830.3 $ 535.2
Reconciliation to net income: Net income $ 544.2 $ 459.7 $ 479.5 $ 494.1 $ 266.0 Income taxes 273.1 241.5 237.7 236.6 130.1 Cost of products sold – restructuring and merger and integration 11.5 43.2 54.1 3.9 — Other restructuring and merger and integration costs 42.8 72.5 59.1 35.5 82.9 Other special project costs 6.7 — — — —
Income before income taxes excluding special project costs $ 878.3 $ 816.9 $ 830.4 $ 770.1 $ 479.0 Income taxes, as adjusted 293.5 281.3 275.3 249.3 157.4
Income excluding special project costs $ 584.8 $ 535.6 $ 555.1 $ 520.8 $ 321.6 Weighted-average shares – assuming dilution 108,851,153 113,313,567 118,276,086 119,081,445 85,547,530 Income per common share excluding special project costs – assuming dilution $ 5.37 $ 4.73 $ 4.69 $ 4.37 $ 3.76
Reconciliation to net income: Net income $ 544.2 $ 459.7 $ 479.5 $ 494.1 $ 266.0 Income taxes 273.1 241.5 237.7 236.6 130.1 Interest expense – net 93.4 79.8 67.1 62.4 55.5 Depreciation 143.7 120.4 112.2 108.2 79.5 Depreciation – restructuring and merger and integration 10.4 38.5 53.6 3.9 — Amortization 96.8 88.1 73.8 73.7 38.8
Earnings before interest, taxes, depreciation, and amortization $1,161.6 $1,028.0 $1,023.9 $ 978.9 $ 569.9
off-BalanCE ShEET arrangEMEnTS and ConTraCTual oBligaTionSWe do not have material off-balance sheet arrangements, financings, or other relationships with unconsolidated entities or other persons, also known as variable interest entities. Transactions with related parties are in the ordinary course
of business, conducted on an arm’s length basis, and not material to our results of operations, financial condition, or cash flows.
The following table summarizes our contractual obligations by fiscal year at April 30, 2013.
Purchase obligations in the above table include agreements that are enforceable and legally bind us to purchase goods or services. Included in this category are certain obligations related to normal, ongoing purchase obligations in which we have guaranteed payment to ensure availability of raw materials and packaging supplies. We expect to receive consideration for these purchase obligations in the form of materials. These purchase obligations do not represent the entire anticipated purchases in the future, but represent only those items for which we are contractually obligated. Other liabilities in the above table mainly consist of projected commitments associated with our defined benefit pension plans and other postretirement benefits. The table excludes the liability for unrecognized tax benefits and tax-related net interest and penalties of approximately $31.7 under Financial Accounting Standards Board (“FASB”) Accounting Standards Codification (“ASC”) 740, Income Taxes, since we are unable to reasonably estimate the timing of cash settlements with the respective taxing authorities.
CriTiCal aCCounTing ESTiMaTES and poliCiESThe preparation of financial statements in conformity with U.S. GAAP requires that we make estimates and assumptions that in certain circumstances affect amounts reported in the accompany-ing consolidated financial statements. In preparing these financial statements, we have made our best estimates and judgments of certain amounts included in the financial statements, giving due consideration to materiality. We do not believe there is a great likelihood that materially different amounts would be reported under different conditions or using different assumptions related to the accounting policies described below. However, application of these accounting policies involves the exercise of judgment and use of assumptions as to future uncertainties and, as a result, actual results could differ from these estimates.
Revenue Recognition: We recognize revenue when all of the following criteria have been met: a valid customer order with a determinable price has been received; the product has been shipped and title has transferred to the customer; there is no further significant obligation to assist in the resale of the product; and collectibility is reasonably assured. Trade marketing and merchandising programs are classified as a reduction of sales. A provision for estimated returns and allowances is recognized as a reduction of sales at the time revenue is recognized.
Trade Marketing and Merchandising Programs: In order to support our products, various promotional activities are conducted through retail trade, distributors, or directly with consumers, including in-store display and product placement programs, feature price discounts, coupons, and other similar activities. We regularly review and revise, when we deem necessary, estimates of costs for these promotional programs based on estimates of what will be redeemed by retail trade, distributors, or consumers. These estimates are made using various techniques including historical data on performance of similar promotional programs. Differences between estimated expenditures and actual performance are recognized as a change in estimate in a subsequent period. As the total promotional expenditures, including amounts classified as a reduction of sales, represented approximately 25 percent of net sales in 2013, the possibility exists of materially different reported results if factors such as the level and success of the promotional programs or other conditions differ from expectations.
Income Taxes: The future tax benefit arising from the net deductible temporary differences and tax carryforwards is approximately $160.9 and $154.1 at April 30, 2013 and 2012, respectively. We believe that the earnings during the periods when the temporary differences become deductible will be sufficient to realize the related future income tax benefits. For those jurisdictions where the expiration date of tax carryforwards or the projected operating results indicate that realization is not likely, a valuation allowance has been provided.
ManageMent’s Discussion anD analysisThe J. M. Smucker Company
ManageMent’s Discussion anD analysisThe J. M. Smucker Company
34 The J. M. Smucker Company 2013 Annual Report 35
In assessing the need for a valuation allowance, we estimate future taxable income, considering the viability of ongoing tax planning strategies and the probable recognition of future tax deductions and loss carryforwards. Valuation allowances related to deferred tax assets can be affected by changes in tax laws, statutory tax rates, and projected future taxable income levels. Changes in estimated realization of deferred tax assets would result in an adjustment to income in the period in which that determination is made.
In the ordinary course of business, we are exposed to uncertainties related to tax filing positions and periodically assess these tax positions for all tax years that remain subject to examination, based upon the latest information available. For uncertain tax positions, we have recognized a liability for unrecognized tax benefits, including any applicable interest and penalty charges.
Long-Lived Assets: Long-lived assets, except goodwill and indefinite-lived intangible assets, are reviewed for impairment whenever events or changes in circumstances indicate that the carrying amount of the asset may not be recoverable. Recoverability of assets to be held and used is measured by a comparison of the carrying amount of the assets to future net undiscounted cash flows estimated to be generated by such assets. If such assets are considered to be impaired, the impair-ment to be recognized is the amount by which the carrying amount of the assets exceeds the estimated fair value of the assets. However, determining fair value is subject to estimates of both cash flows and discount rates and different estimates could yield different results. There are no events or changes in circumstances of which we are aware that indicate the carry-ing value of our long-lived assets may not be recoverable at April 30, 2013.
Goodwill and Other Indefinite-Lived Intangible Assets: We are required to test goodwill for impairment annually and more often if indicators of impairment exist. To test for goodwill impairment, we estimate the fair value of each of our six reporting units using both a discounted cash flow valuation technique and a market-based approach. The impairment test incorporates estimates of future cash flows, allocations of certain assets, liabilities, and cash flows among reporting units, future growth rates, terminal value amounts, and the applicable weighted-average cost of capital used to discount those estimated cash flows. The estimates and projections used in the calculation of fair value are consistent with our current and long-range plans, including anticipated changes in market conditions, industry trends, growth rates, and planned capital expenditures. Changes in forecasted oper-ations and other estimates and assumptions could impact the assessment of impairment in the future.
At April 30, 2013, goodwill totaled $3.1 billion. Goodwill is substantially concentrated within the U.S. Retail Coffee and U.S. Retail Consumer Foods segments. No goodwill impairment was recognized as a result of the annual evaluation performed as of February 1, 2013. The estimated fair value of each reporting
unit was substantially in excess of its carrying value as of the annual test date.
Other indefinite-lived intangible assets, consisting entirely of trademarks, are also tested for impairment annually and when-ever events or changes in circumstances indicate their carrying value may not be recoverable. To test these assets for impairment, we estimate the fair value of each asset based on a discounted cash flow model using various inputs, including projected revenues, an assumed royalty rate, and a discount rate. Changes in these estimates and assumptions could impact the assessment of impairment in the future.
At April 30, 2013, other indefinite-lived intangible assets totaled $1.8 billion. Trademarks that represent our leading, iconic brands comprise more than 90 percent of the total carrying value of other indefinite-lived intangible assets. Each of these trademarks had an estimated fair value substantially in excess of its carrying value as of the annual test date, with the exception of the Crisco trademark. A sensitivity analysis was performed on the Crisco trademark and yielded an estimated fair value slightly below carrying value resulting from a hypothetical 50 basis point increase in the discount rate and a 50 basis point decrease in the expected long-term growth rate. The Crisco trademark represents less than 10 percent of total other indefinite-lived intangible assets.
Pension and Other Postretirement Benefit Plans: To determine the ultimate obligation under our defined benefit pension plans and other postretirement benefit plans, we must estimate the future cost of benefits and attribute that cost to the time period during which each covered employee works. Various actuarial assumptions must be made in order to predict and measure costs and obligations many years prior to the settlement date, the most significant being the interest rates used to discount the obligations of the plans, the long-term rates of return on the plans’ assets, assumed pay increases, and the health care cost trend rates. We, along with third-party actuaries and investment managers, review all of these assumptions on an ongoing basis to ensure that the most reasonable information available is being considered. For 2014 expense recognition, we will use a weighted-average discount rate of 3.99 percent and 3.65 percent, and a rate of compensation increase of 4.12 percent and 3.00 percent for the U.S. and Canadian plans, respectively. We anticipate using an expected rate of return on plan assets of 6.75 percent for U.S. plans. For the Canadian plans, we anticipate using an expected rate of return on plan assets of 6.00 percent for the hourly plan and 6.25 percent for all other plans.
dErivaTivE finanCial inSTruMEnTS and MarkET riSkThe following discussions about our market risk disclosures involve forward-looking statements. Actual results could differ from those projected in the forward-looking statements. We are exposed to market risk related to changes in interest rates, foreign currency exchange rates, and commodity prices.
Interest Rate Risk: The fair value of our cash and cash equivalents at April 30, 2013, approximates carrying value. Exposure to interest rate risk on our long-term debt is mitigated due to fixed-rate maturities.
We utilize derivative instruments to manage changes in the fair value of our debt. Interest rate swaps mitigate the risk associated with the underlying hedged item. At the inception of the contract, the instrument is evaluated and documented for hedge account-ing treatment. If the contract is designated as a cash flow hedge, the mark-to-market gains or losses on the swap are deferred and included as a component of accumulated other comprehensive loss to the extent effective, and reclassified to interest expense in the period during which the hedged transaction affects earnings. If the contract is designated as a fair value hedge, the swap would be recognized at fair value on the balance sheet and changes in the fair value would be recognized in interest expense. Generally, changes in the fair value of the derivative are equal to changes in the fair value of the underlying debt and have no impact on earnings. We did not have any interest rate swaps outstanding at April 30, 2013 and 2012.
Based on our overall interest rate exposure as of and during the year ended April 30, 2013, including derivatives and other instruments sensitive to interest rates, a hypothetical 10 percent movement in interest rates would not materially affect our results of operations. In measuring interest rate risk by the amount of net change in the fair value of our financial liabilities, a hypothetical 1 percent decrease in interest rates at April 30, 2013, would increase the fair value of our long-term debt by approximately $104.1.
Foreign Currency Exchange Risk: We have operations outside the U.S. with foreign currency denominated assets and liabilities, primarily denominated in Canadian currency. Because we have foreign currency denominated assets and liabilities, financial exposure may result, primarily from the timing of transactions and the movement of exchange rates. The foreign currency balance sheet exposures as of April 30, 2013, are not expected to result in a significant impact on future earnings or cash flows.
We utilize foreign currency exchange forwards and options contracts to manage the price volatility of foreign currency exchange fluctuations on future cash payments primarily related to purchases of certain raw materials, finished goods, and fixed assets in Canada. The contracts generally have maturities of less than one year. Instruments currently used to manage foreign currency exchange exposures do not meet the requirements for hedge accounting treatment and the change in value of these instruments is immediately recognized in cost of products sold. If the contract qualifies for hedge accounting treatment, to the extent the hedge is deemed effective, the associated mark-to-market gains and losses are deferred and included
as a component of accumulated other comprehensive loss. These gains or losses are reclassified to earnings in the period the contract is executed. The ineffective portion of these contracts is immediately recognized in earnings. Based on our hedged foreign currency positions as of April 30, 2013, a hypothetical 10 percent change in exchange rates would not result in a material loss of fair value.
Revenues from customers outside the U.S., subject to foreign currency exchange, represented 8 percent of net sales during 2013. Thus, certain revenues and expenses have been, and are expected to be, subject to the effect of foreign currency fluctuations, and these fluctuations may have an impact on operating results.
Commodity Price Risk: We use certain raw materials and other commodities that are subject to price volatility caused by supply and demand conditions, political and economic variables, weather, investor speculation, and other unpredictable factors. To manage the volatility related to anticipated commodity purchases, we use futures and options with maturities of generally less than one year. Certain of these instruments are designated as cash flow hedges. The mark-to-market gains or losses on qualifying hedges are included in accumulated other comprehensive loss to the extent effective and reclassified to cost of products sold in the period during which the hedged transaction affects earnings. The mark-to-market gains or losses on nonqualifying, excluded, and ineffective portions of hedges are recognized in cost of products sold immediately.
The following sensitivity analysis presents our potential loss of fair value resulting from a hypothetical 10 percent change in market prices related to raw material commodities.
Year Ended April 30,
2013 2012
High $34.0 $28.0Low 7.6 6.4Average 20.7 14.6
The estimated fair value was determined using quoted market prices and was based on our net derivative position by commodity at each quarter end during the fiscal year. The calculations are not intended to represent actual losses in fair value that we expect to incur. In practice, as markets move, we actively manage our risk and adjust hedging strategies as appropriate. The commodities hedged have a high inverse correlation to price changes of the derivative commodity instrument; thus, we would expect that any gain or loss in the estimated fair value of its derivatives would generally be offset by an increase or decrease in the estimated fair value of the underlying exposures.
36 The J. M. Smucker Company 2013 Annual Report 37
management’S DiScuSSion anD analySiSThe J. M. Smucker Company
report of management on internal control over financial reportingThe J. M. Smucker Company
forward-looking STaTEMEnTS Certain statements included in this Annual Report contain forward-looking statements within the meaning of federal securities laws. The forward-looking statements may include statements concerning our current expectations, estimates, assumptions, and beliefs concerning future events, conditions, plans, and strategies that are not historical fact. Any statement that is not historical in nature is a forward-looking statement and may be identified by the use of words and phrases such as “expects,” “anticipates,” “believes,” “will,” “plans,” and similar phrases.
Federal securities laws provide a safe harbor for forward-looking statements to encourage companies to provide prospective information. We are providing this cautionary statement in connection with the safe harbor provisions. Readers are cautioned not to place undue reliance on any forward-looking statements, as such statements are by nature subject to risks, uncertainties, and other factors, many of which are outside our control and could cause actual results to differ materially from such statements and from our historical results and experience. These risks and uncertainties include, but are not limited to, those set forth under the caption “Risk Factors” in our Annual Report on Form 10-K, as well as the following:
• volatility of commodity markets from which raw materials, particularly green coffee beans, peanuts, soybean oil, wheat, milk, corn, and sugar, are procured and the related impact on costs;
• risks associated with derivative and purchasing strategies we employ to manage commodity pricing risks, including the risk that such strategies could result in significant losses and adversely impact our liquidity;
• crude oil price trends and their impact on transportation, energy, and packaging costs;
• our ability to successfully implement and realize the full benefit of price changes that are intended to fully recover cost including the competitive, retailer, and consumer response, and the impact of the timing of the price changes to profits and cash flow in a particular period;
• the success and cost of introducing new products and the competitive response;
• the success and cost of marketing and sales programs and strategies intended to promote growth in our businesses;
• general competitive activity in the market, including competitors’ pricing practices and promotional spending levels;
• our ability to successfully integrate acquired and merged businesses in a timely and cost-effective manner;
• the successful completion of our restructuring programs and the ability to realize anticipated savings and other potential benefits within the time frames currently contemplated;
• the impact of food security concerns involving either our products or our competitors’ products;
• the impact of accidents and natural disasters, including crop failures and storm damage;
• the concentration of certain of our businesses with key customers and suppliers, including single-source suppliers of certain key raw materials, such as packaging for our Folgers coffee products, and finished goods, such as K-Cups, and the ability to manage and maintain key relationships;
• the loss of significant customers, a substantial reduction in orders from these customers, or the bankruptcy of any such customer;
• changes in consumer coffee preferences and other factors affecting the coffee business, which represents a substantial portion of our business;
• a change in outlook or downgrade in our public credit rating by a rating agency;
• our ability to obtain any required financing on a timely basis and on acceptable terms;
• the timing and amount of capital expenditures, share repurchases, and restructuring costs;
• impairments in the carrying value of goodwill, other intangible assets, or other long-lived assets or changes in useful lives of other intangible assets;
• the impact of new or changes to existing governmental laws and regulations and their application;
• the impact of future legal, regulatory, or market measures regarding climate change;
• the outcome of current and future tax examinations, changes in tax laws, and other tax matters, and their related impact on our tax positions;
• foreign currency and interest rate fluctuations;• political or economic disruption;• other factors affecting share prices and capital markets
generally; and • risks related to other factors described under “Risk Factors”
in other reports and statements we have filed with the Securities and Exchange Commission.
Readers are cautioned not to unduly rely on such forward-looking statements, which speak only as of the date made, when evaluat-ing the information presented in this Annual Report. We do not undertake any obligation to update or revise these forward-looking statements to reflect new events or circumstances.
ShareholdersThe J. M. Smucker Company
Management is responsible for establishing and maintaining adequate accounting and internal control systems over financial reporting, as such term is defined in Rules 13a-15(f) and 15d-15(f) under the Securities and Exchange Act of 1934, as amended. Our internal control system is designed to provide reasonable assurance that we have the ability to record, process, summarize, and report reliable financial information on a timely basis.
Our management, with the participation of the principal financial and executive officers, assessed the effectiveness of the internal control over financial reporting as of April 30, 2013. In making this assessment, we used the criteria established in Internal Control – Integrated Framework issued by the Committee of Sponsoring Organizations of the Treadway Commission (“the COSO criteria”).
Based on our assessment of internal control over financial reporting under the COSO criteria, we concluded the internal control over financial reporting was effective as of April 30, 2013.
Ernst & Young LLP, an independent registered public accounting firm, audited the effectiveness of our internal control over financial reporting as of April 30, 2013, and their report thereon is included on page 38 of this report.
Richard K. Smucker Mark R. Belgya Chief Executive Officer Senior Vice President and Chief Financial Officer
38 The J. M. Smucker Company 2013 Annual Report 39
report of inDepenDent regiStereD public accounting firm on internal control over financial reportingThe J. M. Smucker Company
Board of Directors and ShareholdersThe J. M. Smucker Company
We have audited The J. M. Smucker Company’s internal control over financial reporting as of April 30, 2013, based on criteria established in Internal Control – Integrated Framework issued by the Committee of Sponsoring Organizations of the Treadway Commission (“the COSO criteria”). The J. M. Smucker Company’s management is responsible for maintaining effective internal control over financial reporting, and for its assessment of the effectiveness of internal control over financial reporting included in the accompanying Report of Management on Internal Control Over Financial Reporting. Our responsibility is to express an opinion on the Company’s internal control over financial reporting based on our audit.
We conducted our audit in accordance with the standards of the Public Company Accounting Oversight Board (United States). Those standards require that we plan and perform the audit to obtain reasonable assurance about whether effective internal control over financial reporting was maintained in all material respects. Our audit included obtaining an understanding of internal control over financial reporting, assessing the risk that a material weakness exists, testing and evaluating the design and operating effectiveness of internal control based on the assessed risk, and performing such other procedures as we considered necessary in the circumstances. We believe that our audit provides a reasonable basis for our opinion.
A company’s internal control over financial reporting is a process designed to provide reasonable assurance regarding the reliability of financial reporting and the preparation of financial statements for external purposes in accordance with generally accepted accounting principles. A company’s internal control over financial reporting includes those policies and procedures that (1) pertain to the maintenance of records that, in reasonable detail, accurately and fairly reflect the transactions and dispositions of the assets of the company; (2) provide reasonable assurance that transactions are recorded as necessary to permit preparation of financial statements in accordance with generally accepted accounting principles, and that receipts and expenditures of the company are being made only in accordance with authorizations of management and directors of the company; and (3) provide reasonable assurance regarding prevention or timely detection of unauthorized acquisition, use, or disposition of the company’s assets that could have a material effect on the financial statements.
Because of its inherent limitations, internal control over financial reporting may not prevent or detect misstatements. Also, projections of any evaluation of effectiveness to future periods are subject to the risk that controls may become inadequate because of changes in conditions, or that the degree of compliance with the policies or procedures may deteriorate.
In our opinion, The J. M. Smucker Company maintained, in all material respects, effective internal control over financial reporting as of April 30, 2013, based on the COSO criteria.
We also have audited, in accordance with the standards of the Public Company Accounting Oversight Board (United States), the consolidated balance sheets of The J. M. Smucker Company as of April 30, 2013 and 2012, and the related statements of consolidated income, comprehensive income, shareholders’ equity, and cash flows for each of the three years in the period ended April 30, 2013, and our report dated June 18, 2013, expressed an unqualified opinion thereon.
Akron, OhioJune 18, 2013
report of inDepenDent regiStereD public accounting firm on the conSoliDateD financial StatementSThe J. M. Smucker Company
Board of Directors and ShareholdersThe J. M. Smucker Company
We have audited the accompanying consolidated balance sheets of The J. M. Smucker Company as of April 30, 2013 and 2012, and the related statements of consolidated income, comprehensive income, shareholders’ equity, and cash flows for each of the three years in the period ended April 30, 2013. These financial statements are the responsibility of the Company’s management. Our responsibility is to express an opinion on these financial statements based on our audits.
We conducted our audits in accordance with the standards of the Public Company Accounting Oversight Board (United States). Those standards require that we plan and perform the audit to obtain reasonable assurance about whether the financial statements are free of material misstatement. An audit includes examining, on a test basis, evidence supporting the amounts and disclosures in the financial statements. An audit also includes assessing the accounting principles used and significant estimates made by management, as well as evaluating the overall financial statement presentation. We believe that our audits provide a reasonable basis for our opinion.
In our opinion, the consolidated financial statements referred to above present fairly, in all material respects, the consolidated financial position of The J. M. Smucker Company at April 30, 2013 and 2012, and the consolidated results of its operations and its cash flows for each of the three years in the period ended April 30, 2013, in conformity with U.S. generally accepted accounting principles.
We also have audited in accordance with the standards of the Public Company Accounting Oversight Board (United States), The J. M. Smucker Company’s internal control over financial reporting as of April 30, 2013, based on criteria established in Internal Control – Integrated Framework issued by the Committee of Sponsoring Organizations of the Treadway Commission and our report dated June 18, 2013, expressed an unqualified opinion thereon.
Akron, OhioJune 18, 2013
2013 Annual Report 4140 The J. M. Smucker Company
report of management on reSponSibility for financial reporting The J. M. Smucker Company
ShareholdersThe J. M. Smucker Company
Management of The J. M. Smucker Company is responsible for the preparation, integrity, accuracy, and consistency of the consolidated financial statements and the related financial information in this report. Such information has been prepared in accordance with U.S. generally accepted accounting principles and is based on our best estimates and judgments.
We maintain systems of internal accounting controls supported by formal policies and procedures that are communicated throughout the Company. There is a program of audits performed by our internal audit staff designed to evaluate the adequacy of and adherence to these controls, policies, and procedures.
Ernst & Young LLP, an independent registered public accounting firm, has audited our financial statements in accordance with the standards of the Public Company Accounting Oversight Board (United States). Management has made all financial records and related data available to Ernst & Young LLP during its audit.
Our audit committee, comprised of three non-employee members of the Board of Directors, meets regularly with the independent registered public accounting firm and management to review the work of the internal audit staff and the work, audit scope, timing arrangements, and fees of the independent registered public accounting firm. The audit committee also regularly satisfies itself as to the adequacy of controls, systems, and financial records. The director of the internal audit department is required to report directly to the chair of the audit committee as to internal audit matters.
It is our best judgment that our policies and procedures, our program of internal and independent audits, and the oversight activity of the audit committee work together to provide reasonable assurance that our operations are conducted according to law and in compliance with the high standards of business ethics and conduct to which we subscribe.
Richard K. Smucker Mark R. Belgya Chief Executive Officer Senior Vice President and Chief Financial Officer
Year Ended April 30,
(Dollars in millions, except per share data) 2013 2012 2011
Net sales $5,897.7 $5,525.8 $4,825.7 Cost of products sold 3,858.6 3,637.4 2,973.1 Cost of products sold – restructuring and merger and integration 11.5 43.2 54.1
Gross Profit 2,027.6 1,845.2 1,798.5 Selling, distribution, and administrative expenses 973.9 892.7 863.1 Amortization 96.8 88.1 73.8 Impairment charges — 4.6 17.6 Other restructuring and merger and integration costs 42.8 72.5 59.1 Other special project costs 6.7 — —Loss on divestiture — 11.3 —Other operating (income) expense – net (3.0) (2.3) 0.6
Operating Income 910.4 778.3 784.3 Interest expense – net (93.4) (79.8) (67.1)Other income – net 0.3 2.7 —
Income Before Income Taxes 817.3 701.2 717.2 Income taxes 273.1 241.5 237.7
Net Income $ 544.2 $ 459.7 $ 479.5
Earnings per common share: Net Income $ 5.00 $ 4.06 $ 4.06 Net Income – Assuming Dilution $ 5.00 $ 4.06 $ 4.05
Dividends Declared per Common Share $ 2.08 $ 1.92 $ 1.68
See notes to consolidated financial statements.
Year Ended April 30,
(Dollars in millions) 2013 2012 2011
Net income $544.2 $459.7 $479.5 Other comprehensive income (loss): Foreign currency translation adjustments (5.5) (14.8) 24.8 Cash flow hedging derivative activity, net of tax 8.0 (25.2) 4.0 Pension and other postretirement benefit plans activity, net of tax 2.9 (48.3) (5.9) Available-for-sale securities activity, net of tax 2.0 0.7 1.3
Total Other Comprehensive Income (Loss) 7.4 (87.6) 24.2
Comprehensive Income $551.6 $372.1 $503.7
See notes to consolidated financial statements.
StatementS of conSoliDateD incomeThe J. M. Smucker Company
2013 Annual Report 41
StatementS of conSoliDateD comprehenSive incomeThe J. M. Smucker Company
42 The J. M. Smucker Company 2013 Annual Report 43
conSoliDateD balance SheetSThe J. M. Smucker Company
conSoliDateD balance SheetSThe J. M. Smucker Company
ASSETS
April 30,
(Dollars in millions) 2013 2012
Current AssetsCash and cash equivalents $ 256.4 $ 229.7 Trade receivables, less allowance for doubtful accounts 313.7 347.5 Inventories: Finished products 618.9 643.5 Raw materials 326.6 318.1
945.5 961.6 Other current assets 79.6 104.7
Total Current Assets 1,595.2 1,643.5
Property, Plant, and EquipmentLand and land improvements 98.5 89.6 Buildings and fixtures 494.4 460.2 Machinery and equipment 1,267.5 1,160.3 Construction in progress 124.9 143.0
Total Property, Plant, and Equipment 1,142.5 1,096.1
Other Noncurrent AssetsGoodwill 3,052.9 3,054.6 Other intangible assets – net 3,089.4 3,187.0 Other noncurrent assets 151.8 134.0
Total Other Noncurrent Assets 6,294.1 6,375.6
Total Assets $9,031.8 $9,115.2
See notes to consolidated financial statements.
LIABILITIES AND ShAREhOLDERS’ EquITy
April 30,
(Dollars in millions) 2013 2012
Current LiabilitiesAccounts payable $ 285.8 $ 274.7 Accrued compensation 69.5 83.3 Accrued trade marketing and merchandising 57.4 62.1 Dividends payable 55.4 52.9 Current portion of long-term debt 50.0 50.0 Other current liabilities 78.7 93.9
Total Current Liabilities 596.8 616.9
Noncurrent LiabilitiesLong-term debt 1,967.8 2,020.5 Defined benefit pensions 163.0 147.6 Other postretirement benefits 67.1 68.8 Deferred income taxes 987.2 992.7 Other noncurrent liabilities 101.1 105.3
Total Noncurrent Liabilities 3,286.2 3,334.9
Total Liabilities 3,883.0 3,951.8
Shareholders’ EquitySerial preferred shares – no par value: Authorized – 6,000,000 shares; outstanding – none — —Common shares – no par value: Authorized – 150,000,000 shares; outstanding – 106,486,935 at April 30, 2013, and 110,284,715 at April 30, 2012 (net of 22,118,230 and 18,320,450 treasury shares, respectively), at stated value 26.6 27.6 Additional capital 4,125.1 4,261.2 Retained income 1,075.5 961.2 Amount due from ESOP Trust (1.8) (2.6)Accumulated other comprehensive loss (76.6) (84.0)
Total Shareholders’ Equity 5,148.8 5,163.4
Total Liabilities and Shareholders’ Equity $9,031.8 $9,115.2
See notes to consolidated financial statements.
42 The J. M. Smucker Company 2013 Annual Report 43
44 The J. M. Smucker Company 2013 Annual Report 45
Year Ended April 30,
(Dollars in millions) 2013 2012 2011
Operating ActivitiesNet income $ 544.2 $ 459.7 $ 479.5 Adjustments to reconcile net income to net cash provided by operations: Depreciation 143.7 120.4 112.2 Depreciation – restructuring and merger and integration 10.4 38.5 53.6 Amortization 96.8 88.1 73.8 Impairment charges — 4.6 17.6 Share-based compensation expense 21.3 21.7 24.0 Other restructuring activities (0.7) 8.0 8.5 Loss on sale of assets – net 4.8 3.4 2.9 Loss on divestiture — 11.3 — Deferred income tax benefit (15.6) (17.2) (59.8) Changes in assets and liabilities, net of effect from businesses acquired: Trade receivables 33.2 9.3 (102.6) Inventories 15.2 (48.2) (204.2) Other current assets 4.6 3.0 (33.4) Accounts payable 11.2 35.8 54.3 Accrued liabilities (6.7) 36.9 30.4 Proceeds from settlement of interest rate swaps – net — 17.7 — Defined benefit pension contributions (40.0) (11.4) (16.8) Accrued and prepaid taxes 3.5 (3.0) (78.4) Other – net 29.9 (47.7) 30.0
Net Cash Provided by Operating Activities 855.8 730.9 391.6
Investing ActivitiesBusinesses acquired, net of cash acquired — (737.3) —Additions to property, plant, and equipment (206.5) (274.2) (180.1)Equity investment in affiliate — (35.9) —Proceeds from divestiture — 9.3 —Purchases of marketable securities — — (75.6)Sales and maturities of marketable securities — 18.6 57.1 Proceeds from disposal of property, plant, and equipment 3.3 4.0 5.8 Other – net 17.6 (20.4) (0.1)
Net Cash used for Investing Activities (185.6) (1,035.9) (192.9)
Financing ActivitiesRepayments of long-term debt (50.0) — (10.0)Proceeds from long-term debt – net — 748.6 400.0 Quarterly dividends paid (222.8) (213.7) (194.0)Purchase of treasury shares (364.2) (315.8) (389.1)Proceeds from stock option exercises 2.2 2.8 14.5 Other – net (6.2) (2.3) 8.2
Net Cash (used for) Provided by Financing Activities (641.0) 219.6 (170.4)Effect of exchange rate changes on cash (2.5) (4.7) 7.9
Net increase (decrease) in cash and cash equivalents 26.7 (90.1) 36.2 Cash and cash equivalents at beginning of year 229.7 319.8 283.6
Cash and Cash Equivalents at End of year $ 256.4 $ 229.7 $ 319.8
( ) Denotes use of cash
See notes to consolidated financial statements.
Accumulated Common Amount Other Total Shares Common Additional Retained Due from Comprehensive Shareholders’ (Dollars in millions) Outstanding Shares Capital Income ESOP Trust (Loss) Income Equity
Balance at May 1, 2010 119,119,152 $29.8 $4,575.1 $ 746.1 $(4.1) $(20.6) $5,326.3 Net income 479.5 479.5 Other comprehensive income 24.2 24.2 Comprehensive Income 503.7 Purchase of treasury shares (5,832,423) (1.5) (225.6) (162.0) (389.1)Stock plans (includes tax benefit of $7.3) 885,393 0.2 47.1 47.3 Cash dividends declared (196.7) (196.7)Other 0.8 0.8
Balance at April 30, 2011 114,172,122 28.5 4,396.6 866.9 (3.3) 3.6 5,292.3 Net income 459.7 459.7 Other comprehensive income (87.6) (87.6)Comprehensive Income 372.1 Purchase of treasury shares (4,236,430) (1.1) (165.6) (149.1) (315.8)Stock plans (includes tax benefit of $4.8) 349,023 0.2 30.2 30.4 Cash dividends declared (216.3) (216.3)Other 0.7 0.7
Balance at April 30, 2012 110,284,715 27.6 4,261.2 961.2 (2.6) (84.0) 5,163.4 Net income 544.2 544.2 Other comprehensive income 7.4 7.4 Comprehensive Income 551.6 Purchase of treasury shares (4,062,682) (1.0) (158.5) (204.7) (364.2)Stock plans (includes tax benefit of $2.9) 264,902 22.4 22.4 Cash dividends declared (225.2) (225.2)Other 0.8 0.8
Balance at April 30, 2013 106,486,935 $26.6 $4,125.1 $1,075.5 $(1.8) $(76.6) $5,148.8
See notes to consolidated financial statements.
StatementS of conSoliDateD caSh flowSThe J. M. Smucker Company
StatementS of conSoliDateD ShareholDerS’ eQuityThe J. M. Smucker Company
44 The J. M. Smucker Company 2013 Annual Report 45
Notes to CoNsolidated FiNaNCial statemeNtsThe J. M. Smucker Company
Notes to CoNsolidated FiNaNCial statemeNtsThe J. M. Smucker Company
46 The J. M. Smucker Company 2013 Annual Report 47
(Dollars in millions, unless otherwise noted, except per share data)
Note 1 ACCounTing PoliCieSPrinciples of Consolidation: The consolidated financial statements include the accounts of the Company, its wholly-owned subsidiaries, and its majority-owned investments, if any. Intercompany transactions and accounts are eliminated in consolidation.
use of Estimates: The preparation of consolidated financial statements in conformity with U.S. GAAP requires that we make certain estimates and assumptions that affect the amounts reported in the consolidated financial statements and accompanying notes. Significant estimates in these consolidated financial statements include: allowances for doubtful trade receivables, estimates of future cash flows associated with assets, asset impairments, useful lives and residual values for depreciation and amortization, net realizable value of inventories, accruals for trade marketing and merchandising programs, income taxes, and the determination of discount and other rate assumptions for defined benefit pension and other postretirement benefit expenses. Actual results could differ from these estimates.
Revenue Recognition: We recognize revenue, net of estimated returns and allowances, when all of the following criteria have been met: a valid customer order with a determinable price has been received; the product has been shipped and title has transferred to the customer; there is no further significant obligation to assist in the resale of the product; and collectability is reasonably assured.Trade marketing and merchandising programs are classified as a reduction of sales. A provision for estimated returns and allowances is recognized as a reduction of sales at the time revenue is recognized.
Major Customer: Sales to Wal-Mart Stores, Inc. and subsidiaries amounted to 26 percent of net sales in 2013, 2012, and 2011. These sales are primarily included in the two U.S. retail market segments. No other customer exceeded 10 percent of net sales for any year. Trade receivables at April 30, 2013 and 2012, included amounts due from Wal-Mart Stores, Inc. and subsidiaries of $92.0 and $84.1, respectively.
Shipping and handling Costs: Shipping and handling costs are included in cost of products sold.
Trade Marketing and Merchandising Programs: In order to support our products, various promotional activities are conducted through retail trade, distributors, or directly with consumers, including in-store display and product placement programs, feature price discounts, coupons, and other similar activities. We regularly review and revise, when we deem necessary, estimates of costs for these promotional programs based on estimates of what will be redeemed by retail trade, distributors, or consumers. These estimates are made using various techniques including historical data on performance of similar promotional programs. Differences between estimated expenditures and actual performance are recognized as a change in estimate in a subsequent period. As the total promotional expenditures, including amounts classified as a reduction of sales, represented 25 percent of net sales in 2013, a possibility exists of materially different reported results if factors such as the level and success of the promotional programs or other conditions differ from expectations.
Advertising Expense: Advertising costs are expensed as incurred. Advertising expense was $131.6, $119.6, and $115.1 in 2013, 2012, and 2011, respectively.
Research and Development Costs: Total research and development costs were $24.7, $21.9, and $21.0 in 2013, 2012, and 2011, respectively.
Share-Based Payments: Share-based compensation expense is recognized on a straight-line basis over the requisite service period, which includes a one-year performance period plus the defined forfeiture period, which is typically four years of service or the attainment of a defined age and years of service.
The following table summarizes amounts related to share-based payments.
Year Ended April 30,
2013 2012 2011
Share-based compensation expense included in selling, distribution, and administrative expenses $20.5 $19.3 $19.9Share-based compensation expense included in other restructuring and merger and integration costs 0.8 2.5 4.4
Total share-based compensation expense $21.3 $21.8 $24.3
Related income tax benefit $ 7.1 $ 7.5 $ 8.1
As of April 30, 2013, total unrecognized share-based compensation cost related to nonvested share-based awards was $31.4. The weighted-average period over which this amount is expected to be recognized is 2.9 years.
Corporate income tax benefits realized upon exercise or vesting of an award in excess of that previously recognized in earnings, referred to as excess tax benefits, are presented in the Statements of Consolidated Cash Flows as a financing activity. Realized excess tax benefits are credited to additional capital in the Consolidated Balance Sheets. Realized shortfall tax benefits, amounts which are less than that previously recognized in earnings, are first offset against the cumulative balance of excess tax benefits, if any, and then charged directly to income tax expense. For 2013, 2012, and 2011, the actual tax-deductible benefit realized from share-based compensation was $2.9, $4.8, and $7.3, respectively, including $2.9, $4.8, and $7.0, respectively, of excess tax benefits realized upon exercise or vesting of share-based compensation, and classified as other – net, under financing activities in the Statements of Consolidated Cash Flows.
Defined Contribution Plans: We offer employee savings plans for domestic and Canadian employees. Our contributions under these plans are based on a specified percentage of employee contributions. Charges to operations for these plans in 2013, 2012, and 2011 were $18.6, $16.1, and $16.4, respectively. For information on our defined benefit plans, see Note 8: Pensions and Other Postretirement Benefits.
Income Taxes: We account for income taxes using the liability method. Accordingly, deferred tax assets and liabilities are recognized for the future tax consequences attributable to differences between financial statement carrying amounts of existing assets and liabilities and their respective tax bases. Deferred tax assets and liabilities are measured using enacted tax rates expected to apply to taxable income in the years in which those temporary differences are expected to be recovered or settled. The effect on deferred tax assets and liabilities of a change in the applicable tax rate is recognized in income or expense in the period that the change is effective. A valuation allowance is established when it is more likely than not that all or a portion of a deferred tax asset will not be realized. A tax benefit is recognized when it is more likely than not to be sustained.
We account for the financial statement recognition and measurement criteria of a tax position taken or expected to be taken in a tax return under FASB ASC 740, Income Taxes. FASB ASC 740 also provides guidance on derecognition, classification, interest and penalties, accounting in interim periods, and disclosure.
In accordance with the requirements of FASB ASC 740, uncertain tax positions have been classified in the Consolidated Balance Sheets as long term, except to the extent payment is expected within one year. We recognize net interest and penalties related to unrecognized tax benefits in income tax expense.
Cash and Cash Equivalents: We consider all short-term, highly-liquid investments with a maturity of three months or less when purchased to be cash equivalents.
Trade Receivables: In the normal course of business, we extend credit to customers. Trade receivables, less allowance for doubtful accounts, reflect the net realizable value of receivables and approximate fair value. We evaluate our trade receivables and establish an allowance for doubtful accounts based on a combination of factors. When aware that a specific customer has been impacted by circumstances such as bankruptcy filings or deterioration in the customer’s operating results or financial position, potentially making it unable to meet its financial obligations, we record a specific reserve for bad debt to reduce the related receivable to the amount we reasonably believe is collectible. We also record reserves for bad debt for all other customers based on a variety of factors, including the length of time the receivables are past due, historical collection experience, and an evaluation of current and projected economic conditions at the balance sheet date. Trade receivables are charged off against the allowance after we determine the potential for recovery is remote. At April 30, 2013 and 2012, the allowance for doubtful accounts was $1.3 and $1.7, respectively. The net provision for the allowance for doubtful accounts decreased $0.4 and $0.2 in 2013 and 2012, respectively, and increased $0.4 in 2011. We believe there is no concentration of risk with any single customer whose failure or nonperformance would materially affect results other than as discussed in Major Customer.
Inventories: Inventories are stated at the lower of cost or market. Cost for all inventories is determined using the first-in, first-out method applied on a consistent basis.
The cost of finished products and work-in-process inventory includes materials, direct labor, and overhead. Work-in-process is included in finished products in the Consolidated Balance Sheets and was $64.0 and $78.3 at April 30, 2013 and 2012, respectively.
Notes to CoNsolidated FiNaNCial statemeNtsThe J. M. Smucker Company
Notes to CoNsolidated FiNaNCial statemeNtsThe J. M. Smucker Company
48 The J. M. Smucker Company 2013 Annual Report 49
Derivative Financial Instruments: We utilize derivative instruments such as basis contracts, commodity futures and options contracts, foreign currency forwards and options, and interest rate swaps to manage exposures in commodity prices, foreign currency exchange rates, and interest rates. We have policies in place that define acceptable instrument types we may enter into and establish controls to limit our market risk exposure. We account for these derivative instruments in accordance with FASB ASC 815, Derivatives and Hedging, which requires all derivative instruments to be recognized in the financial statements and measured at fair value regardless of the purpose or intent for holding them. For derivatives designated as a cash flow hedge that are used to hedge an anticipated transaction, changes in fair value are deferred and recognized in shareholders’ equity as a component of accumulated other comprehensive loss to the extent the hedge is effective and then recognized in the Statements of Consolidated Income in the period during which the hedged transaction affects earnings. Hedge effectiveness is measured at inception and on a monthly basis. Any ineffectiveness associated with the hedge or changes in fair value of derivatives that are nonqualifying are recognized immediately in the Statements of Consolidated Income. Derivatives designated as fair value hedges that are used to hedge against changes in the fair value of the underlying long-term debt are recognized at fair value on the Consolidated Balance Sheets. Changes in the fair value of the derivative are recognized in the Statements of Consolidated Income and are offset by the change in the fair value of the underlying long-term debt. For additional information, see Note 12: Derivative Financial Instruments.
Property, Plant, and Equipment: Property, plant, and equipment is recognized at cost and is depreciated on a straight-line basis over the estimated useful life of the asset (3 to 20 years for machinery and equipment, 3 to 7 years for capitalized software costs, and 5 to 40 years for buildings, fixtures, and improvements). Coffee brew equipment is included in machinery and equipment in the Consolidated Balance Sheets and was $39.2 and $37.1 at April 30, 2013 and 2012, respectively.
We lease certain land, buildings, and equipment for varying periods of time, with renewal options. Rent expense in 2013, 2012, and 2011 totaled $59.2, $56.5, and $57.6, respectively. As of April 30, 2013, our minimum operating lease obligations were as follows: $24.5 in 2014, $16.6 in 2015, $16.1 in 2016, $14.5 in 2017, and $13.7 in 2018.
In accordance with FASB ASC 360, Property, Plant, and Equipment, long-lived assets, except goodwill and indefinite-lived intangible assets, are reviewed for impairment when circumstances indicate the carrying value of an asset may not be recoverable. Recoverability of assets to be held and used is measured by a comparison of the carrying amount of the assets to future net undiscounted cash flows we estimate to be generated by such assets. If such assets are considered to be impaired, the impairment to be recognized is the amount by which the carrying amount of the assets exceeds their estimated fair value. Assets to be disposed of by sale are recognized as held for sale at the lower of carrying value or estimated net realizable value.
Goodwill and Other Intangible Assets: Goodwill is the excess of the purchase price paid over the estimated fair value of the net assets of a business acquired. In accordance with FASB ASC 350, Intangibles – Goodwill and Other, goodwill and other indefinite-lived intangible assets are not amortized but are reviewed at least annually for impairment. We conduct our annual test for impairment of goodwill and other indefinite-lived intangible assets as of February 1 of each year. A discounted cash flow valuation technique is utilized to estimate the fair value of our reporting units and indefinite-lived intangible assets. We also use a market-based approach to estimate the fair value of our reporting units. For annual impairment testing purposes, we have six reporting units. The discount rates utilized in the cash flow analyses are developed using a weighted-average cost of capital methodology. In addition to the annual test, we test for impairment if events or circumstances occur that would more likely than not reduce the fair value of a reporting unit below its carrying amount. Finite-lived intangible assets are amortized on a straight-line basis over their estimated useful lives. For additional information, see Note 7: Goodwill and Other Intangible Assets.
Marketable Securities and Other Investments: Under our investment policy, we may invest in debt securities deemed to be investment grade at the time of purchase for general corporate purposes. We determine the appropriate categorization of debt securities at the time of purchase and reevaluate such designation at each balance sheet date. We typically categorize all debt securities as available for sale, as we have the intent to convert these investments into cash if and when needed. Classification of available-for-sale marketable securities as current or noncurrent is based on whether the conversion to cash is expected to be necessary for operations in the upcoming year, which is consistent with the security’s maturity date, if applicable.
Securities categorized as available for sale are stated at fair value, with unrealized gains and losses reported as a component of accumulated other comprehensive loss. All available-for-sale marketable securities had matured or were sold prior to April 30, 2012, other than the funds associated with nonqualified retirement plans discussed below. Proceeds of $18.6 and $57.1 were realized upon maturity or sale of available-for-sale marketable securities in 2012 and 2011, respectively. We use specific identification to determine the basis on which securities are sold.
We also maintain funds for the payment of benefits associated with nonqualified retirement plans. These funds include investments considered to be available-for-sale marketable securities. At April 30, 2013 and 2012, the fair value of these investments was $48.8 and $36.2, respectively, and was included in other noncurrent assets. Included in accumulated other comprehensive loss at April 30, 2013 and 2012, were unrealized gains of $7.1 and $4.0, respectively. The related tax expense recognized in accumulated other comprehensive loss was $2.6 and $1.5 at April 30, 2013 and 2012, respectively.
Foreign Currency Translation: Assets and liabilities of foreign subsidiaries are translated using the exchange rates in effect at the balance sheet date, while income and expenses are translated using average rates. Translation adjustments are reported as a component of shareholders’ equity in accumulated other comprehensive loss. Included in accumulated other comprehensive loss at April 30, 2013 and 2012, were foreign currency gains of $61.5 and $67.0, respectively.
Recently Issued Accounting Standards: In June 2011, the FASB issued Accounting Standards Update (“ASU”) 2011-05, Presentation of Comprehensive Income, which eliminated the option to present the components of other comprehensive income as part of the statement of shareholders’ equity and required the presentation of net income and other comprehensive income to be in a single continuous statement of comprehensive income or in two separate but consecutive statements. ASU 2011-05 did not change the components that are recognized in net income or other comprehensive income. ASU 2011-05 was effective in 2013, and we elected to present net income and other comprehensive income in two separate but consecutive statements. In February 2013, the FASB issued ASU 2013-02, Reporting of Amounts Reclassified Out of Accumulated Other Comprehensive Income. ASU 2013-02 requires reclassification adjustments for items that are reclassified from accumulated other comprehensive income to net income be presented on the financial statements or in a note to the financial statements. ASU 2013-02 becomes effective in 2014 and will be applied prospectively. We do not anticipate that the adoption of ASU 2013-02 will impact our financial statements, but will expand our disclosures related to amounts reclassified out of accumulated other comprehensive income.
In December 2011, the FASB issued ASU 2011-11, Disclosures about Offsetting Assets and Liabilities. ASU 2011-11 requires the disclosure of both gross and net information about financial instruments and transactions eligible for offset in the consolidated balance sheet. In January 2013, the FASB issued ASU 2013-01, Scope Clarification of Disclosures about Offsetting Assets and Liabilities, which limits the scope of ASU 2011-11 to derivatives, repurchase and reverse repurchase agreements, and securities borrowing and lending transactions. ASU 2011-11, as clarified by ASU 2013-01, will be effective for us on May 1, 2013, and will require retrospective application. We do not anticipate that the adoption of ASU 2011-11, as clarified by ASU 2013-01, will impact our financial statements, but will expand our disclosures related to financial instruments.
The FASB issued ASU 2011-08, Testing Goodwill for Impairment, and ASU 2012-02, Intangibles – Goodwill and Other (Topic 350): Testing Indefinite-Lived Intangible Assets for Impairment, in September 2011 and July 2012, respectively. ASU 2011-08 and ASU 2012-02 simplify the guidance for testing impairment of goodwill and indefinite-lived intangible assets by allowing the option to perform a qualitative test to assess the likelihood that the estimated fair value is less than the carrying amount. ASU 2011-08 was effective for our February 1, 2013 annual impairment test. ASU 2012-02 will be effective for our February 1, 2014 annual impairment test, but early adoption is permitted. The adoption of ASU 2011-08 did not change the process for our February 1, 2013 impairment test and did not impact our financial statements or related disclosures. We do not anticipate that the adoption of ASU 2012-02 will change the process for our February 1, 2014 impairment test.
Risks and uncertainties: The raw materials we use are primarily commodities, agricultural-based products, and packaging materials. The principal packaging materials we use are glass, plastic, steel cans, caps, carton board, and corrugate. The fruit and vegetable raw materials used in the production of our food products are purchased from independent growers and suppliers. Green coffee, peanuts, edible oils, sweeteners, milk, flour, corn, and other ingredients are obtained from various suppliers. The availability, quality, and cost of many of these commodities have fluctuated, and may continue to fluctuate, over time. Green coffee is sourced solely from foreign countries and its supply and price are subject to high volatility due to factors such as weather, global supply and demand, pest damage, speculative influences, and political and economic conditions in the source countries. Raw materials are generally available from numerous sources, although we have elected to source certain plastic packaging materials from single sources of supply pursuant to long-term contracts. While availability may vary year to year, we believe that we will continue to be able to obtain adequate supplies and that alternatives to single-sourced materials are available. We have not historically encountered significant shortages of key raw materials. We consider our relationships with key material suppliers to be good.
Of our total employees, 28 percent are covered by union contracts at nine locations. The contracts vary in term depending on the location, with four contracts expiring in 2014, representing 8 percent of our total employees.
Notes to CoNsolidated FiNaNCial statemeNtsThe J. M. Smucker Company
Notes to CoNsolidated FiNaNCial statemeNtsThe J. M. Smucker Company
50 The J. M. Smucker Company 2013 Annual Report 51
We insure our business and assets in each country against insurable risks, to the extent that we deem appropriate, based upon an analysis of the relative risks and costs.
Reclassifications: Certain prior year amounts have been reclassified to conform to current year classifications.
Note 2 ACquiSiTionSOn January 3, 2012, we completed the acquisition of a majority of the North American foodservice coffee and hot beverage business of Sara Lee Corporation, including a liquid coffee manufacturing facility in Suffolk, Virginia, for $420.6 in an all-cash transaction. Utilizing proceeds from the 3.50 percent Senior Notes issued in October 2011, we paid Sara Lee Corporation, renamed The Hillshire Brands Company, $375.6, net of a working capital adjustment, and will pay an additional $50.0 in declining installments through June 2021, to a subsidiary of D.E Master Blenders 1753 N.V., an independent public company separated from The Hillshire Brands Company. The additional $50.0 obligation was included in other current liabilities and other noncurrent liabilities in the Consolidated Balance Sheets and was recognized at a present value of $45.0 as of the date of acquisition. During 2013, $10.0 was paid and included in other – net financing on the Statement of Consolidated Cash Flows.
Total one-time costs related to the acquisition are estimated to be approximately $28.0, consisting primarily of transition services provided by Sara Lee Corporation and employee separation and relocation costs, nearly all of which are cash related. We have incurred one-time costs of $25.5 through April 30, 2013, directly related to the merger and integration of the acquired business, and the charges were reported in other restructuring and merger and integration costs in the Statements of Consolidated Income. We incurred one-time costs of $11.3 in 2013 and we expect the remainder of the costs to be incurred through 2014.
The acquisition included the market-leading liquid coffee concentrate business sold under the licensed Douwe Egberts® brand, along with a variety of roast and ground coffee, cappuccino, tea, and cocoa products, sold through foodservice channels in North America. Liquid coffee concentrate adds a unique, high-quality, and technology-driven form of coffee to our existing foodservice product offering.
The purchase price was allocated to the underlying assets acquired and liabilities assumed based upon their estimated fair values at the date of acquisition. We determined the estimated fair values based on independent appraisals, discounted cash flow analyses, and our own estimates. The purchase price exceeded the estimated fair value of the net identifiable tangible and intangible assets acquired, and, as such, the excess was allocated to goodwill. The amount allocated to goodwill was primarily attributable to anticipated synergies and market expansion.
The following table summarizes the estimated fair values of the assets acquired and liabilities assumed at the acquisition date.
Assets acquired: Cash and cash equivalents $ 1.2 Other current assets 42.6 Property, plant, and equipment 92.8 Goodwill 149.9 Intangible assets 138.9 Other noncurrent assets 0.9
Total assets acquired $426.3
Liabilities assumed: Current liabilities $ 3.6 Noncurrent liabilities 2.1
Total liabilities assumed $ 5.7
Net assets acquired $420.6
Of the total goodwill assigned to the International, Foodservice, and Natural Foods segment, $133.6 is deductible for income tax purposes.
The purchase price allocated to the identifiable intangible assets acquired is as follows:
On May 16, 2011, we completed the acquisition of the coffee brands and business operations of Rowland Coffee Roasters, Inc. (“Rowland Coffee”), a privately-held company headquartered in Miami, Florida, for $362.8. The acquisition included a manufacturing, distribution, and office facility in Miami. We utilized cash on hand and borrowed $180.0 under our revolving credit facility to fund the transaction. In addition, we incurred one-time costs of $13.4 through April 30, 2013, directly related to the merger and integration of Rowland Coffee, which includes approximately $6.0 in noncash expense items that were reported in cost of products sold – restructuring and merger and integration. The remaining charges were reported in other restructuring and merger and integra-tion costs in the Statements of Consolidated Income. Total one-time costs related to the acquisition are estimated to be approximately $25.0, including approximately $10.0 of noncash charges, primarily accelerated depreciation, associated with consolidating coffee production currently in Miami into our existing facilities in New Orleans, Louisiana. We incurred one-time costs of $2.7 in 2013 and we expect the remainder of the costs to be incurred through 2015.
The acquisition of Rowland Coffee, a leading producer of espresso coffee in the U.S., strengthens and broadens our leadership in the U.S. retail coffee category by adding the leading Hispanic brands, Café Bustelo and Café Pilon, to our portfolio of brands.
The purchase price was allocated to the underlying assets acquired and liabilities assumed based upon their estimated fair values at the date of acquisition. We determined the estimated fair values based on independent appraisals, discounted cash flow analyses, and our own estimates. The purchase price exceeded the estimated fair value of the net identifiable tangible and intangible assets acquired, and, as such, the excess was allocated to goodwill. The amount allocated to goodwill was primarily attributable to anticipated synergies and market expansion. The following table summarizes the estimated fair values of the assets acquired and liabilities assumed at the acquisition date.
Assets acquired: Current assets $ 34.0 Property, plant, and equipment 29.2 Goodwill 91.7 Intangible assets 213.5
Total assets acquired $368.4
Liabilities assumed: Current liabilities $ 5.6
Total liabilities assumed $ 5.6
Net assets acquired $362.8
Goodwill of $84.8 and $6.9 was assigned to the U.S. Retail Coffee and the International, Foodservice, and Natural Foods segments, respectively. Of the total goodwill, $82.4 is deductible for income tax purposes.
The purchase price allocated to the identifiable intangible assets acquired is as follows:
Notes to CoNsolidated FiNaNCial statemeNtsThe J. M. Smucker Company
Notes to CoNsolidated FiNaNCial statemeNtsThe J. M. Smucker Company
52 The J. M. Smucker Company 2013 Annual Report 53
Note 3 equiTy MeThod inveSTMenTOn March 26, 2012, we acquired a 25 percent equity interest in Guilin Seamild Biologic Technology Development Co., Ltd. (“Seamild”), a privately-owned manufacturer and marketer of oats products headquartered in Guilin in the Guangxi province of China, for $35.9. Seamild’s products, primarily oatmeal and oat-based cereals, are sold under the leading Seamild brand with distribution in retail channels throughout China. Seamild’s portfolio of quality, trusted products aligns with our strategy of owning and marketing leading food brands.
The initial investment in Seamild was recorded at cost and is included in other noncurrent assets in the Consolidated Balance Sheets. The difference between the carrying amount of the investment and the underlying equity in net assets is primarily attributable to goodwill and other intangible assets. Under the equity method of accounting, the investment is adjusted for our proportionate share of earnings or losses, including consideration of basis differences resulting from the difference between the initial carrying amount of the investment and the underlying equity in net assets. The investment did not have a material impact on the International, Foodservice, and Natural Foods segment or the consolidated financial statements for the years ended April 30, 2013 and 2012.
Note 4 ReSTRuCTuRingIn calendar 2010, we announced plans to restructure our coffee, fruit spreads, and Canadian pickle and condiments operations as part of our ongoing efforts to enhance the long-term strength and profitability of our leading brands. The initiative included capital investments for a new state-of-the-art food manufacturing facility in Orrville, Ohio; consolidation of coffee production in New Orleans, Louisiana; and the transition of pickle and condiments production to third-party manufacturers.
In addition, during 2013, we announced plans to expand capacity in order to support our growth objectives for the peanut and other nut butter businesses and increased our estimate of total anticipated restructuring costs from approximately $245.0 to $260.0. These additional costs primarily consist of site preparation and equipment relocation and production start-up costs. Production expansion will include converting the Memphis, Tennessee fruit spreads facility into a peanut butter plant. The Memphis facility was originally scheduled to close as part of the fruit spreads portion of the restructuring plan. Cumulative costs of $227.6 have been incurred through April 30, 2013. The majority of the remaining costs are anticipated to be recognized through 2015.
Upon conversion of the Memphis facility, we intend to relocate natural peanut butter production, currently produced at the New Bethlehem, Pennsylvania facility to the Memphis facility. The New Bethlehem facility will then be converted to produce specialty nut butters, which are currently produced by third-party manufacturers. Upon completion, the restructuring plan will result in a reduction of approximately 850 full-time positions. As of April 30, 2013, approximately 80 percent of the 850 full-time positions have been reduced and the Sherman, Texas; Dunnville, Ontario; Delhi Township, Ontario; and Kansas City, Missouri facilities have been closed. The Ste. Marie, Quebec facility is anticipated to close in 2014.
The following table summarizes the restructuring activity, including the liabilities recorded and the total amount expected to be incurred.
Site Preparation Long-Lived Employee and Equipment Production Asset Charges Separation Relocation Start-up Other Costs Total
During the years ended April 30, 2013, 2012, and 2011, total restructuring charges of $38.8, $81.1, and $102.0, respectively, were reported in the Statements of Consolidated Income. Of the total restructuring charges, $10.0, $38.6, and $54.1 were reported in cost of products sold – restructuring and merger and integration in the years ended April 30, 2013, 2012, and 2011, respectively. The remaining charges were reported in other restructuring and merger and integration costs. The restructuring costs classified as cost of products sold – restructuring and merger and integration primarily include long-lived asset charges for accelerated depreciation related to property, plant, and equipment that had been used at the affected production facilities prior to closure.
Employee separation costs include severance, retention bonuses, and pension costs. Severance costs and retention bonuses are being recognized over the estimated future service period of the affected employees. The obligation related to employee separation costs is included in other current liabilities in the Consolidated Balance Sheets. For additional information on the impact of the restructuring plan on defined benefit pension and other postretirement benefit plans not reflected in the table above, see Note 8: Pensions and Other Postretirement Benefits.
Other costs include professional fees, costs related to closing the facilities, and miscellaneous expenditures associated with the restructuring initiative and are expensed as incurred.
Note 5 RePoRTAble SegMenTSWe operate in one industry: the manufacturing and marketing of food products. We have three reportable segments: U.S. Retail Coffee, U.S. Retail Consumer Foods, and International, Foodservice, and Natural Foods. The U.S. Retail Coffee segment primarily represents the domestic sales of Folgers, Dunkin’ Donuts, Millstone, Café Bustelo, and Café Pilon branded coffee; the U.S. Retail Consumer Foods segment primarily includes domestic sales of Jif, Smucker’s, Pillsbury, Crisco, Martha White, Hungry Jack, and Eagle Brand branded products; and the International, Foodservice, and Natural Foods segment is comprised of products distributed domestically and in foreign countries through retail channels, foodservice distributors and operators (e.g., restaurants, lodging, schools and universities, health care operators), and health and natural foods stores and distributors.
Notes to CoNsolidated FiNaNCial statemeNtsThe J. M. Smucker Company
Notes to CoNsolidated FiNaNCial statemeNtsThe J. M. Smucker Company
54 The J. M. Smucker Company 2013 Annual Report 55
Segment profit represents revenue, less direct and allocable operating expenses, and is consistent with the way in which we manage segments. However, we do not represent that the segments, if operated independently, would report the segment profit set forth below, as segment profit excludes certain operating expenses such as corporate administrative expenses. Segment assets represent direct and allocable assets, including certain corporate-held assets such as property, plant, and equipment, and are also set forth in the following table.
Year Ended April 30,
2013 2012 2011
Net sales: U.S. Retail Coffee $2,306.5 $ 2,297.7 $1,930.9 U.S. Retail Consumer Foods 2,214.8 2,094.5 1,953.0 International, Foodservice, and Natural Foods 1,376.4 1,133.6 941.8
Total net sales $ 5,897.7 $5,525.8 $4,825.7
Segment profit: U.S. Retail Coffee $ 607.5 $ 543.0 $ 536.1 U.S. Retail Consumer Foods 415.3 393.3 406.5 International, Foodservice, and Natural Foods 198.2 168.6 159.6
Total segment profit $ 1,221.0 $1,104.9 $1,102.2
Interest expense – net (93.4) (79.8) (67.1)Share-based compensation expense (20.5) (19.3) (19.9)Cost of products sold – restructuring and merger and integration (11.5) (43.2) (54.1)Other restructuring and merger and integration costs (42.8) (72.5) (59.1)Other special project costs (6.7) — —Corporate administrative expenses (229.1) (191.6) (184.8)Other income – net 0.3 2.7 —
Income before income taxes $ 817.3 $ 701.2 $ 717.2
Assets: U.S. Retail Coffee $4,882.4 $5,033.6 $4,830.1 U.S. Retail Consumer Foods 2,618.2 2,612.7 2,416.0 International, Foodservice, and Natural Foods 1,201.3 1,179.6 684.4 Unallocated (A) 329.9 289.3 394.1
Total assets $9,031.8 $9,115.2 $8,324.6
Depreciation, amortization, and impairment charges: U.S. Retail Coffee $ 100.7 $ 102.3 $ 95.4 U.S. Retail Consumer Foods 47.1 46.7 43.3 International, Foodservice, and Natural Foods 63.7 37.7 41.7 Unallocated (B) 39.4 64.9 76.8
Total depreciation, amortization, and impairment charges $ 250.9 $ 251.6 $ 257.2
Additions to property, plant, and equipment: U.S. Retail Coffee $ 46.5 $ 86.9 $ 59.9 U.S. Retail Consumer Foods 85.1 159.5 88.2 International, Foodservice, and Natural Foods 74.9 27.8 32.0
Total additions to property, plant, and equipment $ 206.5 $ 274.2 $ 180.1
(A) Primarily represents unallocated cash and cash equivalents and corporate-held investments.
(B) Primarily represents unallocated depreciation expense included in cost of products sold – restructuring and merger and integration and corporate administrative expense.
The following table presents certain geographical information.
Year Ended April 30,
2013 2012 2011
Net sales: Domestic $5,355.9 $5,014.7 $4,358.1 International: Canada $ 459.5 $ 447.0 $ 409.7 All other international 82.3 64.1 57.9
Total international $ 541.8 $ 511.1 $ 467.6
Total net sales $5,897.7 $5,525.8 $4,825.7
Assets: (A)
Domestic $8,585.4 $8,683.5 $ 7,912.3 International: Canada $ 396.3 $ 386.0 $ 406.6 All other international 50.1 45.7 5.7
Total international $ 446.4 $ 431.7 $ 412.3
Total assets $9,031.8 $9,115.2 $8,324.6
Long-lived assets (excluding goodwill and other intangible assets): Domestic $1,234.7 $1,164.8 $ 886.0 International: Canada $ 20.6 $ 28.1 $ 48.1 All other international 39.0 37.2 0.7
Total international $ 59.6 $ 65.3 $ 48.8
Total long-lived assets (excluding goodwill and other intangible assets) $1,294.3 $1,230.1 $ 934.8
(A) Amounts in 2012, previously recognized in domestic, were adjusted to reflect the Seamild equity investment as all other international. See Note 3: Equity Method Investment for additional information.
The following table presents product sales information.
Year Ended April 30,
2013 2012 2011
Coffee 48% 48% 44%Peanut butter 13 12 12 Fruit spreads 6 7 8 Shortening and oils 6 7 7 Baking mixes and frostings 6 6 6 Canned milk 4 5 5 Flour and baking ingredients 4 5 5 Juices and beverages 3 2 3 Frozen handheld 3 2 2 Portion control 2 2 3 Toppings and syrups 2 2 2 Other 3 2 3
Total product sales 100% 100% 100%
Notes to CoNsolidated FiNaNCial statemeNtsThe J. M. Smucker Company
Notes to CoNsolidated FiNaNCial statemeNtsThe J. M. Smucker Company
56 The J. M. Smucker Company 2013 Annual Report 57
Note 6 eARningS PeR ShAReThe following table sets forth the computation of net income per common share and net income per common share − assuming dilution under the two-class method.
Year Ended April 30,
2013 2012 2011
Net income $544.2 $459.7 $479.5 Net income allocated to participating securities 4.7 4.2 4.7
Net income allocated to common stockholders $539.5 $455.5 $474.8
Weighted-average common shares outstanding 107,881,519 112,212,677 117,009,362 Dilutive effect of stock options 23,256 49,616 110,335
Weighted-average common shares outstanding – assuming dilution 107,904,775 112,262,293 117,119,697
Net income per common share $ 5.00 $ 4.06 $ 4.06
Net income per common share – assuming dilution $ 5.00 $ 4.06 $ 4.05
The following table reconciles the weighted-average common shares used in the basic and diluted earnings per share disclosures to the total weighted-average shares outstanding.
Note 7 goodwill And oTheR inTAngible ASSeTS A summary of changes in goodwill during the years ended April 30, 2013 and 2012, by reportable segment is as follows:
U.S. Retail International, U.S. Retail Consumer Foodservice, and Coffee Foods Natural Foods Total
Balance at May 1, 2011 $1,635.4 $1,036.1 $141.2 $2,812.7 Acquisitions 84.8 — 156.8 241.6 Other 0.1 (0.9) 1.1 0.3
Balance at April 30, 2012 $1,720.3 $1,035.2 $299.1 $3,054.6 Other — (0.6) (1.1) (1.7)
Balance at April 30, 2013 $1,720.3 $1,034.6 $298.0 $3,052.9
The other amounts primarily represent foreign currency exchange during April 30, 2013 and 2012.
Other intangible assets and related accumulated amortization and impairment charges are as follows:
April 30, 2013 April 30, 2012
Accumulated Accumulated Amortization/ Amortization/ Acquisition Impairment Acquisition Impairment Cost Charges Net Cost Charges Net
Total intangible assets subject to amortization $1,636.4 $391.0 $1,245.4 $1,636.4 $294.2 $1,342.2
Indefinite-lived intangible assets not subject to amortization: Trademarks $1,855.6 $ 11.6 $1,844.0 $1,855.6 $ 10.8 $1,844.8
Total other intangible assets $3,492.0 $402.6 $3,089.4 $3,492.0 $305.0 $3,187.0
Amortization expense for finite-lived intangible assets was $96.6, $87.7, and $73.4 in 2013, 2012, and 2011, respectively. The weighted-average useful lives of the customer and contractual relationships, patents and technology, and trademarks are 19 years, 13 years, and 9 years, respectively. The weighted-average useful life of the total finite-lived intangible assets is 18 years. Based on the amount of intangible assets subject to amortization at April 30, 2013, the estimated amortization expense is $97.7 for 2014, $96.5 for both 2015 and 2016, $95.9 for 2017, and $91.8 for 2018.
We review goodwill and other indefinite-lived intangible assets at least annually for impairment. The annual impairment review was performed as of February 1, 2013. Goodwill impairment is tested at the reporting unit level. We have six reporting units. No goodwill or other indefinite-lived intangible asset impairment was recognized as a result of the annual evaluation performed as of February 1, 2013. The estimated fair value of each reporting unit and other indefinite-lived intangible asset was substantially in excess of its carrying value as of the annual test date, with the exception of the Crisco trademark. A sensitivity analysis was performed on the Crisco trademark and yielded an estimated fair value slightly below carrying value resulting from a hypothetical 50 basis point increase in the discount rate and a 50 basis point decrease in the expected long-term growth rate. The Crisco trademark represents less than 10 percent of total other indefinite-lived intangible assets.
Nonrecurring fair value adjustments of $4.6 and $17.6 were recognized related to the impairment of certain intangible assets in 2012 and 2011, respectively. The impairment recognized in 2012 was related to a finite-lived trademark upon evaluation of the historical performance and future growth of this regional canned milk brand. The majority of the impairment recognized in 2011 was related to the Europe’s Best trademark and customer relationship. In October 2011, we sold the Europe’s Best frozen fruit and vegetable business, resulting in a loss of $11.3.
Notes to CoNsolidated FiNaNCial statemeNtsThe J. M. Smucker Company
Notes to CoNsolidated FiNaNCial statemeNtsThe J. M. Smucker Company
58 The J. M. Smucker Company 2013 Annual Report 59
Note 8 PenSionS And oTheR PoSTReTiReMenT benefiTSWe have defined benefit pension plans covering certain domestic and Canadian employees. Benefits are based on the employee’s years of service and compensation. Our plans are funded in conformity with the funding requirements of applicable government regulations.
In addition to providing pension benefits, we sponsor several unfunded, defined postretirement plans that provide health care and life insurance benefits to certain retired domestic and Canadian employees. These plans are contributory, with retiree contributions adjusted periodically, and contain other cost-sharing features, such as deductibles and coinsurance. Covered employees generally are eligible for these benefits when they reach age 55 and have attained 10 years of credited service.
Upon completion of the restructuring activity discussed in Note 4: Restructuring, approximately 850 full-time positions will be reduced. We have included the impact of the reductions in measuring the U.S. and Canadian benefit obligation of the pension plans and other postretirement plans at April 30, 2013 and 2012. Included in the following tables are charges recognized for termination benefits, curtailment, and settlement as a result of the restructuring plan.
During 2013, a portion of our terminated pension participants received lump-sum cash settlements in order to reduce our future pension obligation and administrative costs. The charges related to the lump-sum cash settlements are included below in settlement loss and were reported in other special project costs in the Statement of Consolidated Income for the year ended April 30, 2013. The lump-sum offerings in 2013 conclude the pension settlement special project cost activities.
The following table summarizes the components of net periodic benefit cost and the change in accumulated other comprehensive loss related to the defined benefit pension and other postretirement plans.
Defined Benefit Other Pension Plans Postretirement Benefits
Year Ended April 30, 2013 2012 2011 2013 2012 2011
Service cost $ 8.8 $ 8.1 $ 7.5 $ 2.5 $ 2.3 $ 1.6 Interest cost 23.9 26.2 25.5 3.0 3.1 2.8 Expected return on plan assets (25.3) (27.0) (26.8) — — —Amortization of prior service cost (credit) 1.0 1.1 1.1 (0.4) (0.4) (0.5)Amortization of net actuarial loss (gain) 13.1 9.4 10.3 — — (0.5)Curtailment loss (gain) — 1.1 4.1 — (0.1) —Settlement loss 6.7 1.1 — — — —Termination benefit cost — 1.8 8.4 — 2.0 2.4
Other changes in plan assets and benefit liabilities recognized in accumulated other comprehensive loss before income taxes: Prior service (cost) credit arising during the year $ (4.0) $ — $ (0.4) $ 9.6 $ — $(0.9) Net actuarial loss arising during the year (20.5) (82.1) (13.5) (4.5) (4.2) (7.8) Amortization of prior service cost (credit) 1.0 1.1 1.1 (0.4) (0.4) (0.5) Amortization of net actuarial loss (gain) 13.1 9.4 10.3 — — (0.5) Curtailment loss (gain) 2.0 1.1 4.1 — (0.1) — Settlement loss 6.7 1.1 — — — — Foreign currency translation 0.9 1.1 (2.0) — (0.1) 0.1
Net change for year $ (0.8) $(68.3) $ (0.4) $ 4.7 $(4.8) $ (9.6)
Weighted-average assumptions used in determining net periodic benefit costs: U.S. plans: Discount rate 4.70% 5.50% 5.80% 4.70% 5.50% 5.80% Expected return on plan assets 7.00 7.00 7.50 — — — Rate of compensation increase 4.12 4.14 4.15 — — — Canadian plans: Discount rate 4.20% 5.00% 5.30% 4.20% 5.00% 5.30% Expected return on plan assets 6.17 6.66 7.08 — — — Rate of compensation increase 4.00 4.00 4.00 — — —
We use a measurement date of April 30 to determine defined benefit pension plans and other postretirement benefits’ assets and benefit obligations. The following table sets forth the combined status of the plans as recognized in the Consolidated Balance Sheets.
Defined Benefit Other Pension Plans Postretirement Benefits
Benefit obligation at end of year $ 575.7 $ 561.7 $ 67.1 $ 68.8
Change in plan assets: Fair value of plan assets at beginning of year $ 386.5 $ 407.6 $ — $ — Actual return on plan assets 44.2 5.2 — — Company contributions 40.0 11.4 2.2 2.2 Participant contributions 0.5 0.5 1.5 1.4 Benefits paid (43.6) (28.5) (3.7) (3.6) Foreign currency translation adjustments (2.1) (4.7) — — Settlement (14.8) (5.0) — —
Fair value of plan assets at end of year $ 410.7 $ 386.5 $ — $ —
Funded status of the plans $(165.0) $(175.2) $ (67.1) $(68.8)
Defined benefit pensions $(163.0) $ (147.6) $ — $ —Accrued compensation (2.0) (27.6) — —Postretirement benefits other than pensions — — (67.1) (68.8)
Net benefit liability $(165.0) $(175.2) $(67.1) $(68.8)
The following table summarizes amounts recognized in accumulated other comprehensive loss in the Consolidated Balance Sheets, before income taxes.
Defined Benefit Other Pension Plans Postretirement Benefits
April 30, 2013 2012 2013 2012
Net actuarial (loss) gain $(202.1) $(204.4) $ (2.2) $2.3 Prior service (cost) credit (6.1) (3.0) 10.9 1.7
Total recognized in accumulated other comprehensive loss $(208.2) $(207.4) $ 8.7 $4.0
The related tax impact recognized in accumulated other comprehensive loss was a benefit of $68.2 and $69.2 at April 30, 2013 and 2012, respectively.
During 2014, we expect to recognize amortization of net actuarial losses and prior service cost of $13.0 and $0.2, respectively, in net periodic benefit cost.
Notes to CoNsolidated FiNaNCial statemeNtsThe J. M. Smucker Company
Notes to CoNsolidated FiNaNCial statemeNtsThe J. M. Smucker Company
60 The J. M. Smucker Company 2013 Annual Report 61
The following table sets forth the weighted-average assumptions used in determining the benefit obligations.
Defined Benefit Other Pension Plans Postretirement Benefits
For 2014, the assumed health care trend rates are 7.5 percent and 6.0 percent for the U.S. and Canadian plans, respectively. The rate for participants under age 65 is assumed to decrease to 5.0 percent in 2019 and 4.5 percent in 2017 for the U.S. and Canadian plans, respectively. The health care cost trend rate assumption has a significant effect on the amount of the other postretirement benefits obligation and periodic other postretirement benefits cost reported.
A one percentage point annual change in the assumed health care cost trend rate would have the following effect as of April 30, 2013:
One Percentage Point
Increase Decrease
Effect on total service and interest cost components $0.2 $0.2Effect on benefit obligation 3.4 2.9
The following table sets forth selective information pertaining to our Canadian pension and other postretirement benefit plans.
Defined Benefit Other Pension Plans Postretirement Benefits
Year Ended April 30, 2013 2012 2013 2012
Benefit obligation at end of year $125.7 $125.7 $ 13.5 $ 13.3 Fair value of plan assets at end of year 107.1 104.5 — —
Funded status of the plans $ (18.6) $ (21.2) $(13.5) $(13.3)
Components of net periodic benefit cost: Service cost $ 1.3 $ 1.3 $ — $ — Interest cost 5.0 5.6 0.6 0.6 Expected return on plan assets (6.2) (7.0) — — Amortization of net actuarial loss 1.7 3.0 — — Curtailment gain — — — (0.1) Settlement loss — 1.1 — —
Net periodic benefit cost $ 1.8 $ 4.0 $ 0.6 $ 0.5
Changes in plan assets: Company contributions $ 5.0 $ 6.1 $ 0.9 $ 0.8 Participant contributions 0.4 0.5 — — Benefits paid (9.4) (9.3) (0.9) (0.8) Actual return on plan assets 8.7 3.1 — — Foreign currency translation (2.1) (4.7) — — Settlement loss — (5.0) — —
The following table sets forth additional information related to our defined benefit pension plans.
April 30,
2013 2012
Accumulated benefit obligation for all pension plans $539.0 $523.6 Plans with an accumulated benefit obligation in excess of plan assets: Accumulated benefit obligation $539.0 $523.6 Fair value of plan assets 410.7 386.5 Plans with a projected benefit obligation in excess of plan assets: Projected benefit obligation $575.7 $561.7 Fair value of plan assets 410.7 386.5
We employ a total return on investment approach for the defined benefit pension plans’ assets. A mix of equity, fixed-income, and alternative investments is used to maximize the long-term rate of return on assets for the level of risk. In determining the expected long-term rate of return on the defined benefit pension plans’ assets, we consider the historical rates of return, the nature of invest-ments, the asset allocation, and expectations of future investment strategies. The actual rate of return was 12.6 percent and 1.9 percent for the years ended April 30, 2013 and 2012, respectively.
The following tables summarize the fair value of the major asset classes for the U.S. and Canadian defined benefit pension plans and the levels within the fair value hierarchy in which the fair value measurements fall.
Quoted Prices in Significant Significant Active Markets for Observable Unobservable Identical Assets Inputs Inputs Fair Value at (Level 1) (Level 2) (Level 3) April 30, 2013
Cash and cash equivalents (A) $ 4.4 $ — $ — $ 4.4 Equity securities: U.S. (B) 97.2 16.8 — 114.0 International (C) 72.1 12.9 — 85.0 Fixed-income securities: Bonds (D) 147.7 — — 147.7 Fixed income (E) 44.6 — — 44.6 Other types of investments: (F)
Private equity funds — — 15.0 15.0
Total financial assets measured at fair value $366.0 $29.7 $15.0 $410.7
Notes to CoNsolidated FiNaNCial statemeNtsThe J. M. Smucker Company
Notes to CoNsolidated FiNaNCial statemeNtsThe J. M. Smucker Company
62 The J. M. Smucker Company 2013 Annual Report 63
Quoted Prices in Significant Significant Active Markets for Observable Unobservable Identical Assets Inputs Inputs Fair Value at (Level 1) (Level 2) (Level 3) April 30, 2012
Cash and cash equivalents (A) $ 14.0 $ — $ — $ 14.0 Equity securities: U.S. (B) 79.6 16.9 — 96.5 International (C) 65.4 13.0 — 78.4 Fixed-income securities: Bonds (D) 82.1 — — 82.1 Fixed income (E) 76.9 — — 76.9 Other types of investments: (F)
Total financial assets measured at fair value $318.0 $29.9 $38.6 $386.5
(A) This category includes money market holdings with maturities of three months or less and cash held in escrow for less than six months. These assets are classified as Level 1 and based on their short-term nature, carrying value approximates fair value.
(B) This category is invested primarily in a diversified portfolio of common stocks and index funds that invest in U.S. stocks with market capitalization ranges similar to those found in the various Russell Indexes and are traded on active exchanges. The Level 1 assets are valued using quoted market prices for identical securities in active markets. The Level 2 assets are funds that consist of equity securities traded on active exchanges.
(C) This category is invested primarily in common stocks and other equity securities traded on active exchanges whose issuers are located outside the U.S. The fund invests primarily in developed countries, but may also invest in emerging markets. The Level 1 assets are valued using quoted market prices for identical securities in active markets. The Level 2 assets are funds that consist of equity securities traded on active exchanges.
(D) This category seeks to duplicate the return characteristics of high-quality corporate bonds with a duration range of 10 to 13 years. The Level 1 assets are valued using quoted market prices for identical securities in active markets.
(E) In 2013, this category is comprised of fixed-income funds that invest primarily in government-related bonds of non-U.S. issuers and include investments in the Canadian market as well as emerging markets. In 2012, this category was comprised of a core fixed-income fund that invested at least 80 percent of its assets in investment-grade U.S. corporate and government fixed-income securities, including mortgage-backed securities. The Level 1 assets are valued using quoted market prices for identical securities in active markets.
(F) The hedge funds category is comprised of hedge funds of funds that invest in equity hedge, directional, relative value, and event-driven funds. The hedge funds have quarterly liquidity with 65 days’ notice. All hedge funds were sold prior to April 30, 2013. The private equity funds category is comprised of one fund that consists primarily of limited partnership interests in corporate finance and venture capital funds. The private equity fund cannot be redeemed and return of principal is based on the liquidation of the underlying assets. Both the hedge funds and the private equity fund are classified as Level 3 assets and are valued based on each fund’s net asset value (“NAV”). NAV is calculated based on the estimated fair value of the underlying investment funds within the portfolio and is corroborated by our review.
The following tables present a rollforward of activity for Level 3 assets.
Hedge Private Funds Equity Funds Total
Balance at May 1, 2012 $ 22.3 $16.3 $ 38.6 Purchases and sales – net (22.8) 1.1 (21.7) Actual return on plan assets sold during the period 0.5 — 0.5 Actual return on plan assets still held at reporting date — (2.4) (2.4)
Balance at April 30, 2013 $ — $15.0 $ 15.0
U.S. Equity Hedge Private Securities Funds Equity Funds Total
Balance at May 1, 2011 $ 4.8 $ 37.4 $13.2 $ 55.4 Purchases and sales – net 3.0 (13.6) 1.1 (9.5) Actual return on plan assets sold during the period (7.8) (0.9) — (8.7) Actual return on plan assets still held at reporting date — (0.6) 2.0 1.4
Balance at April 30, 2012 $ — $ 22.3 $16.3 $ 38.6
The current investment policy is to invest 47 percent of assets in equity securities, 47 percent in fixed-income securities, and 6 percent in other investments. Included in equity securities were 317,552 of our common shares at April 30, 2013 and 2012. The market value of these shares was $32.8 at April 30, 2013. We paid dividends of $0.6 on these shares during 2013.
We expect to contribute approximately $6.0 to the defined benefit pension plans in 2014. We expect the following payments to be made from the defined benefit pension and other postretirement benefit plans: $42.9 in 2014, $36.4 in 2015, $44.0 in 2016, $38.0 in 2017, $42.3 in 2018, and $211.9 in 2019 through 2023.
Notes to CoNsolidated FiNaNCial statemeNtsThe J. M. Smucker Company
Notes to CoNsolidated FiNaNCial statemeNtsThe J. M. Smucker Company
64 The J. M. Smucker Company 2013 Annual Report 65
Note 9 ShARe-bASed PAyMenTSWe provide for equity-based incentives to be awarded to key employees and non-employee directors. Currently, these incentives consist of restricted shares, restricted stock units (which may also be referred to as deferred stock units), performance units, and stock options. These awards are administered primarily through the 2010 Equity and Incentive Compensation Plan approved by our shareholders in August 2010. Awards under this plan may be in the form of stock options, stock appreciation rights, restricted shares, restricted stock units, performance shares, performance units, incentive awards, and other share-based awards. Awards under this plan may be granted to our non-employee directors, consultants, officers, and other employees. Deferred stock units granted to non-employee directors vest immediately, and along with dividends credited on those deferred stock units, are paid out in the form of common shares upon termination of service as a non-employee director. At April 30, 2013, there were 7,092,083 shares available for future issuance under this plan.
Under the 2010 Equity and Incentive Compensation Plan, we have the option to settle share-based awards by issuing common shares from treasury, issuing new Company common shares, or issuing a combination of common shares from treasury and new Company common shares.
Stock Options: The following table is a summary of our stock option activity and related information.
Weighted-Average Options Exercise Price
Outstanding at May 1, 2012 124,841 $42.18 Exercised (77,408) 40.91
Outstanding and exercisable at April 30, 2013 47,433 $44.26
At April 30, 2013, the weighted-average remaining contractual term for stock options outstanding and exercisable was 2.3 years and the aggregate intrinsic value of these stock options was $2.8.
The total intrinsic value of options exercised during 2013, 2012, and 2011 was $3.4, $2.6, and $13.4, respectively.
Other Equity Awards: The following table is a summary of our restricted shares, deferred stock units, and performance units.
Restricted Shares Weighted-Average Weighted-Average and Deferred Grant Date Performance Conversion Date Stock Units Fair Value Units Fair Value
Outstanding at April 30, 2013 985,214 $59.64 106,666 $100.54
The total fair value of equity awards other than stock options vested in 2013, 2012, and 2011 was $11.8, $22.7, and $17.7, respectively. The weighted-average grant date fair value of restricted shares and deferred stock units is the average of the high and the low share price on the date of grant. The weighted-average conversion date fair value of performance units is the average of the high and the low share price on the date of conversion to restricted shares. The following table summarizes the weighted-average fair values of the equity awards granted in 2013, 2012, and 2011.
Restricted Weighted- Weighted- Shares and Average Average Deferred Grant Date Performance Conversion Date Year Ended April 30, Stock Units Fair Value Units Fair Value
The performance units column represents the number of restricted shares received by certain executive officers, subsequent to year end, upon conversion of the performance units earned during the year. Restricted shares and deferred stock units generally vest four years from the date of grant or upon the attainment of a defined age and years of service, subject to certain retention requirements.
Note 10 debT And finAnCing ARRAngeMenTSLong-term debt consists of the following:
Year Ended April 30,
2013 2012
4.78% Senior Notes due June 1, 2014 $ 100.0 $ 100.0 6.12% Senior Notes due November 1, 2015 24.0 24.0 6.63% Senior Notes due November 1, 2018 395.0 397.9 3.50% Senior Notes due October 15, 2021 748.8 748.6 5.55% Senior Notes due April 1, 2022 350.0 400.0 4.50% Senior Notes due June 1, 2025 400.0 400.0
Total long-term debt $2,017.8 $2,070.5 Current portion of long-term debt 50.0 50.0
Total long-term debt, less current portion $1,967.8 $2,020.5
The 3.50 percent Senior Notes were issued in a public offering and the remaining Senior Notes were privately placed. The Senior Notes are unsecured and interest is paid semiannually. Scheduled payments are required on the 5.55 percent Senior Notes, of which $50.0 is due on April 1, 2014, and on the 4.50 percent Senior Notes, the first of which is $100.0 on June 1, 2020. During 2013, $50.0 was paid on the 5.55 percent Senior Notes as required. We may prepay at any time all or part of the Senior Notes at 100 percent of the principal amount thereof, together with accrued and unpaid interest, and any applicable make-whole amount. Interest paid totaled $97.7, $86.6, and $62.1 in 2013, 2012, and 2011, respectively.
We have a $1.0 billion revolving credit facility available with a group of nine banks that matures in July 2016. Our borrowings under the credit facility bear interest based on the prevailing U.S. Prime Rate, Canadian Base Rate, London Interbank Offered Rate, or Canadian Dealer Offered Rate, based on our election. Interest is payable either on a quarterly basis or at the end of the borrowing term. At April 30, 2013, we did not have a balance outstanding under the revolving credit facility. We had standby letters of credit of approximately $8.1 outstanding at April 30, 2013.
Our debt instruments contain certain financial covenant restrictions including consolidated net worth, a leverage ratio, and an interest coverage ratio. We are in compliance with all covenants.
Notes to CoNsolidated FiNaNCial statemeNtsThe J. M. Smucker Company
Notes to CoNsolidated FiNaNCial statemeNtsThe J. M. Smucker Company
66 The J. M. Smucker Company 2013 Annual Report 67
Note 11 ConTingenCieS We, like other food manufacturers, are from time to time subject to various administrative, regulatory, and other legal proceedings arising in the ordinary course of business. We are currently a defendant in a variety of such legal proceedings. We cannot predict with certainty the ultimate results of these proceedings or reasonably determine a range of potential loss. Our policy is to accrue costs for contingent liabilities when such liabilities are probable and amounts can be reasonably estimated. Based on the information known to date, we do not believe the final outcome of these proceedings will have a material adverse effect on our financial position, results of operations, or cash flows.
Note 12 deRivATive finAnCiAl inSTRuMenTSWe are exposed to market risks, such as changes in commodity prices, foreign currency exchange rates, and interest rates. To manage the volatility related to these exposures, we enter into various derivative transactions. We have policies in place that define acceptable instrument types we may enter into and establish controls to limit our market risk exposure.
Commodity Price Management: We enter into commodity futures and options contracts to manage the price volatility and reduce the variability of future cash flows related to anticipated inventory purchases of key raw materials, notably green coffee, edible oils, and flour. We also enter into commodity futures and options contracts to manage price risk for energy input costs, including natural gas and diesel fuel. The derivative instruments generally have maturities of less than one year.
Certain of our derivative instruments meet the hedge criteria and are accounted for as cash flow hedges. The mark-to-market gains or losses on qualifying hedges are deferred and included as a component of accumulated other comprehensive loss to the extent effective, and reclassified to cost of products sold in the period during which the hedged transaction affects earnings. Cash flows related to qualifying hedges are classified consistently with the cash flows from the hedged item in the Statements of Consolidated Cash Flows. In order to qualify as a hedge of commodity price risk, it must be demonstrated that the changes in the fair value of the commodity’s futures contracts are highly effective in hedging price risks associated with the commodity purchased. Hedge effectiveness is measured and assessed at inception and on a monthly basis. The mark-to-market gains or losses on nonqualifying and ineffective portions of commodity hedges are recognized in cost of products sold immediately.
The commodities hedged have a high inverse correlation to price changes of the derivative commodity instrument. Thus, we would expect that any gain or loss in the estimated fair value of the derivatives would generally be offset by an increase or decrease in the estimated fair value of the underlying exposures.
Foreign Currency Exchange Rate hedging: We utilize foreign currency forwards and options contracts to manage the effect of foreign currency exchange fluctuations on future cash payments primarily related to purchases of certain raw materials, finished goods, and fixed assets in Canada. The contracts generally have maturities of less than one year. At the inception of the contract, the derivative is evaluated and documented for hedge accounting treatment. Instruments currently used to manage foreign currency exchange exposures do not meet the requirements for hedge accounting treatment and the change in value of these instruments is immediately recognized in cost of products sold. If the contract qualifies for hedge accounting treatment, to the extent the hedge is deemed effective, the associated mark-to-market gains and losses are deferred and included as a component of accumulated other comprehensive loss. These gains or losses are reclassified to earnings in the period the contract is executed. The ineffective portion of these contracts is immediately recognized in earnings.
Interest Rate hedging: We utilize derivative instruments to manage changes in the fair value of our debt. Interest rate swaps mitigate the risk associated with the underlying hedged item. At the inception of the contract, the instrument is evaluated and documented for hedge accounting treatment. If the contract is designated as a cash flow hedge, the mark-to-market gains or losses on the swap are deferred and included as a component of accumulated other comprehensive loss to the extent effective, and reclassified to interest expense in the period during which the hedged transaction affects earnings. If the contract is designated as a fair value hedge, the swap would be recognized at fair value on the balance sheet and changes in the fair value would be recognized in interest expense. Generally, changes in the fair value of the derivative are equal to changes in the fair value of the underlying debt and have no impact on earnings. There were no interest rate swaps outstanding at April 30, 2013 and 2012.
The following table sets forth the fair value of derivative instruments recognized in the Consolidated Balance Sheets.
April 30, 2013 April 30, 2012
Other Other Other Other Current Current Current Current Assets Liabilities Assets Liabilities
Total derivatives not designated as hedging instruments $4.3 $2.5 $ 3.5 $ 4.6
Total derivative instruments $6.4 $4.5 $10.1 $24.1
We have elected to not offset fair value amounts recognized for commodity derivative instruments and the cash margin accounts executed with the same counterparty. We maintained cash margin accounts of $5.5 and $32.5 at April 30, 2013 and 2012, respectively, that are included in other current assets in the Consolidated Balance Sheets.
The following table presents information on pre-tax commodity contract net gains and losses recognized on derivatives designated as cash flow hedges.
Year Ended April 30,
2013 2012
Losses recognized in other comprehensive income (loss) (effective portion) $(27.5) $(31.8)(Losses) gains reclassified from accumulated other comprehensive loss to cost of products sold (effective portion) (39.6) 1.9
Change in accumulated other comprehensive loss $ 12.1 $(33.7)
Losses recognized in cost of products sold (ineffective portion) $ (0.9) $ (0.9)
Included as a component of accumulated other comprehensive loss at April 30, 2013 and 2012, were deferred pre-tax net losses of $12.2 and $24.3, respectively, related to commodity contracts. The related tax impact recognized in accumulated other comprehensive loss was a benefit of $4.4 and $8.8 at April 30, 2013 and 2012, respectively. The entire amount of the deferred net loss included in accumulated other comprehensive loss at April 30, 2013, is expected to be recognized in earnings within one year as the related commodity is sold.
Notes to CoNsolidated FiNaNCial statemeNtsThe J. M. Smucker Company
Notes to CoNsolidated FiNaNCial statemeNtsThe J. M. Smucker Company
68 The J. M. Smucker Company 2013 Annual Report 69
The following table presents information on the pre-tax losses recognized on the interest rate swap designated as a cash flow hedge.
Year Ended April 30,
2013 2012
Losses recognized in other comprehensive income (loss) (effective portion) $ — $(6.2)Losses reclassified from accumulated other comprehensive loss to interest expense (effective portion) (0.5) (0.3)
Change in accumulated other comprehensive loss $ 0.5 $(5.9)
Included as a component of accumulated other comprehensive loss at April 30, 2013 and 2012, were deferred pre-tax losses of $5.4 and $5.9, respectively, related to the interest rate swap that was terminated in October 2011. The related tax benefit recognized in accumulated other comprehensive loss was $1.9 and $2.1 at April 30, 2013 and 2012, respectively. Approximately $0.6 of the pre-tax loss will be recognized over the next 12 months.
The following table presents the net realized and unrealized gains and losses recognized in cost of products sold on derivatives not designated as qualified hedging instruments.
Year Ended April 30,
2013 2012
Unrealized gains (losses) on commodity contracts $ 6.1 $ (7.8)Unrealized gains (losses) on foreign currency exchange contracts 0.5 (0.8)
Total unrealized gains (losses) recognized in cost of products sold $ 6.6 $ (8.6)
Realized (losses) gains on commodity contracts $(1.5) $24.1 Realized gains on foreign currency exchange contracts 0.8 1.8
Total realized (losses) gains recognized in cost of products sold $(0.7) $25.9
Total gains recognized in cost of products sold $ 5.9 $17.3
The following table presents the gross contract notional value of outstanding derivative contracts.
Note 13 oTheR finAnCiAl inSTRuMenTS And fAiR vAlue MeASuReMenTSFinancial instruments, other than derivatives, that potentially subject us to significant concentrations of credit risk consist principally of cash investments and trade receivables. The carrying value of these financial instruments approximates fair value. With respect to trade receivables, we believe there is no concentration of risk with any single customer whose failure or nonperformance would materially affect our results other than as discussed in Major Customer of Note 1: Accounting Policies. We do not require collateral from our customers. Our other financial instruments, with the exception of long-term debt, are recognized at estimated fair value in the Consolidated Balance Sheets.
The following table provides information on the carrying amount and fair value of our financial instruments.
April 30, 2013 April 30, 2012
Carrying Carrying Amount Fair Value Amount Fair Value
Fair value is defined as the price that would be received to sell an asset or paid to transfer a liability in an orderly transaction between market participants at the measurement date. Valuation techniques are based on observable and unobservable inputs. Observable inputs reflect readily obtainable data from independent sources, while unobservable inputs reflect our market assumptions.
The following tables summarize the fair values and the levels within the fair value hierarchy in which the fair value measurements fall for our financial instruments.
Quoted Prices in Significant Significant Active Markets Observable Unobservable for Identical Inputs Inputs Fair Value at Assets (Level 1) (Level 2) (Level 3) April 30, 2013
Total financial instruments measured at fair value $(780.7) $(1,556.7) $ — $(2,337.4)
Notes to CoNsolidated FiNaNCial statemeNtsThe J. M. Smucker Company
Notes to CoNsolidated FiNaNCial statemeNtsThe J. M. Smucker Company
70 The J. M. Smucker Company 2013 Annual Report 71
Quoted Prices in Significant Significant Active Markets Observable Unobservable for Identical Inputs Inputs Fair Value at Assets (Level 1) (Level 2) (Level 3) April 30, 2012
Total financial instruments measured at fair value $(774.0) $(1,647.3) $ — $(2,421.3)
(A) Other investments consist of funds maintained for the payment of benefits associated with nonqualified retirement plans. The funds include equity securities listed in active markets and municipal obligations valued by a third party using valuation techniques that utilize inputs which are derived principally from or corroborated by observable market data. As of April 30, 2013, our municipal obligations are scheduled to mature as follows: $1.0 in 2014, $2.2 in 2015, $0.6 in 2016, $1.8 in 2017, and the remaining $21.0 in 2018 and beyond.
(B) Level 1 derivatives are valued using quoted market prices for identical instruments in active markets. The Level 2 derivatives are valued using quoted prices for similar assets or liabilities in active markets. For additional information, see Note 12: Derivative Financial Instruments.
(C) Long-term debt is comprised of public Senior Notes classified as Level 1 and private Senior Notes classified as Level 2. The public Senior Notes are traded in an active secondary market and valued using quoted prices. The value of the private Senior Notes is based on the net present value of each interest and principal payment calculated, utilizing an interest rate derived from a fair market yield curve. For additional information, see Note 10: Debt and Financing Arrangements.
Note 14 inCoMe TAxeSIncome (loss) before income taxes is as follows:
The components of the provision for income taxes are as follows:
Year Ended April 30,
2013 2012 2011
Current: Federal $262.1 $228.2 $271.4 Foreign 6.1 6.8 4.6 State and local 20.5 23.7 21.5 Deferred: Federal (15.6) (10.2) (51.0) Foreign 0.9 (6.9) (7.3) State and local (0.9) (0.1) (1.5)
Total income tax expense $273.1 $241.5 $237.7
A reconciliation of the statutory federal income tax rate and the effective income tax rate is as follows:
Year Ended April 30,
Percent of Pretax Income 2013 2012 2011
Statutory federal income tax rate 35.0% 35.0% 35.0% State and local income taxes, net of federal income tax benefit 1.8 2.3 2.2 Domestic manufacturing deduction (3.1) (3.1) (3.8) Other items – net (0.3) 0.2 (0.3)
Effective income tax rate 33.4% 34.4% 33.1%
Income taxes paid $279.2 $257.8 $366.0
We are a voluntary participant in the Compliance Assurance Process (“CAP”) program offered by the Internal Revenue Service (“IRS”) and are currently under a CAP examination for the tax year ended April 30, 2013. Through the contemporaneous exchange of information with the IRS, this program is designed to identify and resolve tax positions with the IRS prior to the filing of a tax return, which allows us to remain current with our IRS examinations. The IRS has completed the CAP examinations for tax years ended April 30, 2010, April 30, 2011, and April 30, 2012. Tax years prior to 2010 are no longer subject to U.S. federal tax examination. With limited exceptions, we are no longer subject to examination for state and local jurisdictions for tax years prior to 2008 and for tax years prior to 2006 for foreign jurisdictions.
Deferred income taxes reflect the tax effects of temporary differences between the carrying amounts of assets and liabilities for financial reporting purposes and the amounts used for income tax reporting. Significant components of our deferred tax assets and liabilities are as follows:
April 30,
2013 2012
Deferred tax liabilities: Intangible assets $1,019.6 $1,021.9 Property, plant, and equipment 94.4 102.6 Other 9.4 8.1
Total deferred tax liabilities $1,123.4 $1,132.6
Deferred tax assets: Post-employment and other employee benefits $ 116.3 $ 107.5 Tax credit and loss carryforwards 1.5 2.5 Intangible assets 5.4 3.4 Other 37.7 40.7
Total deferred tax assets $ 160.9 $ 154.1
Net deferred tax liability $ 962.5 $ 978.5
Notes to CoNsolidated FiNaNCial statemeNtsThe J. M. Smucker Company
Notes to CoNsolidated FiNaNCial statemeNtsThe J. M. Smucker Company
72 The J. M. Smucker Company 2013 Annual Report 73
Note 15 guARAnToR And non-guARAnToR finAnCiAl infoRMATionIn October 2011, we filed a registration statement on Form S-3 registering certain securities described therein, including debt securities which are guaranteed by certain of our subsidiaries. We issued $750.0 of 3.50 percent Senior Notes pursuant to the registration statement that are fully and unconditionally guaranteed, on a joint and several basis, by J. M. Smucker LLC and The Folgers Coffee Company (the “subsidiary guarantors”), which are 100 percent wholly-owned subsidiaries of the Company. A subsidiary guarantor will be released from its obligations under the indenture governing the notes (a) if we exercise our legal or covenant defeasance option or if our obligations under the indenture are discharged in accordance with the terms of the indenture or (b) upon delivery of an officer’s certificate to the trustee that the subsidiary guarantor does not guarantee our obligations under any of our other primary senior indebtedness and that any other guarantees of such primary senior indebtedness of the subsidiary guarantor have been released other than through discharges as a result of payment by such guarantor on such guarantees.
Condensed consolidated financial information for the Company, the subsidiary guarantors, and the non-guarantor subsidiaries is provided below. The principal elimination entries relate to investments in subsidiaries and intercompany balances and transactions, including transactions with our 100 percent wholly-owned subsidiary guarantors and non-guarantor subsidiaries. We have accounted for investments in subsidiaries using the equity method.
CondEnSEd STaTEMEnTS of ConSolidaTEd inCoME and CoMprEhEnSivE inCoME Year Ended April 30, 2013
The J. M. Smucker Subsidiary Non-Guarantor Company (Parent) Guarantors Subsidiaries Eliminations Consolidated
Net sales $4,447.6 $1,296.4 $5,430.3 $(5,276.6) $5,897.7 Cost of products sold 3,957.3 1,190.6 4,015.0 (5,292.8) 3,870.1
Gross Profit 490.3 105.8 1,415.3 16.2 2,027.6 Selling, distribution, and administrative expenses, restructuring, merger and integration costs, and other special project costs 199.0 42.9 781.5 — 1,023.4 Amortization 4.8 — 92.0 — 96.8 Other operating (income) expense – net (2.7) (2.2) 1.9 — (3.0)
Operating Income 289.2 65.1 539.9 16.2 910.4 Interest (expense) income – net (94.4) 1.2 (0.2) — (93.4)Other income (expense) – net 0.7 1.1 (1.5) — 0.3 Equity in net earnings of subsidiaries 408.6 156.7 66.4 (631.7) —
Income Before Income Taxes 604.1 224.1 604.6 (615.5) 817.3 Income taxes 59.9 0.4 212.8 — 273.1
Net Income $ 544.2 $ 223.7 $ 391.8 $ (615.5) $ 544.2 Other comprehensive income, net of tax 7.4 9.0 4.1 (13.1) 7.4
The following table summarizes state and foreign loss and credit carryforwards at April 30, 2013.
Related Tax Deferred Expiration Deduction Tax Asset Date
Tax carryforwards: State loss carryforwards $1.0 $0.1 2014 to 2030 State tax credit carryforwards — 1.3 2019 Foreign jurisdictional tax credit carryforwards — 0.1 2015
Total tax carryforwards $1.0 $1.5
Deferred income taxes have not been provided on approximately $250.0 of undistributed earnings of foreign subsidiaries since these amounts are considered to be permanently reinvested. Any additional taxes payable on the earnings of foreign subsidiaries, if remitted, would be partially offset by domestic tax deductions or tax credits for foreign taxes paid. It is not practical to estimate the amount of additional taxes that might be payable on such undistributed earnings.
Our unrecognized tax benefits as of April 30, 2013 and 2012, were $29.7 and $24.0, respectively. Of the unrecognized tax benefits, $20.6 and $16.4 would affect the effective tax rate, if recognized, as of April 30, 2013 and 2012, respectively. Our accrual for tax-related net interest and penalties totaled $2.0 and $1.7 as of April 30, 2013 and 2012, respectively. The amount of tax-related net interest and penalties charged to earnings totaled $0.3 and $0.1 during 2013 and 2012, respectively. Interest credited to earnings totaled $0.5 during 2011.
Within the next 12 months, it is reasonably possible that we could decrease our unrecognized tax benefits by an estimated $3.1, primarily as a result of the expiration of statute of limitations periods.
A reconciliation of our unrecognized tax benefits is as follows:
2013 2012
Balance at May 1, $24.0 $20.3 Increases: Current year tax positions 4.8 3.6 Prior year tax positions 2.5 2.1 Foreign currency translation — 0.2 Decreases: Prior year tax positions 0.2 — Settlement with tax authorities 1.0 0.3 Expiration of statute of limitations periods 0.4 1.9
Balance at April 30, $29.7 $24.0
Notes to CoNsolidated FiNaNCial statemeNtsThe J. M. Smucker Company
Notes to CoNsolidated FiNaNCial statemeNtsThe J. M. Smucker Company
74 The J. M. Smucker Company 2013 Annual Report 75
CondEnSEd STaTEMEnTS of ConSolidaTEd inCoME and CoMprEhEnSivE inCoME Year Ended April 30, 2012
The J. M. Smucker Subsidiary Non-Guarantor Company (Parent) Guarantors Subsidiaries Eliminations Consolidated
Net sales $ 4,302.7 $1,547.8 $3,822.4 $(4,147.1) $5,525.8 Cost of products sold 3,741.0 1,408.8 2,682.7 (4,151.9) 3,680.6
Gross Profit 561.7 139.0 1,139.7 4.8 1,845.2 Selling, distribution, and administrative expenses, restructuring, and merger and integration costs 243.4 61.5 660.3 — 965.2 Amortization and impairment charges 11.2 — 81.5 — 92.7 Other operating (income) expense – net (1.3) (1.3) 11.6 — 9.0
Operating Income 308.4 78.8 386.3 4.8 778.3 Interest (expense) income – net (80.7) 3.0 (2.1) — (79.8)Other income (expense) – net 1,404.4 0.4 (3.6) (1,398.5) 2.7 Equity in net earnings of subsidiaries (1,095.0) 184.2 79.2 831.6 —
Income Before Income Taxes 537.1 266.4 459.8 (562.1) 701.2 Income taxes 77.3 1.2 163.0 — 241.5
Net Income $ 459.8 $ 265.2 $ 296.8 $ (562.1) $ 459.7 Other comprehensive loss, net of tax (87.7) (23.1) (49.8) 73.0 (87.6)
CondEnSEd STaTEMEnTS of ConSolidaTEd inCoME and CoMprEhEnSivE inCoME Year Ended April 30, 2011
The J. M. Smucker Subsidiary Non-Guarantor Company (Parent) Guarantors Subsidiaries Eliminations Consolidated
Net sales $ 3,880.9 $2,805.6 $3,759.8 $(5,620.6) $4,825.7 Cost of products sold 3,196.8 2,546.5 2,884.8 (5,600.9) 3,027.2
Gross Profit 684.1 259.1 875.0 (19.7) 1,798.5 Selling, distribution, and administrative expenses, restructuring, and merger and integration costs 216.7 79.3 626.2 — 922.2 Amortization and impairment charges 5.2 64.6 21.6 — 91.4 Other operating (income) expense – net (0.7) (2.6) 3.9 — 0.6
Operating Income 462.9 117.8 223.3 (19.7) 784.3 Interest (expense) income – net (67.7) 3.4 (2.8) — (67.1)Other (expense) income – net (1.3) 1.7 (0.4) — —Equity in net earnings of subsidiaries 203.1 83.9 67.3 (354.3) —
Income Before Income Taxes 597.0 206.8 287.4 (374.0) 717.2 Income taxes 117.5 21.8 98.4 — 237.7
Net Income $ 479.5 $ 185.0 $ 189.0 $ (374.0) $ 479.5 Other comprehensive income (loss), net of tax 24.2 (45.9) 30.6 15.3 24.2
Total Noncurrent Liabilities 2,337.7 20.3 976.9 — 3,334.9
Total Liabilities 2,661.3 122.0 1,168.5 — 3,951.8
Total Shareholders’ Equity 5,163.4 4,684.3 5,958.8 (10,643.1) 5,163.4
Total Liabilities and Shareholders’ Equity $ 7,824.7 $4,806.3 $7,127.3 $(10,643.1) $9,115.2
CondEnSEd STaTEMEnTS of ConSolidaTEd CaSh flowS Year Ended April 30, 2013
The J. M. Smucker Subsidiary Non-Guarantor Company (Parent) Guarantors Subsidiaries Eliminations Consolidated
Net Cash Provided by Operating Activities $ 206.6 $ 53.9 $ 595.3 $ — $ 855.8
Investing ActivitiesAdditions to property, plant, and equipment (33.6) (103.1) (69.8) — (206.5)Proceeds from disposal of property, plant, and equipment — 0.1 3.2 — 3.3 Other – net (9.5) 3.4 23.7 — 17.6
Net Cash used for Investing Activities (43.1) (99.6) (42.9) — (185.6)
Net Cash (used for) Provided by Financing Activities (146.8) (39.9) 16.3 — (170.4)Effect of exchange rate changes on cash — — 7.9 — 7.9
Net (decrease) increase in cash and cash equivalents (10.9) — 47.1 — 36.2 Cash and cash equivalents at beginning of year 217.7 — 65.9 — 283.6
Cash and Cash Equivalents at End of year $ 206.8 $ — $ 113.0 $ — $ 319.8
( ) Denotes use of cash
Corporate offiCeThe J. M. Smucker CompanyOne Strawberry LaneOrrville, Ohio 44667Telephone: (330) 682-3000
StoCk LiStingOur common shares are listed on the New York Stock Exchange – ticker symbol SJM.
Corporate WebSiteTo learn more about The J. M. Smucker Company, visit smuckers.com.To access financial information about the Company, visit smuckers.com/investors.
annuaL MeetingThe annual meeting will be held at 11:00 a.m. Eastern Time, Wednesday, August 14, 2013, in the Fisher Auditorium at the Ohio Agricultural Research and Development Center, 1680 Madison Avenue, Wooster, Ohio 44691.
Corporate neWS and reportSCorporate news releases, annual reports, and Securities and Exchange Commission filings, including Forms 10-K, 10-Q, and 8-K, are available free of charge on our website. They are also available without cost to shareholders who submit a written request to:
The J. M. Smucker CompanyAttention: Corporate SecretaryOne Strawberry LaneOrrville, Ohio 44667
CertifiCationS Our Chief Executive Officer has certified to the New York Stock Exchange that he is not aware of any violation by the Company of the New York Stock Exchange’s corporate governance listing standards. We have also filed with the Securities and Exchange Commission certain certifications relating to the quality of our public disclosures. These certifications are filed as exhibits to our Annual Report on Form 10-K.
forWard-Looking StateMentSThis Annual Report includes certain forward-looking statements that are based on current expectations and are subject to a number of risks and uncertainties. Please reference “Forward-Looking Statements” located on page 36 in the “Management’s Discussion and Analysis” section.
independent regiStered pubLiC aCCounting firMErnst & Young LLPAkron, Ohio
dividendSOur Board of Directors typically declares a cash dividend each quarter. Dividends are generally payable on the first business day of March, June, September, and December. The record date is approximately two weeks before the payment date. Our dividend disbursement agent is Computershare Investor Services, LLC.
SharehoLder ServiCeSOur transfer agent and registrar, Computershare Investor Services, LLC, is responsible for assisting registered shareholders with a variety of matters including: Shareholder investment program (CIPSM)
– Direct purchase of our common shares – Dividend reinvestment – Automatic monthly cash investments
Book-entry share ownership Share transfer matters (including name changes, gifting,
and inheritances) Direct deposit of dividend payments Nonreceipt of dividend checks Lost share certificates Changes of address Online shareholder account access Form 1099 income inquiries (including requests for duplicate copies)
Shareholders may contact Shareholder Services at the corporate offices regarding other shareholder inquiries.
tranSfer agent and regiStrarComputershare Investor Services, LLC250 Royall Street Canton, MA 02021Telephone: (800) 456-1169Telephone outside U.S., Canada, and Puerto Rico: (312) 360-5254Website: computershare.com/investor
The J. M. Smucker Company is the owner of all trademarks, except for the following, which are used under license: Pillsbury®, the Barrelhead logo and the Doughboy character are trademarks of The Pillsbury Company, LLC; Carnation® is a trademark of Société des Produits Nestlé S.A.; Dunkin’ Donuts® is a registered trademark of DD IP Holder, LLC; Sweet‘N Low ®, NatraTaste®, Sugar In The Raw® and the other “In The Raw” trademarks are registered trademarks of Cumberland Packing Corp. and its affiliates; Life is good ® is a registered trademark of The Life is good Company; and Douwe Egberts® and Pickwick ® are registered trademarks of D.E Master Blenders 1753 N.V. Borden ® and Elsie are also trademarks used under license.DE
SIgN
ED B
Y: C
ORPO
RATE
REP
ORTS
INC.
AT
LANT
A, g
A W
WW
.COR
PORA
TERE
PORT
.COM
Shareholder information
Note 16 COMMON SHARESVoting: The Amended Articles of Incorporation (“Articles”) provide that each holder of a common share outstanding is entitled to one vote on each matter submitted to a vote of the shareholders except for the following specific matters: • any matter that relates to or would result in the dissolution or liquidation of the Company;• the adoption of any amendment of our Articles or Amended Regulations, or the adoption of amended Articles, other than the adoption of any
amendment or amended Articles that increases the number of votes to which holders of our common shares are entitled or expands the matters to which time-phased voting applies;
• any proposal or other action to be taken by our shareholders relating to the Rights Agreement, dated as of May 20, 2009, between the Company and Computershare Trust Company, N.A. or any successor plan;
• any matter relating to any stock option plan, stock purchase plan, executive compensation plan, executive benefit plan, or other similar plan, arrangement, or agreement;
• adoption of any agreement or plan of or for the merger, consolidation, or majority share acquisition of us or any of our subsidiaries with or into any other person, whether domestic or foreign, corporate or noncorporate, or the authorization of the lease, sale, exchange, transfer, or other disposition of all, or substantially all, of our assets;
• any matter submitted to our shareholders pursuant to Article Fifth (which relates to procedures applicable to certain business combinations) or Article Seventh (which relates to procedures applicable to certain proposed acquisitions of specified percentages of our outstanding common shares) of the Articles, as they may be further amended, or any issuance of our common shares for which shareholder approval is required by applicable stock exchange rules; and
• any matter relating to the issuance of our common shares or the repurchase of our common shares that the Board determines is required or appropriate to be submitted to our shareholders under the Ohio Revised Code or applicable stock exchange rules.
On the matters listed above, common shares are entitled to 10 votes per share if they meet the requirements set forth in the Articles. Common shares which would be entitled to 10 votes per share must meet one of the following criteria:• common shares for which there has not been a change in beneficial ownership in the past four years; or• common shares received through our various equity plans which have not been sold or otherwise transferred.
In the event of a change in beneficial ownership, the new owner of that common share will be entitled to only one vote with respect to that share on all matters until four years pass without a further change in beneficial ownership of the share.
Shareholders’ Rights Plan: Pursuant to a Shareholders’ Rights Plan adopted by the Board of Directors on May 20, 2009, one share purchase right is associated with each of our outstanding common shares.
Under the plan, the rights will initially trade together with our common shares and will not be exercisable. In the absence of further action by the directors, the rights generally will become exercisable and allow the holder to acquire our common shares at a discounted price if a person or group acquires 10 percent or more of our outstanding common shares. Rights held by persons who exceed the applicable threshold will be void. Shares held by members of the Smucker family are not subject to the threshold. If exercisable, each right entitles the shareholder to buy one common share at a discounted price. Under certain circumstances, the rights will entitle the holder to buy shares in an acquiring entity at a discounted price.
The plan also includes an exchange option. In general, if the rights become exercisable, the directors may, at their option, effect an exchange of part or all of the rights, other than rights that have become void, for common shares. Under this option, we would issue one common share for each right, in each case subject to adjustment in certain circumstances.
Our directors may, at their option, redeem all rights for $0.001 per right, generally at any time prior to the rights becoming exercisable. The rights will expire June 3, 2019, unless earlier redeemed, exchanged, or amended by the directors.
Repurchase Programs: We repurchased 4.0 million common shares for $359.4 in 2013, approximately 4.1 million common shares for $305.3 in 2012, and approximately 5.7 million common shares for $381.5 in 2011.
At April 30, 2013, approximately 4.9 million common shares were available for repurchase under the Board of Directors’ most recent authoriza-tion. Subsequent to April 30, 2013, we repurchased approximately 0.6 million common shares for $60.8, utilizing proceeds of $29.0 from our revolving credit facility. Approximately 4.3 million shares remain available for repurchase as of June 18, 2013.
NOTeS TO CONSOlIDATeD FINANCIAl STATeMeNTSThe J. M. Smucker Company
80 The J. M. Smucker Company
One Strawberry Lane / Orrville, Ohio 44667 / (330) 682-3000smuckers.com