28
WILH. WILHELMSEN HOLDING ASA Second quarter and half-year 2019 report

WILH. WILHELMSEN HOLDING ASA
Second quarter and
half-year 2019 report

Highlights for the quarter
The Wilhelmsen group recorded USD 89 million in net profit after non-controlling interests in the second
quarter. A positive development in EBITDA and a net gain from financial investments was partly offset by
reduced contribution from associates.
• USD 42 million in EBITDA
• Positive underlying development and a sales gain in maritime services
• Seasonal uplift for supply services
• Reduced share of profit from associates
• Stable operation but unrealised financial expenses in Wallenius Wilhelmsen ASA
• Strong net gain from other financials
• Significant increase in Hyundai Glovis value
• Write down of the investment in Survitec Group
• Positive contribution from other investments
• First dividend of NOK 2.50 per share paid on 15 May
Key figures
Wilh. Wilhelmsen Holding group Q2 2019 unaudited 2 of 28

Financial performance
Result for the quarter Total income for the Wilh. Wilhelmsen Holding ASA
group (referred to as Wilhelmsen or group) was USD 208
million in the second quarter of 2019. This was up 5% from
the previous quarter, reflecting a seasonal increase in
activity level within the supply services business segment
and a sales gain in the maritime services segment.
EBITDA was USD 42 million for the quarter, up 25% from
the previous quarter. Maritime services and supply services
both had a positive development in EBITDA from
operating activities. In addition, gain on sale of assets had
a positive impact on the results.
Share of profit from associates was USD 3 million for the
quarter, of which USD 1 million was from Wallenius
Wilhelmsen ASA.
Change in fair value of financial assets was positive with
USD 99 million for the quarter. A strong increase in value
of the investment in Hyundai Glovis was only partly offset
by a full write down of the investment in Survitec Group.
Income from other financial investments was positive.
Other comprehensive income for the quarter was a gain of
USD 2 million, primarily related to currency translation
differences on non-USD assets.
Total comprehensive income, including net profit and other
comprehensive income, attributable to owners of the parent
was USD 91 million in the second quarter.
Balance sheet Total assets were up 3% in the second quarter, mainly due
to increased value of financial assets.
A profit for the period lifted equity attributable to owners
of the parent with 4%, to USD 1 936 million. As of 30 June
2019, the group equity ratio was 64%.
Cash, liquidity and debt
Cash and cash equivalents were USD 150 million at the end
of the second quarter, down USD 12 million from the
previous quarter. Changes in cash balances for the group
and business segments are partly due to dividend payments
and group contributions normally paid in the second
quarter.
Total interest-bearing debt was USD 712 million by the
end of the quarter, a USD 6 million reduction from the
previous quarter.
Result for the half year Result for the first half reflected positive development in
EBITDA and net profit for both the maritime services and
the supply services business segments when compared
with the corresponding period last year. A net gain from
change in fair value of financial assets also lifted the result,
while share of profit from associates was stable.
Total comprehensive income to owners of the parent was
USD 125 million in the first half.
USD mill
- unless otherwise indicated Q2'19 Q1'19
Q-on-Q
Change Q2'18
Y-o-Y
Change
01.01-
30.06.19
01.01-
30.06.18
Y-o-Y
Change
Total income 208 199 5 % 222 -6 % 406 433 -6 %
- of which operating revenue 200 192 4 % 219 -9 % 392 429 -9 %
- of which gain/(loss) on sale of assets 8 7 20 % 3 147 % 14 4 230 %
EBITDA 42 34 25 % 0 >500% 75 16 377 %
Operating profit/EBIT 25 17 50 % -9 neg. 42 -4 neg.
Share of profit from associates 3 15 -77 % 11 -68 % 19 17 10 %
Change in fair value financial assets 99 -3 -241 96 -117
Other financial income/(expenses) -7 8 -30 1 -18
Profit/(loss) before tax/EBT 120 37 225 % -269 neg. 157 -122 neg.
Tax income/(expenses) 2 -6 3 -4 -1
Profit/(loss) for the period 123 31 296 % -266 neg. 154 -123 neg.
Profit/(loss) to owners of the parent 89 29 207 % -201 neg. 118 -99 neg.
EPS (USD) 1,92 0,63 207 % -4,32 neg. 2,55 -2,14 neg.
Other comprehensive income 2 5 -41 7 -10
Total comprehensive income 125 36 252 % -307 neg. 160 -133 neg.
Total comprehensive income owners of parent 91 33 175 % -239 neg. 125 -110 neg.
Total assets 3 390 3 276 3 % 3 136 8 % 3 390 3 136 8 %
Equity parent 1 936 1 853 4 % 1 845 5 % 1 936 1 845 5 %
Total equity 2 159 2 051 5 % 2 027 7 % 2 159 2 027 7 %
Equity ratio 64 % 63 % 1 % 65 % -1 % 64 % 65 % -1 %
USD mill
Cash and
cash equiv.
Current
financial
investm.
Total
interest
bearing
debt
Net
interest
bearing
debt
Maritime services 94 0 251 157
Supply services 11 0 421 409
Holding and investments 44 102 60 -87
Elimination 0 0 -20 -20
Wilhelmsen group 150 103 712 460
Wilh. Wilhelmsen Holding group Q2 2019 unaudited 3 of 28

Segment information
Maritime services The maritime services segment includes ships service, ship management and other maritime services activities.
Result for the quarter Total income from maritime services was USD 146 million
in the second quarter. This was up 2% from the previous
quarter, but a 1% reduction when compared with the
corresponding period last year. Income for the quarter
included a USD 6 million gain from sale of a ship
management property.
EBITDA was USD 29 million. Adjusting for the office
sales gain, EBITDA was up 13% from the previous quarter.
EBITDA adjusted for non-recurring items also increased
when compared with the corresponding period last year.
Total financial items, including share of profit from
associates and change in fair value financial assets, were a
net expense of USD 31 million. Of this, USD 27 million
was from reduction in the fair value of the investment in
Survitec Group.
The quarter ended with a net loss after non-controlling
interests of USD 5 million.
Ships service Wilhelmsen Ships Service is a global provider of standardised product brands and service solutions to the maritime industry, focusing on marine products, marine chemicals, maritime logistics and ships agency. Ships service is fully owned by Wilhelmsen.
Total income for ships service was down 3% from the first
quarter, mainly due to a seasonal reduction in non-marine
sale. Income from agency services improved. When
compared with the corresponding period last year, income
was down 6% following reduced marine product sales.
EBITDA was up from the first quarter, supported by
improved operating margin for all marine activities.
Ship management Wilhelmsen Ship Management provides full technical management, crewing and related services for all major vessel types. Ship management is fully owned by Wilhelmsen.
Total income for ship management was lifted by an
increase in ships on full technical management and a sales
gain. Adjusting for the sales gain, income was up 7% from
the previous quarter and up 9% from the corresponding
period last year.
EBITDA was up for the quarter, reflecting increased
operating activity and the sales gain.
Other maritime services activities This includes Wilhelmsen Insurance Services (fully owned by Wilhelmsen), Survitec Group (owned ~20%) and certain corporate activites. Survitec Group is reported as financial assets.
By the end of the quarter, the investment in Survitec Group
was included with a fair value of nil. This was a reduction
of USD 27 million when compared with the fair value at
the end of the previous quarter. The reduction in fair value
is based on a review of the present capital structure of the
company.
Wilhelmsen Insurance Services had a stable performance,
with total income and EBITDA in line with previous
quarters.
USD mill
- unless otherwise indicated Q2'19 Q1'19
Q-on-Q
Change Q2'18
Y-o-Y
Change
01.01-
30.06.19
01.01-
30.06.18
Y-o-Y
Change
Total income 146 144 2 % 148 -1 % 290 299 -3 %
- Ships service 130 133 -3 % 138 -6 % 263 278 -5 %
- Ship management 16 10 62 % 10 65 % 26 20 30 %
- Other/eliminations 0 0 0 1 1
EBITDA 29 20 40 % -9 neg. 49 3 >100%
- EBITDA margin (%) 20 % 14 % -6 % 17 % 1 %
Operating profit/EBIT 22 14 60 % -13 neg. 36 -5 neg.
- EBIT margin (%) 15 % 10 % -9 % 12 % -2 %
Share of profit from associates 1 1 -23 % 1 -15 % 2 2 5 %
Change in fair value financial assets -27 0 -5 -27 -2 neg.
Other financial income/(expenses) -4 -6 -19 -10 -18
Tax income/(expense) 4 -4 4 0 1
Profit/(loss) -5 6 neg. -33 neg. 1 -22 neg.
- Profit margin (%) -4 % 4 % -22 % 0 % -7 %
- Non controlling interest 0 0 1 1 1
Profit/(loss) to owners of the parent -5 6 neg. -34 neg. 0 -23 neg.
Wilh. Wilhelmsen Holding group Q2 2019 unaudited 4 of 28

Segment information
Supply services The supply services segment includes NorSea Group, WilNor Governmental Services and other supply services activities.
Result for the quarter Total income from supply services was USD 60 million in
the second quarter. This was up 10% from the previous
quarter, but down 18% when compared with the
corresponding period last year.
EBITDA was USD 14 million, down 16% from the first
quarter. Adjusting for a sales gain lifting result in the first
quarter, EBITDA was up 33%. Compared with the
corresponding period last year, EBITDA was relatively
stable when adjusting for effects from implementation of
IFRS 16 and last year sales gain.
Share of profit from associates was USD 2 million in the
second quarter. This was down from the first quarter and
the corresponding period last year, which both included a
gain from sale of assets. Other financial expenses were
USD 4 million for the quarter.
Net profit after minority interests was USD 2 million for
the quarter.
NorSea Group NorSea Group provides supply bases and integrated logistics solution to the offshore industry. Wilhelmsen owns ~75,2% of NorSea Group.
Total income for NorSea Group was USD 59 million in
the second quarter. Adjusting for sales gains, income was
up 25% from the first quarter. Operating income
benefitted from a strong increase in activity level at
Norwegian supply bases, reflecting a traditionally
stronger summer season. Compared with the
corresponding period last year, income was down due to
less project related activities.
EBITDA followed development in total income, with a
seasonal increase in contribution from supply base
activities offset by lack of any sales gain when compared
with the first quarter.
Other supply services activities This includes WilNor Governmental Services (owned 51% directly and 49% through NorSea Group) and certain minor supply services activities.
Income continued at a low level, with no material project
activity taking place during the quarter.
USD mill
- unless otherwise indicated Q2'19 Q1'19
Q-on-Q
Change Q2'18
Y-o-Y
Change
01.01-
30.06.19
01.01-
30.06.18
Y-o-Y
Change
Total income 60 54 10 % 73 -18 % 114 132 -14 %
- NorSea Group 59 54 11 % 70 -15 % 113 126 -10 %
- Other/eliminations 1 1 -8 % 3 -83 % 1 7 -83 %
EBITDA 14 17 -16 % 14 3 % 32 20 55 %
- EBITDA margin (%) 24 % 32 % 19 % 28 % 15 %
Operating profit/EBIT 6 8 -31 % 9 -34 % 14 9 54 %
- EBIT margin (%) 10 % 15 % 12 % 12 % 7 %
Share of profit from associates 2 6 -67 % 4 -52 % 8 5 44 %
Other financial income/(expenses) -4 -5 -4 -9 -8
Tax income/(expense) -1 -1 -1 -2 -2
Profit/(loss) 3 8 -68 % 8 -66 % 11 5 >100%
- Profit margin (%) 4 % 15 % 11 % 10 % 4 %
- Non controlling interest 1 2 3 3 2
Profit/(loss) to owners of the parent 2 6 -70 % 5 -64 % 8 4 >100%
Wilh. Wilhelmsen Holding group Q2 2019 unaudited 5 of 28

Segment information
Holding and investments The holding and investments segment includes investments in Wallenius Wilhelmsen ASA and Treasure ASA, financial
assets, and other holding and investments activities.
Result for the quarter
The holding and investments segment reported a profit of
USD 93 million in the second quarter. The positive result
followed a significant gain from change in fair value of
Hyundai Glovis. Other investments also contributed
positively, while share of profit from Wallenius
Wilhelmsen ASA was USD 1 million for the quarter.
Wallenius Wilhelmsen ASA Wallenius Wilhelmsen ASA is a global provider of ocean and land-based logistics services towards car and ro-ro customers, and is listed on Oslo Børs. Wilhelmsen owns ~37,8% of the company, which is reported as associate in Wilhelmsen’s accounts.
Total income for Wallenius Wilhelmsen ASA was USD
1 005 million in the second quarter, 1% down from the
first quarter and down 4% from the corresponding period
last year. The decrease from second quarter 2018 was
driven by a 8% decline in ocean volumes, in part due to
commercial priorities and in part by weaker auto markets.
For land-based operations, income was up 6% from last
year.
EBITDA was USD 211 million. This was down 3% from
the first quarter, but up approximately 10% from the
corresponding period last year when adjusting for the
IFRS 16 effect. The improvement from last year was
driven by higher net freight/CBM, more efficient
operations and lower net bunker cost within the ocean
segment. The landbased segment delivered overall stable
performance.
Net financial expenses were negatively impacted by
unrealised interest rate derivatives.
Wallenius Wilhelmsen ASA reported a net profit of USD
3 million for the quarter.
Wilhelmsen’s share of profit was USD 1 million in the
second quarter.
Treasure ASA Treasure ASA holds a 12.04% ownership interest in Hyundai Glovis, and is listed on Oslo Børs. Wilhelmsen owns ~73,5% of Treasure ASA.
Change in fair value of the shareholding in Hyundai
Glovis was positive with USD 119 million for the quarter.
The market value of the investment in Hyundai Glovis
was USD 629 million at the end of the second quarter.
The 13 March annual general meeting in Treasure ASA
approved the liquidation of 2.2 million own shares,
reducing outstanding shares to 217.8 million. The
liquidation was formally completed on 21 June.
Wilhelmsen has maintained a holding of 160 million
shares in Treasure ASA, increasing the ownership to
73.5%.
Financial investments Financial investments include cash and cash equivalents, current financial investments and other financial assets held by the parent and fully owned subsidiaries.
Change in fair value of the shareholdings in Qube Holdings
and other non-current financial assets were a gain of USD
7 million for the quarter. During the quarter, Wilhelmsen
reduced the investment in Qube Holdings from 50 to 40
million shares. Wilhelmsen also made several minor non-
current financial investments at a total value of USD 7
USD mill
- unless otherwise indicated Q2'19 Q1'19
Q-on-Q
Change Q2'18
Y-o-Y
Change
01.01-
30.06.19
01.01-
30.06.18
Y-o-Y
Change
Total income 3 2 38 % 3 8 % 5 6 -6 %
- Operating revenue 3 2 38 % 3 8 % 5 6 -6 %
- Gain on sale of assets 0 0 0 0 0
EBITDA -1 -4 -4 -5 -8
Operating profit/EBIT -3 -5 -4 -8 -8
Share of profit from associates 1 8 -92 % 6 -89 % 9 10 -9 %
- Wallenius Wilhelmsen ASA 1 8 -94 % 6 -91 % 9 10 -7 %
- Other/eliminations 0 0 0 0 0
Change in fair value financial assets 126 -3 -236 123 -115
- Hyundai Glovis 119 -12 -250 106 -107
- Qube Holdings/other financial assets 7 9 15 16 -8
Other financial income/(expenses) 1 18 -92 % -7 neg. 20 7 171 %
- Investment management (Holding) 2 6 -2 8 -2
- Hyundai Glovis 0 13 0 13 12
- Qube Holdings/other financial assets 1 1 0 2 1
- Other financial income/(expense) -1 -2 -5 -3 -4
Tax income/(expense) 0 -1 0 -2 0
Profit/(loss) for the period 125 17 -241 142 -106
- Non controlling interest 32 0 -68 32 -26
Profit/(loss) to owners of the parent 93 17 -172 110 -80
Wilh. Wilhelmsen Holding group Q2 2019 unaudited 6 of 28

million in the second quarter. Financial assets to fair value
reported under the holding and investments segment was
USD 105 million at the end of the second quarter
(excluding Hyundai Glovis).
The current financial investment portfolio was USD 102
million by the end of the first quarter. The portfolio
primarily included listed equities and investment-grade
bonds. Net income from investment management was a
gain of USD 2 million for the quarter.
Other holding and investments activities Holding/other activities include general holding activities and certain non-financial investments, including Dolittle AS (50% owned), Massterly AS (50%) and Raa Labs AS (50%).
Underlying income and EBITDA were broadly at normal
levels.
Risk update
The Wilhelmsen group consists of operating companies
and investments exposed to the global economy and world
merchandised trade. The main risks as considered by the
board at that time are described in the annual report for
2018. While risk in general remains as described in the
annual report, certain individual risk factors have been
impacted by events which have taken place after
completion of the annual report. This includes global trade
and investment values.
Implementation of new tariffs and further escalation of
trade tensions have had a negative impact on global trade.
In the first half, automotive sales have fallen in main
markets.
For listed investments, the share price of Wallenius
Wilhelmsen ASA has traded down, while the share prices
for most other investments have remained stable or
increased. A change in market prices for these investments
impacts the value adjusted equity of Wilhelmsen.
Outlook
Maritime services The first half year saw a modest increase in underlying
operating results, supported by a gradual improvement in
operating margin. This development is expected to
continue into the second half of the year.
Supply services Seasonality will continue to impact operating income and
results, with a gradual reduction in offshore activities
towards the end of the year.
Holding and investments Wallenius Wilhelmsen maintains a balanced view on their
prospects. There is uncertainty around the volume
outlook, while the two-year performance improvement
program will continue to support profitability going
forward.
Wilhelmsen group
The board expects a stable development of underlying
operating performance for the combined group activities,
but with normal seasonal variations.
Wilhelmsen is exposed towards global trade. Potential
introduction of further tariffs and restrictions continues to
create uncertainties. Wilhelmsen retains its robustness to
meet such eventualities.
Wilh. Wilhelmsen Holding group Q2 2019 unaudited 7 of 28

Lysaker, 22 August 2019
The board of directors of Wilh. Wilhelmsen Holding ASA Forward-looking statements presented in this report are based on various assumptions. These assumptions were reasonable when made, but as assumptions are inherently subject to uncertainties and contingencies which are difficult or impossible to predict. Wilhelmsen cannot give assurances
that expectations regarding the outlook will be achieved or accomplished.
Wilh. Wilhelmsen Holding group Q2 2019 unaudited 8 of 28

USD mill Note Q2 Q2 YTD YTD Full year
2019 2018 2019 2018 2018
Operating revenue 200 219 392 429 867
Gain/(loss) on sale of assets 8 3 14 4 4
Total income 208 222 406 433 871
Operating expenses
Cost of goods and change in inventory (58) (64) (114) (131) (267)
Employee benefits (73) (82) (148) (165) (320)
Other expenses (35) (76) (69) (122) (206)
Operating profit before depreciation and amortisation 42 0 75 16 78
Depreciation and impairments 6 (17) (10) (34) (20) (42)
Operating profit 25 (9) 42 (4) 36
Share of profit from joint ventures and associates 4 3 11 19 17 36
Change in fair value financial assets 8 99 (241) 96 (117) (116)
Other financial income/(expenses) 9 (7) (30) 1 (18) (41)
Profit/(loss) before tax 120 (269) 157 (122) (86)
Tax income/(expenses) 2 3 (4) (1) 12
Profit/(loss) for the period 123 (266) 154 (123) (75)
Attributable to: non-controlling interests 33 (65) 35 (24) (6)
owners of the parent 89 (201) 118 (99) (69)
Basic earnings per share (USD) 7 1,92 (4,32) 2,55 (2,14) (1,48)
Q2 Q2 YTD YTD Full year
USD mill 2019 2018 2019 2018 2018
Profit/(loss) for the period 123 (266) 154 (123) (75)
Items that may be reclassified to income statement
Cash flow hedges (net after tax) (0) 2 2
Comprehensive income from associates (0) 1
Currency translation differences 3 (41) 6 (12) (57)
Items that will not be reclassified to income statement
Remeasurement pension liabilities, net of tax - 1
Other comprehensive income, net of tax 2 (41) 7 (10) (53)
Total comprehensive income for the period 125 (307) 161 (133) (128)
Total comprehensive income attributable to:
Owners of the parent 91 (239) 125 (110) (119)
Non-controlling interests 33 (67) 36 (23) (9)
Total comprehensive income for the period 125 (307) 161 (133) (128)
The above consolidated income statement should be read in conjunction with the accompanying notes.
Income statement - financial report
Comprehensive income - financial report
Wilh. Wilhelmsen Holding group Q2 2019 unaudited 9 of 28

USD mill Note 30.06.2019 30.06.2018 31.12.2018
Deferred tax asset 5 59 26 54
Goodwill and other intangible assets 6 155 171 156
Vessels, property and other tangible assets 6 787 574 567
Investments in joint ventures and associates 4 991 1 018 1 018
Financial assets to fair value 8 734 650 650
Other non current assets 20 23 23
Total non current assets 2 748 2 460 2 467
Inventory 75 77 74
Current financial investments 103 91 88
Other current assets 315 331 311
Cash and cash equivalents 150 176 140
Total current assets 642 676 612
Total assets 3 390 3 136 3 079
Paid-in capital 7 122 122 122
Retained earnings 7/10 1 814 1 724 1 699
Attributable to equity holders of the parent 1 936 1 845 1 821
Non-controlling interests 224 182 196
Total equity 2 159 2 027 2 017
Pension liabilities 21 23 20
Deferred tax 5 12 9 12
Non-current interest-bearing debt 11 636 489 448
Other non-current liabilities 110 113 100
Total non current liabilities 779 635 580
Current income tax 11 4 13
Public duties payable 8 9 9
Current interest-bearing debt 11 76 102 85
Other current liabilities 356 359 375
Total current liabilities 452 474 483
Total equity and liabilities 3 390 3 136 3 079
The above consolidated balance sheet should be read in conjunction with the accompanying notes.
Balance sheet - financial report
Wilh. Wilhelmsen Holding group Q2 2019 unaudited 10 of 28

USD mill Q2 Q2 YTD YTD Full year
Note 2019 2018 2019 2018 2018
Cash flow from operating activities
Profit/(loss) before tax 120 (269) 157 (122) (86)
Share of profit from joint ventures and associates (3) (11) (19) (17) (36)
Change in fair value financial assets 8 (99) 242 (96) 117 116
Other financial (income)/expenses 7 29 (1) 18 41
Depreciation/impairment 6 17 10 34 42
(Gain)/loss on sale of fixed assets 6 (11) (5) (8) 20 (4)
(Gain)/loss from sale of subsidiaries, joint ventures and associates - - (6) (4) -
Change in net pension asset/liability 1 2 0 (1)
Change in inventory (2) 0 (1) 4 7
Change in other working capital (36) (29) (40) (28) (6)
Tax paid (company income tax, withholding tax) (3) (2) (6) (5) (12)
Net cash provided by operating activities (10) (34) 15 (17) 62
Cash flow from investing activities
Dividend received from joint ventures and associates 14 16 20 18 20
Proceeds from sale of fixed assets 6 8 14 8 14 14
Investments in fixed assets 6 (9) (10) (18) (18) (54)
Net proceeds from sale of subsidiaries (0) 7 3 7 7
Net proceeds from sale of joint ventures and associates - 34 -
Cash discontinued operations (1)
Investments in subsidaries, joint ventures and associates (2) (2) (1)
Repayments of loan from joint ventures and associates - 17 - 17 17
Proceeds from sale of financial investments 47 53 156 62 71
Current financial investments (25) (14) (138) (21) (38)
Interest received 0 3 1 3 4
Net cash flow from investing activities 34 86 65 81 40
Cash flow from financing activities
Proceeds from issue of debt 50 62 59 72 153
Repayment of debt (57) (77) (112) (86) (211)
Interest paid including interest derivatives (13) (8) (20) (15) (29)
Dividend to shareholders/purchase of own shares (17) (26) (17) (26) (40)
Net cash flow from financing activities (36) (48) (90) (54) (128)
Net increase in cash and cash equivalents * (12) 4 (10) 9 (26)
Cash and cash equivalents at the beg. of the period * 162 171 140 166 167
Cash and cash equivalents at the end of the period * 150 176 129 176 140
The above consolidated statement of cash flows should be read in conjunction with the accompanying notes.
Cash flow statement - financial report
*The group is located and operating world wide, and every entity has several bank accounts in different currencies. Unrealised currency effects are included in net cash provided by operating
activities.
Wilh. Wilhelmsen Holding group Q2 2019 unaudited 11 of 28

Statement of changes in equity - Year to date
USD mill Share capital
Retained
earnings Total
Non-
controlling
interests Total equity
Balance at 31.12.2018 122 1 699 1 821 196 2 017
Implementation of IFRS 16 leasing (0) (0) (0) (0)
Profit for the period 118 118 35 154
Other comprehensive income 7 7 0 7
Change in non-controlling interests* 5 5 (5) (0)
Buy own shares Treasure Group* (1) (1) (1)
Paid dividends to shareholders (13) (13) (4) (17)
Balance 30.06.2019 122 1 814 1 936 224 2 159
*Liquidation of 2.200.000 own shares in Treasure Group.
Balance at 31.12.2017 122 1 853 1 975 212 2 188
Profit for the period (99) (99) (24) (123)
Other comprehensive income (10) (10) 1 (10)
Change in non-controlling interests (2) (2)
Paid dividends to shareholders (20) (20) (5) (26)
Balance 30.06.2018 122 1 724 1 845 182 2 027
Statement of changes in equity - Full year 2018
USD mill Share capital
Retained
earnings Total
Non-
controlling
interests Total equity
Balance at 31.12.2017 122 1 853 1 975 212 2 188
Profit for the period (69) (69) (6) (75)
Other comprehensive income (50) (50) (3) (53)
Change in non-controlling interests - (1) (1)
Put option in associate (5) (5) (5)
Paid dividends to shareholders (31) (31) (6) (37)
Balance 31.12.2018 122 1 699 1 821 196 2 017
Statement of changes in equity - financial report
Wilh. Wilhelmsen Holding group Q2 2019 unaudited 12 of 28

Note 1 - Accounting principles
Note 2 - Significant acquisitions and disposals
2019
2018
Notes - financial report
General informationThis consolidated interim financial report has been prepared in accordance with International Accounting Standards (IAS 34), "interim financial reporting". The consolidated interim financial reporting should be read in conjunction with the annual financial statements for the year end 31 December 2018 for Wilh.Wilhelmsen Holding ASA group (WWI), which has been prepared in accordance with IFRS's endorsed by the EU.
Changes in accounting policies – implementation of IFRS 16 LeasesIFRS 16 Leases replaces IAS 17 Leases that relate to the recognition, of leases and related disclosures. The adoption of IFRS 16 Leases from 1 January 2019 resulted in significant changes to the group's accounting for leases previously defined as operating leases under IAS 17.
In accordance with the implementation of IFRS 16, leases are recognized as a right-of-use asset and a corresponding liability at the date at which the leased asset is available for use by the group. Each lease payment is allocated between the liability and finance cost. The right-of-use asset is depreciated over the shorter of the asset's useful life and the lease term is on a straight-line basis.
Assets and liabilities arising from a lease are initially measured on a present value basis. Lease liabilities include the net present value of the following lease payments:
- fixed payments (including in-substance fixed payments), less any lease incentives receivable
- variable lease payment that are based on an index or a rate
- amounts expected to be payable by the lessee under residual value guarantees
- the exercise price of a purchase option if the lessee is reasonably certain to exercise that option, and
- payments of penalties for terminating the lease, if the lease term reflects the lessee exercising that option.
The lease payments are discounted using the interest rate implicit in the lease, if that rate can be determined, or the lessee’s incremental borrowing rate.
Right-of-use assets are measured at cost comprising the following:-the amount of the initial measurement of lease liability
- any lease payments made at or before the commencement date less any lease incentives received
- any initial direct costs, and
- restoration costs.
Payments associated with short-term leases and leases of low-value assets are recognized on a straight-line basis as an expense in the income statement. Short-term leases are leases with a lease term of 12 months or less.
Use of judgements and estimates
In preparing these interim financial statements, management has made judgements and estimates that affect the application of accounting policies and the reported amounts of assets and liabilities, income and expense. Actual results may differ from these estimates. The effect of a change in an accounting estimate is recognised in the income statement in the period where the estimate is revised or in the period of the revision and future periods if the change affects both. The significant judgements made by management in applying the group’s accounting policies and the key sources of estimation uncertainty were the same as those described in the last annual financial statements, except for the critical judgements in determining the lease term following the implementation of IFRS 16.
Critical judgements in determining the lease term.
From 1 January 2019 the group has implemented the new leasing standard IFRS 16. For all leases, except for short-term leases and leases of low value, a lease liability and a corresponding right-of-use asset is recognised in the balancesheet.
In determining the lease term, management considers all facts and circumstances that create an economic incentive to exercise an extension option, or not to exercise a termination option. Extension options (or periods after termination options) are only included in the lease term if the lease is reasonably certain to be extended (or not terminated).
Basic policiesThe accounting policies implemented are consistent with those of the annual financial statements for WWI for the year end 31 December 2018.
RoundingsAs a result of rounding adjustments, the figures in one or more columns may not add up to the total of that column.
No material disposal or acquistion.
No material disposal or acquistion.
Wilh. Wilhelmsen Holding group Q2 2019 unaudited 13 of 28

Note 3 - Segment reporting: Income statement per operating segments
USD mill
QuarterQ2
2019
Q2
2018
Q2
2019
Q2
2018
Q2
2019
Q2
2018
Q2
2019
Q2
2018
Q2
2019
Q2
2018
Operating revenue 138 147 60 71 3 3 (2) (2) 200 219
Gain on sale of assets 8 1 (0) 2 - - - - 8 3
Total income 146 148 60 73 3 3 (2) (2) 208 222
Operating expenses
Cost of goods and change in inventory (44) (48) (13) (15) (0) (0) - - (58) (64)
Employee benefits (49) (55) (22) (24) (2) (4) 0 0 (73) (82)
Other expenses (25) (54) (10) (20) (2) (3) 1 2 (35) (76)
Operating profit/(loss) before depreciation
and amortisation 29 (9) 14 14 (1) (4) (0) (0) 42 0
Depreciation and impairments (7) (4) (9) (5) (1) (0) - - (17) (10)
Operating profit/(loss) 22 (13) 6 9 (3) (4) (0) (0) 25 (9)
Share of profit from associates 1 1 2 4 1 6 - - 3 11
Change in fair value financial assets (27) (5) - - 126 (236) - - 99 (241)
Other financial income/(expenses) (4) (19) (4) (4) 1 (7) - - (7) (30)
Profit/(loss) before tax (9) (37) 3 9 125 (241) (0) (0) 120 (269)
Tax income/(expense) 4 4 (1) (1) (0) 0 - - 2 3
Profit/(loss) for the period (5) (33) 3 8 125 (241) (0) (0) 123 (266)
Non-controlling interests 0 1 1 3 32 (68) - - 33 (65)
Profit/(loss) to the owners of parent (5) (34) 2 5 93 (172) (0) (0) 89 (201)
Implementation of IFRS 16 leasing
Operating expenses 2,9 4,5 1,3 - 8,8
Depreciation (3,5) (3,7) (0,6) - (7,8)
Financial expenses (0,8) (1,7) (0,4) - (3,0)
Net effects of IFRS 16 for the quarter (1,4) (0,9) 0,3 0,0 (2,0)
Notes - financial report
The income statement Q2 per segment is including IFRS 16 effects.
Maritime
Services
Supply
Services
Holding &
Investments Eliminations
WWH group
total
Wilh. Wilhelmsen Holding group Q2 2019 unaudited 14 of 28

Cont. Note 3 - Segment reporting: Income statement per operating segments
USD mill
YTD
YTD
2019 YTD 2018
Full year
2018
YTD
2019 YTD 2018
Full year
2018
YTD
2019 YTD 2018
Full year
2018
YTD
2019 YTD 2018
Full year
2018 YTD 2019
YTD
2018
Full year
2018
Operating revenue 282 297 580 108 130 283 5 6 11 (3) (3) (7) 392 429 867
Gain on sale of assets 8 2 2 6 2 3 - - 0 - - - 14 4 4
Total income 290 299 582 114 132 285 5 6 11 (3) (3) (7) 406 433 871
Operating expenses
Cost of goods and change in inventory (91) (103) (198) (23) (27) (68) (0) (1) (1) - - - (114) (131) (267)
Employee benefits (100) (110) (212) (42) (47) (96) (7) (7) (13) 0 0 0 (148) (165) (320)
Other expenses (51) (81) (130) (18) (38) (71) (3) (6) (12) 3 3 6 (69) (122) (206)
Operating profit before depreciation and
amortisation 49 3 42 32 20 51 (5) (8) (14) (0) (0) (0) 75 16 78
Depreciation and impairments (13) (8) (16) (18) (11) (26) (3) (0) (1) - - - (34) (20) (42)
Operating profit 36 (5) 26 14 9 25 (8) (8) (15) (0) (0) (0) 42 (4) 36
Share of profit from associates 2 2 4 8 5 9 9 10 23 - - - 19 17 36
Changes in fair value financial assets (27) (2) (61) - - - 123 (115) (56) - - - 96 (117) (116)
Net finance income / expenses (10) (18) (37) (9) (8) (15) 20 7 10 - - - 1 (18) (41)
Profit/(loss) before tax 1 (23) (68) 13 7 20 143 (106) (38) (0) (0) (0) 157 (122) (86)
Tax income/(expense) (0) 1 13 (2) (2) (4) (2) 0 3 - - - (4) (1) 12
Profit/(loss) for the period 1 (22) (55) 11 5 15 142 (106) (35) (0) (0) (0) 154 (123) (75)
Non-controlling interests 1 1 2 3 2 4 32 (26) (12) - - - 35 (24) (6)
Profit/(loss) to the owners of parent 0 (23) (56) 8 4 11 110 (80) (23) (0) (0) (0) 118 (99) (69)
Implementation of IFRS 16 leasing
Operating expenses 6,0 9,1 2,6 - 17,7
Depreciation (6,3) (7,5) (1,8) - (15,5)
Financial expenses (1,5) (3,5) (1,0) - (6,0)
Net effects of IFRS 16 YTD (1,8) (1,9) (0,2) 0,0 (3,9)
Maritime Services
Holding &
Investments Eliminations WWH group total
Notes - financial report
Supply Services
Wilh. Wilhelmsen Holding group Q2 2019 unaudited 15 of 28

Cont note 3 - Segment reporting: Balance sheet per operating segments
USD mill
Year to date
30.06
2019
30.06
2018
30.06
2019
30.06
2018
30.06
2019
30.06
2018
30.06
2019
30.06
2018
30.06
2019
30.06
2018
Assets
Deferred tax asset 49 19 3 3 8 5 - - 59 26
Intangible assets 149 161 6 10 0 0 - - 155 171
Tangible assets* 240 183 500 388 53 2 (6) - 787 574
Investments in joint ventures and associates 10 12 133 166 848 840 - - 991 1 018
Financial assets to fair value 0 80 0 734 569 (0) - 734 650
Other non current assets 13 13 5 7 16 24 (14) (21) 20 23
Current financial investments 0 0 - - 102 91 - - 103 91
Other current assets 311 331 76 80 4 8 (2) (9) 390 409
Cash and cash equivalents 94 112 11 9 44 54 - - 150 176
Total assets 867 911 734 662 1 811 1 592 (22) (29) 3 390 3 136
Equity and liabilities
Equity majority 202 300 161 156 1 573 1 389 0 - 1 936 1 845
Equity non-controlling interest (1) - 56 54 169 129 - - 224 182
Deferred tax 12 9 - - (0) (0) - - 12 9
Interest-bearing debt** 251 201 421 353 60 55 (20) (18) 712 591
Other non current liabilities 104 111 22 18 5 10 (0) (2) 131 137
Other current liabilities 299 289 75 81 4 10 (2) (9) 375 372
Total equity and liabilities 867 911 734 662 1 811 1 592 (22) (29) 3 390 3 136
IFRS16 leasing
47 119 52 218
47 119 52 218
Holding &
Investments Eliminations Total
*Right of use (included in tangible assets)
**Leasing debt (included in interest-bearing debt)
Notes - financial report
Maritime Services Supply Services
Wilh. Wilhelmsen Holding group Q2 2019 unaudited 16 of 28

Notes - financial report
Cont note 3 - Segment reporting: Cash flow per segment
USD mill
Quarter Q2 2019 Q2 2018 Q2 2019 Q2 2018 Q2 2019 Q2 2018
Profit before tax (9) (37) 3 9 126 (241)
Change in fair value financial assets 27 5 - (126) 236
Share of profit from joint ventures and associates (1) (1) (2) (4) (1) (6)
Other financial (income)/expenses 5 19 4 4 (1) 6
Depreciation/impairment 7 4 9 5 1 0
Change in working capital (29) (9) (5) (12) 0 0
Net (gain)/loss from sale of subsidiaries and fixed assets (7) (1) 0 (2) - -
Net cash provided by operating activities (6) (20) 10 0 (1) (4)
Dividend received from joint ventures and associates 2 2 3 14 6 -
Net sale/(investments) in fixed assets 4 (2) (7) (1) - -
Net investments in subsidaries 7
Net sale/(investments) in joint ventures and associates 1 17 7 (3) (3)
Current financial investments 0 2 0 23 39
Net cash flow from investing activities 6 19 (4) 20 32 36
Net change of debt (2) 5 7 (11) (14) (6)
Net change in other financial items (6) (4) (3) (4) 0 (1)
Net dividend from other segments/ to shareholders (36) (32) (4) (6) 9 12
Net cash flow from financing activities (44) (30) 0 (21) (5) 4
Net increase in cash and cash equivalents (43) (31) 6 (0) 26 36
Cash and cash equivalents at the beg.of the period 137 143 6 10 19 18
Cash and cash equivalents at the end of period 94 112 11 9 45 54
Maritime Services Supply Services Holding & Investments
Wilh. Wilhelmsen Holding group Q2 2019 unaudited 17 of 28

Note 4 - Investment in joint ventures and associatesJoint ventures and associates at end June 2019 are:
USD mill
30.06.2019 30.06.2018
Holding and Investments segment: Ownership Booked value Booked value
Wallenius Wilhelmsen ASA 37.8% 845 839
Other 50 % 3 1
Maritime services segment:
Associates 20 - 50% 10 12
Supply services segment:
Joint venture
Coast Center Base 50 % 103 104
Vikan Næringspark Invest AS 50 % 17 16
Other 50 % 1 0
Associates
Risavika Havn AS 42.8% 0 30
Risavika Eiendom AS 42 % 7 9
Hammerfest Næringsinvest AS 32 % 1 2
Other 33 - 49% 3 6
Total investment in joint ventures and associates 991 1 018
Share of profit from joint ventures and associates Q2 2019 Q2 2018 YTD 2019 YTD 2018
Wallenius Wilhelmsen ASA 1 6 9 10
Other joint ventures and associates in Holding and Investments 0 0
Joint ventures and associates in Supply Services 2 4 8 5
Associates in Maritime Services 1 1 2 2
Share of profit from joint ventures and associates 3 11 19 17
Note 5 - Tax
Notes - financial report
The effective tax rate for the group will, from period to period, change dependent on the group gains and losses from investments inside the exemption method.
Wilh. Wilhelmsen Holding group Q2 2019 unaudited 18 of 28

Note 6 - Tangible and intangible assets
USD mill Vessels Property
Other tangible
assets
Intangible
assets
Total tangible
and intangible
assets
2019 - Year to date
Cost 1.1 35 550 251 225 1 061
Acquisition 0 10 8 (0) 18
Reclass/disposal - (2) (10) (0) (12)
Currency translation differences 1 8 2 4 15
Cost 30.06 36 566 252 228 1 082
Accumulated depreciation and impairment losses 1.1 (18) (162) (89) (68) (337)
Depreciation/amortisation (1) (9) (5) (3) (18)
Reclass/disposal - 3 2 0 5
Currency translation differences (0) (2) (1) (1) (5)
(19) (170) (93) (73) (355)
Carrying amounts 30.06 17 397 158 155 727
2019 Lease assets Right of use - Year to date
Implementation IFRS 16 - 210 12 222
Additional - 2 0 2
Reclass/disposal - 6 (0) 6
Currency translation differences - 2 0 2
Cost 30.06 - 219 12 231
Accumulated depreciation and impairment losses 1.1 - - - -
Depreciation/amortisation - (14) (2) (16)
- (14) (2) - (16)
Carrying amounts 30.06 - 205 10 - 215
USD mill
2018 - Year to date
Cost 1.1 36 575 269 243 1 123
Acquisition - 8 8 3 19
Reclass/disposal - (18) (29) (10) (57)
Currency translation differences (3) (3) 0 (5)
Cost 30.06 36 563 245 236 1 080
Accumulated depreciation and impairment losses 1.1 (17) (159) (114) (71) (362)
Depreciation/amortisation (1) (10) (6) (4) (20)
Reclass/disposal - 1 - 10 43
Currency translation differences (0) 2 1 (0) 2
(18) (166) (119) (65) (336)
Carrying amounts 30.06 19 397 125 171 744
Notes - financial report
Accumulated depreciation and impairment losses 30.06
Accumulated depreciation and impairment losses 30.06
Accumulated depreciation and impairment losses 30.06
Vessels Property
Other tangible
assets
Intangible
assets
Total tangible
and intangible
assets
Wilh. Wilhelmsen Holding group Q2 2019 unaudited 19 of 28
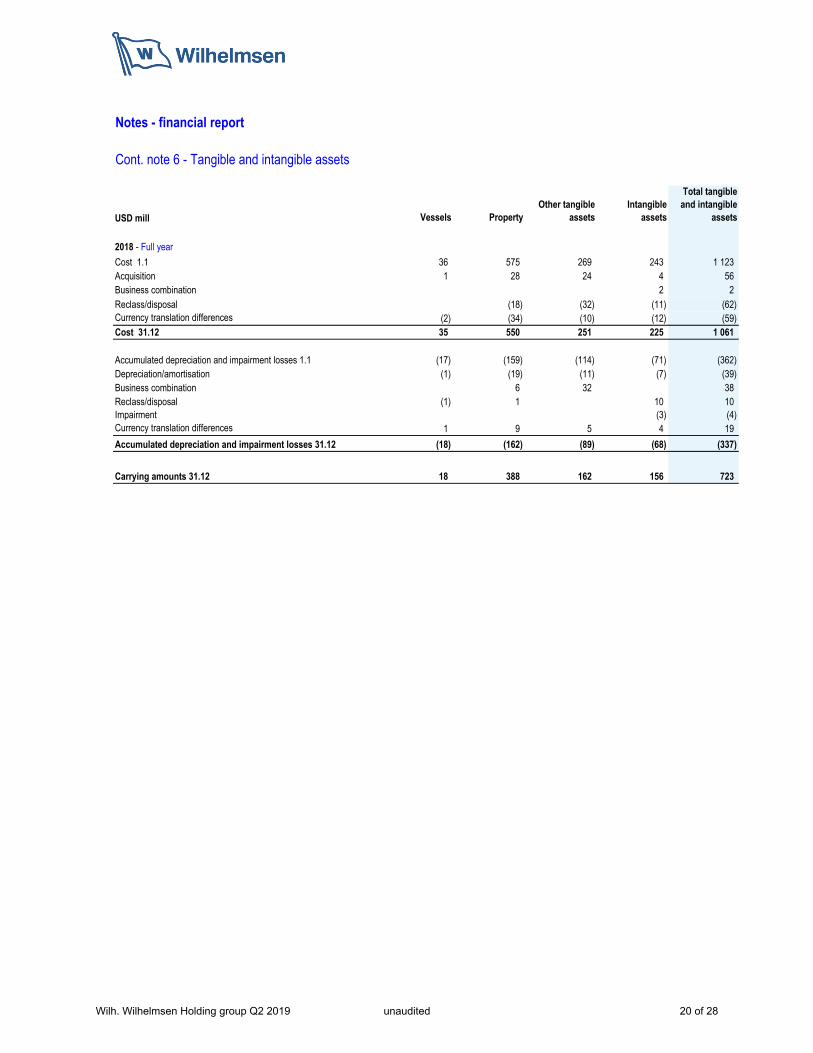
Cont. note 6 - Tangible and intangible assets
USD mill Vessels Property
Other tangible
assets
Intangible
assets
Total tangible
and intangible
assets
2018 - Full year
Cost 1.1 36 575 269 243 1 123
Acquisition 1 28 24 4 56
Business combination - - - 2 2
Reclass/disposal (18) (32) (11) (62)
Currency translation differences (2) (34) (10) (12) (59)
Cost 31.12 35 550 251 225 1 061
Accumulated depreciation and impairment losses 1.1 (17) (159) (114) (71) (362)
Depreciation/amortisation (1) (19) (11) (7) (39)
Business combination - 6 32 - 38
Reclass/disposal (1) 1 0 10 10
Impairment - (0) - (3) (4)
Currency translation differences 1 9 5 4 19
Accumulated depreciation and impairment losses 31.12 (18) (162) (89) (68) (337)
Carrying amounts 31.12 18 388 162 156 723
Notes - financial report
Wilh. Wilhelmsen Holding group Q2 2019 unaudited 20 of 28

Note 7 - Shares
A - shares 34 537 092
B - shares 11 866 732
Total shares 46 403 824
Note 8 - Financial assets to fair value
USD mill 30.06.2019 30.06.2018 31.12.2018
Financial assets to fair value
At 1 January 650 801 801
Acquisition 7 1 6
Reclassified 2
Sale during the year (20) (27) (27)
Return of capital (1)
Currency translation adjustment through other comprehensive income (0) (8) (13)
Change in fair value through income statement 96 (117) (116)
Total financial assets to fair value 734 650 650
Note 9 - Other financial income/(expenses)Q2 Q2 YTD YTD Full year
2019 2018 2019 2018 2018
Investment management 2 (2) 8 (6) (6)
Interest income 0 3 1 3 4
Other financial income 1 0 15 15 18
Interest expenses (11) (12) (21) (18) (34)
Net financial currency 0 (19) (2) (12) (23)
Other financial income/(expenses) (7) (30) 1 (18) (41)
Note 10 - Paid dividend
Financial assets to fair value are held in subsidiaries with different functional currencies and thereby creating translation adjustment.
Notes - financial report
The share capital is as follow with a nominal value of NOK 20:
Earnings per share taking into consideration the number of outstanding shares in the period. Basic earnings per share is calculated by dividing profit for the period after non-controlling interests, by average number of total outstanding shares.
Earnings per share is calculated based on 46 403 824 shares for 2019, and eachquarter in 2018.
Dividend for fiscal year 2017 was NOK 5.50 per share, where NOK 3.50 per share was paid in May 2018 and NOK 2.00 per share was paid in November 2018.The proposed dividend for fiscal year 2018 in 2019 is NOK 2.50 per share, was
approved by the annual general meeting on 30 April 2019, and was paid to the shareholders 15 May 2019.
Wilh. Wilhelmsen Holding group Q2 2019 unaudited 21 of 28

Note 11 - Interest-bearing debt
USD mill 30.06.2019 30.06.2018 31.12.2018
Non current interest-bearing debt 442 489 448
Current interest-bearing debt 51 102 85
Non current leasing debt 193
Current leasing debt 25
Total interest-bearing debt 712 591 533
Cash and cash equivalents 150 176 140
Current financial investments 103 91 88
Net interest-bearing debt 460 325 306
Specification of interest-bearing debt
USD mill 30.06.2019 30.06.2018 31.12.2018
Interest-bearing debt
Bankloan 494 591 533
Leasing debt 218
Total interest-bearing debt 712 591 533
Repayment schedule for interest-bearing debt
Due in 1 year 76 102 85
Due in 2 year 49 24 55
Due in 3 year 40 24 22
Due in 4 year 239 20 217
Due in 5 year and later 308 421 153
Total interest-bearing debt 712 591 533
Notes - financial report
Loan agreements entered into by group companies contain financial covenants related to equity ratio, liquidity, current ratio and net interest-bearing debt / EBITDA measured in respect of the relevant borrowing company or group of
companies. The group was in compliance with these covenants at 30 June 2019(analogous for 30 June 2018).
Wilh. Wilhelmsen Holding group Q2 2019 unaudited 22 of 28
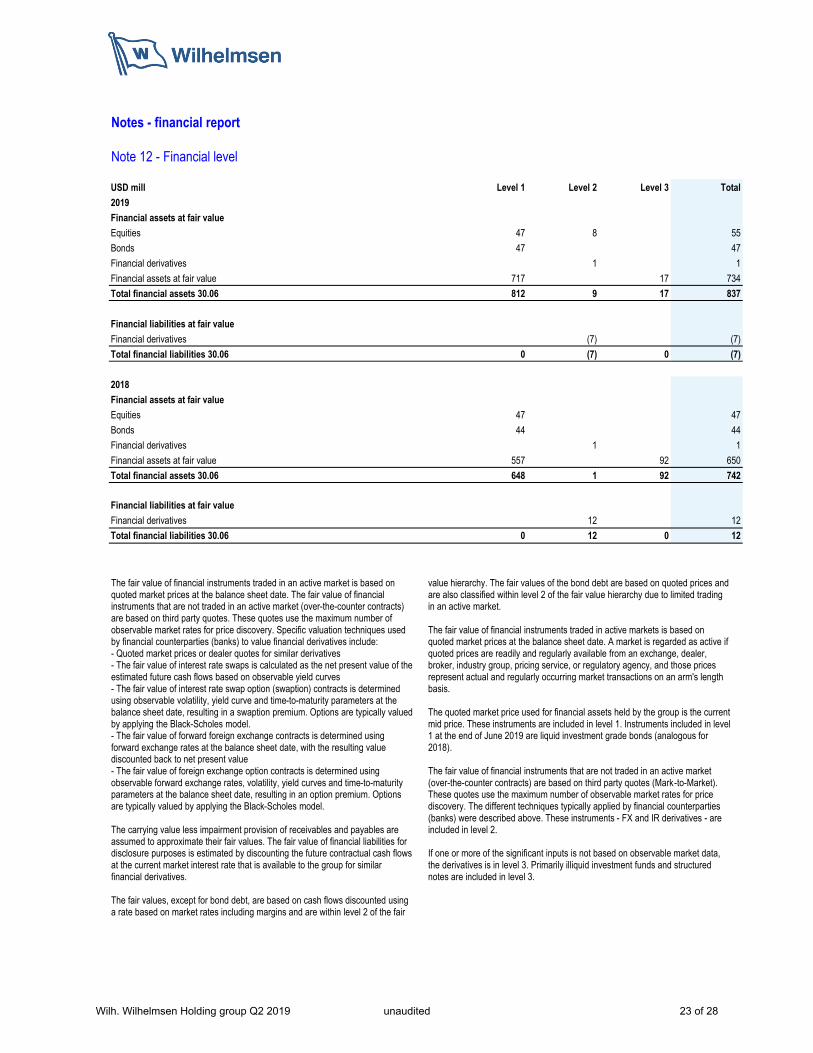
Note 12 - Financial level
USD mill Level 1 Level 2 Level 3 Total
2019
Financial assets at fair value
Equities 47 8 55
Bonds 47 47
Financial derivatives 1 1
Financial assets at fair value 717 17 734
Total financial assets 30.06 812 9 17 837
Financial liabilities at fair value
Financial derivatives -0 (7) (7)
Total financial liabilities 30.06 0 (7) 0 (7)
2018
Financial assets at fair value
Equities 47 47
Bonds 44 44
Financial derivatives -0 1 1
Financial assets at fair value 557 92 650
Total financial assets 30.06 648 1 92 742
Financial liabilities at fair value
Financial derivatives 12 12
Total financial liabilities 30.06 0 12 0 12
Notes - financial report
The fair value of financial instruments traded in an active market is based on quoted market prices at the balance sheet date. The fair value of financial instruments that are not traded in an active market (over-the-counter contracts) are based on third party quotes. These quotes use the maximum number of observable market rates for price discovery. Specific valuation techniques used by financial counterparties (banks) to value financial derivatives include:- Quoted market prices or dealer quotes for similar derivatives- The fair value of interest rate swaps is calculated as the net present value of the estimated future cash flows based on observable yield curves- The fair value of interest rate swap option (swaption) contracts is determined using observable volatility, yield curve and time-to-maturity parameters at the balance sheet date, resulting in a swaption premium. Options are typically valued by applying the Black-Scholes model.- The fair value of forward foreign exchange contracts is determined using forward exchange rates at the balance sheet date, with the resulting value discounted back to net present value- The fair value of foreign exchange option contracts is determined using observable forward exchange rates, volatility, yield curves and time-to-maturity parameters at the balance sheet date, resulting in an option premium. Options are typically valued by applying the Black-Scholes model.
The carrying value less impairment provision of receivables and payables are assumed to approximate their fair values. The fair value of financial liabilities for disclosure purposes is estimated by discounting the future contractual cash flows at the current market interest rate that is available to the group for similar financial derivatives.
The fair values, except for bond debt, are based on cash flows discounted using a rate based on market rates including margins and are within level 2 of the fair
value hierarchy. The fair values of the bond debt are based on quoted prices and are also classified within level 2 of the fair value hierarchy due to limited trading in an active market.
The fair value of financial instruments traded in active markets is based on quoted market prices at the balance sheet date. A market is regarded as active if quoted prices are readily and regularly available from an exchange, dealer, broker, industry group, pricing service, or regulatory agency, and those prices represent actual and regularly occurring market transactions on an arm's length basis.
The quoted market price used for financial assets held by the group is the current mid price. These instruments are included in level 1. Instruments included in level 1 at the end of June 2019 are liquid investment grade bonds (analogous for 2018).
The fair value of financial instruments that are not traded in an active market (over-the-counter contracts) are based on third party quotes (Mark-to-Market). These quotes use the maximum number of observable market rates for price discovery. The different techniques typically applied by financial counterparties (banks) were described above. These instruments - FX and IR derivatives - are included in level 2.
If one or more of the significant inputs is not based on observable market data, the derivatives is in level 3. Primarily illiquid investment funds and structured notes are included in level 3.
Wilh. Wilhelmsen Holding group Q2 2019 unaudited 23 of 28

Note 13 Leasing IFRS 16
Implementation effect
Impact on equity
The net effect on equity as at 1 January 2019 is presented below.
USD million
Lease liability at 1 January 2019 220
Right-of-use asset at 1 January 2019 222
Difference between lease liability and right-of-use asset at 1 January 2019 2
Effect from prepayments and currency translation 2
The new IFRS 16 Leasing standard is effective from 1 January 2019. The standard will significantly change how the company accounts for its lease contracts for land, buildings and equipment currently accounted for as operating leases. Virtually all leases will be brought into the balance sheet increasing the groups assets and liabilities, in addition to affecting income statement figures. This note summarizes the impact on the financial reporting of the group from implementing the new standard. According to the company's existing loan agreements, the new standard will not result in breach of debt covenants.
The Lease Contracts The company has a number of leases related to property and land that account for the significant part of the lease liability. The group also leases vechicle and equipment. A lease liability and right-of-use asset will be presented for these contracts which previously were reported as operating leases.
Recognition and Measurement Approach on TransitionWilhelmsen group will apply IFRS 16 retrospectively with recognition of the cumulative implementation effect recognised at the date of initial application 1 January 2019. By doing this, comparative financial information shall not be restated, but the cumulative effect of initially applying this standard are reflected as an adjustment to the opening balance. At the time of transition, leases entered under IAS 17 will not be reassessed.
As of 1 January 2019, the lease liabilities are measured at the present value of remaining lease payments, discounted using the incremental borrowing rate at
such date. The right-of-use assets are measured at an amount equal to the lease liability.
The standard has provided options on scope and exemptions and below the group's policy choices are described: - The standard will not be applied to leases of intangible assets and these will continue to be recognized in accordance with IAS 38 Intangible assets. - All leases deemed short-term by the standard are exempt from reporting.- All leases deemed to be of low value by the standard are exempt fromreporting.- Non-lease components shall be separated from the lease component in all
vessel leases. For other lease agreements, the group will apply a materiality threshold when evaluating separation.
Wilh. Wilhelmsen Holding group Q2 2019 unaudited 24 of 28

Note 14 - Related party transactions
Note 15 - Contingencies
Note 16 - Events occurring after the balance sheet date
Notes - financial report
WWH delivers services to the Wallenius Wilhelmsen group. These include primarily in-house services such as canteen, post, switchboard and rent of office facilities. Generally, Shared Services are priced using a cost plus 5% margin calculation, in accordance with the principles set out in the OECD Transfer Pricing Guidelines and are delivered according to agreements that are renewed annually.
In addition Maritime Services have several transactions with associates. The
contracts governing such transactions are based on commercial market terms.
The size and global activities of the group dictate that companies in the group will be involved from time to time in disputes and legal actions.
The group is not aware of any financial risk associated with disputes and legal actions which are not largely covered through insurance arrangements.
Nevertheless, any such disputes/actions which might exist are of such a nature that they will not significantly affect the group’s financial position.
No material events occured between the balance sheet date and the date when the accounts were presented providing new information about the conditions prevailing on the balance sheet date.
Wilh. Wilhelmsen Holding group Q2 2019 unaudited 25 of 28

Notes 17 Alternative performance measures
This section describes non-GAAP financial alternative performance measures (APM) that may be used in the quarterly and annual reports and related presentations.
The following measures are not defined nor specified in theapplicable financial reporting framework of IFRS. They may beconsidered as non-GAAP financial measures that may include orexclude amounts that are calculated and presented according tothe IFRS. These APMs are intended to enhance comparability ofthe results, balance sheet and cash flows from period to period and it is the Company’s experience that these are frequently used by investors, analysts and other parties. Internally, these APMs are used by the management to measure performance on a regular basis. The APMs should not be considered as a substitute for measures of performance in accordance with IFRS.
EBITDA is defined as Total income (Operating revenue andgain/(loss) on sale of assets) adjusted for Operating expenses.EBITDA is used as an additional measure of operational profitability, excluding the impact from financial items, taxes, depreciation and amortization.
EBITDA adjusted is defined as EBITDA excluding certain income and/or cost items which are not regarded as part of the underlying operational performance for the period. The Company do not report EBITDA adjusted on a regular basis, but may use it on a case by case basis to better explain operational performance.
EBITDA margin is defined as EBITDA as a per cent of of Total income.
EBITDA margin adjusted is defined as EBITDA adjusted as a per cent of Total income, with Total income also adjusted for the same income elements as those which have been adjusted for in EBITDA adjusted.
EBIT is defined as Total income (Operating revenue and
gain/(loss) on sale of assets) less Operating expenses, Othergain/loss and depreciation and amortization. EBIT is used as ameasure of operational profitability excluding the effects of howthe operations were financed, taxed and excluding foreignexchange gains & losses.
EBIT adjusted, EBIT margin and EBIT margin adjusted will, if used, be prepared in the same manner as described under EBITDA.
Net interest-bearing debt (NIBD) is defined as total interest bearing debt (Non-current interest-bearing debt and Current interest-bearing debt) less Cash and cash equivalenets and Current financial investments.
Equity ratio is defined as Total equity as a percent of Total assets.
Wilh. Wilhelmsen Holding group Q2 2019 unaudited 26 of 28

Responsibility statement
We confirm, to the best of our knowledge, that the condensed set of financial statements for the period 1 January to 30 June 2019 have been prepared in accordance with IAS 34 – Interim Financial Reporting, and gives a true and fair view of the group’s assets, liabilities, financial position and profit as a whole.
We also confirm, to the best of our knowledge, that the interim management report includes a fair review of important events that have occurred during the first six months of the financial year and their impact on the set of financial statements, a description of the principal risks and uncertainties for the remaining six months of the financial year, and major related parties transactions.
Lysaker, 22 August 2019 The board of directors of Wilh. Wilhelmsen Holding ASA
Diderik Schnitler Carl Erik Steen Irene Waage Basili Chair sign sign sign
Trond Ødegård Westlie Cathrine Løvenskiold Wilhelmsen sign Sign. S sign
Thomas Wilhelmsen Group CEO sign
Wilh. Wilhelmsen Holding group Q2 2019 unaudited 27 of 28
Wilh. Wilhelmsen Holding ASA PO Box 33 NO-1324 Lysaker, NORWAY Tel: +47 67 58 40 00 http://www.wilhelmsen.com/
Follow us on Twitter | Facebook | LinkedIn
Org no 995 227 905


