DEWI MAGAZIN NO. 42, February 2013 31 C. Ender; DEWI GmbH, Wilhelmshaven Wind Energy Use in Germany - Status 31.12.2012 Windenergienutzung in Deutschland - Stand 31.12.2012 ENGLISH - DEUTSCH 2012 has been a good year for the development of wind en- ergy world-wide and also for Germany. All in all, the global installed wind power capacity in 2012 was 44,712 MW, which is an increase of 8.4 % compared to last year’s figures (Tab. 1). Of the new installaons, about 59 per cent were realized in China (13.2 GW) and the USA (13.1 GW), followed by Ger- many and India. It is interesng to note that for the first me Romania has made it among the TOP 10 countries in 2012. With 923 MW new installed capacity the country achieved the tenth posion. [1] The posive market development for Germany was already foreseeable when evaluang the figures for the first six months of 2012, and it was confirmed at the end of the year. Based on the average share of the first half year in the annual result over the last five years, new installaons of up to 2,350 MW could be expected. The final installaon figures of 2,440 MW even exceeded the forecast. This result is the fourth best in the history of the DEWI-Stascs, only beaten by the in- stallaons of the record years 2001 to 2003. The good result is probably partly due to projects promoted because of the Energiewende, but also to repowering projects which are contribung an increasing share in the wind energy develop- ment. Older wind turbines from the 1990s have now reached an age where replacement may be considered. This applies Das Jahr 2012 war ein gutes Jahr für den Ausbau der Wind- energie, weltweit wie auch in Deutschland. Insgesamt ka- men internaonal 44.712 MW an neu installierter Leistung hinzu, eine Steigerung von rund 8,4 % gegenüber dem Vor- jahreswert (Tab. 1). Von den Neuaufstellungen enielen rund 59 Prozent auf China (13,2 GW) und die USA (13,1 GW), gefolgt von Deutschland und Indien. Interessant bei der Betrachtung der TOP 10 Länder des Jahres 2012 ist, dass es Rumänien mit 923 MW auf den zehnten Platz in dieser Aufstellung geschafft hat. [1] In Deutschland hat sich die posive Marktentwicklung be- reits bei der Auswertung für das erste Halbjahr angekündigt und am Ende des Jahres bestägt. Ausgehend vom Miel- wert der Anteile des ersten Halbjahres der letzten fünf Jahre am Jahresergebnis konnte mit einem Ausbau von bis zu 2.350 MW gerechnet werden. Die finalen Aufstellungs- zahlen übertrafen diese Prognose und lagen mit 2.440 MW sogar deutlich darüber. Dieses Ergebnis ist das viertbeste in der DEWI-Stask und konnte nur durch die Aufstellungen der Jahre 2001 bis 2003 übertroffen werden. Dies mag zum einen an den durch die Energiewende vorangebrachten Projekten liegen, aber auch das Repowering hat seinen Teil zum Ausbau der Windenergie beigetragen. Die Altanlagen aus den 1990er Jahren kommen zunehmend in ein Alter, in
Transcript
DEWI MAGAZIN NO. 42, February 2013 31
C. Ender; DEWI GmbH, Wilhelmshaven
Wind Energy Use in Germany Status 31.12.2012
Windenergienutzung in Deutschland Stand 31.12.2012
ENGLISH - DEUTSCH
2012 has been a good year for the development of wind energy worldwide and also for Germany. All in all, the global installed wind power capacity in 2012 was 44,712 MW, which is an increase of 8.4 % compared to last year’s figures (Tab. 1). Of the new installations, about 59 per cent were realized in China (13.2 GW) and the USA (13.1 GW), followed by Germany and India. It is interesting to note that for the first time Romania has made it among the TOP 10 countries in 2012. With 923 MW new installed capacity the country achieved the tenth position. [1]The positive market development for Germany was already foreseeable when evaluating the figures for the first six months of 2012, and it was confirmed at the end of the year. Based on the average share of the first half year in the annual result over the last five years, new installations of up to 2,350 MW could be expected. The final installation figures of 2,440 MW even exceeded the forecast. This result is the fourth best in the history of the DEWI-Statistics, only beaten by the installations of the record years 2001 to 2003. The good result is probably partly due to projects promoted because of the Energiewende, but also to repowering projects which are contributing an increasing share in the wind energy development. Older wind turbines from the 1990s have now reached an age where replacement may be considered. This applies
Das Jahr 2012 war ein gutes Jahr für den Ausbau der Windenergie, weltweit wie auch in Deutschland. Insgesamt kamen international 44.712 MW an neu installierter Leistung hinzu, eine Steigerung von rund 8,4 % gegenüber dem Vorjahreswert (Tab. 1). Von den Neuaufstellungen entfielen rund 59 Prozent auf China (13,2 GW) und die USA (13,1 GW), gefolgt von Deutschland und Indien. Interessant bei der Betrachtung der TOP 10 Länder des Jahres 2012 ist, dass es Rumänien mit 923 MW auf den zehnten Platz in dieser Aufstellung geschafft hat. [1]In Deutschland hat sich die positive Marktentwicklung bereits bei der Auswertung für das erste Halbjahr angekündigt und am Ende des Jahres bestätigt. Ausgehend vom Mittelwert der Anteile des ersten Halbjahres der letzten fünf Jahre am Jahresergebnis konnte mit einem Ausbau von bis zu 2.350 MW gerechnet werden. Die finalen Aufstellungszahlen übertrafen diese Prognose und lagen mit 2.440 MW sogar deutlich darüber. Dieses Ergebnis ist das viertbeste in der DEWI-Statistik und konnte nur durch die Aufstellungen der Jahre 2001 bis 2003 übertroffen werden. Dies mag zum einen an den durch die Energiewende vorangebrachten Projekten liegen, aber auch das Repowering hat seinen Teil zum Ausbau der Windenergie beigetragen. Die Altanlagen aus den 1990er Jahren kommen zunehmend in ein Alter, in
32 DEWI MAGAZIN NO. 42, February 2013
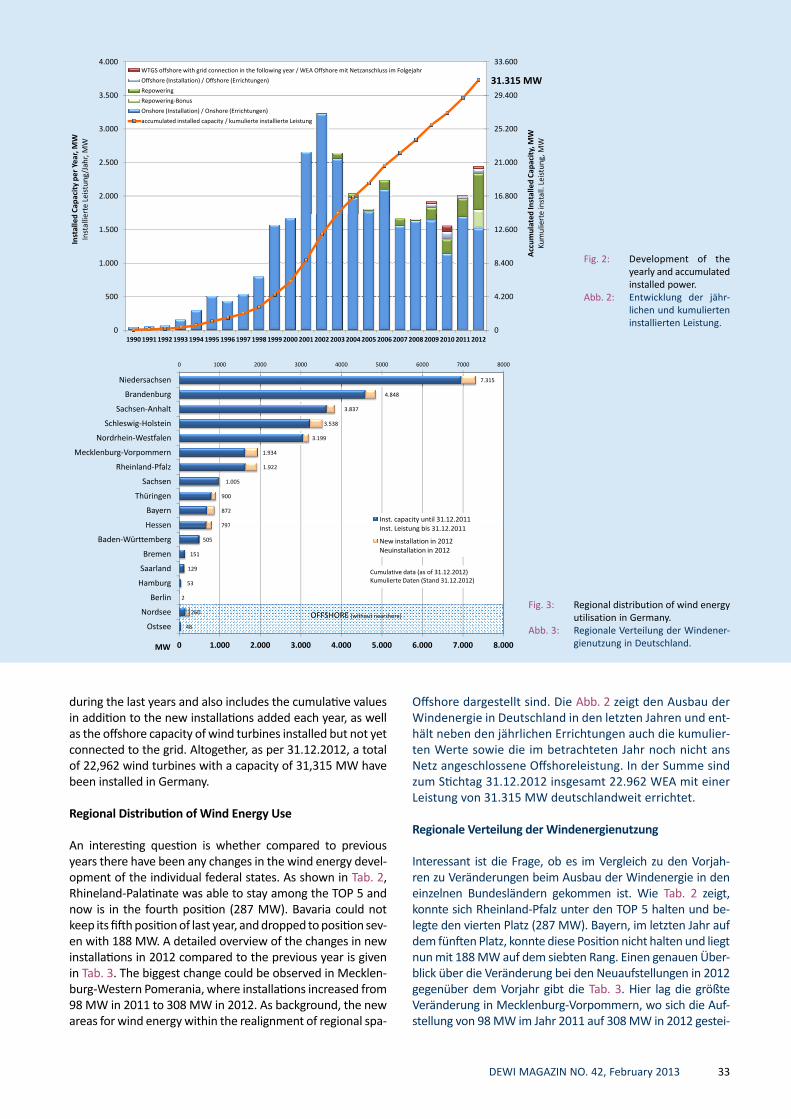
especially to turbines that were erected after 1998 and are located in wind priority areas. In concrete figures, according to information supplied by wind turbine manufacturers1 altogether 1,003 new wind turbines (WTGS) with 2,439.66 megawatt (MW) were installed in Germany in 2012 (Fig. 1). This means an increase of 21.5 % compared to the year before. As already mentioned, repowering projects have made a significant contribution to the development. Their share in the new installations is approx. 22 %, plus the use of repowering bonus certificates for 117 dismantled wind turbines. Apart from the onshore installations, there has also been some development offshore. 21 wind turbines were installed in the wind farm „BARD Offshore 1“ which brings the total installed offshore capacity to 320 MW, of which 280 MW have been connected to the grid. Fig. 1 gives a compact overview of the figures for 2012, showing among others the new installations, repowering figures and offshore installation figures. Fig. 2 shows the development of wind energy in Germany
dem über einen Ersatz nachgedacht wird. Dies gilt insbesondere für Anlagen, die nach 1998 errichtet wurden und in Windeignungsflächen stehen. Konkret in Zahlen ausgedrückt wurden nach Angaben der Hersteller1 im Jahr 2012 insgesamt 1.003 Windenergieanlagen (WEA) mit 2.439,66 Megawatt (MW) in Deutschland neu errichtet (Abb. 1). Dies bedeutet eine Steigerung von 21,5 % gegenüber dem Vorjahreszeitraum. Wie schon erwähnt, hat das Repowering einiges zum Ausbau beigetragen und einen Anteil an den Neuaufstellungen von rund 22 % erreicht, wobei die Nutzung der Repowering-Bonus-Zertifikate für 117 abgebaute Anlagen noch hinzukommen. Neben den Errichtungen an Land kamen weitere 21 komplett errichtete Anlagen im Windpark „BARD Offshore 1“ hinzu, so dass die Offshore installierte Leistung jetzt bei 320 MW liegt, wovon 280 MW an das Netz angeschlossen sind. Eine kompakte Übersicht über das Ergebnis des Jahres 2012 gibt die Abb. 1, wo u.a. die Neuinstallationen, das Repowering und der Bereich
Tab. 1: Status of wind energy use wordwide [2]
Tab. 1: Stand der Windenergienut zung weltweit [2]
Country MW % Share Country MW % ShareChina ** 13.200 29,5% China ** 75.564 26,8%
USA 13.124 29,4% USA 60.007 21,2%Germany * 2.440 5,5% Germany * 31.315 11,1%
India 2.336 5,2% Spain 22.796 8,1%UK 1.897 4,2% India 18.421 6,5%
Rest of the World 6.385 14,3% Rest of the World 39.853 14,1%Total TOP 10 38.327 85,7% Total TOP 10 242.613 85,9%World Total 44.712 World Total 282.466
* (Data: DEWI GmbH; incl. WTGS without grid connection) * (Data: DEWI GmbH; incl. WTGS without grid connection)
** Provisional Figure ** Provisional Figure
Fig. 1: Status of wind energy use in Germany
Abb. 1: Stand der Wind ener gienut zung in Deut schland
1 The data are based exclusively on manufacturer information. The survey was carried out in December 2012/January 2013. The WTGS reported were installed but do not have to be already connected to the grid.
Die Angaben basieren ausschließlich auf Herstellerangaben. Die Erhebung wurde im Dezember 2012/Januar 2013 durchgeführt. Die gemeldeten WEA sind errichtet, müssen aber noch nicht ans Netz angeschlossen sein.
Repowering541 MW Removed
196 MW
Offshore 80 MW
(15 MW from 2011)
Onshore1.794 MW
WTGS operational/ WEA in Betrieb
in 2012:
2.415 MW
Repowering541 MW Removed
196 MW
Offshore 105 MW
(40 MW not in operation)
Onshore1.794 MW
WTGS installed/ Errichtete WEA
in 2012:
2.440 MW
DEWI MAGAZIN NO. 42, February 2013 33
Offshore dargestellt sind. Die Abb. 2 zeigt den Ausbau der Windenergie in Deutschland in den letzten Jahren und enthält neben den jährlichen Errichtungen auch die kumulierten Werte sowie die im betrachteten Jahr noch nicht ans Netz angeschlossene Offshoreleistung. In der Summe sind zum Stichtag 31.12.2012 insgesamt 22.962 WEA mit einer Leistung von 31.315 MW deutschlandweit errichtet.
Regionale Verteilung der Windenergienutzung
Interessant ist die Frage, ob es im Vergleich zu den Vorjahren zu Veränderungen beim Ausbau der Windenergie in den einzelnen Bundesländern gekommen ist. Wie Tab. 2 zeigt, konnte sich RheinlandPfalz unter den TOP 5 halten und belegte den vierten Platz (287 MW). Bayern, im letzten Jahr auf dem fünften Platz, konnte diese Position nicht halten und liegt nun mit 188 MW auf dem siebten Rang. Einen genauen Überblick über die Veränderung bei den Neuaufstellungen in 2012 gegenüber dem Vorjahr gibt die Tab. 3. Hier lag die größte Veränderung in MecklenburgVorpommern, wo sich die Aufstellung von 98 MW im Jahr 2011 auf 308 MW in 2012 gestei
16.800
21.000
25.200
29.400
33.600
2.000
2.500
3.000
3.500
4.000
d In
stal
led
Capa
city
, MW
e in
stal
l. Le
istu
ng, M
W
Capa
city
per
Yea
r, M
Wer
te L
eist
ung/
Jahr
, MW
WTGS offshore with grid connection in the following year / WEA Offshore mit Netzanschluss im Folgejahr
Fig. 2: Development of the yearly and accumulated in stalled power.
Abb. 2: Entwicklung der jährlichen und kumulierten in stallier ten Leistung.
31.315 MW
during the last years and also includes the cumulative values in addition to the new installations added each year, as well as the offshore capacity of wind turbines installed but not yet connected to the grid. Altogether, as per 31.12.2012, a total of 22,962 wind turbines with a capacity of 31,315 MW have been installed in Germany.
Regional Distribution of Wind Energy Use
An interesting question is whether compared to previous years there have been any changes in the wind energy development of the individual federal states. As shown in Tab. 2, Rhineland-Palatinate was able to stay among the TOP 5 and now is in the fourth position (287 MW). Bavaria could not keep its fifth position of last year, and dropped to position seven with 188 MW. A detailed overview of the changes in new installations in 2012 compared to the previous year is given in Tab. 3. The biggest change could be observed in Mecklenburg-Western Pomerania, where installations increased from 98 MW in 2011 to 308 MW in 2012. As background, the new areas for wind energy within the realignment of regional spa
797
872
900
1.005
1.922
1.934
3.199
3.538
3.837
4.848
7.315
0 1000 2000 3000 4000 5000 6000 7000 8000
Hessen
Bayern
Thüringen
Sachsen
Rheinland-Pfalz
Mecklenburg-Vorpommern
Nordrhein-Westfalen
Schleswig-Holstein
Sachsen-Anhalt
Brandenburg
Niedersachsen
Inst. capacity until 31.12.2011I t L i t bi 31 12 2011
48
260
2
53
129
151
505
797
0 1.000 2.000 3.000 4.000 5.000 6.000 7.000 8.000
Ostsee
Nordsee
Berlin
Hamburg
Saarland
Bremen
Baden-Württemberg
Hessen Inst. Leistung bis 31.12.2011
New installation in 2012Neuinstallation in 2012
OFFSHORE (without nearshore)
MW
Cumulative data (as of 31.12.2012)Kumulierte Daten (Stand 31.12.2012)
Fig. 3: Regional distribution of wind energy utilisation in Germany.
Abb. 3: Regionale Verteilung der Wind energie nut zung in Deutschland.
34 DEWI MAGAZIN NO. 42, February 2013
gert hat. Als Hintergrund ist die Ausweisung neuer Windeignungsgebiete im Rahmen der Neuaufstellung der Regionalen Raumentwicklungsprogramme in dem Bundesland zu sehen. Was die Gesamtleistung betrifft, so liegt Niedersachsen immer noch mit deutlichem Abstand vorn, gefolgt von Brandenburg und SachsenAnhalt. Bayern ist nun fast gleichauf mit Thüringen, und Sachsen konnte die 1.000 MWMarke überschreiten. Diese und weitere Gesamtzahlen sind in Abb. 3 zu finden, wo zum einen grafisch die Gesamtleistung zum 31.12.2011 (blau) und zum anderen die Neuerrichtungen zum 31.12.2012 (orange) dargestellt sind. Die Zahlenan
tial development programs in this federal state can be seen. Concerning the total installed power, Lower Saxony is still in the lead position, followed by Brandenburg and Saxony-Anhalt. Bavaria now has reached almost the same level as Thuringia, and Saxony has exceeded the 1,000 MW milestone. These and other figures are found in Fig. 3, where the cumulative installed capacity until 31.12.2011 is shown in blue and the new installations until 31.12.2012 in orange. The figures refer to the total capacity installed until the reference date. The distribution of new installations in 2012 is illustrated in Fig. 4. The dots represent the approximate locations and
Tab. 2: Regional distribution of WTGS newly erected, pulled down and repowered in 2012Tab. 2: Regionale Verteilung der im Jahr 2012 in Deutschland neu errichteten, abgebauten und repowerten WEA
Tab. 3: Changes in new installations in 2012 compared to the previous year
Tab. 3: Veränderung bei den Neuaufstellungen in 2012 gegenüber dem Vorjahr
DEWI MAGAZIN NO. 42, February 2013 35
their size is an indication of the capacity in MW installed in the respective postal code areas. As already done in our last annual statistics [2], we evaluated the regional distribution not only at federal-state level, but also one level below, at district level. Based on the postal code/location supplied by the wind turbine manufacturers, the installed capacity and number of wind turbines were summarized for rural and urban districts. An overview of federal states with the top three for each state and information about the other districts is given in Tab. 4. When looking at the new installations at district level, the largest growth
gaben beziehen sich auf die gesamte installierte Leistung zum Stichtag. Wo genau der Ausbau in 2012 stattgefunden hat, zeigt die Abb. 4, in der die ungefähren Standorte anhand eines Punktes auf Basis der in dem jeweiligen PLZBereich errichteten MW dargestellt sind. Wie bereits bei der letzten Jahresbetrachtung [2] wurden die Neuerrichtungen auch auf Landkreisebene ausgewertet. Auf Basis der gemeldeten PLZ/Ortsangaben der Hersteller wurden die installierte Leistung und die Anzahl der Anlagen auf der Ebene der Landkreise/Kreisfreien Städte zusammengefasst. Eine Übersicht je Bundesland mit den jeweiligen
Fig. 4: Regional distribution of the newly installed WTGS in Germany in 2012 (in kW)
Abb. 4: Regionale Verteilung der in 2012 neu inst. WEA in Deutsch land (in kW)
Tab. 4: TOP3 districts per federal state in 2012Tab. 4: TOP3 Landkreise je Bundesland in 2012
36 DEWI MAGAZIN NO. 42, February 2013
is observed in Dithmarschen with 176 MW, followed by the district Mecklenburgische Seenplatte (119 MW), the Rhein-HunsrückKreis (106 MW) and VorpommernGreifswald with 85 MW (TOP 10 in Tab. 5). It should be noted, however, that many rural districts in Eastern Germany extend over large regions and accordingly include larger areas than in the western German states. All in all, installations were made in 128 districts, but in 44 of these (34 %) only 1 or 2 wind turbines were erected (Fig. 5).
Repowering
Compared to 2011, installations within repowering projects have doubled. In Lower Saxony and Schleswig Holstein the strong increase of wind power in 2012 is significantly due to the repowering. In 2012 a total of 325 wind turbines with 196 MW were pulled down and directly replaced by 210 turbines with 541 MW (Tab. 2). Additionally there are also 117 new installations that come with a repowering bonus, which can be used according to the balance of the “surplus decommissions” when replacing old turbines. If this figure is multiplied by the average installed capacity per federal state, an additional capacity of 276 MW could be installed in repowering projects. Apart from the new capacity installed within the scope of repowering it is also interesting to know how much net growth in capacity has been achieved by these projects. This information is given in Fig. 6 where the capacity removed (red) was deducted from the new installations (dark blue). The largest growth in capacity (light blue) of approx. 115 MW in 2012 was noted in Schleswig Holstein. At this point please refer to the article on page 42, which deals extensively with the development of repowering.
Offshore Wind Energy
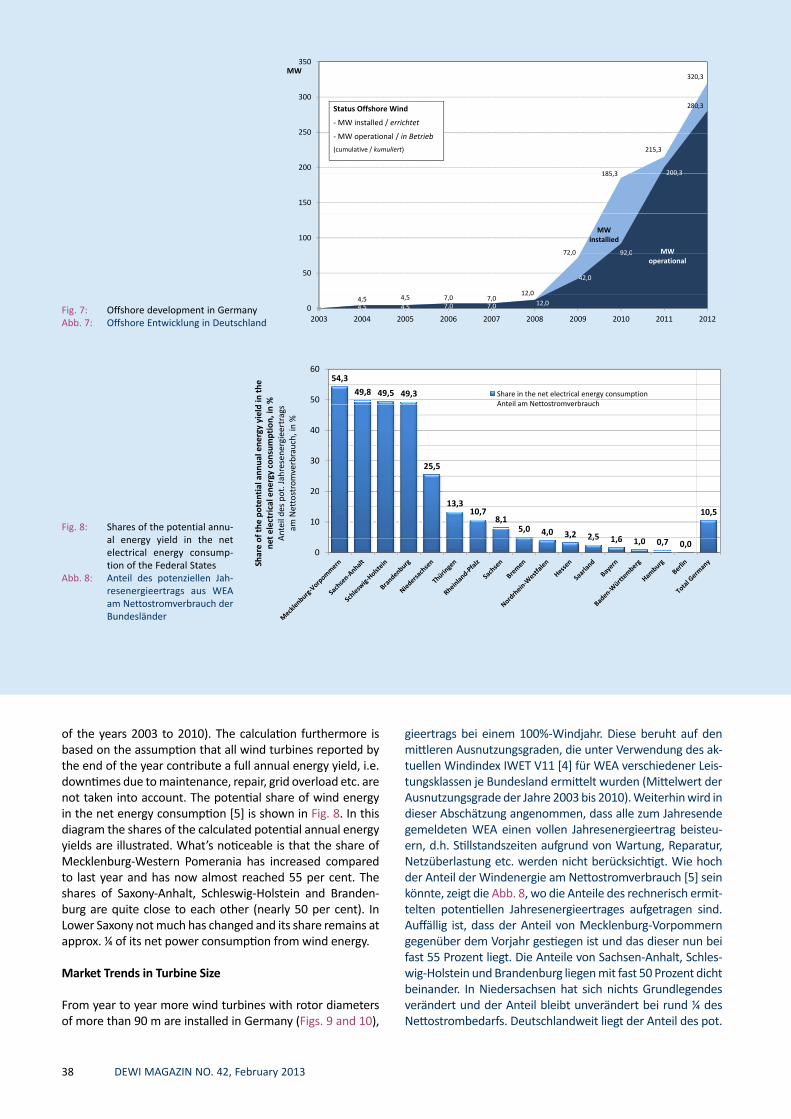
North SeaIn the offshore wind farm „BARD Offshore 1“ which has been under construction since March 2010, 21 further wind turbines could be installed and 16 already installed turbines were connected to the grid. By the end of last year therefore a total of 32 wind turbines were producing electricity,
Top 3 sowie eine Angabe zu den restlichen Landkreisen gibt die Tab. 4. Bei der Betrachtung des Ausbaus in den Landkreisen ist zu erkennen, dass der größte Zuwachs in Dithmarschen mit 176 MW erfolgt ist, gefolgt vom Landkreis Mecklenburgische Seenplatte (119 MW), dem Rhein-Hunsrück-Kreis (106 MW) und dem Landkreis VorpommernGreifswald mit 85 MW (TOP 10 in Tab. 5). Dabei ist aber zu beachten, dass sich viele Landkreise im Osten Deutschlands über sehr große Regionen erstrecken und dementsprechend größere Flächen als in den westdeutschen Bundesländern umfassen. Insgesamt gab es Neuaufstellungen in 128 Landkreisen, wobei in 44 Landkreisen (34 %) nur 1 bis 2 Anlagen errichtet wurden (Abb. 5).
Repowering
Gegenüber 2011 haben sich die Aufstellungen im Rahmen eines Repowerings mehr als verdoppelt. In Niedersachsen und in SchleswigHolstein ist der starke Zuwachs der Windenergie in 2012 maßgeblich auf das Repowering zurückzuführen. Im Jahr 2012 wurden insgesamt 325 WEA mit 196 MW abgebaut und durch 210 WEA mit 541 MW direkt ersetzt (Tab. 2). Hinzu kommen 117 Neuanlagen mit einem RepoweringBonus, der entsprechend der Bilanz der „überzähligen Abbauten“ beim Ersetzen von Altanlagen genutzt werden kann. Wird diese Zahl mit der mittleren installierten Leistung je Bundesland multipliziert, so ergibt sich ein zusätzliches Volumen von 276 MW im Rahmen des Repowerings. Neben den reinen Neuerrichtungen ist vor allem interessant, welchen Netto-Leistungszuwachs dieses gebracht hat. Eine solche Betrachtung ist in Abb. 6 zu finden, wo von den Neuaufstellungen (dunkelblau) der Abbau (rot) abgezogen wurde. Den größten Leistungszuwachs (hellblau) verzeichnete 2012 SchleswigHolstein mit rund 115 MW. Es wird an dieser Stelle auch auf den Beitrag auf Seite 42 hingewiesen, der sich ausführlich mit der Entwicklung des Repowering befasst.
Offshore-Windenergie
NordseeBei dem seit März 2010 in Bau befindlichen Offshore-Windpark „Bard Offshore 1“ konnten in 2012 weitere 21 WEA
1-2 WTGS / WEA7%
3-5 WTGS / WEA13%
6-10 WTGS / WEA
> 25 WTGS / WEA24%
6 10 WTGS / WEA19%
11-25 WTGS / WEA37%
DistrictLandkreis
Federal StateBundesland
Inst. Capacity (MW)Inst. Leistung (MW)
Dithmarschen Schleswig-Holstein 176,8Mecklenburgische Seenplatte Mecklenburg-Vorpommern 119,3Rhein-Hunsrück-Kreis Rheinland-Pfalz 105,9Vorpommern-Greifswald Mecklenburg-Vorpommern 85,0Alzey-Worms Rheinland-Pfalz 79,2Saalekreis Sachsen-Anhalt 70,3Vorpommern-Rügen Mecklenburg-Vorpommern 52,7Nordfriesland Schleswig-Holstein 49,2Rotenburg (Wümme) Niedersachsen 49,2Schleswig-Flensburg Schleswig-Holstein 48,5
Tab. 4: TOP10 districts in 2012Tab. 4: TOP10 Landkreise in 2012
Fig. 5: Share of the districts related to the quantity of the installed turbines
Abb. 5: Anteil der Landkreise bezogen auf die Menge an errichteten Anlagen
DEWI MAGAZIN NO. 42, February 2013 37
errichtet und 16 Anlagen zusätzlich ans Netz angeschlossen werden. Zum Jahresende erzeugten somit insgesamt 32 Wind tur binen Strom, acht weitere Anlagen waren vollständig installiert, aber noch nicht in Betrieb (Abb. 7). In 2012 startete der Bau einiger weiterer Offshore-Windparks. Beim Projekt „Riffgat“ (108 MW) stehen bereits alle 30 Monopiles sowie die Umspannplattform, die im Februar 2013 errichtet wurde. Auch der Bau des Trianel Windpark „Borkum West 2“ (200 MW, später 400 MW) schreitet voran und es stehen bereits rund 20 TripodFundamente. Weitere Projekte, deren Bau 2012 gestartet wurde, sind „GlobalTech I“ (400 MW), „Nordsee Ost“ (295 MW) und „Meerwind“ (288 MW), wo auch bereits die ersten Fundamente installiert werden konnten. Das Projekt „DanTysk“ (288 MW) ist Anfang 2013 gestartet und bei weiteren Offshore-Windparks ist der Baubeginn in diesem Jahr geplant.Darüber hinaus ist die Errichtung der für die Netzanbindung auf See erforderlichen Konverterstationen „DolWin alpha“, „BorWin beta“ und „HelWin alpha“ für 2013/2014 vorgesehen. Es bleibt abzuwarten, ob die Realisierung der Projekte tatsächlich wie geplant erfolgt oder ob es zu einer weiteren zeitlichen Verschiebung kommt, z.B. wegen der bestehenden Schwierigkeiten bei der Netzanbindung.
OstseeIm Jahr 2012 gab es keine Baumaßnahmen in der Ostsee. Der Baubeginn für das Offshore-Projekt „EnBW Baltic 2“ mit einer Gesamtleistung von 288 MW hat sich verzögert und soll nun in diesem Jahr erfolgen.
Der potenzielle Jahresenergieertrag
Im Jahr 2011 wurden lt. BDEW insgesamt rund 48.883 GWh aus Wind erzeugt [3]. Darin enthalten ist auch der Bereich Offshore, welcher 568 GWh beigetragen hat. Die Zahlen beruhen auf den Jahresmeldungen der Verteilnetzbetreiber und es dauert mitunter einige Monate, bis das endgültige Ergebnis vorliegt. Für das Jahr 2012 gibt es bereits eine vorläufige Schätzung seitens BDEW von 46.000 GWh [4]. Um einen Anhaltspunkt zu bekommen, was die Windenergie zu leisten vermag, erfolgt eine Abschätzung des potenziellen Jahresener
eight other turbines were completely installed but not yet operating (Fig. 7). In 2012 construction work started for several other offshore wind farms. In the project „Riffgat“ (108 MW) already all of the 30 monopile foundations have been installed, and the transformer platform was erected in February 2013. The development of the Trianel wind farm “Borkum West 2” (200 MW, later 400 MW), also is advancing quite well. Other projects which started construction in 2012 are „GlobalTech I“ (400 MW), „Nordsee Ost“ (295 MW) and „Meerwind“ (288 MW), where the first foundations already were installed. The project „DanTysk“ (288 MW) started at the beginning of 2013, and other offshore wind farm construction is scheduled for this year.Construction work for the converter platforms necessary for the grid connection at sea „DolWin alpha“, „BorWin beta“ and „HelWin alpha“ is scheduled for 2013/2014. It remains to be seen if these projects will be realised as scheduled or if there will be further delays, for example because of problems existing with the grid connection.
Baltic SeaIn 2012 there have been no constructions in the Baltic Sea. Construction on the offshore project „EnBW Baltic 2“ with a total installed capacity of 288 MW has been delayed and will now start this year.
Potential Annual Energy Yield
According to the BDEW (German Association of Energy and Water Industries) approx. 48,883 GWh were generated from wind in 2011 [3]. This includes the offshore area which contributed 568 GWh. These figures are based on the annual reports by the distribution grid operators, and it can sometimes take several months until the final data are released. For the year 2012 the BDEW has already released a preliminary estimate, which is 46,000 GWh [4]. To be able to give an indication of the contribution of wind energy, the potential annual energy yield is estimated, assuming a 100% wind year. This is based on the average load factors calculated for wind turbines of different power classes for each federal state, using the wind index IWET V11 [4] (average of the load factors
150,00
200,00M
W
, MW
New installed capacity (Repowering) / Neu installierte Leistung (Repowering)Capacity (MW) removed / Abgebaute Leistung MW
100,00
d Ca
paci
ty, M
ute
Leis
tung
, Abgebaute Leistung, MWNet capacity increment through repowering / Netto Leistungszuwachs durch Repowering
0,00
50,00
d &
rem
oved
e &
abg
ebau
-50,00
Inst
alle
dIn
stal
liert
e
-100,00
Fig. 6: Net capacity increment in the federal states caused by repowering
Abb. 6: Netto Leistungszuwachs in den einzelnen Bundesländern aufgrund des Repowerings
38 DEWI MAGAZIN NO. 42, February 2013
of the years 2003 to 2010). The calculation furthermore is based on the assumption that all wind turbines reported by the end of the year contribute a full annual energy yield, i.e. downtimes due to maintenance, repair, grid overload etc. are not taken into account. The potential share of wind energy in the net energy consumption [5] is shown in Fig. 8. In this diagram the shares of the calculated potential annual energy yields are illustrated. What’s noticeable is that the share of MecklenburgWestern Pomerania has increased compared to last year and has now almost reached 55 per cent. The shares of SaxonyAnhalt, SchleswigHolstein and Brandenburg are quite close to each other (nearly 50 per cent). In Lower Saxony not much has changed and its share remains at approx. ¼ of its net power consumption from wind energy.
Market Trends in Turbine Size
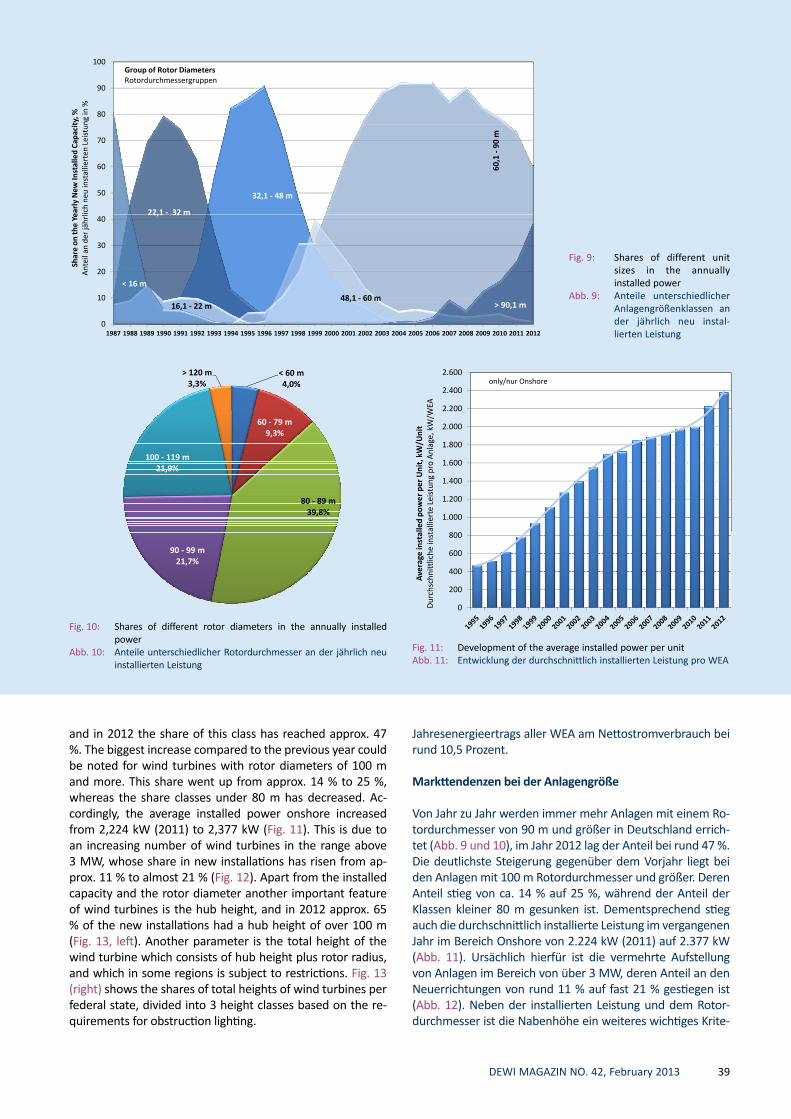
From year to year more wind turbines with rotor diameters of more than 90 m are installed in Germany (Figs. 9 and 10),
gieertrags bei einem 100%Windjahr. Diese beruht auf den mittleren Ausnutzungsgraden, die unter Verwendung des aktuellen Windindex IWET V11 [4] für WEA verschiedener Leistungsklassen je Bundesland ermittelt wurden (Mittelwert der Ausnutzungsgrade der Jahre 2003 bis 2010). Weiterhin wird in dieser Abschätzung angenommen, dass alle zum Jahresende gemeldeten WEA einen vollen Jahresenergieertrag beisteuern, d.h. Stillstandszeiten aufgrund von Wartung, Repa ratur, Netzüberlastung etc. werden nicht berücksichtigt. Wie hoch der Anteil der Windenergie am Nettostromverbrauch [5] sein könnte, zeigt die Abb. 8, wo die Anteile des rechnerisch ermittelten potentiellen Jahresenergieertrages aufgetragen sind. Auffällig ist, dass der Anteil von Mecklenburg-Vorpommern gegenüber dem Vorjahr gestiegen ist und das dieser nun bei fast 55 Prozent liegt. Die Anteile von SachsenAnhalt, SchleswigHolstein und Brandenburg liegen mit fast 50 Prozent dicht beinander. In Niedersachsen hat sich nichts Grundlegendes verändert und der Anteil bleibt unverändert bei rund ¼ des Nettostrombedarfs. Deutschlandweit liegt der Anteil des pot.
Fig. 7: Offshore development in GermanyAbb. 7: Offshore Entwicklung in Deutsch land
54,3
49,8 49,5 49,350
60
in t
he
%
Share in the net electrical energy consumptionAnteil am Nettostromverbrauch
40
ener
gy y
ield
umpt
ion,
in
ergi
eert
rags
uch,
in %
Anteil am Nettostromverbrauch
25,5
20
30
tial
ann
ual e
ener
gy c
onsu
ot. J
ahre
sene
stro
mve
rbra
13,310,7
8,15,0 4,0 3,2 2,5 1 6 1 0
10,510
0
of t
he p
oten
tt
elec
tric
al e
Ant
eil d
es p
oam
Net
tos
2,5 1,6 1,0 0,7 0,00
Shar
e o
net A
Fig. 8: Shares of the potential annual energy yield in the net electrical energy consumption of the Federal States
Abb. 8: Anteil des potenziellen Jahres ener gie er trags aus WEA am Net to strom verbrauch der Bundes län der
DEWI MAGAZIN NO. 42, February 2013 39
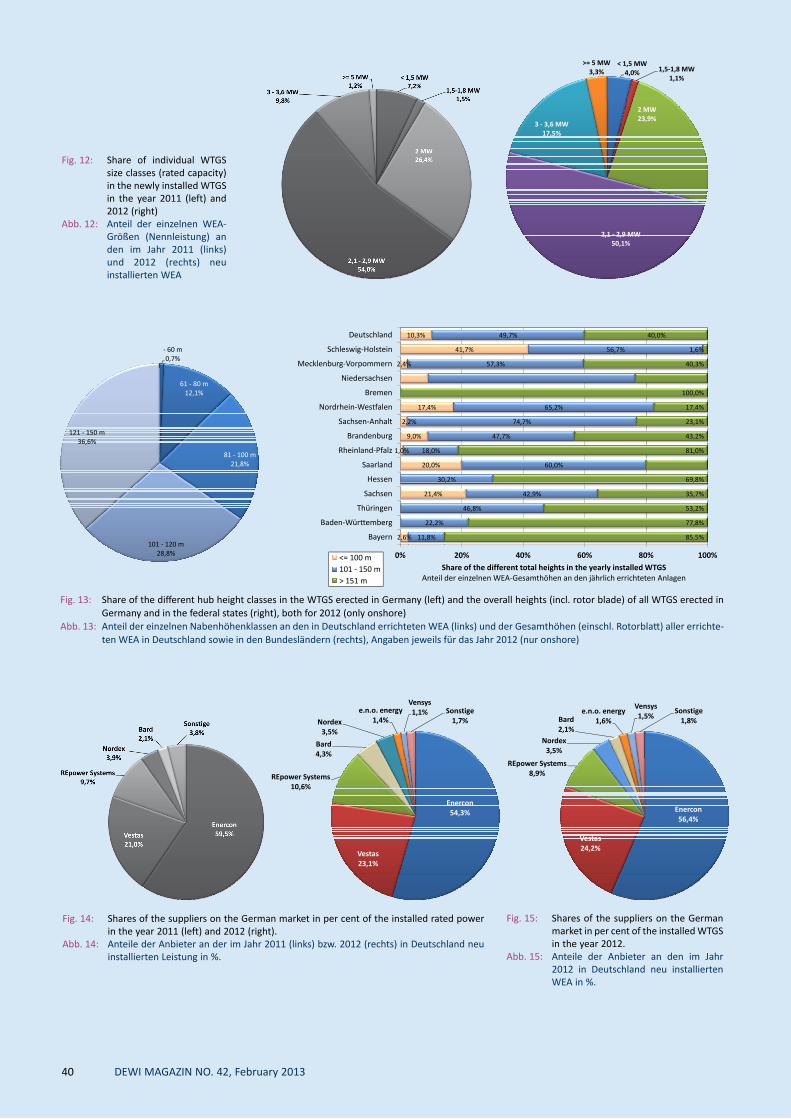
and in 2012 the share of this class has reached approx. 47 %. The biggest increase compared to the previous year could be noted for wind turbines with rotor diameters of 100 m and more. This share went up from approx. 14 % to 25 %, whereas the share classes under 80 m has decreased. Accordingly, the average installed power onshore increased from 2,224 kW (2011) to 2,377 kW (Fig. 11). This is due to an increasing number of wind turbines in the range above 3 MW, whose share in new installations has risen from approx. 11 % to almost 21 % (Fig. 12). Apart from the installed capacity and the rotor diameter another important feature of wind turbines is the hub height, and in 2012 approx. 65 % of the new installations had a hub height of over 100 m (Fig. 13, left). Another parameter is the total height of the wind turbine which consists of hub height plus rotor radius, and which in some regions is subject to restrictions. Fig. 13 (right) shows the shares of total heights of wind turbines per federal state, divided into 3 height classes based on the requirements for obstruction lighting.
Jahresenergieertrags aller WEA am Nettostromverbrauch bei rund 10,5 Prozent.
Markttendenzen bei der Anlagengröße
Von Jahr zu Jahr werden immer mehr Anlagen mit einem Rotordurchmesser von 90 m und größer in Deutschland errichtet (Abb. 9 und 10), im Jahr 2012 lag der Anteil bei rund 47 %. Die deutlichste Steigerung gegenüber dem Vorjahr liegt bei den Anlagen mit 100 m Rotordurchmesser und größer. Deren Anteil stieg von ca. 14 % auf 25 %, während der Anteil der Klassen kleiner 80 m gesunken ist. Dementsprechend stieg auch die durchschnittlich installierte Leistung im vergangenen Jahr im Bereich Onshore von 2.224 kW (2011) auf 2.377 kW (Abb. 11). Ursächlich hierfür ist die vermehrte Aufstellung von Anlagen im Bereich von über 3 MW, deren Anteil an den Neuerrichtungen von rund 11 % auf fast 21 % gestiegen ist (Abb. 12). Neben der installierten Leistung und dem Rotordurchmesser ist die Nabenhöhe ein weiteres wichtiges Krite
Fig. 9: Shares of different unit sizes in the annually in stalled power
Abb. 9: Anteile unterschiedlicher Anlagen größen klassen an der jährlich neu installierten Leistung
Fig. 11: Development of the average installed power per unitAbb. 11: Entwicklung der durchschnittlich installierten Leistung pro WEA
1.000
1.200
1.400
1.600
1.800
2.000
2.200
2.400
2.600
lled
pow
er p
er U
nit,
kW
/Uni
tal
liert
e Le
istu
ng p
ro A
nlag
e, k
W/W
EA
only/nur Onshore
0
200
400
600
800
Ave
rage
inst
alD
urch
schn
ittlic
he in
st
Fig. 10: Shares of different rotor diameters in the annually in stalled power
Abb. 10: Anteile unterschiedlicher Rotordurchmesser an der jährlich neu installierten Leistung
< 60 m4,0%
60 - 79 m9,3%
80 - 89 m39,8%
100 - 119 m21,9%
> 120 m3,3%
90 - 99 m21,7%
40 DEWI MAGAZIN NO. 42, February 2013
< 1,5 MW4,0% 1,5-1,8 MW
1,1%
2 MW23,9%
3 - 3,6 MW17,5%
>= 5 MW3,3%
2,1 - 2,9 MW50,1%
Fig. 12: Share of individual WTGS size classes (rated capacity) in the newly installed WTGS in the year 2011 (left) and 2012 (right)
Abb. 12: Anteil der einzelnen WEAGrößen (Nennleistung) an den im Jahr 2011 (links) und 2012 (rechts) neu installierten WEA
‐ 60 m0,7%
61 - 80 m12,1%
121 - 150 m36,6%
81 - 100 m21,8%
101 - 120 m28,8%28,8%
20,0%
1,0%
9,0%
2,2%
17,4%
2,4%
41,7%
10,3%
30,2%
60,0%
18,0%
47,7%
74,7%
65,2%
57,3%
56,7%
49,7%
69,8%
81,0%
43,2%
23,1%
17,4%
100,0%
40,3%
1,6%
40,0%
Hessen
Saarland
Rheinland-Pfalz
Brandenburg
Sachsen-Anhalt
Nordrhein-Westfalen
Bremen
Niedersachsen
Mecklenburg-Vorpommern
Schleswig-Holstein
Deutschland
2,6%
21,4%
11,8%
22,2%
46,8%
42,9%
,
85,5%
77,8%
53,2%
35,7%
,
0% 20% 40% 60% 80% 100%
Bayern
Baden-Württemberg
Thüringen
Sachsen
Share of the different total heights in the yearly installed WTGSAnteil der einzelnen WEA-Gesamthöhen an den jährlich errichteten Anlagen
<= 100 m101 - 150 m> 151 m
Fig. 13: Share of the different hub height classes in the WTGS erected in Germany (left) and the overall heights (incl. rotor blade) of all WTGS erected in Germany and in the federal states (right), both for 2012 (only onshore)
Abb. 13: Anteil der einzelnen Nabenhöhenklassen an den in Deutschland errichteten WEA (links) und der Gesamthöhen (einschl. Rotorblatt) aller errichteten WEA in Deutschland sowie in den Bundesländern (rechts), Angaben jeweils für das Jahr 2012 (nur onshore)
Fig. 15: Shares of the suppliers on the German market in per cent of the installed WTGS in the year 2012.
Abb. 15: Anteile der Anbieter an den im Jahr 2012 in Deutschland neu installierten WEA in %.
Enercon56 4%
REpower Systems8,9%
Nordex3,5%
Bard2,1%
e.n.o. energy1,6%
Vensys1,5%
Sonstige1,8%
56,4%
Vestas24,2%
Fig. 14: Shares of the suppliers on the German market in per cent of the installed rated power in the year 2011 (left) and 2012 (right).
Abb. 14: Anteile der Anbieter an der im Jahr 2011 (links) bzw. 2012 (rechts) in Deutschland neu installierten Leistung in %.
Enercon54,3%
REpower Systems10,6%
Bard4,3%
Nordex3,5%
e.n.o. energy1,4%
Vensys1,1% Sonstige
1,7%
Vestas23,1%
DEWI MAGAZIN NO. 42, February 2013 41
rium. Im Jahr 2012 hatten rund 65 % der errichteten Anlagen eine Nabenhöhe von über 100 m (Abb. 13 links). Wird zur Nabenhöhe noch der Rotorradius hinzugerechnet, so ergibt sich die Gesamthöhe der WEA, welche in einigen Gebieten Beschränkungen unterliegt. Die Abb. 13 (rechts) zeigt den Anteil der Gesamthöhen je Bundesland für die in 2012 errichteten Anlagen, unterteilt in 3 Höhenklassen auf Basis der Bestimmungen zur Kennzeichnung von Luftfahrthindernissen.
Marktanteile der Anbieter
Die Reihenfolge bei den Marktanteilen der WEAHersteller in Deutschland ist auf den ersten drei Plätzen im Vergleich zum Vorjahr gleich geblieben (Abb. 14), wobei Enercon etwas an Marktanteil verloren und Vestas sowie Repower sich leicht verbessern konnten. BARD erreichte 2012 den vierten Platz auf dem deutschen Markt und e.n.o. energy sowie Vensys sind nicht mehr unter den Sonstigen aufgeführt. Hier sind insgesamt 4 Hersteller zusammengefasst, wobei keiner mehr als 0,8 % Anteil an der Gesamtaufstellung (bezogen auf die installierte Leistung) hatte.
Market Shares of ManufacturersThe order of the market shares of wind turbine manufacturers in Germany is on the first three positions still held by the same companies as 2011 (Fig. 14), with ENERCON losing some of its market share, and Vestas and REpower improving slightly. In 2012 BARD reached the fourth position in the German market, and e.n.o. energy and Vensys are no longer among „Others“. Under this position 4 WT suppliers are combined, none of whom has more than a 0.8 % share in the total list (based on the new installed capacity).