March 2010 Wind Power, an Economic Option for Egypt? Yasser Sherif – Environics Based on : Clean Energy Investment in Developing Countries: Wind Power In Egypt IISD, Oct. 2009 (El Sobki, M. - Wooders, P. - Sherif, Y.) http://www.iisd.org/pdf/bali_2_copenhagen_egypt_wind.pdf
Transcript
March 2010
Wind Power, an Economic Option for Egypt?
Yasser Sherif – Environics
Based on :Clean Energy Investment in Developing Countries: Wind Power In Egypt
IISD, Oct. 2009 (El Sobki, M. - Wooders, P. - Sherif, Y.)
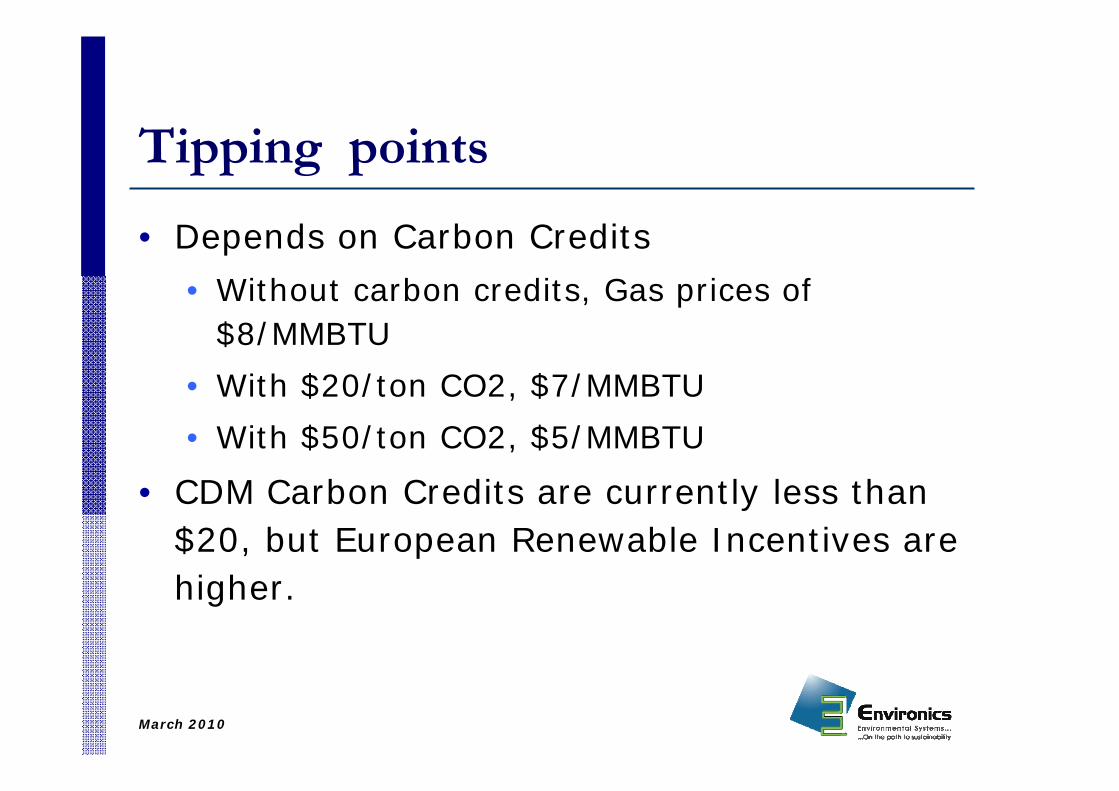
• Wind Resources are sufficiently mapped• Potential is clear but not effectively tapped• Government announcement of ambitious
plans• Large scale implementation needs step
change to private sector mode
March 2010
Satisfactory Developments
• First competitive bid is underway• Feed-in tariff, currently studied• First Private Development to satisfy own need
on track• Resident representatives of international
companies, visits of business development managers
• Local manufacturing capacity is being built claimed to potentially decrease capital costs by up to 25%
March 2010
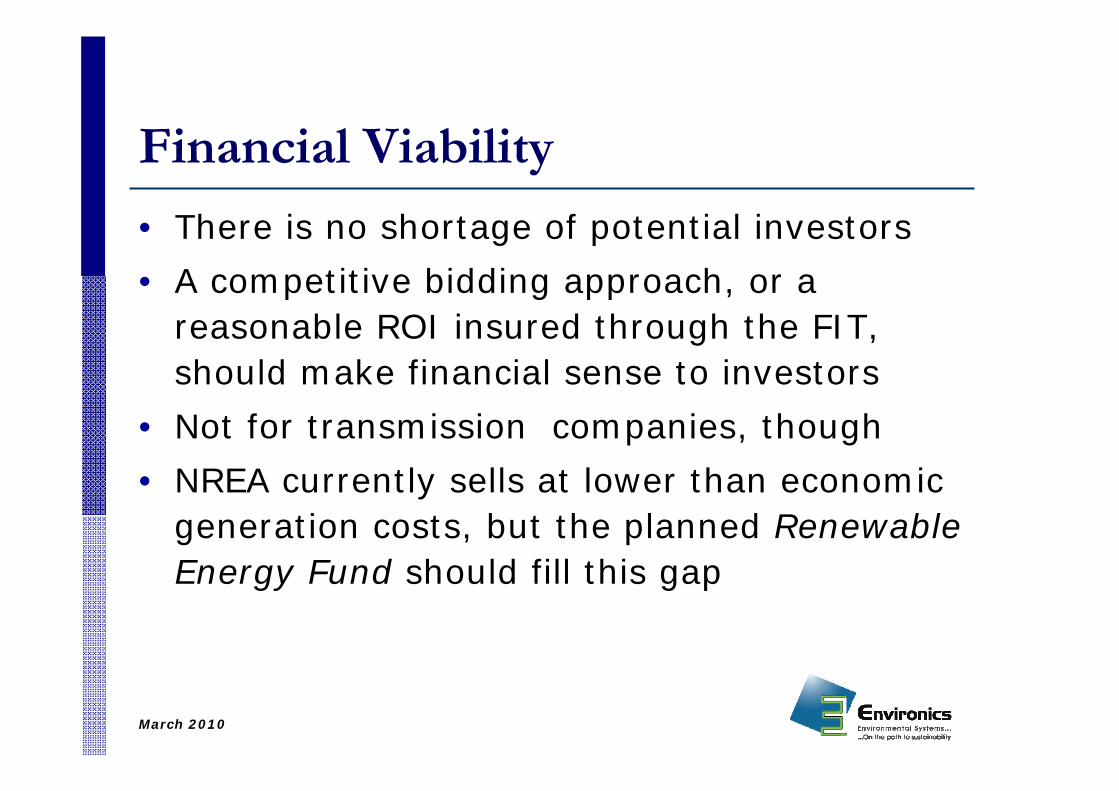
Financial Viability
• There is no shortage of potential investors• A competitive bidding approach, or a
reasonable ROI insured through the FIT, should make financial sense to investors
• Not for transmission companies, though• NREA currently sells at lower than economic
generation costs, but the planned Renewable Energy Fund should fill this gap
March 2010
Is Support Economically justified?
• Should be an ECONOMIC option for Egypt as a whole?
• Electricity is the service provided• Natural Gas is the primary energy source
potentially displaced by Wind Power• On which 90% of thermal electricity relies • 63% of local consumption by Electricity sector
• Combined Cycle Generation is the rising technology of choice
March 2010
Generating Capacity, 1980-2006
0
5000
10000
15000
20000
25000
1980 1985 1990 1995 2000 2005
Cap
acity
(MW
)
CombinedCycle GasTurbineGas Turbine
Steam Turbine
Hydro
Source: EEHC annual reports
March 2010
Economic Value of Natural Gas• Known to be subsidized and to residential
users ($ 0.5 to 1.5MMBTU) as well as to power generation
• Planned to be for $3/MMBTU for energy intensive industries, $ 1.66 to non-energy intensive industries, and 1.25 for others (PM Decrees in 2007/2008)
• The right reference is obviously not the Costs of production but rather the alternative uses ( at the margin) of Natural Gas not consumed by electricity generation
March 2010
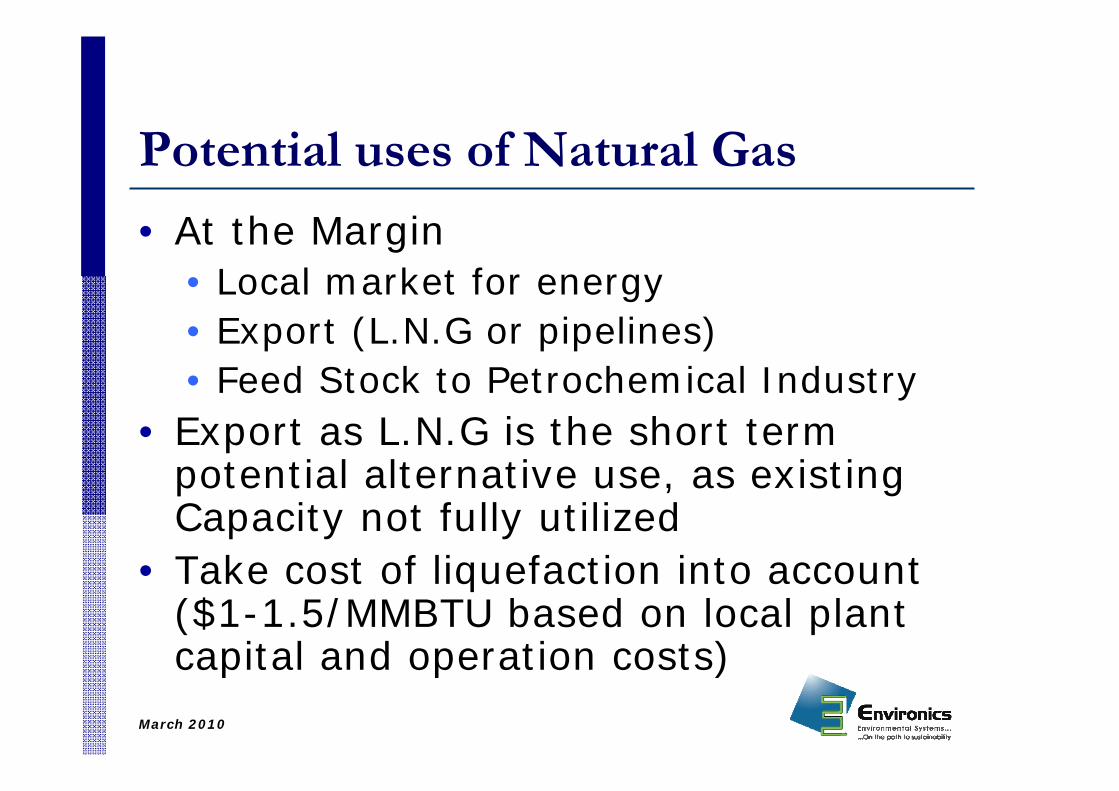
Potential uses of Natural Gas
• At the Margin• Local market for energy• Export (L.N.G or pipelines)• Feed Stock to Petrochemical Industry
• Export as L.N.G is the short term potential alternative use, as existing Capacity not fully utilized
• Take cost of liquefaction into account ($1-1.5/MMBTU based on local plant capital and operation costs)
March 2010
World Market Prices
• There is no single figure • No published figures for LNG export contracts• Figures reported to have been as low as
$2/MMBTU for some older contracts and reached $3-4.5/MMBTU for more recent ones.
• But opportunity Costs are related to future rather than historical prices.
March 2010
Volatile Market PricesMarch 2008- March 2009 March 2009- March 2010
Source: US Nymex-Henry Hub; 2009, 2010
March 2010
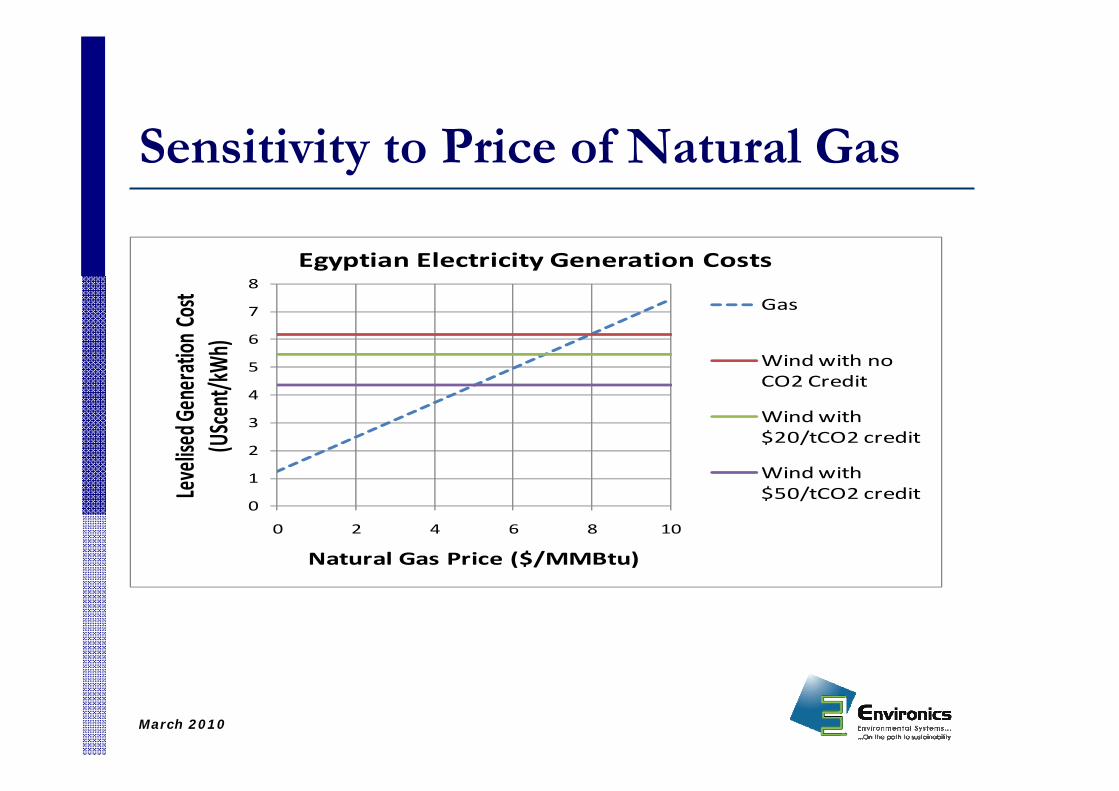
Wind & Natural Gas CCGTLevelised Cost Comparison
Wind GasDiscount Rate 10% 10%Economic Lifetime 20 20 years
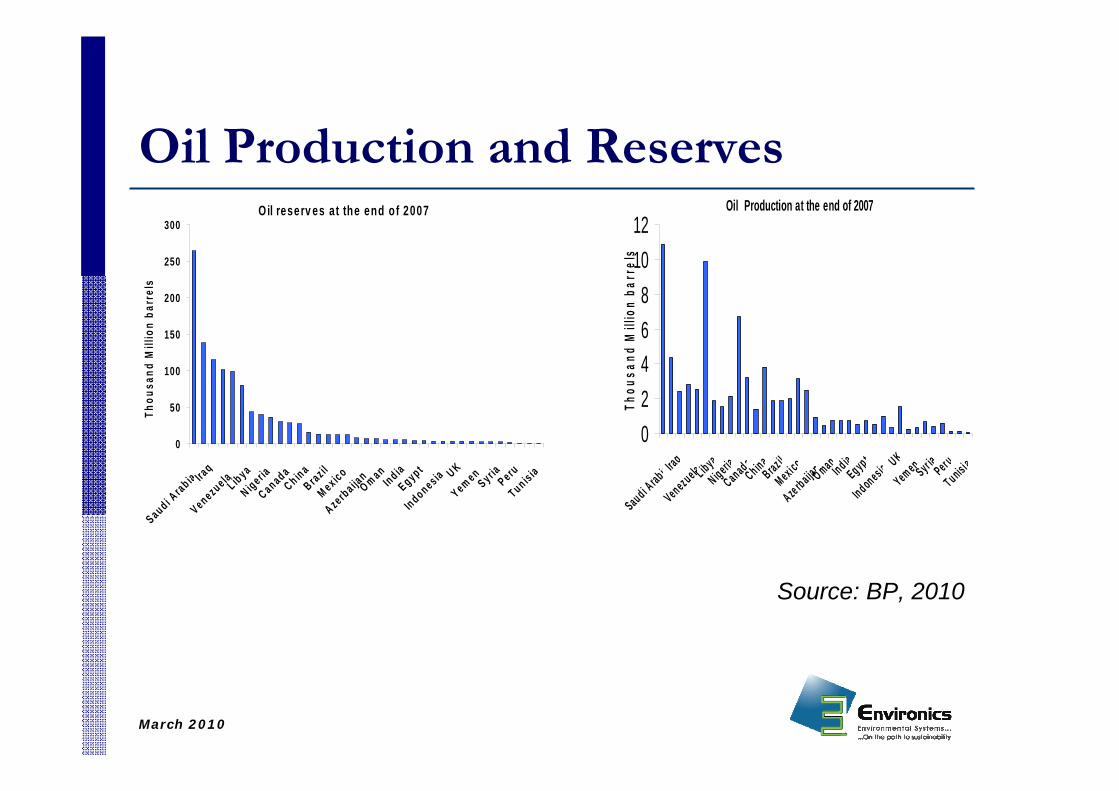
• Oil Production/Reserves Ratio: 0.06 (compared to World Average of 0.02)
• NG Production/ Reserves Ratio:0.028 (compared to World Average of 0.01)
• As opposed to Oil, Natural Gas Production Expected to double in 2030 while demand for Electricity should triple.
• If trend continues, almost all Natural Gas produced should go to power generation
March 2010
A Change in Perspective
• Given the recent, and potential future, price shocks…. And a thinning local resource buffer
• The life of Egypt’s non-renewable resources has to be expanded
• The question becomes not WHETHER to develop wind resources but HOW to improve the economics of its development• Tap on European Renewable Incentives ?• Reduce capital costs ? Local Manufacturing?• ….Raise the REAL opportunity cost of NG ?