41
Part November 2021 WINNING STRATEGIES FOR REACHING SNAP SHOPPERS Discovering Pockets of Demand 18
Part November
2021
WINNING STRATEGIES FOR REACHING SNAP SHOPPERS
Discovering Pockets of Demand 18

2© 2021 Information Resources Inc. (IRI). Confidential and Proprietary.
EXECUTIVE SUMMARYParticipants in the Supplemental Nutrition Assistance Program (SNAP) represent 16% (22 million) of U.S. households and upward of 44 million people. SNAP shoppers account for 12% of total omnichannel dollar sales, but remarkably, have driven 19% of total store dollar sales growth vs. 2% of growth driven by non-SNAP shoppers. The 15% SNAP boost that recipients began receiving in December 2020 expired in September but is partially offset by the increase to the Thrifty Food Plan to reflect the USDA’s revised estimate of the cost of a nutritious, practical and cost-effective diet. Despite the increase in TFP, changes to SNAP benefits will result in a $3 billion reduction in monthly SNAP purchases.
SNAP recipients are multi-dimensional, skewing low-income but crossing generations. A majority are renters, single or divorced, and have varying household sizes. Benefits depend on the size of the household, income and *expenses, and guidelines may vary by state.
WINNING STRATEGIES TO REACH SNAP SHOPPERSEducation• Make health and well-being resources easy to find on websites and signage in stores• Link to SNAP-Ed resources• Teach how to shop pack sizes to reduce costs per volume• Provide and educate on the benefits of imperfect fruits and vegetables • Promote store tour videos that teach budget meal shoppingBundled Occasion-Based Solutions• Showcase budget-friendly occasion-based solutions• Demonstrate how products support specific health issues• Tie budget-friendly recipes to either a total ~price and/or “one click” add to cart• Showcase and sample healthy lower-cost “baskets”Innovation• Innovate to align to the budget-minded consumer (e.g., tiered options)Engagement• Establish and nurture retailer and CPG collaboration to keep loyal SNAP shoppers in the respective franchises• Drive engagement digitally and with short videos • Support SNAP shoppers with list building and promotions earlier in the month, and by waiving online fees to help them
stretch their dollars
*Includes mortgage or rent, utilities, and childcare or elder care needed to allow someone to work.

3© 2021 Information Resources Inc. (IRI). Confidential and Proprietary.

4© 2021 Information Resources Inc. (IRI). Confidential and Proprietary.Source: U.S. Department of Labor and https://www.fns.usda.gov/pd/supplemental-nutrition-assistance-program-snap https://www.census.gov/popclock @ population at 332M
SNAP Participants
SNAP Participants as a % of Total U.S. Population
Increase of SNAP Participants from 2020
SNAP Households
Increase of SNAP HHs from 2020
SNAP Households as a % of Total U.S. Households

© 2021 Information Resources Inc. (IRI). Confidential and Proprietary. 5
0.0
2.0
4.0
6.0
8.0
10.0
12.0
14.0
16.0
0.0
10.0
20.0
30.0
40.0
50.0
60.0
70.0
Une
mpl
oym
ent R
ate
Rec
ipie
nts
(MM
)
SNAP Recipients Unemployment Rate
SNAP Historically Correlated with Unemployment, but Factors Like Household Size, Income and Expenses* Are Impacting Participation SNAP Participation and Unemployment
RECESSION RECESSION
COVID-19
*Includes mortgage or rent, utilities and childcare or elder care needed to allow someone to work
Source: U.S. Department of Labor and https://www.fns.usda.gov/pd/supplemental-nutrition-assistance-program-snap

6© 2021 Information Resources Inc. (IRI). Confidential and Proprietary.
WHO IS THE SNAP SHOPPER?
SNAP Shoppers Are Multidimensional – Low Income, Crossing Generations; a Majority Rent, Are Single or Divorced and Have Varying Household Sizes
Millennials (138 Index)35%
Boomers (82 Index)28%
White(88 Index)
67%Compared to % of Non-SNAP
21% 17%Black
(187 Index)Hispanic
(136 Index) Single or Divorced54% (194 Index)
Have HH Income Less Than $15K
34%(733 Index)
Live in Rural Areas
37% (131 Index)Do Not Own a Home
61%(254 Index)
Source: IRI Consumer Network™ Total US – All Outlets, 52 WE9/5/2021 / Demographics of the SNAP Shopper (Index vs Non-SNAP HH)
5+ Person HHs18% (179 Index)
1 Person HHs
31%(120 Index)

7© 2021 Information Resources Inc. (IRI). Confidential and Proprietary.
SNAP Benefits Are Applied to Food Products, With the Exception of Prepared and Hot Foods, as Well as Beverage Alcohol
Source: https://www.fns.usda.gov/snap/eligible-food-items
Any Food for the Household, Such As:• Fruits, vegetables• Meat, poultry, fish• Dairy products• Breads, cereals
• Other foods like snacks, non-alcoholic beverages
• Seeds and plants
Households CANNOT Use SNAP Benefits to Buy:• Beer, wine, liquor, cigarettes, tobacco• Vitamins, medicines, supplements• Live animals (except shellfish,
fish from water, etc.)• Immediate-consumption
prepared foods• Hot foods
• Nonedible items like pet foods, cleaning supplies, paper products, other household supplies, hygiene items, cosmetics
8© 2021 Information Resources Inc. (IRI). Confidential and Proprietary.
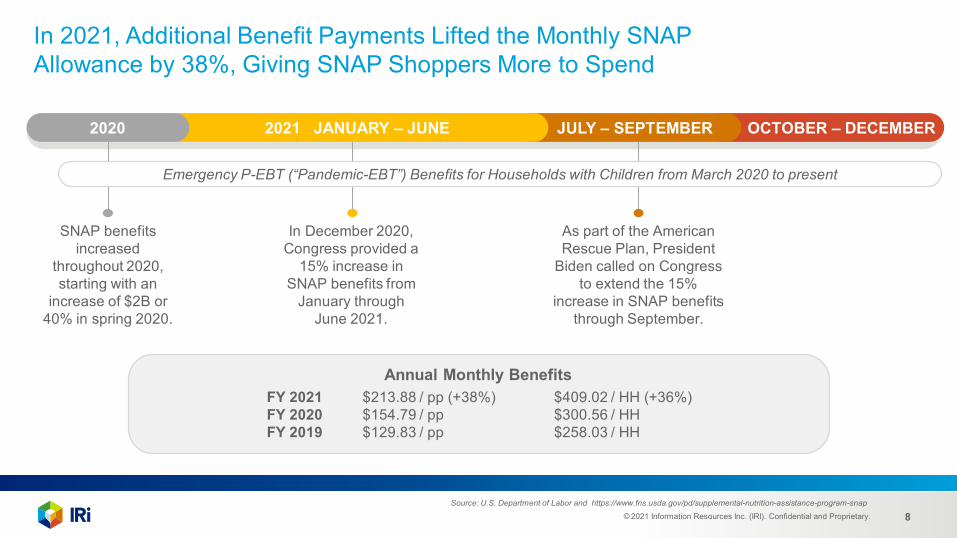
In 2021, Additional Benefit Payments Lifted the Monthly SNAP Allowance by 38%, Giving SNAP Shoppers More to Spend
Source: U.S. Department of Labor and https://www.fns.usda.gov/pd/supplemental-nutrition-assistance-program-snap
OCTOBER – DECEMBER
As part of the American Rescue Plan, President
Biden called on Congress to extend the 15%
increase in SNAP benefits through September.
JULY – SEPTEMBER
In December 2020, Congress provided a
15% increase in SNAP benefits from
January through June 2021.
2021 JANUARY – JUNE
SNAP benefits increased
throughout 2020, starting with an
increase of $2B or 40% in spring 2020.
2020
Emergency P-EBT (“Pandemic-EBT”) Benefits for Households with Children from March 2020 to present
Annual Monthly BenefitsFY 2021 $213.88 / pp (+38%) $409.02 / HH (+36%)FY 2020 $154.79 / pp $300.56 / HHFY 2019 $129.83 / pp $258.03 / HH
9© 2021 Information Resources Inc. (IRI). Confidential and Proprietary.
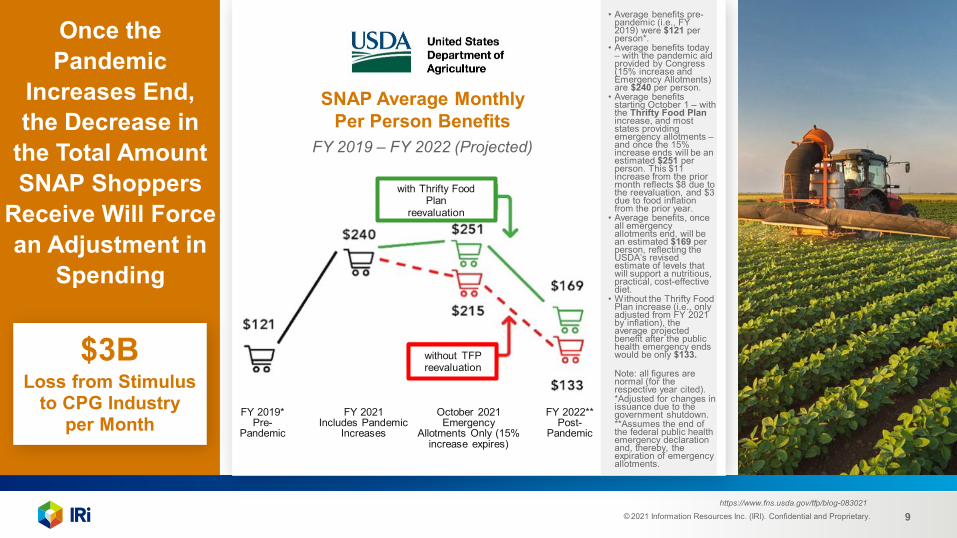
• Average benefits pre-pandemic (i.e., FY 2019) were $121 per person*.
• Average benefits today – with the pandemic aid provided by Congress (15% increase and Emergency Allotments) are $240 per person.
• Average benefits starting October 1 – with the Thrifty Food Plan increase, and most states providing emergency allotments –and once the 15% increase ends will be an estimated $251 per person. This $11 increase from the prior month reflects $8 due to the reevaluation, and $3 due to food inflation from the prior year.
• Average benefits, once all emergency allotments end, will be an estimated $169 per person, reflecting the USDA’s revised estimate of levels that will support a nutritious, practical, cost-effective diet.
• Without the Thrifty Food Plan increase (i.e., only adjusted from FY 2021 by inflation), the average projected benefit after the public health emergency ends would be only $133.
Note: all figures are normal (for the respective year cited). *Adjusted for changes in issuance due to the government shutdown.**Assumes the end of the federal public health emergency declaration and, thereby, the expiration of emergency allotments.
Once the Pandemic
Increases End, the Decrease in
the Total Amount SNAP Shoppers
Receive Will Force an Adjustment in
Spending
https://www.fns.usda.gov/tfp/blog-083021
SNAP Average Monthly Per Person Benefits
FY 2019 – FY 2022 (Projected)
FY 2019*Pre-
Pandemic
FY 2021Includes Pandemic
Increases
October 2021Emergency
Allotments Only (15% increase expires)
FY 2022**Post-
Pandemic
without TFP reevaluation
with Thrifty Food Plan
reevaluation
Loss from Stimulus to CPG Industry
per Month
$3B

10© 2021 Information Resources Inc. (IRI). Confidential and Proprietary.

11© 2021 Information Resources Inc. (IRI). Confidential and Proprietary.Source: IRI Consumer Network™, Total US – All Outlets, 52 weeks ending 9/5/21
Total Store 2021 $ Share % Change
Total U.S. 3%
SNAP 12% 19%
Non-SNAP 88% 2%
SNAP Shoppers Represent
Dollar Share, Growing at
and Responsible for Driving Total
Store Growth

12© 2021 Information Resources Inc. (IRI). Confidential and Proprietary.Source: IRI Consumer Network™, Total US – All Outlets
0
20
40
60
80
100
120
52 WE December 2019 52 WE December 2020 52 WE September 2021
$78B $93B
SNAP $ SPEND
$104B+19%+11%As We Look
at Total F&B (Including Perimeter
Random Weight Products),
SNAP Dollars Have Grown
Over the Past Two Years
33%

13© 2021 Information Resources Inc. (IRI). Confidential and Proprietary.
Online Has Gained 2 Share Points of SNAP Shopper F&B Dollar Sales, and Double-Digit Growth Has Been Realized by Club, Drug, All Other (e.g., Specialty, etc.) and OnlineTotal SNAP Food & Beverage Dollar Sales
Source: IRI Consumer Network™, Total US – All Outlets, 52 Weeks Ending 9/5/21
Food Mass Club All Other
48% 8% 25% 9% 7% 13% 7% 20%
Online Dollar Convenience Drug
5% 68% 4% -4% 2% 1% 2% 17%
Share of Omni $ % Change

14© 2021 Information Resources Inc. (IRI). Confidential and Proprietary.
SNAP Shoppers Have Spent More on Random Weight Fresh Items Across All Channels, Except Convenience, Indicating Healthier and More Balanced Baskets Total SNAP Perimeter Random Weight Dollar Sales
Source: IRI Consumer Network™, Total US – All Outlets, 52 Weeks Ending 9/5/21. Total Omni Share doesn’t equal 100 due to rounding.
Food Mass Club All Other
58% 9% 16% 8% 7% 8% 13% 21%
Online Dollar Convenience Drug
4% 71% 0.4% 0.9% 2% -9% 0% 56%
Share of Omni $ % Change

15© 2021 Information Resources Inc. (IRI). Confidential and Proprietary.
+11% +21% +19% +10% +13%
Dinner Beverages Snacks Breakfast Liquor
38% 17% 16% 6% 6%
Dollar Sales % Change vs. YA
% of Total F&B Spend
+26% +12% -1% +37% +4%
Deli Prepared Lunch Baking Desserts Baby
5% 5% 3% 1% 2%
Dollar Sales % Change vs. YA
% of Total F&B Spend
TOTAL F&B Dollar Sales % Change vs. YA. +14%
YTD SNAP Consumers Continue to Eat Meals at Home;
Meal Occasions Represent 49% of SNAP Dollars and Drive Double-Digit Growth Across the
Majority of Occasions
Source: IRI Consumer Network™, Total US – All Outlets, YTD 2021 Weeks Ending 9/5/21
16© 2021 Information Resources Inc. (IRI). Confidential and Proprietary.
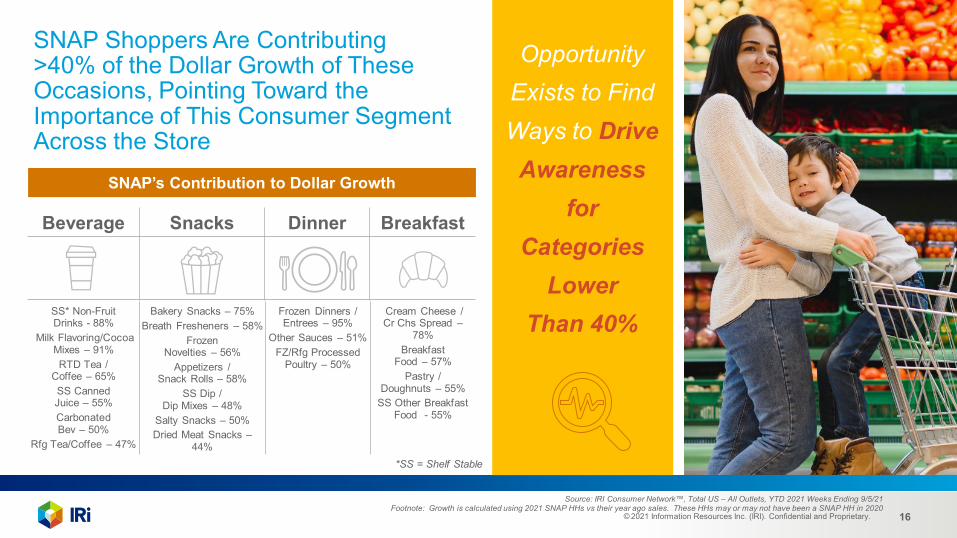
SNAP Shoppers Are Contributing >40% of the Dollar Growth of These Occasions, Pointing Toward the Importance of This Consumer Segment Across the Store
Opportunity Exists to Find Ways to Drive Awareness
for Categories
Lower Than 40%
*SS = Shelf Stable
Source: IRI Consumer Network™, Total US – All Outlets, YTD 2021 Weeks Ending 9/5/21
SNAP’s Contribution to Dollar Growth
Beverage Snacks Dinner Breakfast
SS* Non-Fruit Drinks - 88%
Milk Flavoring/Cocoa Mixes – 91%RTD Tea /
Coffee – 65%SS Canned Juice – 55%Carbonated Bev – 50%
Rfg Tea/Coffee – 47%
Bakery Snacks – 75%Breath Fresheners – 58%
Frozen Novelties – 56%
Appetizers / Snack Rolls – 58%
SS Dip / Dip Mixes – 48%
Salty Snacks – 50%Dried Meat Snacks –
44%
Frozen Dinners / Entrees – 95%
Other Sauces – 51%FZ/Rfg Processed
Poultry – 50%
Cream Cheese / Cr Chs Spread –
78%Breakfast
Food – 57%Pastry /
Doughnuts – 55%SS Other Breakfast
Food - 55%
Footnote: Growth is calculated using 2021 SNAP HHs vs their year ago sales. These HHs may or may not have been a SNAP HH in 2020

17© 2021 Information Resources Inc. (IRI). Confidential and Proprietary.
F&B Non-SNAP HOUSEHOLDS$ Sales / Total U.S. / All Outlets
F&B SNAP HOUSEHOLDS$ Sales / Total U.S. / All Outlets
Overall, SNAP Shoppers Prefer National Brands, with 83% of Occasion Dollar Sales Being National Brands – Slightly More than Non-SNAP
17%
83%
National Brand
Private Label
20%
80%
National Brand
Private Label
Source: IRI Consumer Network™, Total US – All Outlets, YTD 2021 Weeks Ending 9/5/21

18© 2021 Information Resources Inc. (IRI). Confidential and Proprietary.
SNAP Shoppers Account for 40% or More of Private Label Purchases Across Many Categories
Source: IRI Consumer Network™, Total US – All Outlets, YTD 2021 Weeks Ending 9/5/21
RFG Pizza Pies & Cakes RFG Meat FZ Fruit Fresh Eggs RFG Cheesecakes
FZ Seafood Baking Nuts Sugar RFG Whipped Toppings Milk Vinegar Natural Cheese
Ice Cream Cones / Mixes
Butter / Butter Blends
FZ Plain Vegetables
Other Snacks
FZ Corn onthe Cob
Shortening& Oil
RFG Baked Goods

19© 2021 Information Resources Inc. (IRI). Confidential and Proprietary.
Beverage Snacks Dinner Breakfast Lunch Baking
87% 13% 91% 9% 77% 23% 77% 23% 75% 25% 71% 29%
SNAP Shoppers Are Also Important to National Brands, Which Are Gaining Share
National Brands Private Label
% Share of Dollar Sales by Eating Occasion
Source: IRI Consumer Network™, Total US – All Outlets, YTD 2021 Weeks Ending 9/5/21
National Brands vs. Private Label, Share Change vs. YAGO
+3.1 pts +1.5 pts +2.7 pts +1.5 pts +3.8 pts +2.1 pts
© 2021 Information Resources Inc. (IRI). Confidential and Proprietary. 20
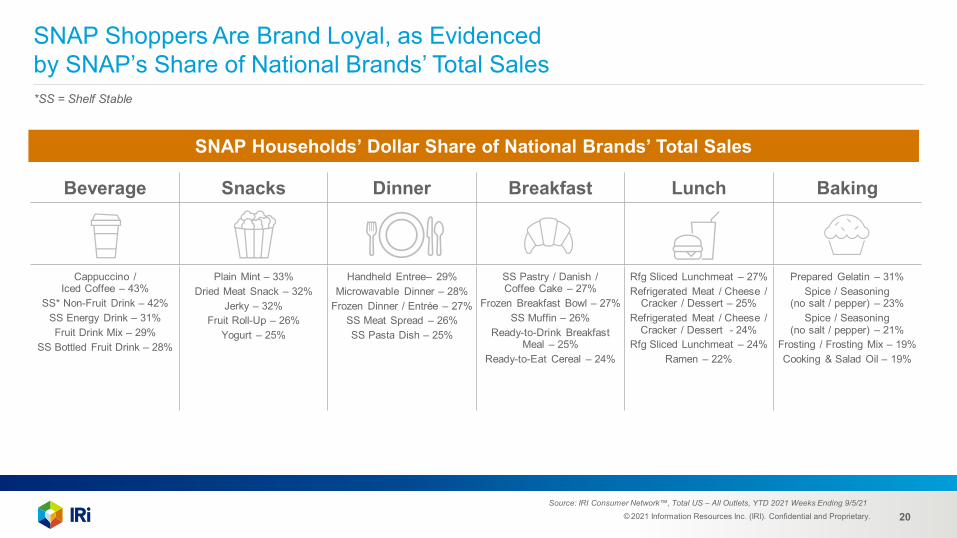
SNAP Shoppers Are Brand Loyal, as Evidenced by SNAP’s Share of National Brands’ Total Sales*SS = Shelf Stable
Beverage Snacks Dinner Breakfast Lunch Baking
SNAP Households’ Dollar Share of National Brands’ Total Sales
Cappuccino / Iced Coffee – 43%
SS* Non-Fruit Drink – 42%SS Energy Drink – 31%Fruit Drink Mix – 29%
SS Bottled Fruit Drink – 28%
Plain Mint – 33%Dried Meat Snack – 32%
Jerky – 32%Fruit Roll-Up – 26%
Yogurt – 25%
Handheld Entree– 29%Microwavable Dinner – 28%
Frozen Dinner / Entrée – 27%SS Meat Spread – 26%SS Pasta Dish – 25%
SS Pastry / Danish / Coffee Cake – 27%
Frozen Breakfast Bowl – 27%SS Muffin – 26%
Ready-to-Drink Breakfast Meal – 25%
Ready-to-Eat Cereal – 24%
Rfg Sliced Lunchmeat – 27%Refrigerated Meat / Cheese /
Cracker / Dessert – 25%Refrigerated Meat / Cheese /
Cracker / Dessert - 24%Rfg Sliced Lunchmeat – 24%
Ramen – 22%
Prepared Gelatin – 31%Spice / Seasoning
(no salt / pepper) – 23%Spice / Seasoning
(no salt / pepper) – 21%Frosting / Frosting Mix – 19%Cooking & Salad Oil – 19%
Source: IRI Consumer Network™, Total US – All Outlets, YTD 2021 Weeks Ending 9/5/21
21© 2021 Information Resources Inc. (IRI). Confidential and Proprietary.

22© 2021 Information Resources Inc. (IRI). Confidential and Proprietary.
YTD 2021, SNAP Spend Over Indexes in Dollar Share of Dollar, Drug, Online and Mass ChannelsSNAP Household Dollar Share of Channel and Index to All Outlet Average
Index 120+ (Skew Toward)
Index 80 – 120 (Average)
Index < 80 (Skew Away)
Source: IRI Consumer Network™, Total US – All Outlets, YTD 2021 Weeks Ending 9/5/21. **Walmart included in Channel Aggregate
Share Index
Total U.S. - All Outlets 12%
Food 11% 88
Mass 16% 131
Club 8% 61
Internet 20% 160
Specialty Stores 11% 91
Dollar 30% 243
Drug 16% 130

23© 2021 Information Resources Inc. (IRI). Confidential and Proprietary.
The SNAP Online Purchasing Program Is Active in 47 States and the District of Columbia, with 68 Retailers Participating
Source: https://www.fns.usda.gov/snap/online-purchasing-pilot _as of October 2021
24© 2021 Information Resources Inc. (IRI). Confidential and Proprietary.
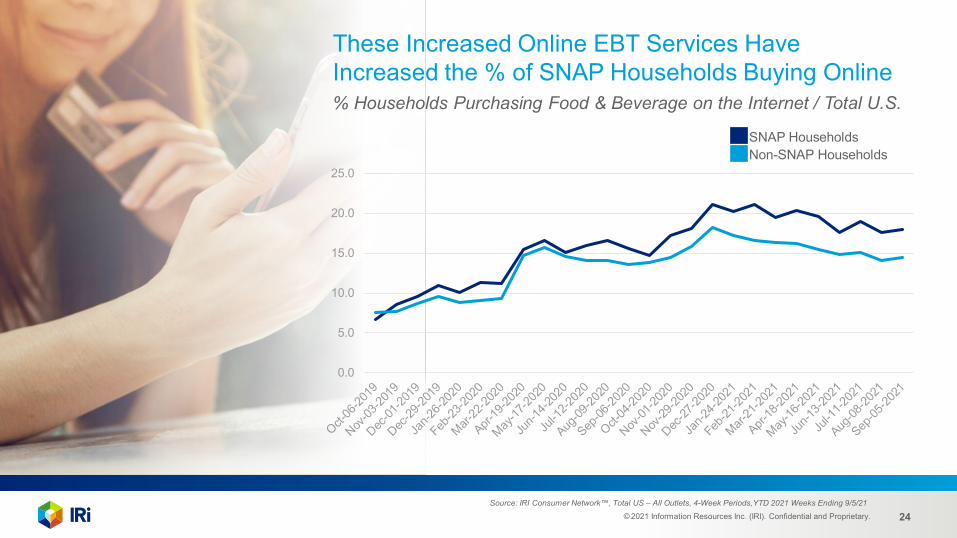
These Increased Online EBT Services Have Increased the % of SNAP Households Buying Online% Households Purchasing Food & Beverage on the Internet / Total U.S.
0.0
5.0
10.0
15.0
20.0
25.0
SNAP HouseholdsNon-SNAP Households
Source: IRI Consumer Network™, Total US – All Outlets, 4-Week Periods,YTD 2021 Weeks Ending 9/5/21
25© 2021 Information Resources Inc. (IRI). Confidential and Proprietary.
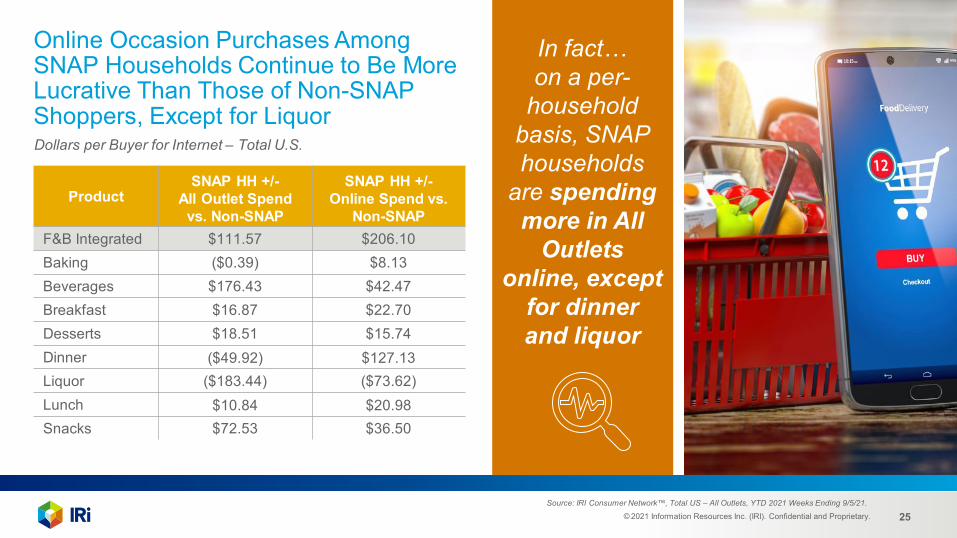
Online Occasion Purchases Among SNAP Households Continue to Be More Lucrative Than Those of Non-SNAP Shoppers, Except for Liquor
In fact…on a per-
household basis, SNAP households
are spending more in All
Outlets online, except
for dinner and liquor
ProductSNAP HH +/-
All Outlet Spend vs. Non-SNAP
SNAP HH +/-Online Spend vs.
Non-SNAPF&B Integrated $111.57 $206.10Baking ($0.39) $8.13Beverages $176.43 $42.47Breakfast $16.87 $22.70Desserts $18.51 $15.74Dinner ($49.92) $127.13Liquor ($183.44) ($73.62)Lunch $10.84 $20.98Snacks $72.53 $36.50
Dollars per Buyer for Internet – Total U.S.
Source: IRI Consumer Network™, Total US – All Outlets, YTD 2021 Weeks Ending 9/5/21.
26© 2021 Information Resources Inc. (IRI). Confidential and Proprietary.
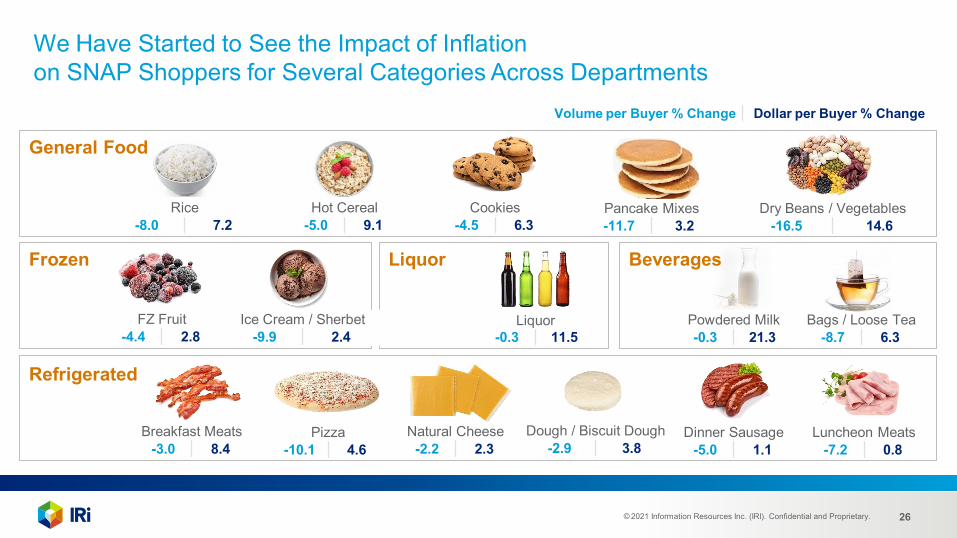
We Have Started to See the Impact of Inflation on SNAP Shoppers for Several Categories Across Departments
Refrigerated
Frozen
General Food
Liquor
Liquor-0.3 11.5
Breakfast Meats-3.0 8.4
Pizza-10.1 4.6
Natural Cheese-2.2 2.3
Dough / Biscuit Dough-2.9 3.8
Dinner Sausage-5.0 1.1
Luncheon Meats-7.2 0.8
Rice-8.0 7.2
Cookies-4.5 6.3
Pancake Mixes-11.7 3.2
Dry Beans / Vegetables-16.5 14.6
FZ Fruit-4.4 2.8
Ice Cream / Sherbet-9.9 2.4
Powdered Milk-0.3 21.3
Bags / Loose Tea-8.7 6.3
Volume per Buyer % Change Dollar per Buyer % Change
Hot Cereal-5.0 9.1
Beverages

27© 2021 Information Resources Inc. (IRI). Confidential and Proprietary.
Opportunities Exist to Provide SNAP Shoppers Options to Combat Inflation
Provide Pack Size Options to Reduce Costs per Volume
Provide Bundled Occasion-Based Solutions That Provide Economies of Scale
Imperfect Fruits and Vegetables at Reduced Prices vs. “Perfect’
Innovate to Align with the Budget-Minded Consumer

28© 2021 Information Resources Inc. (IRI). Confidential and Proprietary.

29© 2021 Information Resources Inc. (IRI). Confidential and Proprietary.
of SNAP Shoppers state that
Health & Wellness is a priority.
state they often check nutrition labels
and look for non-GMO and/or organic
options, etc.
try to make healthy choices but theydon’t have time to agonize over nutrition labels.
SNAP Shopper
Purchasing Habits and Priorities

30© 2021 Information Resources Inc. (IRI). Confidential and Proprietary.
According to the USDA, SNAP Participants Have Many Barriers to Eating Healthy
Source: USDA Food & Nutrition Service U.S. Department of Agriculture
report facing challenges to a healthy diet
report cost of healthy foods as a barrier
SNAP participants who struggle to afford healthy foods are >2x as likely to experience food insecurity
31© 2021 Information Resources Inc. (IRI). Confidential and Proprietary.
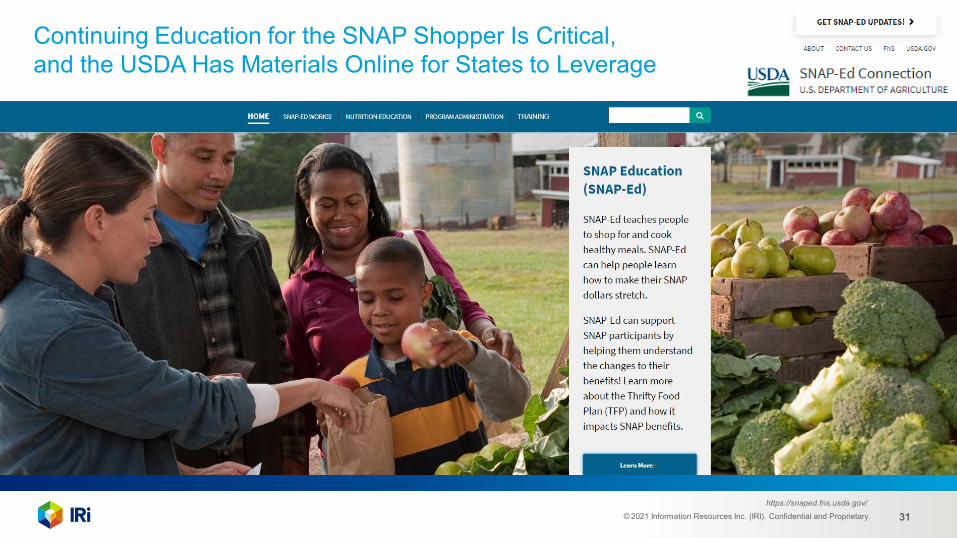
Continuing Education for the SNAP Shopper Is Critical, and the USDA Has Materials Online for States to Leverage
https://snaped.fns.usda.gov/

32© 2021 Information Resources Inc. (IRI). Confidential and Proprietary.https://snaped.fns.usda.gov/success-stories/transitioning-cooking-classes-virtual-audience
Resources Include Cooking Programs with Evaluation Results, Like the SNAP-Ed Cooking Programs at North Carolina’s Poe Center for Health Education
Program Evaluation Results
100% reported enjoying the taste
of the food prepared
91% reported planning to make
the food again

33© 2021 Information Resources Inc. (IRI). Confidential and Proprietary.
• The Dish is a series of 25 short, interactive eLearning micro-lessons. Each lesson helps to improve the health, well-being and resilience of families.
• These micro-lessons offer life tips for users to plan meals, save money, and shop and eat healthier.
• They are self-paced and easily viewed on a smartphone, encouraging learning at the point of decision making.
https://snaped.fns.usda.gov/success-stories/dish-real-talk-about-food
Some States Leverage Digital Media to Provide
Tips, Tricks, Recipes and More!
Nebraska and South Dakota Launched
The Dish:
Real Talk About Food

34© 2021 Information Resources Inc. (IRI). Confidential and Proprietary.
Retailers Are Leveraging a
Variety of Programs to Assist SNAP Consumers
on Their Health and Well-Being
Journey

35© 2021 Information Resources Inc. (IRI). Confidential and Proprietary.
Leverage Strategies to Teach Health and Wellness to School-Aged Children

36© 2021 Information Resources Inc. (IRI). Confidential and Proprietary.
37© 2021 Information Resources Inc. (IRI). Confidential and Proprietary.
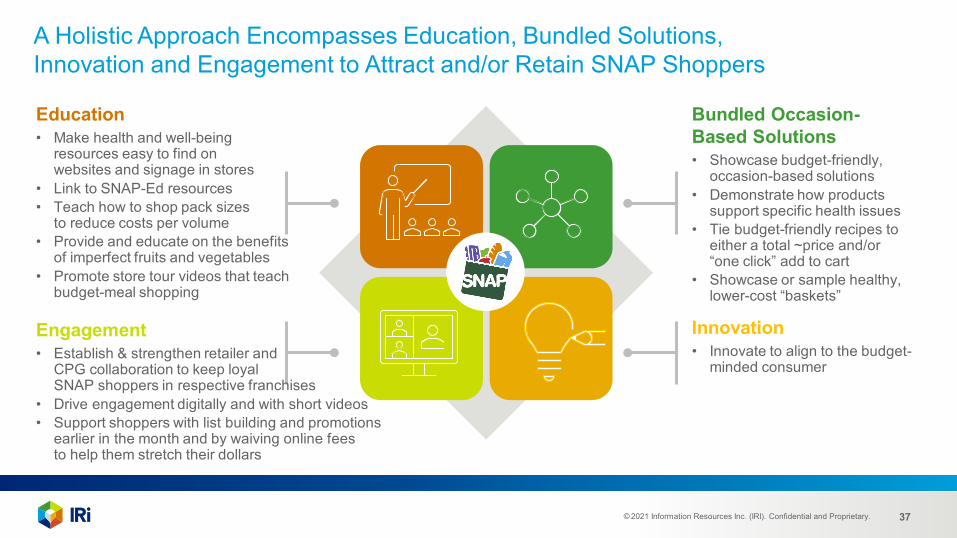
A Holistic Approach Encompasses Education, Bundled Solutions, Innovation and Engagement to Attract and/or Retain SNAP Shoppers
Education• Make health and well-being
resources easy to find on websites and signage in stores
• Link to SNAP-Ed resources• Teach how to shop pack sizes
to reduce costs per volume• Provide and educate on the benefits
of imperfect fruits and vegetables • Promote store tour videos that teach
budget-meal shopping
Engagement• Establish & strengthen retailer and
CPG collaboration to keep loyal SNAP shoppers in respective franchises
• Drive engagement digitally and with short videos • Support shoppers with list building and promotions
earlier in the month and by waiving online fees to help them stretch their dollars
Bundled Occasion-Based Solutions• Showcase budget-friendly,
occasion-based solutions• Demonstrate how products
support specific health issues• Tie budget-friendly recipes to
either a total ~price and/or “one click” add to cart
• Showcase or sample healthy, lower-cost “baskets”
Innovation• Innovate to align to the budget-
minded consumer

38© 2021 Information Resources Inc. (IRI). Confidential and Proprietary.
The IRI CPG Demand Index™ provides a standard metric for tracking changes in spending on consumer packaged goods. U.S. Demand Index™ Forecasts are delivered through a proprietary, fully automated forecasting solution that anticipates consumer demand.Channel Shift Index™ provides a standard metric for tracking changes (migration) in spending on consumer packaged goods across select channels. The IRI E-Commerce Demand Index™ provides a standard metric for tracking changes in spending on consumer packaged goods purchased online. Inflation Tracker™ provides the well-known price per unit metric for tracking changes in pricing of consumer packaged goods. Supply Index™ provides a standard metric for tracking changes in product availability (i.e., in-stock rates) in stores for consumer packaged goods.Out-of-Stock Levels for Top-Selling Subcategories by market area in the U.S.Top U.S. Topics from IRI Social Pulse™
CPG Economic IndicatorsAccess IRI’s industry-standard metrics for consumer product demand and supply during the pandemic, our CPG inflation tracker and the latest data on category trends, out-of-stock levels, consumer sentiment and more.
Demand Index™ U.S. Demand Index™ Forecasts
Channel Shift Index™
E-Commerce Demand Index™
Inflation Tracker™ Supply Index™ Out-of-Stock Levels
for SubcategoriesU.S. Topics from IRI Social Pulse™

39© 2021 Information Resources Inc. (IRI). Confidential and Proprietary.
C-Suite Conversation Series on COVID-19-Related Topics 10 conversations recorded to date!
IRI Thought Leadership Delivers Insightful, Provocative Insights
Industry-Leading Client Engagement and Thought Leadership, Reshaping How Our Client Executives Perceive Us40 reports published to date!

40© 2021 Information Resources Inc. (IRI). Confidential and Proprietary.
Registered Users Get New Thought Leadership from IRI’s Research, Data & Analytics Experts
www.iriworldwide.com/en-US/Insights/Subscribe
Be the First to Know

© 2021 Information Resources Inc. (IRI). Confidential and Proprietary. 41© 2021 Information Resources Inc. (IRI).
Confidential and Proprietary. 41
CONTACT US FOR MORE
INFORMATION
IRI Global Headquarters203 N. LaSalle St., Suite 1500Chicago, IL [email protected]+1 312.726.1221
Follow IRI on Twitter: @IRIworldwide


