1 Wired voters: Internet Exposure and Campaign Effects on voters’ uncertainty Version 2.0, 9 th June 2012 Laura Sudulich University of Amsterdam Matthew Wall Université Libre de Brussels Leonardo Baccini London School of Economics Paper prepared for the ELECDEM closing conference, 28 - 30 June 2012, Fiesole, Italy. Do no quote without permission.
Transcript
1
Wired voters: Internet Exposure and Campaign Effects on
voters’ uncertainty
Version 2.0, 9th June 2012
Laura Sudulich
University of Amsterdam
Matthew Wall
Université Libre de Brussels
Leonardo Baccini
London School of Economics
Paper prepared for the ELECDEM closing conference, 28 - 30 June 2012, Fiesole,
Italy. Do no quote without permission.
2
Abstract
This paper examines whether voters’ use of internet as a source of political news
affects their proclivity to consider more than one party as a viable option when voting.
We employ data pertaining to the 2011 general election in Ireland, where we are able
to link geographical information on broadband coverage with individual-level public
opinion data from the 2011 Irish National Election Study. This allows us to adopt a
quasi-experimental approach in examining the effects on voters of online political
newsgathering during the campaign. Implementing instrumental variable models
accounting for political uncertainty, we find consistent evidence of a causal
relationship between use of the Internet as a source of political information and higher
levels of political uncertainty among voters, ceteris paribus.
3
Introduction
Voters’ experiences of politics differ widely according to the extent to which they are
politically ‘certain’. For those voters who have a strong sense of identification with a
party, the act of voting is less a choice among competing alternatives than an
opportunity to reaffirm one’s partisanship.1 However, for those who do not strongly
identify with a party, the act of vote choice entails discovering and expressing
preferences in relation to parties and candidates. While vote choice may thus be a
mere formality for strongly partisan voters, for those whom Dalton describes as
‘apartisans’2 it represents the outcome of an uncertain and variable process of
deliberation regarding the merits of those competing for office.
Levels of political uncertainty are static neither across national populations nor within
them over time. The highly stable, frozen party system scenario described by Lipset
and Rokkan3 (1967) in the late 1960s was driven by the capacities of parties to
structure political competition along stable societal cleavages and to thus align
1 Cees van der Eijk and Mark Franklin, Elections and Voters (Houndmills: Palgrave, 2009, p. 53.
2 Russell Dalton, ‘Cognitive Mobilization and Partisan Dealignment in Advanced Industrial
Democracies’, The Journal of Politics, 46: 1 (1984) 264-284, p. 264.
3 Seymour Martin Lipset and Stein Rokkan, Party Systems and Voter Alignments: Cross National
Perspectives. (New York: Free Press, 1967)
4
themselves with clearly defined segments of electorates. However, from the mid-
1980s onwards, scholars of elections and party systems have devoted considerable
attention to observing and explaining the phenomenon of ‘partisan dealignment’.4 The
concept of partisan dealignment refers to an observed erosion of party membership
and identification in established democracies across the world. One of the most
notable consequences of this trend has been a marked growth in levels of electoral
volatility.5 At the individual level, partisan dealignment has been linked to the
growing propensity of voters in established democracies to delay their voting
decisions – a trend that raises the stakes of political campaigning.6
Political uncertainty among voters in multiparty systems remains largely overlooked
in the European empirical literature. One aspect of the topic that is much commented
upon, but not empirically well understood, is the role of media in establishing or
undermining political certainty. The emergence of the Internet as a news medium has
led to stark warnings about its potential to create an atomised, polarised and
increasingly partisan political sphere. In this article, we aim to explore whether such
claims are supported by empirical evidence – by analysing the effect that online news
consumption exerts on voters’ level of political certainty.
4 Russell Dalton and Martin Wattenberg, eds, Parties without Partisans: Political Change in Advanced
Industrial Democracies (Oxford: Oxford University Press, 2000).
5 Russell Dalton, Ian McAllister and Martin Wattenberg, 'The Consequences of Partisan Dealignment',
in Russell Dalton and Martin Wattenberg Parties without Partisans: Political Change in Advanced
Industrial Democracies (Oxford: Oxford University Press, 2000), pp.37-63.
6 Ian McAllister, 'Calculating or Capricious? The New Politics of Late Deciding Voters', in David
Farrell and Rüdiger Schmitt-Beck, eds, Do Political Campaigns Matter? Campaign Effects in Elections
and Referendums, eds. (London: Routledge, 2002), pp.22-40.
5
Theoretical discussions of the Internet as a medium lead to contrasting expectations
with regard to how Internet use may affect users’ preferences. On one hand, the
diversity of information available online, which is far greater than among traditional
media, indicates that the Internet may exert a politically destabilising influence on its
users. This is especially true of the Internet in its ‘Web 2.0’ incarnation – which
facilitates even greater diversity of content by allowing a very large proportion of
users to generate and post content.7 In this diverse environment, it is likely that
Internet users will encounter facts, ideas, and opinions that challenge their pre-
existing political preference structures. It is easy to imagine how consumption of such
content would leave voters less politically certain. On the other hand, there are several
factors that may lead us to expect that politicised web use will re-enforce voters’
existing preferences – the most important of which is the individualisation of content
that the Internet facilitates. Web users are able to define their own experience of the
medium in line with their pre-existing preferences to a far greater extent than is the
case with other media – with Sunstein contending that online news consumption can
lead to polities where ‘people sort themselves into echo chambers of their own
design’.8
Thus, the Internet can be seen as a medium that has the potential to either challenge or
solidify users’ pre-existing political preferences. Given the foundational importance
of vote choice as a means of legitimating political power and holding it accountable in
7 Paul Anderson, What is Web 2.0? Ideas, technologies and implication for education.
JISC Technology and Standards Watch Report (2007)
8 Sunstein, Cass R. Republic.com 2.0 (Princeton, NJ: Princeton University Press,
2012), p. 3.
6
representative democracies, either effect would be politically relevant, and hence
worthy of academic scrutiny.
Our analysis makes use of data from the 2011 Irish National Election Study
(hereafter, INES 2011). The 2011 Irish election is an opportune case for a study of
political uncertainty – given that the election was by far the most volatile in Irish
history and, indeed, that it ranks among the most volatile elections in West European
history.9 Ireland also presents a uniquely unstructured electorate
10 – primarily due to
the lack of ideological competition in a system where the two historically dominant
parties profess essentially identical policies11. Thus the Irish politics is an
environment where we would anticipate relatively high levels of electoral uncertainty
– this expectation is backed up by Kroh et al.’s comparative study, where Ireland
ranks among the most politically uncertain of the pre-2004 EU15 countries12.
We merge the INES 2011 dataset with contemporaneous data on the geographic
distribution of broadband availability in the Republic of Ireland. The combined
9 Michael Gallagher, ‘Ireland's Earthquake Election: Analysis of the Results’in
Michael Gallagher and Michael Marsh (Eds.) How Ireland Voted 2011: The Full
Story of Ireland’s Earthquake Election (Dublin: Palgrave, (2011); Peter Mair. ‘One of
Europe’s Most Volatile Elections’, www.politicalreform.ie, (2011).
10 Michael Marsh, Party identification in Ireland: An insecure anchor for a floating
party system’, Electoral Studies, 25, (3), 2006, p489 – 508
11 Liam Weeks, ‘Parties and the Party System’ in John Coakley and Michael
Gallagher (Eds.) Politics in the Republic of Ireland. 5th Edition. London and New
York: Routledge, (2010).
12 Martin Kroh, Wouter van der Brug & Cees van der Eijk, ‘Voter volatility
explained’ In W. van der Brug & C. van der Eijk (Eds.), European elections and
domestic politics: Lessons from the past and scenarios for the future (Contemporary
European politics and society). Notre Dame, US: University of Notre Dame Press,
(2007).
7
dataset that we generate allows us to adopt a quasi-experimental approach in
examining the effects on voters of using the Internet as a source of political
information during the campaign. We use variability in broadband coverage in Ireland
to generate an instrument that captures politicised web-use, and controls for possible
endogenous relationships between the causes and effects of sourcing news online. The
methodological approach that we develop here is specifically designed to provide
improved leverage over the causal impact of internet use on voters’ electoral certainty
than has been provided in many previous studies of Internet effects. We argue that
this represents a significant methodological contribution to the study of political
uncertainty generally, and that it is also a strong addition to the study of the political
effects of Internet use by voters in established democracies.
In the next section, we outline the existing literature on political uncertainty and the
effects of Internet use on vote choice. We then provide some context on the Irish case,
before outlining our theoretical expectations and empirical hypotheses regarding the
relationship between internet access/usage and electoral certainty. Subsequently, we
describe the data and methodology used to examine these hypotheses, before
presenting the results of our analysis. We find that there is evidence that browsing the
Internet for political news during the 2011 Irish general election campaign led to
higher levels of political uncertainty among voters; this finding is consistent across
alternative measures of the dependent variable and various model specifications. We
conclude with a discussion of the implications of our findings for both further studies
of electoral certainty and future studies of online campaigns and political use of the
internet by voters.
8
Literature Review
The study takes place in a context of generally increasing levels of electoral
uncertainty in established democracies across the world. A range of studies have
established that aggregate levels of partisan attachment are in decline and that
proportion of individuals who decide how to vote during the campaign itself and/or
switch their vote intention during the campaign is growing over time (MacAllister,
2002). Nowadays, socio-demographic factors such as class, religion and urban versus
rural location appear to play a decreasing role in explaining vote choice (Franklin,
Mackie and Valden, 1992; Dalton McAllister and Wattenberg, 2000) and the classic
‘left-right’ ideological dimension of political contestation also explains less voting
behavior than it used to (van der Brug, 2010). Kroh et al. find that the proportion of
electorally uncertain votes in EU countries has increased over time. The average
proportion of uncertain voters recorded in their study of 12 EU states goes from 36%
in 1989 to 37% in 1994 and reaches 42% in 1999. In 1999 five (Finland, France,
Ireland, Italy and the Netherlands) out of the 15 EU members display a proportion of
potential vote switchers that is over 50% of the electorate. This trend is underscored
by decreasing levels of party membership in a range of countries (Katz and Mair,
1992). Unsurprisingly in this context, the role of electoral campaigns, once regarded
as marginal if not null, has now been reevaluated by scholars, and many now consider
the conduct of the campaign by parties and candidates to be a key factor in
determining voting behavior patterns (Farrell and Schmidt-Beck, 2002).
Among the factors that have been discussed as possible causes of partisan
dealignment, the media environment has consistently loomed large. For instance,
9
Dalton and Wattenberg (2002) argue that ‘the expansion of mass media upstages the
parties’ role as providers of political information’ (p. 4). In a relatively short space of
time, the available media menu for citizens has expanded due to the emergence and
growth of the Internet. Political usage of the Internet has grown from a marginal to a
mainstream phenomenon among politicians and citizens in political systems across
the world. Due to the novelty of such widespread use of Internet technologies by
political actors, and the multifaceted nature of the Internet as medium, the political
effects of Internet usage on candidates, parties and voters alike are still not well
understood in the academic literature.
The Internet itself is a medium of communication, and the communication of
information is foundational to politics – and particularly to the formation of political
attitudes. Indeed, one idealised standard of electoral campaigns sees them as
information provision events – where party ideologies are a convenient shortcut to
provide self-interested voters with sufficient information to make an informed
choice.13 Plato’s parable of the cave illustrates of how perceptions form our beliefs,
and it is no coincidence that this metaphor was revived by Lasswell in his seminal
contribution to the study of public opinion. Lippmann14 observes that we, like the
prisoners in the cave, cannot observe the entirety of reality, instead, we must form our
opinions on the basis of first or second-hand reports. In contemporary society, these
reports arrive via a variety of media – newspapers and magazines; television and
radio; discussions among personal networks; and, more recently, the Internet.
13 Downs, An Economic Theory of Democracy 1957.
14 Walter Lippmann, Public Opinion, 1982.
10
It is therefore unsurprising that the scholarly literature on the role of mediated
information in the formation of partisan attitudes has a long and rich history. In a
foundational study, Converse et al. claim that ‘shifting or floating voters tend to be
those whose information about politics is relatively impoverished’15 (1962: 578-579).
As such, a generalised negative correlation between levels of information and voter
certainty was initially posited: more information leads to more political certainty.
Zaller (1992) refined this position, arguing that individuals with moderate levels of
political information and knowledge are in fact the most open to being influence by
political communication.
Recently, a relatively large body of empirical literature has proved that media usage
and voting behaviour are indeed related16, specifically demonstrating that media
exposure has significant effects on the two key electoral behaviours: turnout17 and
vote choice18. Even though a number of studies have established a causal relationship
between electoral behaviour and exposure to traditional media19, to date very little
known is about the role of the Internet. The research presented in this article addresses
two specific questions that have received very little attention to date: does the Internet
influence the electoral certainty of voters, and, if so, what is the direction of this
influence?
There are few empirically oriented research results to provide us with a solid set of
expectations as to the broad question of how citizen use of the Internet impacts
electoral behaviour. One promising line of enquiry has sought to measure the extent
15 Converse et al.
16 Aarts and Semetko, 2003Holtz-Bacha and Norris 2001.
17 (Aarts and Semetko, 2003)
18 (Enikolopov et al, 2011)
19 (Enikolopov et al, 2011; Della Vigna and Kaplan, 2007; Kern and Hainmueller,
2009)
11
to which Internet use is ideologically polarised along the lines identified by Sunstein
(2001, 2012). Gentzkow and Shapiro’s20 research investigates whether individuals
who browse the Internet for news limit their news consumption to sources that are
‘likely to confirm their prior views’ (1799) 21. They compare face-to-face interactions
to ‘old’ (broadcast and cable television, newspapers, magazines) and ‘new’ media.
Their core finding is that ‘the Internet is far from segregated’ (p. 1801) and traditional
methods of political information gathering – namely via discussion with members of
one’s offline social networks (including family, work, neighborhoods, voluntary
associations and trusted friends) are considerably more segregated than newsgathering
on the Internet. However, while this research contributes greatly to the debate about
the extent to which online news consumption is ideologically segregated – it tells us
little about the substantive effects of such consumption. Indeed, the authors make this
point explicitly: ‘none of the evidence here speaks to the way people translate the
content they encounter into beliefs’ (p. 1802).
Gibson and McAllister make a strong contribution to the empirical exploration of the
political effects of online news consumption; they discus and examine the possibility
that the internet performs a ‘conversion’ effect. They produce an analysis that
compares voters who followed election news on the internet to those who did not in
the Australian 2008 general election campaign. Gibson and McAllister found that
20 Gentzkow, Matthew and Shapiro, Jesse M., ‘Ideological Segregation Online and
Offline’ The Quarterly Journal of Economics 126 pp. 1799-1839 (2011)
21 To do so, they estimate the ‘share conservative’ (that is, the proportion of a site’s
visitors who are self-identified conservatives) of over 1,300 news and politics
websites. For each individual, they calculate a conservative exposure score, which
gives the average share conservative of all of the websites visited by that individual.
They finally calculate an isolation index, which is arrived at by finding the absolute
difference between the average conservative exposure score of self-identified
conservatives and the average score of self-identified liberals.
12
‘those voters accessing election related information via the web were significantly
different in their campaign behaviour and attitudes compared to other voters (…)
Most crucially, online election news seekers are more independently minded than
other voters’ (p.256).
In this paper, we aim to expand on extant exploratory work, by performing a more
causally-oriented analysis of whether browsing for electoral news may indeed affect
levels of certainty. While Gibson and McAllister (2006) identified a positive
correlation between internet use and political uncertainty, we investigate whether
there is a causal relationship between these variables, treating internet use as an
independent variable, and political certainty as a dependent variable in the second
stage of a structural equation model (the first stage predicts the dependent variable
‘usage of the internet’ by broadband coverage and a set of covariates). We do so by
implementing a methodology that, by accounting for endogeneity-related concerns,
allows us to make advancements in our understanding of what the causal effects of
the internet on political behavior are.
The 2011 Irish election
The data gathered for this study pertain to the 2011 Irish election. While we chose this
case for methodological reasons (because of the availability of data on broadband
availability among respondents), the campaign itself proved a fascinating electoral
event. The result saw the seemingly rock solid electoral dominance of the Fianna Fàil
party, firmly established in Irish electoral politics since its first victory in 1932,
radically overturned. To those who follow Irish politics closely, however, the result
13
was not a surprise. The last days of the outgoing administration saw Ireland faced
with an unprecedented conflagration of economic, fiscal and employment crises,
which culminated in an Irish ‘bailout’, under strict ‘conditionalities’ from the
ECB/EU/IMF.22As these crises unfolded, the government parties’ popularity
plummeted, and while Fianna Fàil was heavily damaged at the polls, the Green Party
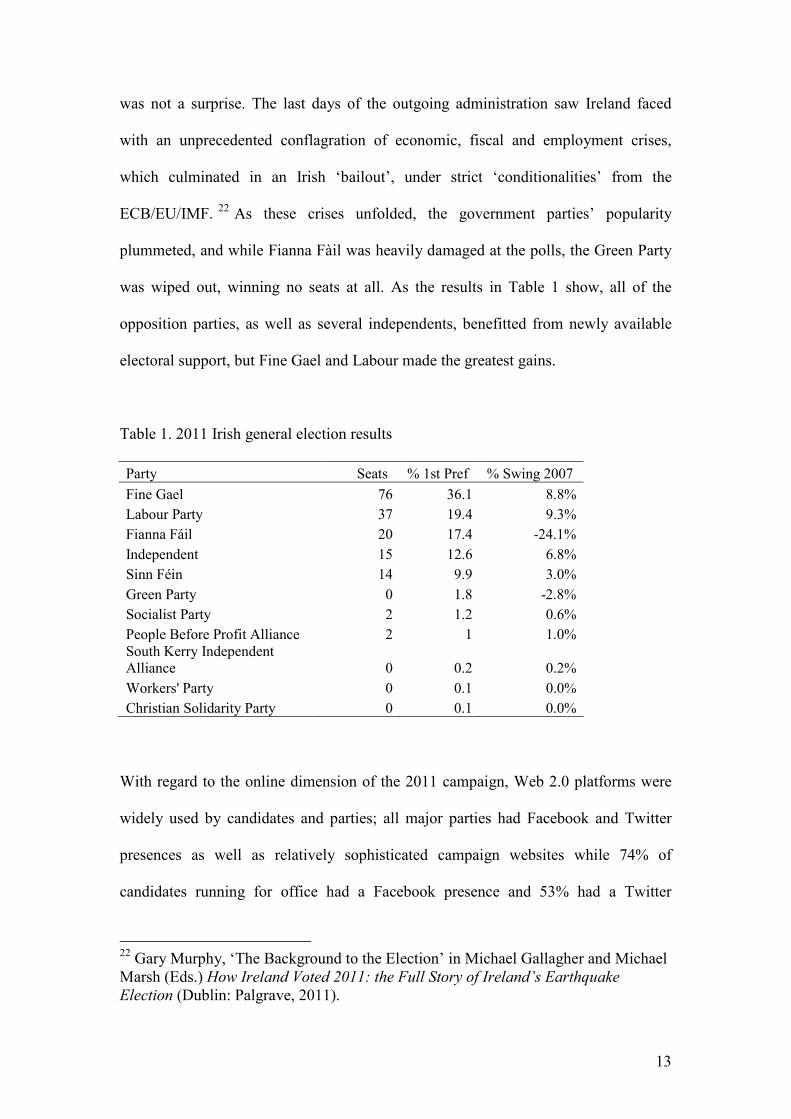
was wiped out, winning no seats at all. As the results in Table 1 show, all of the
opposition parties, as well as several independents, benefitted from newly available
electoral support, but Fine Gael and Labour made the greatest gains.
Table 1. 2011 Irish general election results
Party Seats % 1st Pref % Swing 2007
Fine Gael 76 36.1 8.8%
Labour Party 37 19.4 9.3%
Fianna Fáil 20 17.4 -24.1%
Independent 15 12.6 6.8%
Sinn Féin 14 9.9 3.0%
Green Party 0 1.8 -2.8%
Socialist Party 2 1.2 0.6%
People Before Profit Alliance 2 1 1.0%
South Kerry Independent
Alliance 0 0.2 0.2%
Workers' Party 0 0.1 0.0%
Christian Solidarity Party 0 0.1 0.0%
With regard to the online dimension of the 2011 campaign, Web 2.0 platforms were
widely used by candidates and parties; all major parties had Facebook and Twitter
presences as well as relatively sophisticated campaign websites while 74% of
candidates running for office had a Facebook presence and 53% had a Twitter
22 Gary Murphy, ‘The Background to the Election’ in Michael Gallagher and Michael
Marsh (Eds.) How Ireland Voted 2011: the Full Story of Ireland’s Earthquake
Election (Dublin: Palgrave, 2011).
14
account. Overall, the Internet was a source of considerable political activity among
parties, candidates and voters during the campaign period.23
Long before the results that led 2011 to be described as Ireland’s ‘earthquake
election’,24 Marsh had made the argument that ‘a majority of voters appear to be open
to persuasion according to the balance of short-term forces’.25 According to Kroh et
al.’s comparative study, the proportion of potential voter changers in the case of the
2011 Irish national election is very much in line with the figures presented by Kroh et
al.26 for European Parliament elections in 1989; 1994; and 1999. Indeed, in spite of
having produced relatively stable electoral outcomes in past decades, the Irish
electorate has exhibited a large latent potential for electoral change for quite some
time (van der Eijk and Franklin 2009; Kroh et al 2007), and the lack of party
identification among a large swathe of Irish voters has been pointed out before
(Marsh, 1985; Mair and Marsh, 2004; Sinnott 1998). The 2011 election was unusual,
however, in that this pronounced political uncertainty among the electorate translated
into an exceptionally high level of aggregate electoral change.
23 Matthew Wall and Maria Laura Sudulich, ‘Internet Explorers? The Online
Campaign’ in Michael Gallagher and Michael Marsh (Eds.) How Ireland Voted 2011:
the Full Story of Ireland’s Earthquake Election (Dublin: Palgrave, 2011).
24 Michael Gallagher and Michael Marsh (Eds.) How Ireland Voted 2011: the Full
Story of Ireland’s Earthquake Election (Dublin: Palgrave, 2011).
25 Michael Marsh, Party identification in Ireland An insecure anchor for a floating
party system’, Electoral Studies, 25, (3), 2006, p. 489 – 508, p. 491.
26 Just over 50% of the representative sample responding to the questionnaire of the 2011 INES
showed potential for switching.
15
Theory and hypotheses
The Internet, like any single source of political information, is just one aspect of what
is a very complex phenomenon to disentangle, namely, an individual’s vote choice.
We know from the extant literature that vote choice is influenced by an array of
elements including inter alia socio-economic status, party identification, evaluation of
the incumbent government’s performance and competency evaluations on key issues.
With so many overlapping drivers, at the individual, party and societal levels, political
uncertainty is a complex phenomenon, and we would not argue that media technology,
in isolation, exerts a determinative influence on societal levels of political certainty.
Instead, we acknowledge that the Internet represents a component (of variable
importance) of the political information mix received by voters during a political
campaign period.
Our focus here is voters’ levels of electoral uncertainty – our dependent variable –
and the question of whether this property of individual voters is influenced by their
consumption of online news. However, the direction of such an effect is not clear a
priori. Two schools of thought have characterized the debate on the effect that the
internet may have on political information and political engagement. On the one hand,
several scholars (Bimber and Davis, 2003; Mutz and Martin, 2001, Sunstein 2002;
2012) have argued that the internet emphasises selective exposure, ultimately leading
users to reinforce their pre-existent beliefs. They argue that the pull-in nature of the
Internet leads individuals to explore the web by searching among information sources
and loci that are already in line with their preferences. Research emphasizes the role
of habit in navigating the online environment – with people consistently relying on
16
trusted and known sites27. Gibson and McAllister (2009 paper on bridging) found that
bonding activities outnumber bridging ones in people’s online interactions. Rather
than an open market square, such a view would depict the internet as a private club,
where the likelihood of bumping into outsiders is practically nil. Furthermore, some
argue that Internet’s extensive reliance on targeted advertising and automated
personalisation software create ‘filter bubbles’, where users are exposed primarily to
content that reflects their prior choices and dispositions, without necessarily realising
that this is the case.28 This view of the informational role of the internet would lead us
to expect it internet exposure/use to confirm voters’ prior preferences. Empirically,
this approach leads to the following hypothesis:
H1: Internet use for newsgathering during a political campaign is associated
with lower levels of political uncertainty among voters, ceteris paribus.
On the other hand, a number of studies (Putnam 2000, Norris, 2002, 2001 ref in
Gibson and McAllister 2009) indicated that use of the internet can actually weaken
social boundaries by exposing users to alternative opinions, views and sources. While
habit and prior preferences do play a significant part in determining one’s online news
experience, it appears that ‘accidental’ news exposure still occurs, especially when
Internet users consult the sites of general interest news broadcasts as key sources of
27 Arvind Diddi and Robert LaRose, ‘Getting Hooked on News: Uses and
Gratifications and the Formation of News Habits Among College Students in an
Internet Environment’ Journal of Broadcasting & Electronic Media
50: 2 (2006).
28 Eli Pariser, The Filter Bubble: What the Internet Is Hiding From You. Penguin
Press: New York, 2011.
17
online news. Tweksbury and Rittenburg29 characterize the findings of empirical
studies on news selectivity as indicating that, for Internet news consumers, ‘selectivity
occurs through a mixture of purposeful evaluation of sites and topics and healthy
doses of habit and chance’. Furthermore, the Internet has some technological features
that favour the dissemination of information that runs contrary to one’s prior
preferences. The internet’s innate characteristic of being relatively unencumbered by
geographical boundaries provides for exchanges of information and ideas across state
borders. Exposure to a plurality of sources, especially on web 2.0 platforms, where
practically every user is also a content producer, may even happen in spite of the
filters that both the user and the sites themselves place on content. While users do
have control over whom to friend, like and follow on social networks, the very nature
of Social Networking Sites exposes users to unexpected content and links to news and
opinion items. These considerations would lead us to anticipate that exposure to
diverse, often contradictory information online should lessen voters’ political
certainty. This approach leads to an opposing hypothesis to that stated in H1:
H2: Internet use for newsgathering during a political campaign is associated
with higher levels of political uncertainty among voters, ceteris paribus.
As such, there is no definitive consensus on whether using the internet would
reinforce existent political beliefs of whether, by offering almost limitless
information, it would present voter with more options, making them more doubtful
and ‘open’ to seriously considering more than one party as a potential vote choice. A
29 David Tewksbury and Jason Rittenberg, News on the Internet: Information and
Citizenship in the 21st Century (Oxford Studies in Digital Politics) (Oxford: OUP,
2012).
18
significant negative relationship between the two elements (internet consumption
leads to lower potential for switching) would reinforce the claim that the pull-in
nature of Internet leads to a self-reinforcing dynamic - furnishing users with self-
selected information that serves to reinforce their beliefs. A significant positive
relationship would instead point towards the internet being a locus where people
gather a variety of information and consider a multiplicity of options – the
consequence being that they are often less politically certain than those who do not go
online for their news.
Research design
In this research, as in many other studies of individuals, organisations and societies,
we confront a fundamental problem of causal inference: the impossibility of
observing the counterfactual, i.e., the outcome for the same unit in the absence of the
treatment. The ideal scenario from a methodological standpoint would be a random
assignment of the possibility of browsing political news online to individuals. Given
random assignment, we could then simply compare individuals who go online with
individuals who do not. The difference between the average levels of uncertainty for
the treated group and the average level of electoral uncertainty for the control group
would constitute the causal effect of the internet, since both groups would be
comparable with respect to observed and unobserved confounding factors.
However, this ideal scenario is not feasible with observational data drawn from a
representative sample of society at a given point in time. Simply put, browsing
political news online is not randomly assigned to individuals. One approach is to
19
control for those characteristics that are likely to affect both the probability of going
online and political uncertainty. For instance, we could use multivariate regressions or
matching techniques employing a set of control variables. However, this approach
would not help us with the problem of selection on unobserved factors that are
correlated with the treatment and the outcome variables. This selection effect would
induce correlation between the dependent variable and the error term, which
undermines causal inference.
In this context, instrumental variables can be an effective identification strategy. We
exploit the fact that broadband coverage was geographically uneven in the Republic
of Ireland during the period under investigation. We code a binary instrument
‘broadband coverage’ based on information about where respondents live. This
dummy variable scores ‘1’ if a respondent lives in an area with broadband coverage
and scores ‘0’ if a respondent lives in an area without broadband coverage. By
instrumenting patterns of internet usage on the basis of broadband coverage, our
treatment, we can draw conclusions concerning whether an individual who has
gathered news via the Internet would be more (or less) certain of her vote preferences,
our dependent variable, had she lived somewhere where a lack of broadband coverage
had prevented him for doing so. Clearly, for an individual who lives in areas with
broadband coverage we are not able to observe the counterfactual level of electoral
certainty that (s)he would have showed with no coverage. However, we can estimate
this treatment effect by finding a control group that is similar enough to the treatment
group in all the covariates (and possibly beyond) except in that it was not covered by
broadband availability. In this way, we argue, our methodological approach
facilitates the identification of our treatment’s effect on outcome variable of interest.
20
Moreover, we include in the model a number of elements that previous studies found
to be related to voter uncertainty to further mitigate the issue of reverse causality.
Dependent and independent variables are detailed in the next section.
Data
We use data from the INES 2011, the third national election study conducted in the
Republic of Ireland30. In order to perform our analysis, we first integrated this dataset
with a new variable accounting for the availability of broadband to each respondent
based on their geographical location. This additional variable was created by firstly
encoding the geographical (latitude and longitude) location of respondents, and then
by preforming a search for broadband availability for each respondent’s geographical
location. The 1,854 respondents to the INES 2011 were living in 309 different
geographical locations (i.e., six respondents per location figure in the survey).
We searched for broadband coverage/availability in each location by consulting
information on broadband availability supplied by major providers and, additionally,
by using two online services which provide detailed information on broadband
coverage by location (getbroadband.ie and www.bonkers.ie). For those locations
where all of these sources indicated no broadband coverage, we also performed a final
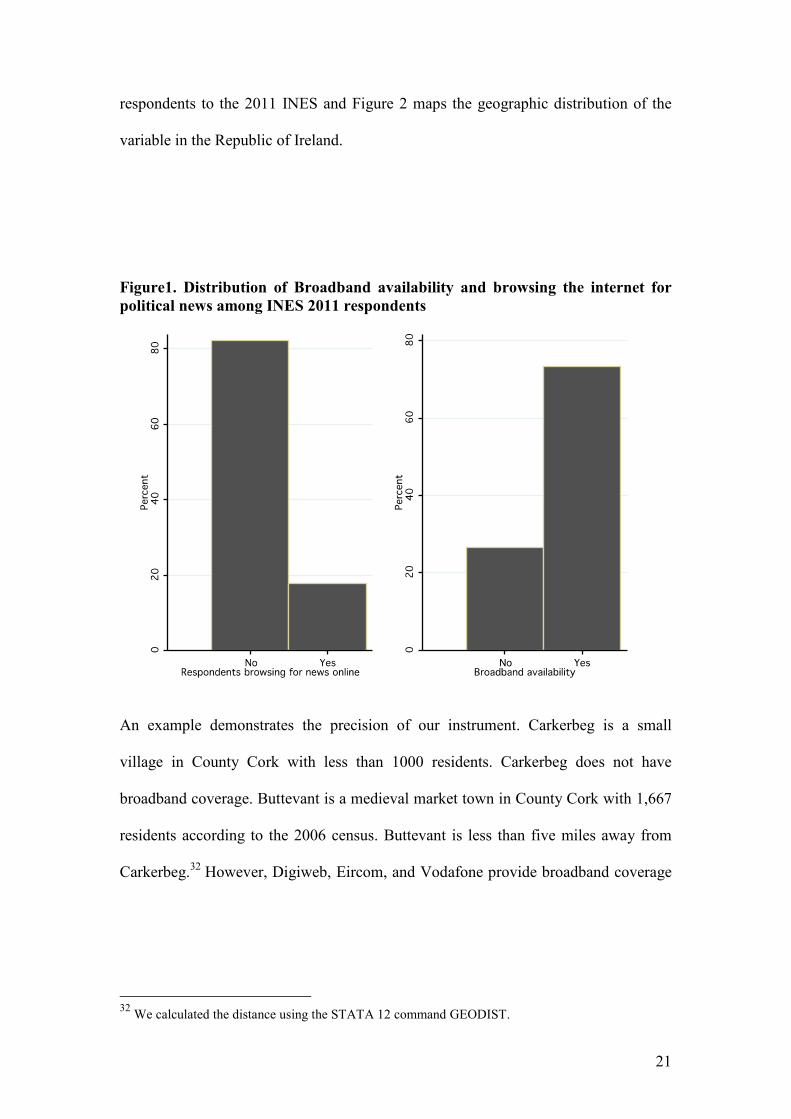
check by searching for the keywords location+broadband on google.ie.31 Figure 1
describes the distribution of broadband availability as well as internet use among
30 The INES 2011 full data has not been publically released yet; data presented here was made
available to the authors by the PI, Professor Michael Marsh, to whom the authors are deeply grateful. 31 For all those locations whose name was present in more than one county we used
location+broadband+constituency. Finally, we produced a comparison between answers to the question
on internet use for news browsing and the variable accounting for broadband. When a conflict between
a geographical location (each of them accounting for 6 observations) and the information provided by
respondents existed we drop from the analysis these respondents who live in a village without
broadband coverage and who look at political news online more than twice a week.
21
respondents to the 2011 INES and Figure 2 maps the geographic distribution of the
variable in the Republic of Ireland.
Figure1. Distribution of Broadband availability and browsing the internet for
political news among INES 2011 respondents
An example demonstrates the precision of our instrument. Carkerbeg is a small
village in County Cork with less than 1000 residents. Carkerbeg does not have
broadband coverage. Buttevant is a medieval market town in County Cork with 1,667
residents according to the 2006 census. Buttevant is less than five miles away from
Carkerbeg.32 However, Digiweb, Eircom, and Vodafone provide broadband coverage
32 We calculated the distance using the STATA 12 command GEODIST.
in Buttevant. The monthly price of a subscription ranges from 19 euro to 48 euro
depending on the speed.33
Figure 2. Broadband availability in the Republic of Ireland
33 Information available on getbroadband.ie.
in Buttevant. The monthly price of a subscription ranges from 19 euro to 48 euro
Broadband availability in the Republic of Ireland
Dependent variables
getbroadband.ie.
22
in Buttevant. The monthly price of a subscription ranges from 19 euro to 48 euro
23
Some explanation is required in relation to the operationalization of the dependent
variable, which is the level of uncertainty of individual voters with regard to their vote
choice. We intend to capture potential for vote switching as well as electoral
‘openness’ to multiple parties, and we do so by deploying two measures of this
dependent variable in our analysis. Many election studies capture voters’ orientations
towards parties via a battery of survey items on their ‘propensity to vote’ for each
party. This set of questions on the likelihood of voting for each party was first
introduced in the early 1980s by van der Eijk and Niemöller in the Dutch National
Election Study (van der Eijk and Niemöller 1984), and it has since been adopted by
numerous European countries (e.g., UK, Ireland, Spain and Germany, among others).
These ‘Propensity to Vote’ (PTV) questions have also featured in every European
Election Study since 1989 (van der Eijk and Marsh, 2007). The value of this approach
is that, especially in multiparty systems, it represents a fine-grained measure of how
preferences over several parties are distributed in voters’ minds.
We make use of this measure in order to shed some light on the issue of electoral
volatility and potential for electoral change. Firstly, for descriptive purposes, in order
to have consistent findings comparable to previous studies, we adopt the
operationalization of potential for vote switching developed by Kroh et al. (2007).
The question that we use to develop this index reads:
“How probable is it that you will ever give your first preference vote to the
following parties? Please use the numbers on this scale to indicate your views, where
‘1’means ‘NOT AT ALL PROBABLE’ and ‘10’ means ‘VERY PROBABLE’”.
24
Following Kroh et al., we define likely switchers as those respondents who either
have two or more parties tied for their highest probability score, or whose second
preference is only one point less than their first. This approach generates a binary
measure, taking the value of ‘1’ for likely switchers and the value of ‘0’ for non-
switchers34. Table 2 displays the distribution of this binary variable in the Irish
electorate over the three INES studies. We can see from table 2 that levels of political
uncertainty among the Irish electorate are comparatively stable over time – and we
note that the proportion of ‘switchers’ in the Irish electorate is comparatively high
(compared to Kroh et al.’s 15 country average of .43).
Table 2. Proportion of potential switchers over three INES studies
% Switchers % Non switchers
2002 50.75 49.25
2007 51.51 49.49
2011 50.34 49.66
Another measure, also adopted by Kroh et al. is somewhat more nuanced, providing a
continuous measure of the degree to which a voter is certain of voting for their most-
preferred party – and we employ this measure as our first dependent variable in our
analysis. This measure is obtained by computing the inverse of the difference between
each respondent’s two most-preferred parties. The variable ranges from -10 to 0,
where -10 indicates a high degree of certainty that the respondent will vote for their
34 The measure is computed, once again following Kroh et al., by separating those respondents that
have either a tie for the PTV question or whose first and second most preferred parties are 1 unit away,
from those respondents whose first preference is more than 1 unit away from the second. We do not
use this variable in out inferential analysis for two reasons: firstly, its binary form does not account for
possible important differences among those considered to be ‘switchers’ (Kroh et al.: 216). Secondly,
this dichotomous measure is very sensitive to changes in the number of observations, potentially
leading to blurry results.
25
most preferred party and 0 indicates that they are equally likely to vote for at least two
parties.
We complement this measure with a new variable that, while capturing something of
possibility for vote switching, is best conceptualized as an individual’s overall
openness to multiple parties. The aforementioned measures are derived from the first
and second highest scoring parties in the PTV question. Our additional dependent
variable makes use of all the PTVs that respondents filled in; therefore we capture
more information and we have a measure that while being in line with the previous
one, gives us some extra details. The index that we employ here is based on the
Herfindahl- Hirschman (hereafter HH) index. The HH index or revised versions of
this index (inverse and/or normalized versions) have been used to measure the extent
of societal fragmentation of states into different ethnic, linguistic, and religious
groups (see Alesina et al., 2003 for a detailed discussion) as well as the well-known
‘effective number of parties’ measure developed by Laakso and Taagepera (1979).
Here we compute it as follows:
HH=��������
where x([1-10]) is the PTV of each party divided by the total of all probabilities filled
in by respondents. For instance a respondent that gave a PTV of 10 to party X and a
PTV of 0 to all the remaining party would have an HH equal to 1. Respondents who
indicate that they would consider voting more than one party, by giving them PTV
scores greater than 0 will have values smaller than one. The smaller the HH value, the
26
greater the extent to which the respondent is divided between multiple parties. To
make the discussion of this index more intuitive in our analysis we reverse it so that
high values correspond to uncertainty/electoral openness and small values correspond
to certainty. Therefore, for both measures of our dependent variable, higher values
relate to greater levels of electoral uncertainty.
Control Variables
As discussed above, Kroh et al. (2007) examined individuals’ potential for vote
switching across EU member states in European Parliament elections, providing
possibly the most comprehensive comparative empirical investigation on this topic to
date. We replicate their approach here, adapting it to the study of a single national-
level election and focusing our attention on voters’ exposure to and use of the Internet
as our key explanatory variable. Kroh et al. identify both individual-level and
systematic variables that could potentially influence one’s level of electoral certainty.
As this study pertains to only one election, we do not include their systematic
variables (which relate to the polarisation and fragmentation of the party system) in
our analysis. ‘Individual characteristics’ are subdivided into three further sub
categories in Kroh et al.’s model – Social Background; Political Involvement, and
Political Attitudes and Experiences. Social Background characteristics include age,
gender, education, social class, union membership and church attendance. The only
one of these variables that they find consistently influences political certainty is age,
with younger voters typically being less politically certain than older voters. In terms
of Political Involvement, the authors include party identification (which is positively
related to political certainty) frequency of political television and newspaper
27
consumption and political attentiveness. We expand their model by testing whether
internet usage (for gathering news during the campaign) affects levels of electoral
uncertainty. Under Political Altitudes and Experiences, Kroh et al. include left-right
self-placement and extremeness, and EU integration policy stance and the
extremeness, as well as a battery of questions pertaining to the efficacy of the current
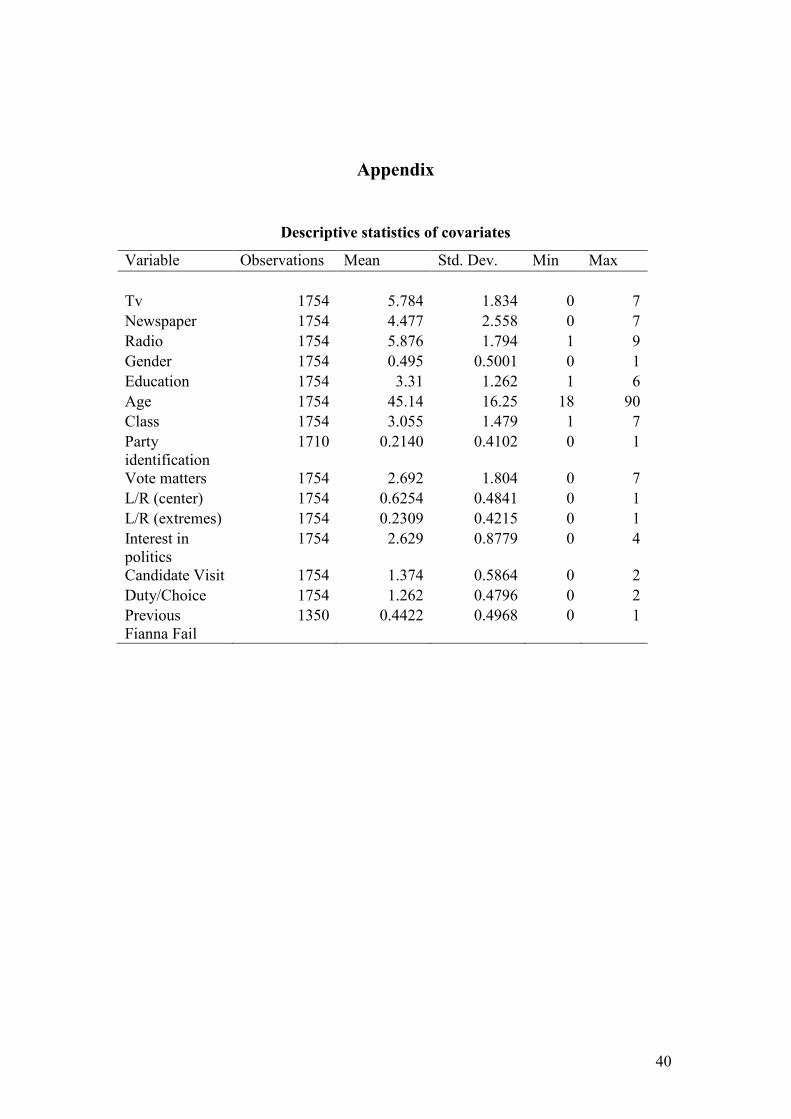
political system. We sought to replicate this approach using data from the 2011 INES
survey, and a detailed version of how these control variables were measured is
included in the Appendix to this article.
Econometric strategy
We deploy a methodological approach that allows us to investigate the relationship
between online usage and voting behaviour. Traditional techniques such as linear
OLS regression are limited in their capacity to establish causation because they fail to
control for endogenous causal relationships between independent and dependent
variables. Internet use, the purportedly independent variable in our study, is indeed
endogenous to several of the individual level characteristics that we use to predict
uncertainty in vote choice. As such, if we limit our analysis to a linear model we
produce an estimate breaks one of the linear regression model’s fundamental
assumptions. Instead, we estimate our model by instrumenting patterns of Internet
usage on the basis of internet availability and a set of covariates. We do so by
implementing Two-Stage-Least-Squares (2SLS) estimations on the two dependent
variables discussed above35.
35 As the first equation outcome is dichotomous, we prefer the TRATREG approach, IVREG2
estimates are reported in the Appendix.
28
We outline here the rationale behind using these techniques, the assumptions on
which they are based and the differences between them. The variable ‘broadband’ is
employed as an instrumental variable (IV). We analytically treat respondents as
existing in a natural experimental set-up, where the group that has access to
broadband is the treatment group and the group that does not is the control group36.
To justify this assumption, we must perform several quality controls to assure
ourselves that the causation that we observe is not attributable to correlation with
another, unobserved, variable. In short, we seek to show that the effects that we
measure are the causal effects of Internet newsgathering, and not an artefact of a
relationship between Internet use and some other explanatory variable.
Identification Strategy
In terms of precedent in the literature, our research design is similar to that adopted in
Bhuller et al.37 However; we more closely follow Kern and Hainmueller’s
identification strategy, which we will now briefly explain. According to Abadie
(2003), the following four nonparametric assumptions allow one to identify causal
effects in an instrumental variable (IV) model. Let Y represent the potential outcome,
Z be the instrument, (i.e., living in a village with broadband coverage), D be the
treatment, (i.e., looking at political news online), and X represents a vector of
covariates. Given these parameters, a good instrument fulfills four key assumptions. .
36 T-test shows that also for this variable the difference in the mean of the treatment group and that of
the control group is statistically different from zero at the conventional level.