W o r k i n g D r a f t - L a s t M o d i f i e d 1 / 4 / 2 0 0 6 2 : 3 3 : 3 6 P M P r i n t e d 1 WCO-ZXJ269-20080225-02 Spend Where IT Matters Technology Executive’s Peer Group CONFIDENTIAL Document February 27, 2008 This report is solely for the use of client personnel. No part of it may be circulated, quoted, or reproduced for distribution outside the client organization without prior written approval from McKinsey & Company. This material was used by McKinsey & Company during an oral presentation; it is not a complete record of the discussion.
Transcript
Wo
rking D
raft - Last M
odified
1/4
/2006
2:3
3:36 P
MP
rinte
d
1
WCO-ZXJ269-20080225-02
Spend Where IT Matters
Technology Executive’s Peer Group
CONFIDENTIAL
Document
February 27, 2008
This report is solely for the use of client personnel. No part of it may be circulated, quoted, or reproduced for distribution outside the client organization without prior written approval from McKinsey & Company. This material was used by McKinsey & Company during an oral presentation; it is not a complete record of the discussion.
Wo
rking D
raft - Last M
odified
1/4
/2006
2:3
3:36 P
MP
rinte
d
2
WCO-ZXJ269-20080225-02
How CEOs and business leaders often think of IT investments . . .
Wo
rking D
raft - Last M
odified
1/4
/2006
2:3
3:36 P
MP
rinte
d
3
WCO-ZXJ269-20080225-02
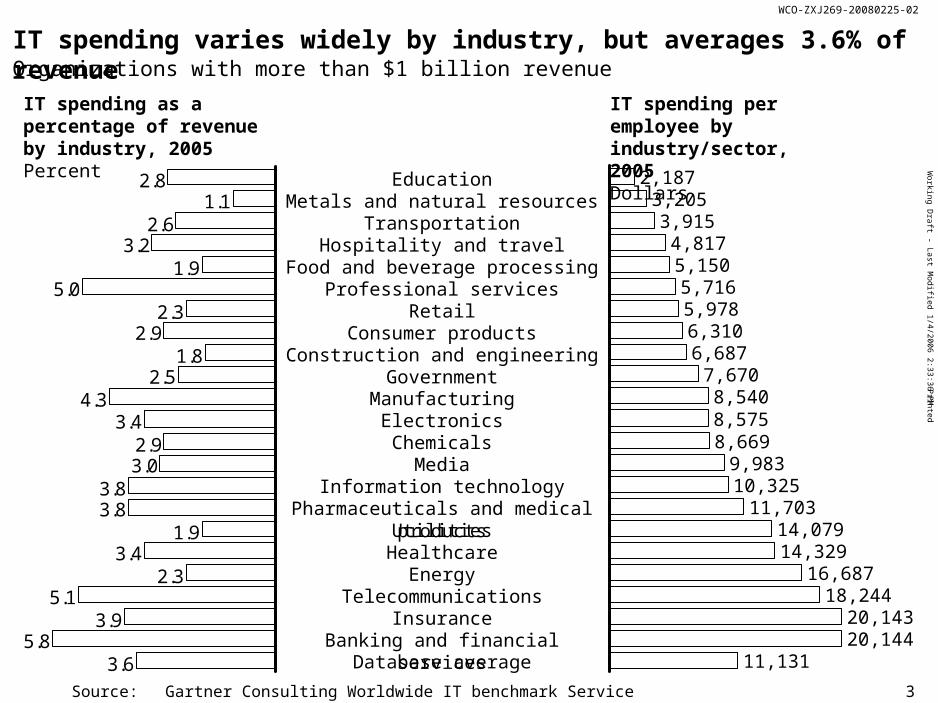
8,5408,5758,669
9,98310,325
11,70314,07914,329
16,687
2,1873,2053,915
4,8175,1505,7165,9786,3106,687
7,670
18,24420,14320,144
11,131
IT spending varies widely by industry, but averages 3.6% of revenue
Source: Gartner Consulting Worldwide IT benchmark Service
IT spending per employee by industry/sector, 2005Dollars
5.83.6
3.95.1
2.33.4
1.93.83.8
3.02.9
3.44.3
2.51.8
2.92.3
5.01.9
3.22.6
1.12.8 Education
Metals and natural resourcesTransportation
Hospitality and travelFood and beverage processing
Professional servicesRetail
Consumer productsConstruction and engineering
GovernmentManufacturing
ElectronicsChemicals
MediaInformation technology
Pharmaceuticals and medical productsUtilities
HealthcareEnergy
TelecommunicationsInsurance
Banking and financial servicesDatabase average
IT spending as a percentage of revenue by industry, 2005Percent
Organizations with more than $1 billion revenue
Wo
rking D
raft - Last M
odified
1/4
/2006
2:3
3:36 P
MP
rinte
d
4
WCO-ZXJ269-20080225-02
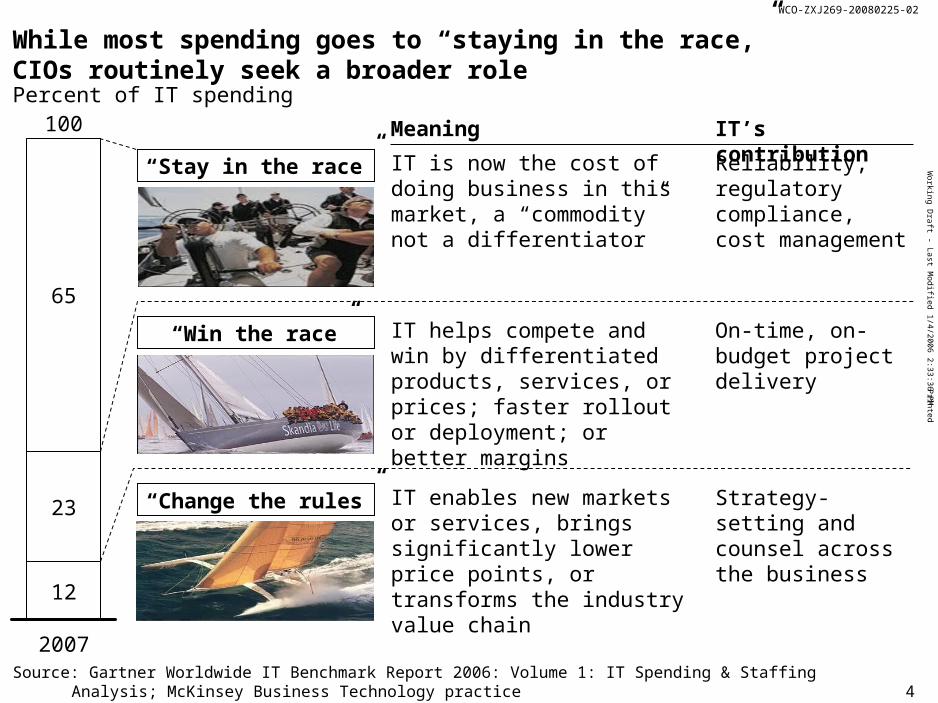
While most spending goes to “staying in the race,” CIOs routinely seek a broader role
Source: Gartner Worldwide IT Benchmark Report 2006: Volume 1: IT Spending & Staffing Analysis; McKinsey Business Technology practice
2007
12
23
65
100 Meaning IT’s contribution
“Stay in the race” IT is now the cost of doing business in this market, a “commodity” not a differentiator