Page 1
Working Paper 279
Salient Features of Measuring, Interpreting
and Addressing Indian Inflation
Kirti Gupta and Fahad Siddiqui
July 2014
INDIAN COUNCIL FOR RESEARCH ON INTERNATIONAL ECONOMIC RELATIONS
Page 2
i
Contents
Abbreviations ..........................................................................................................................iii
Abstract .................................................................................................................................... vi
Section 1 Introduction ............................................................................................................. 1
Section 2 Architecture of Indian Inflation Indices................................................................ 3
2.1 WPI ............................................................................................................................. 3
2.2 CPI .............................................................................................................................. 5
Section 3 Measurement of inflation in larger economies ................................................... 11
Section 4 Trends in Indian Inflation .................................................................................... 16
4.1 WPI and CPI ............................................................................................................. 16
4.2 WPI inflation after alteration of weights assigned to Product Groups .................... 18
4.3 Report of the Expert Committee to Revise and Strengthen the Monetary Policy
Framework ................................................................................................................. 22
4.4 Inflation Targeting in India in the context of Distorted Price Discovery Mechanisms . 35
Section 5 Conclusions ............................................................................................................ 38
References ............................................................................................................................... 40
Page 3
ii
List of Tables and Figures
Table 1: Indian inflation has been higher than the world average in recent years ................................. 2
Table 2: Comparative Weights assigned to WPI Product Groups ......................................................... 4
Table 3: Weights assigned to CPI-IL Product Groups, Base 2001 ........................................................ 6
Table 4: Weights assigned to CPI (AL) and CPI (RL) Product Groups, Base 1986-87 ........................ 7
Table 5: Weights assigned to Combined CPI Product Groups, Base 2010 ............................................ 8
Table 6: Markets allocated as per population......................................................................................... 9
Table 7: Price Indices compiled at National Level .............................................................................. 10
Table 8: Composition of Indices used to measure inflation in USA .................................................... 11
Table 9: Composition of Inflation Indices in the UK........................................................................... 13
Table 10: Revised weights for WPI for trend analysis......................................................................... 19
Table 11: Monetary Indicators ............................................................................................................. 25
Table 12: Administered Interest Rates ................................................................................................. 29
Figure 1: WPI & CPI-IW Annual Inflation ......................................................................................... 17
Figure 2: WPI and CPI-IW Food Inflation .......................................................................................... 17
Figure 3: Monthly WPI and CPI-IW Inflation ..................................................................................... 17
Figure 4: WPI Inflation with older higher weightage for food and CPI Inflation ............................... 19
Figure 5: Europe Brent Spot Price ....................................................................................................... 21
Figure 6: Consumer Price Inflation ...................................................................................................... 22
Figure 7: Principal Transmission Channels of Monetary Policy ......................................................... 23
Figure 8: Rupee – US$ Nominal and Real Exchange Rates ................................................................ 30
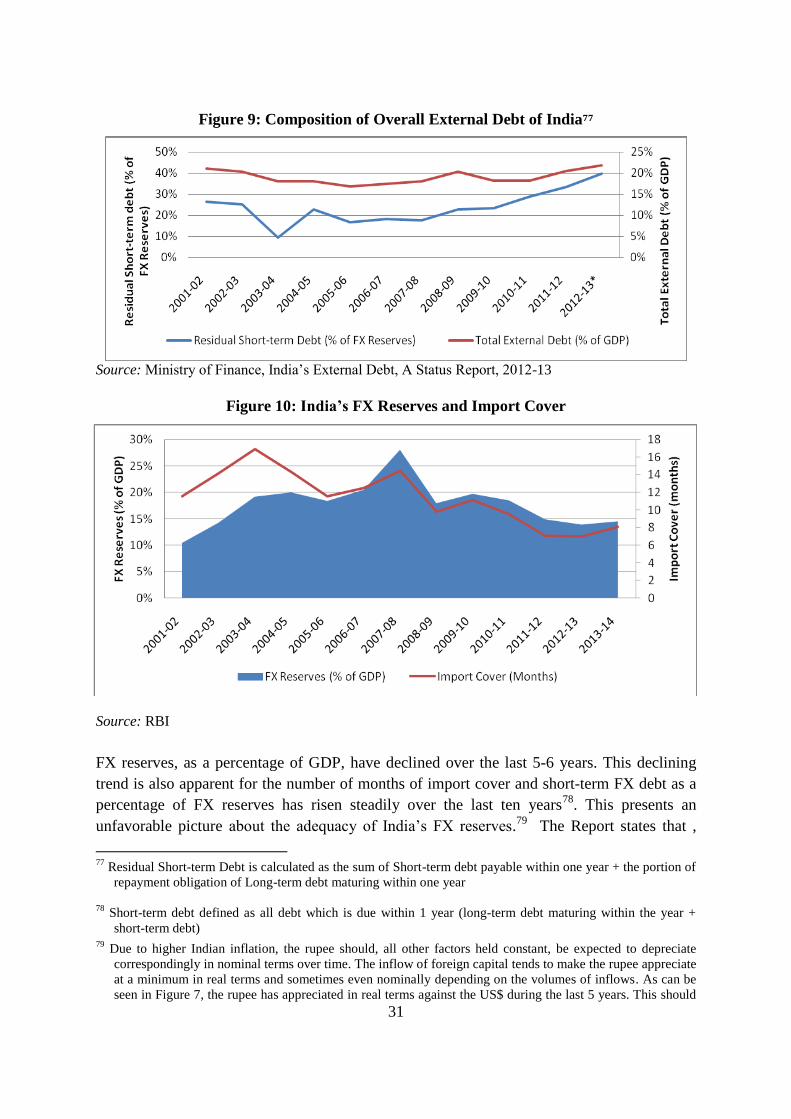
Figure 9: Composition of Overall External Debt of India ................................................................... 31
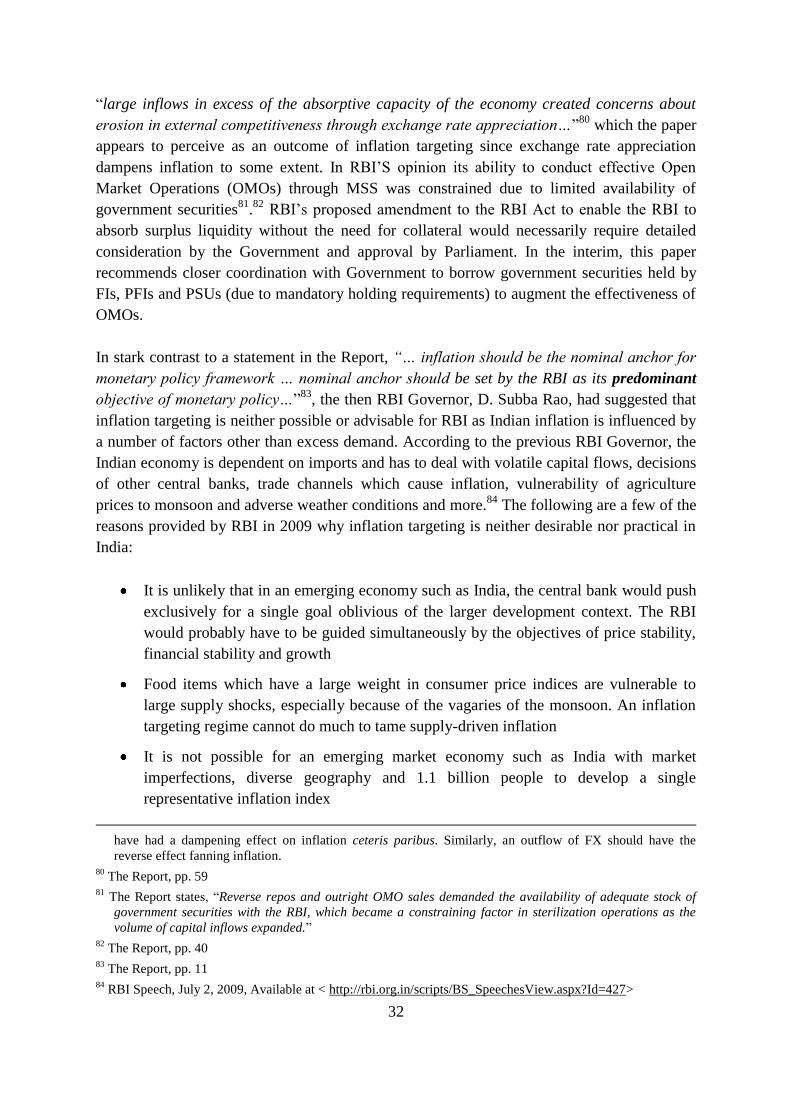
Figure 10: India’s FX Reserves and Import Cover .............................................................................. 31
List of Annexes
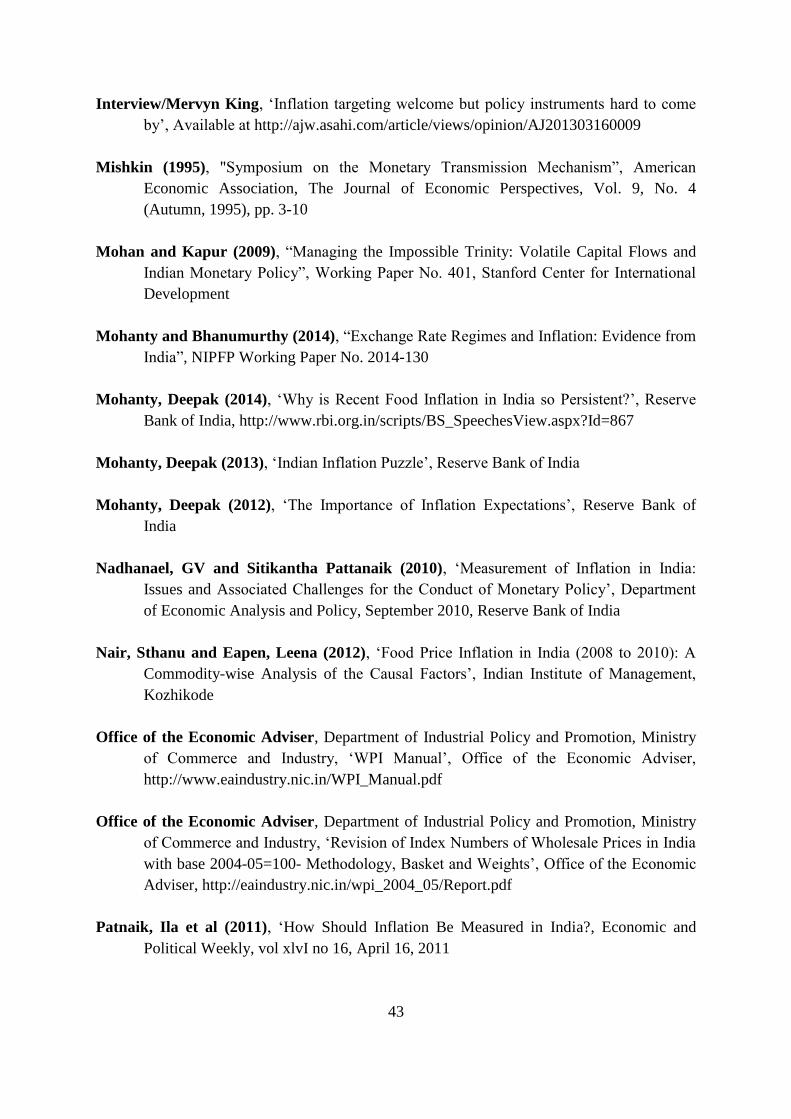
Annex A: Real Interest Rates in India .................................................................................................. 46
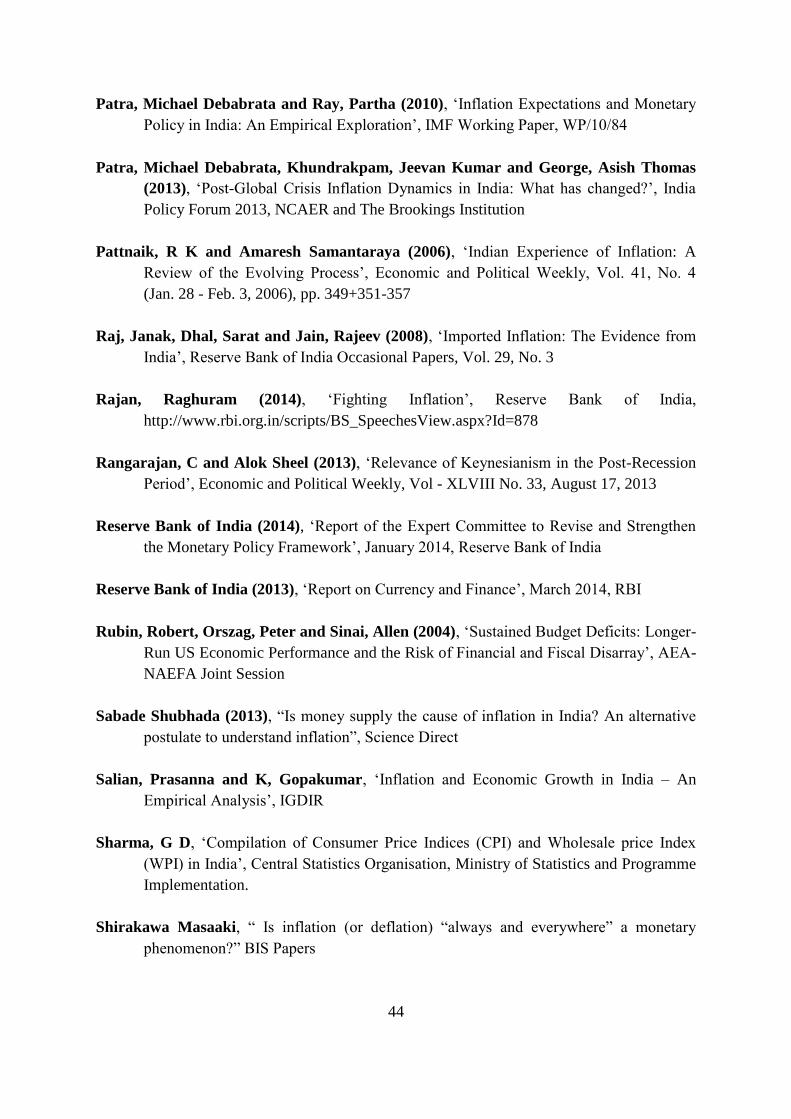
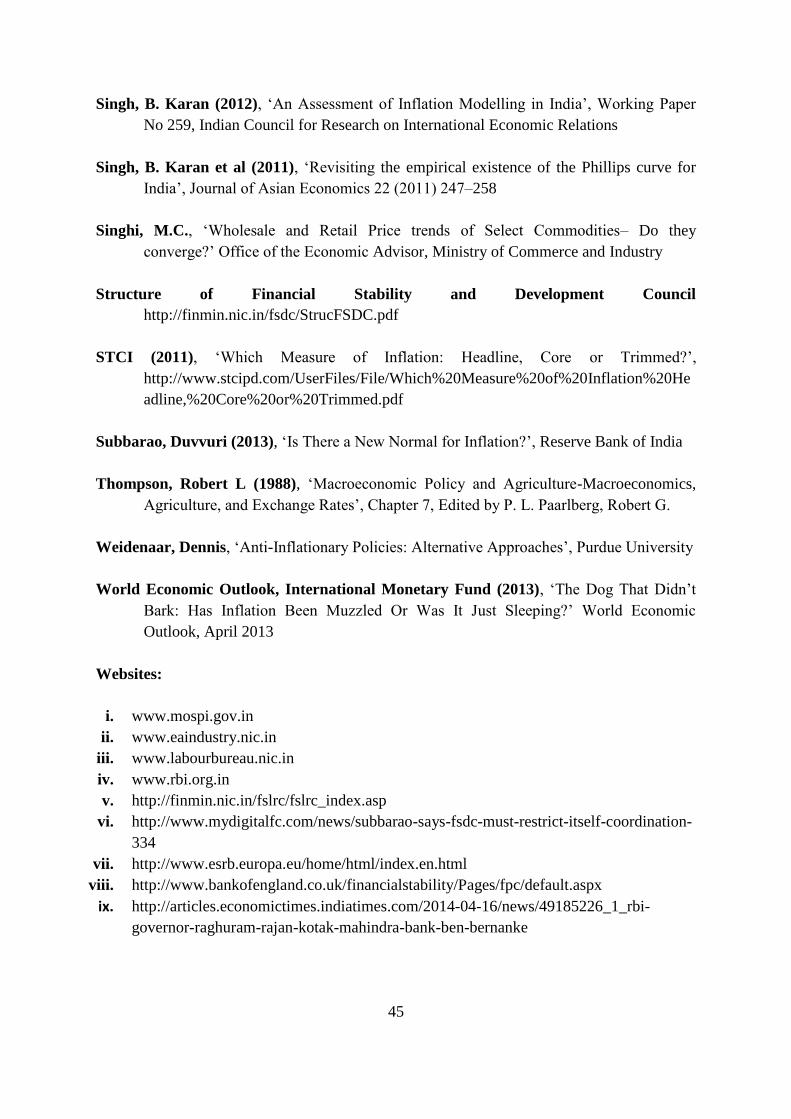
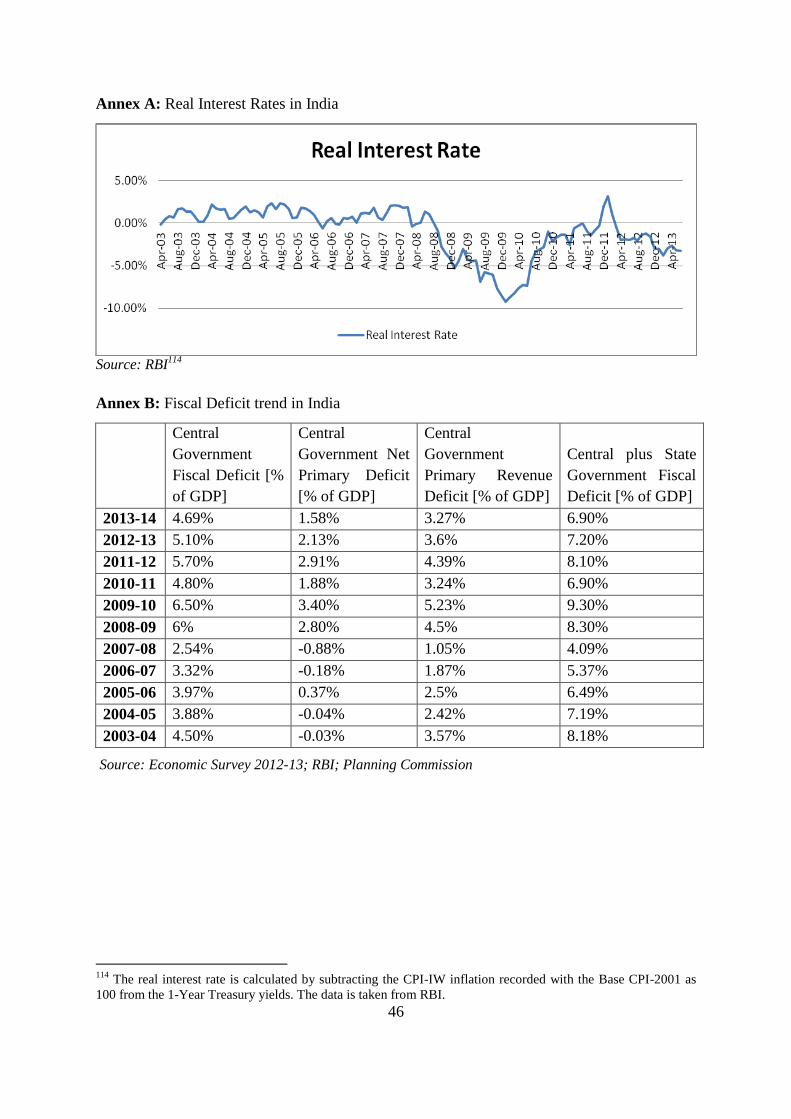
Annex B: Fiscal Deficit trend in India ................................................................................................. 46
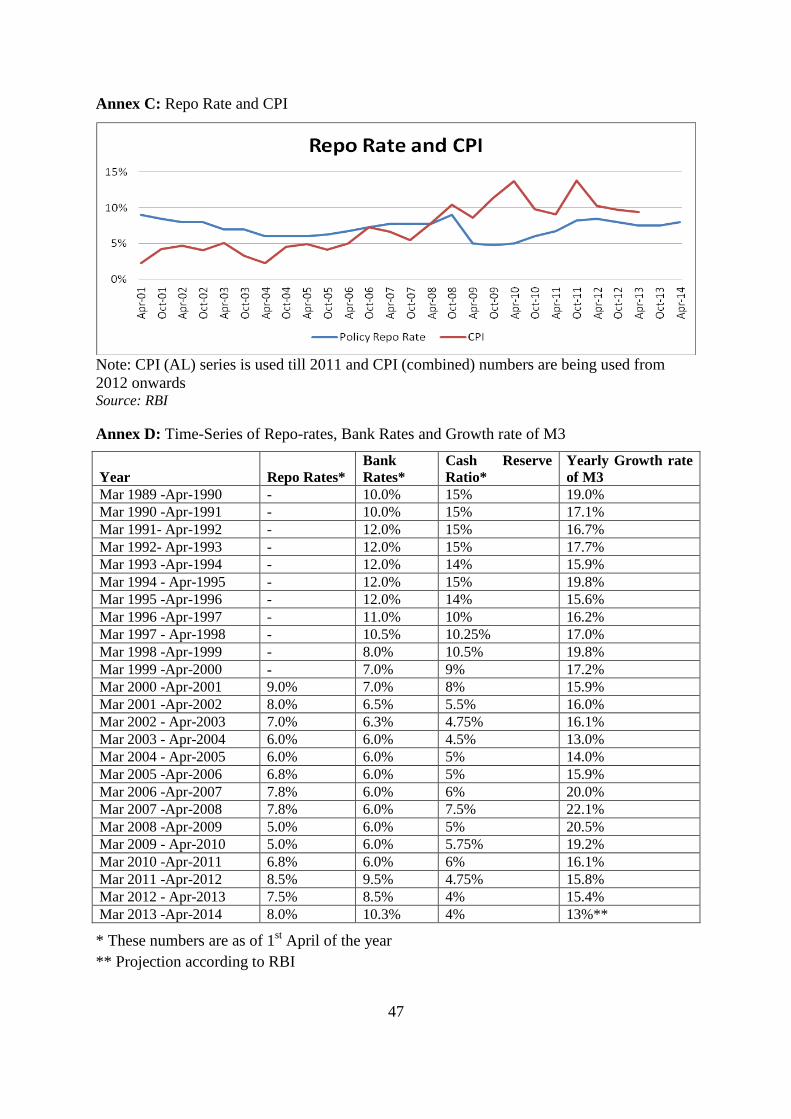
Annex C: Repo Rate and CPI .............................................................................................................. 47
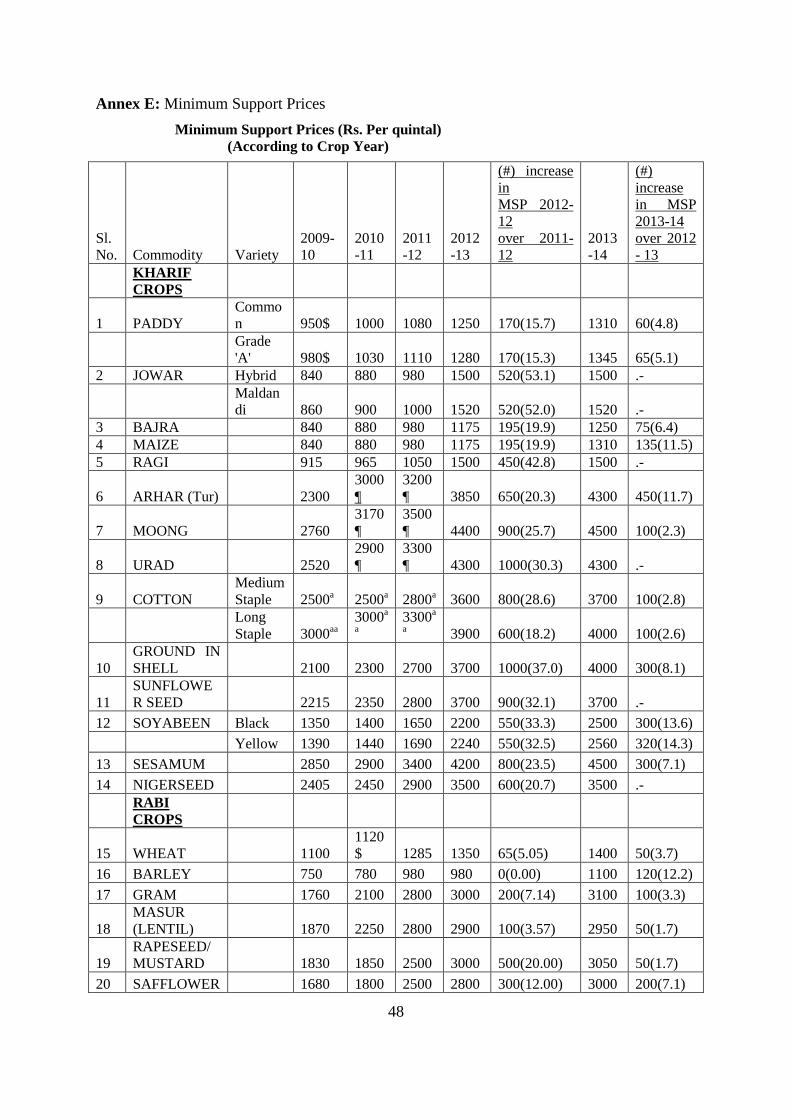
Annex D: Time-Series of Repo-rates, Bank Rates and Growth rate of M3 ......................................... 47
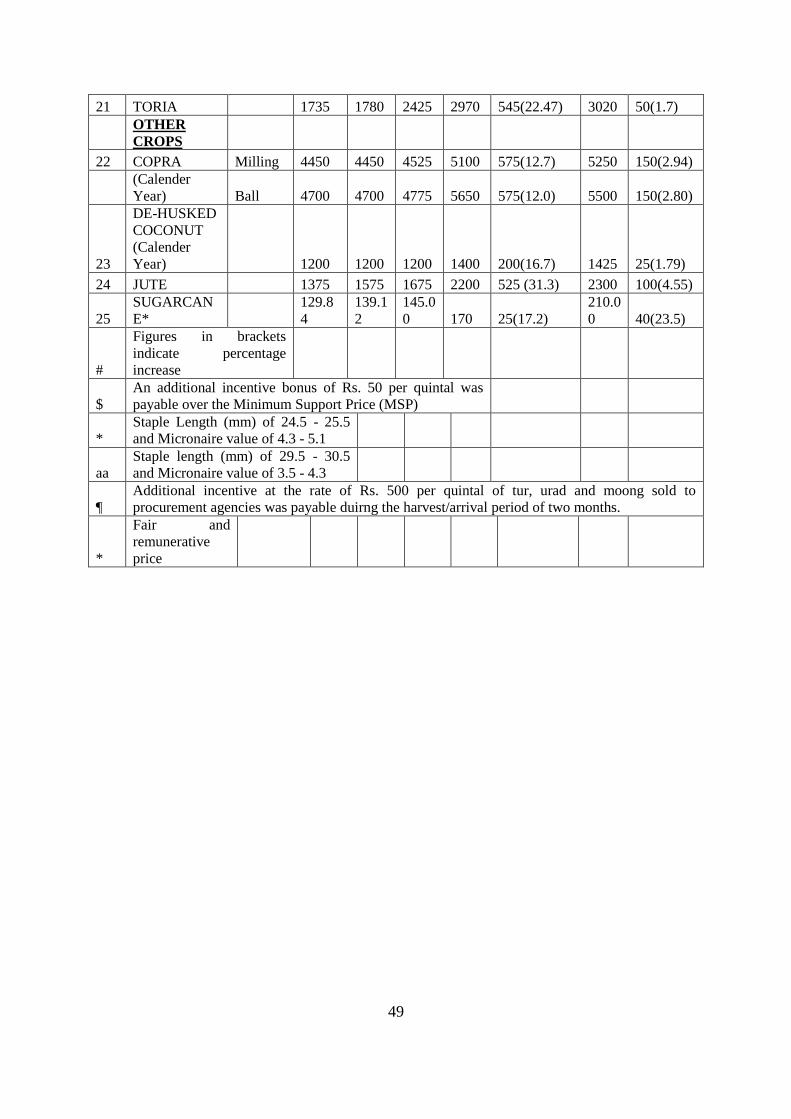
Annex E: Minimum Support Prices ..................................................................................................... 48
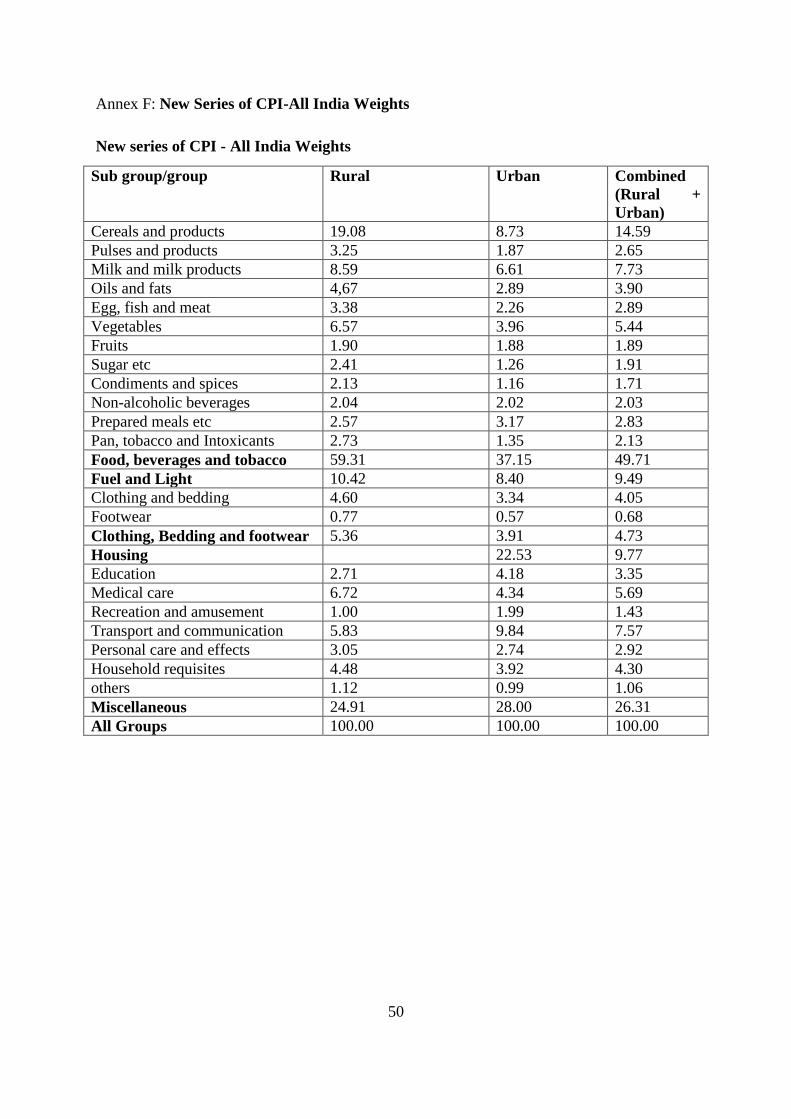
Annex F: New Series of CPI-All India Weights .................................................................................. 50
Page 4
iii
Abbreviations
AMFI Association of Mutual Funds of India
APMC Agricultural Produce Market Committee
AUM Asset under Management
C-CPI-U Chained CPI for all Urban Consumers
CPI Consumer Price Index
CPI (IL) CPI for Industrial Labourers
CPI (RL) CPI for Rural Labourers
CPI(AL) CPI for Agricultural Labourers
CPI-U CPI for all Urban Consumers
CPI-W CPI for urban wage earners and clerical workers
CSO Central Statistics Office
DEA Department of Economic Affairs
DFS Department of Financial Services
DIPP Department of Industrial Policy and Promotion
ECB European Central Bank
EPF Employee Provident Fund
EU European Union
FATF Financial Action Task Force
FCI Food Corporation of India
Fis Financial Institutions
FMC Forward Markets Commission
FOMC Federal Open Market Committee
FSB Financial Stability Board
FSDC Financial Stability and Development Council
FSLRC Financial Sector Legislative Reforms Commission
FSO Federal Statistical Office
FX Foreign Exchange
GNP Gross National Product
GPF General Provident Fund
GVO Gross Value of Output
HCIP Harmonised Index of Consumer Prices
Page 5
iv
IMF International Monetary Fund
IRDA Insurance Regulatory and Development Authority
MoSPI Ministry of Statistics and Programme Implementation
MPCE Monthly Per Capita Expenditure
MSP Minimum Support Price
MSS Market Stabilisation Scheme
NSSO National Sample Survey Organisation
OMOs Open Market Operations
PBC People’s Bank of China
PCE Personal Consumption Expenditures
PFIs Public Financial Institutions
PFRDA Pension Fund Regulatory and Development Authority
PPF Public Provident Fund
PPI Producer Price Indices
PSUs Public Sector Undertakings
RBI Reserve Bank of India
RPI Retail Price Index
SEBI Securities and Exchange Board of India
UMPs Unprecedented Monetary Policies
WPI Wholesale Price Index
Page 6
v
Acknowledgement
Dr. Jaimini Bhagwati, ICRIER-RBI Chair conceived the subject matter and structure of this
paper and we are grateful for his close and continuous supervision. We are thankful to Ms
Shivani Sagar for providing efficient secretarial assistance.
Page 7
vi
Abstract
The paper reviews the calculation of Indian wholesale and consumer price indices and
suggests improvements in the light of past experience and international best practices. It
confirms that food inflation has been the driver of domestic inflation.
The paper studies the recommendations of the Urjit Patel Committee and comments that
monetary policies predominantly focussed on inflation targeting may not necessarily be
effective in India where inflation and inflationary expectations, compared to developed
countries, are not that driven by excess demand. A number of shortcomings in storage,
distribution and supply bottlenecks are also relevant. The paper also suggests that the
efficiency of price discovery mechanisms including those that are relevant for the financial
sector need to be improved to enhance the effectiveness of an explicit inflation targeting
regime. In this context, the paper lists the approach taken by a few prominent central bankers
to inflation targeting post the widespread financial-economic meltdown of 2008.
Indian inflation has been sticky and based on past experience the paper recommends a
multiple-target approach and closer coordination between fiscal and monetary authorities.
_______________
JEL Classification: E31, E52, E58, E62, F62.
Keywords: Inflation in India, WPI inflation, CPI inflation, Price distortions, monetary
policy transmission, liquidity
Authors Emails: [email protected] , [email protected]
__________
Disclaimer: Opinions and recommendations in the paper are exclusively of the author(s) and
not of any other individual or institution including ICRIER
Page 8
1
Salient Features of Measuring, Interpreting and Addressing Indian Inflation
Kirti Gupta and Fahad Siddiqui1
Section 1
1.1 Introduction2
After the financial sector meltdown of 2008 and world-wide negative macroeconomic
consequences, there has been renewed focus on macroprudential policies. It is agreed in
several quarters that economic and financial stability are important objectives which need to
factored into central bank and government thinking rather than an excessive focus on
inflation using interest rates as the principal instrument of choice. Academics, multilateral
institutions such as the IMF and FSB, central bankers and governments are reviewing the
need and implications of macro and micro prudential policies with a view to revise the
traditional roles of central banks and governments. Concurrently, there is a sense of
uncertainty about the national and international consequences of this prolonged period since
2009 that large developed economies such as the US have maintained very low to negative
real interest rates using Unprecedented Monetary Policies (UMPs).3
The central banks of the US and UK have engaged in Quantitative Easing which is another
way of saying that they printed money by buying large volumes of government and mortgage
backed securities. The European Central Bank (ECB) announced recently that deposits with
ECB could carry negative nominal interest rates of up to minus 0.1%. It remains to be seen if
the central banks of G7 countries can ensure that the asset bubbles which may have been
created by such massively expansionary monetary policies would not be pricked abruptly and
unexpectedly.
In contrast to developed countries, India escaped with relatively little damage to its banks
since its capital account is relatively closed and its financial sector is predominantly majority
government owned. Turning to Indian inflation, which is the principal focus of this paper, in
the last six decades India’s average annual inflation rate (measured by changes in the
wholesale price index - WPI) was about 6.7% per annum. This rate of inflation was not
particularly high compared to rates experienced by developing and emerging economies.
However, since 2010 Indian inflation has hovered near or beyond double digits mainly on
account of high food inflation. Indian inflation is currently the highest among most emerging
economies, matched only by Vietnam which is a smaller and more open economy. As is well
recognised, high inflation erodes confidence in future purchasing power thus impacting
savings, investment and economic growth. Reduced domestic and foreign investor confidence
1 Kirti Gupta and Fahad Siddiqui are Researchers at ICRIER.
2 This paper has been written as part of Research Studies conducted under ‘ICRIER-RBI Chair’ headed by Dr.
Jaimini Bhagwati. We are thankful to Dr Shankar Acharya and Dr. Rakesh Mohan for their valuable
comments. 3 Bayoumi, T. etal, ‘Monetary Policy in the New Normal’, IMF Staff Discussion Note
Page 9
2
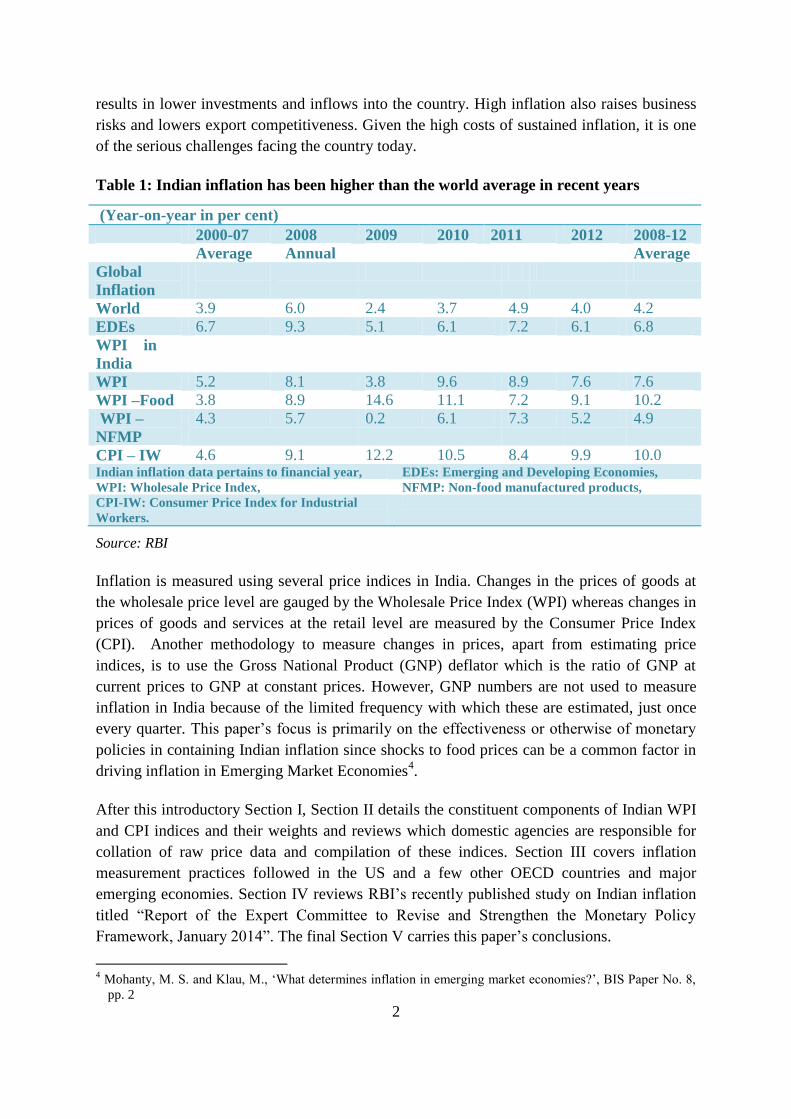
results in lower investments and inflows into the country. High inflation also raises business
risks and lowers export competitiveness. Given the high costs of sustained inflation, it is one
of the serious challenges facing the country today.
Table 1: Indian inflation has been higher than the world average in recent years
(Year-on-year in per cent)
2000-07 2008 2009 2010 2011 2012 2008-12
Average Annual Average
Global
Inflation
World 3.9 6.0 2.4 3.7 4.9 4.0 4.2
EDEs 6.7 9.3 5.1 6.1 7.2 6.1 6.8
WPI in
India
WPI 5.2 8.1 3.8 9.6 8.9 7.6 7.6
WPI –Food 3.8 8.9 14.6 11.1 7.2 9.1 10.2
WPI –
NFMP
4.3 5.7 0.2 6.1 7.3 5.2 4.9
CPI – IW 4.6 9.1 12.2 10.5 8.4 9.9 10.0 Indian inflation data pertains to financial year, EDEs: Emerging and Developing Economies,
WPI: Wholesale Price Index, NFMP: Non-food manufactured products,
CPI-IW: Consumer Price Index for Industrial
Workers.
Source: RBI
Inflation is measured using several price indices in India. Changes in the prices of goods at
the wholesale price level are gauged by the Wholesale Price Index (WPI) whereas changes in
prices of goods and services at the retail level are measured by the Consumer Price Index
(CPI). Another methodology to measure changes in prices, apart from estimating price
indices, is to use the Gross National Product (GNP) deflator which is the ratio of GNP at
current prices to GNP at constant prices. However, GNP numbers are not used to measure
inflation in India because of the limited frequency with which these are estimated, just once
every quarter. This paper’s focus is primarily on the effectiveness or otherwise of monetary
policies in containing Indian inflation since shocks to food prices can be a common factor in
driving inflation in Emerging Market Economies4.
After this introductory Section I, Section II details the constituent components of Indian WPI
and CPI indices and their weights and reviews which domestic agencies are responsible for
collation of raw price data and compilation of these indices. Section III covers inflation
measurement practices followed in the US and a few other OECD countries and major
emerging economies. Section IV reviews RBI’s recently published study on Indian inflation
titled “Report of the Expert Committee to Revise and Strengthen the Monetary Policy
Framework, January 2014”. The final Section V carries this paper’s conclusions.
4 Mohanty, M. S. and Klau, M., ‘What determines inflation in emerging market economies?’, BIS Paper No. 8,
pp. 2
Page 10
3
Section 2
Architecture of Indian Inflation Indices
2.1 WPI
India’s WPI was based on select items which were considered important region-wise on the
basis of the traded values of commodity baskets5. For instance, the manufacturing product
basket includes all such products with traded value of Rs 120 crore or more. This was the
procedure followed for the 1993-94 (base year) series. However, this practice was later
changed and 2004-05 was taken as the base year which included each product group in the
manufacturing basket, which together cover at least 80 per cent of the traded value at the
group level6. The price movements of each commodity are tracked individually. For instance,
the latest WPI with base year 2004-05 includes 676 commodities and 5482 price quotations
which are taken into account while calculating the index. However, price quotations are
obtained on a voluntary basis and surveys have not been done on a periodically consistent
basis.
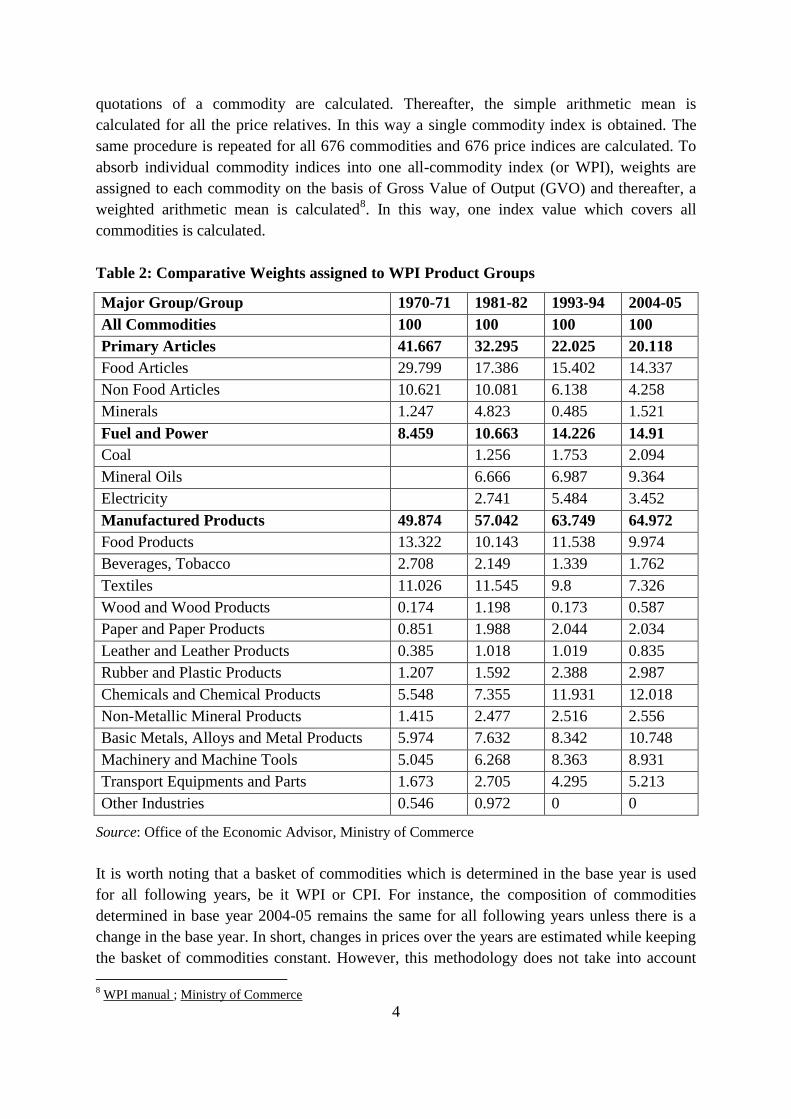
The constituents of the WPI are now categorised into three groups (a) Primary Articles which
mostly consist of Food items; (b) Fuel & Power; and (c) Manufactured Products. The highest
weight is assigned to Manufactured Products and this category constitutes approximately
50% with the Primary items category with Food amounting to about 30%. As shown in Table
2, weights are assigned on the basis of wholesale transactions and these weights have
changed over time.
WPI data collection is not done on a defined periodicity basis and there are no pan-India
collection centres. Price quotations for manufactured items are collected through online
surveys conducted by the Ministry of Commerce and Industry whereby designated factories
submit their data online. Price quotations for food items are collated by the Ministry of
Agriculture and fossil fuel prices are put together by Ministry of Petroleum and Natural Gas
and by PSUs. It is understood that the manner in which the Ministries collect their data is
deemed confidential. These Ministries and Government bodies pass on their data to the
Office of the Economic Adviser, Department of Industrial Policy and Promotion (DIPP) in
the Ministry of Commerce and Industry where the data is collated and the national Wholesale
Price Index is released on a monthly basis7.
Specifically, the WPI is calculated as follows: First, the price index for each commodity is
calculated individually for which price relatives (current price/base price)*100 for all price
5 Traded value = Domestic production plus Imports net of direct imports reaching factories minus Direct
exports. 6 Kumar and Boopathy (2012), CSO
7 Ministry of Commerce and Industry used to release weekly WPI data on groupings of Primary items such as
Food and Fuel & Power. The Government discontinued this practice from February 2012 and since then data
has been released on a monthly basis.
Page 11
4
quotations of a commodity are calculated. Thereafter, the simple arithmetic mean is
calculated for all the price relatives. In this way a single commodity index is obtained. The
same procedure is repeated for all 676 commodities and 676 price indices are calculated. To
absorb individual commodity indices into one all-commodity index (or WPI), weights are
assigned to each commodity on the basis of Gross Value of Output (GVO) and thereafter, a
weighted arithmetic mean is calculated8. In this way, one index value which covers all
commodities is calculated.
Table 2: Comparative Weights assigned to WPI Product Groups
Major Group/Group 1970-71 1981-82 1993-94 2004-05
All Commodities 100 100 100 100
Primary Articles 41.667 32.295 22.025 20.118
Food Articles 29.799 17.386 15.402 14.337
Non Food Articles 10.621 10.081 6.138 4.258
Minerals 1.247 4.823 0.485 1.521
Fuel and Power 8.459 10.663 14.226 14.91
Coal 1.256 1.753 2.094
Mineral Oils 6.666 6.987 9.364
Electricity 2.741 5.484 3.452
Manufactured Products 49.874 57.042 63.749 64.972
Food Products 13.322 10.143 11.538 9.974
Beverages, Tobacco 2.708 2.149 1.339 1.762
Textiles 11.026 11.545 9.8 7.326
Wood and Wood Products 0.174 1.198 0.173 0.587
Paper and Paper Products 0.851 1.988 2.044 2.034
Leather and Leather Products 0.385 1.018 1.019 0.835
Rubber and Plastic Products 1.207 1.592 2.388 2.987
Chemicals and Chemical Products 5.548 7.355 11.931 12.018
Non-Metallic Mineral Products 1.415 2.477 2.516 2.556
Basic Metals, Alloys and Metal Products 5.974 7.632 8.342 10.748
Machinery and Machine Tools 5.045 6.268 8.363 8.931
Transport Equipments and Parts 1.673 2.705 4.295 5.213
Other Industries 0.546 0.972 0 0
Source: Office of the Economic Advisor, Ministry of Commerce
It is worth noting that a basket of commodities which is determined in the base year is used
for all following years, be it WPI or CPI. For instance, the composition of commodities
determined in base year 2004-05 remains the same for all following years unless there is a
change in the base year. In short, changes in prices over the years are estimated while keeping
the basket of commodities constant. However, this methodology does not take into account
8 WPI manual ; Ministry of Commerce
Page 12
5
changes in consumption patterns over time. Therefore, timely revision of base years would be
a better practice to follow.
2.2 CPI
Currently, four CPIs are estimated in India, corresponding to different segments of the
population. Namely: (a) CPI for Industrial Labourers (IL); (b) CPI for Agricultural Labourers
(AL); (c) CPI for Rural Labourers (RL); and (d) CPI for all-India (or combined CPI) which
was released recently and encompasses all groupings of the population9. Further, all-India
CPI is sub-divided into urban CPI which corresponds to prices for populations resident in
urban areas and rural CPI which takes into account the rural populations in India10
.
India did not have one composite consumer price index before the advent of all-India CPI.
Four different price indices corresponding to specific sections of the population were
estimated. That is CPI (IL), CPI (AL), CPI (RL) and CPI (UNME). The dissemination of four
different indices was a source of some confusion to both observers and analysts. Khatkhate
(2006), Karan (2012) constructed a composite CPI by using different weight criteria11
. Now
this cause for differences in opinion has been eliminated as Government has decided on a CPI
for the country as a whole. However, the difficulty now lies in accessibility of distant past
data since this is only available January 2011 onwards with 2010 as a base-year.
Consequently, for time-series analysis in the next Section, CPI (IL) rather than CPI (AL) or
CPI (RL) is considered. CPI (IL) has wider geographical coverage as it covers all Indian
states while the latter two cover 20 states. Further, the CPI (IL) series has the latest base year
2001 while the others have dated base years 1986-87. Moreover, CPI-IL is used as a cost of
living index in the organised sector. And, CPI (IL) by default represents CPI when it is
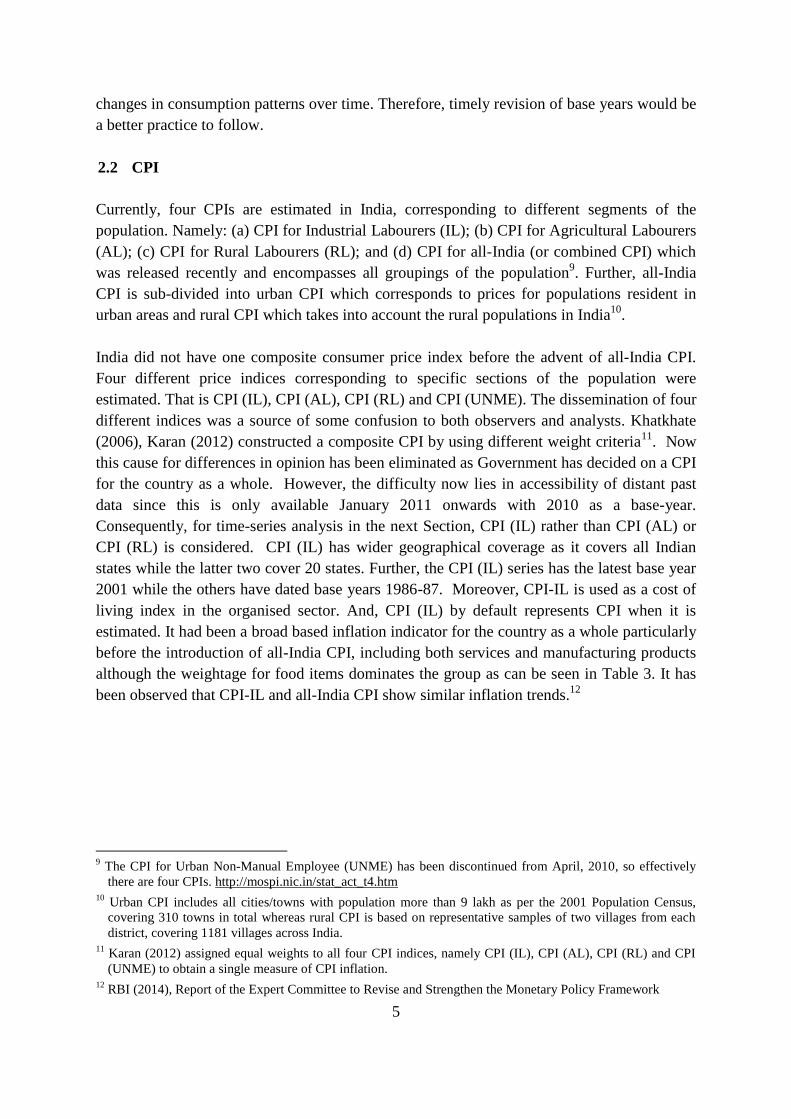
estimated. It had been a broad based inflation indicator for the country as a whole particularly
before the introduction of all-India CPI, including both services and manufacturing products
although the weightage for food items dominates the group as can be seen in Table 3. It has
been observed that CPI-IL and all-India CPI show similar inflation trends.12
9 The CPI for Urban Non-Manual Employee (UNME) has been discontinued from April, 2010, so effectively
there are four CPIs. http://mospi.nic.in/stat_act_t4.htm 10
Urban CPI includes all cities/towns with population more than 9 lakh as per the 2001 Population Census,
covering 310 towns in total whereas rural CPI is based on representative samples of two villages from each
district, covering 1181 villages across India. 11
Karan (2012) assigned equal weights to all four CPI indices, namely CPI (IL), CPI (AL), CPI (RL) and CPI
(UNME) to obtain a single measure of CPI inflation. 12
RBI (2014), Report of the Expert Committee to Revise and Strengthen the Monetary Policy Framework
Page 13
6
Table 3: Weights assigned to CPI-IL Product Groups, Base 2001
Particulars Weight
Food 57
Pan, Supari, Tobacco & Intoxicants 3.15
Fuel and light 6.28
Housing 8.67
Clothing, bedding and footwear 8.54
Miscellaneous* 16.36
Total 100
*Includes (a) Medical care, Education (b) Recreation and Amusement (c) Transport and
Communication (d) Personal Care and Effects (e) Others
Source: Ministry of Labour and Employment
The price data collection for CPI (IL) is done by 78 centres spread across India as per the
coverage of industries. Each centre calculates its own monthly sub-groups, groups and
general (all groups combined) indices. By taking the weighted arithmetic average of centres’
indices, an all-India index is obtained. The index in each centre is calculated in several stages
by sub-groups and general groups. First, the relative prices of each item included in a sub-
group, say, food is calculated. If an item has multiple price quotations, the price-relative is
first calculated separately and then a simple average of these price relatives is taken as the
price-relative for that item. In this manner, the relative price for each commodity is obtained.
Next, the sub-group and group weights are assigned to each commodity on the basis of
Family Living Surveys which are conducted periodically by the National Sample Survey
Organisation (NSSO) and weighted arithmetic means are calculated which are consolidated
to arrive at the general CPI. This procedure is repeated across centres and thus an all-India
CPI is obtained.
At the core of estimating dependable price indices is how reliable are the prices collected by
centres since the probability of errors in basic data is high. The number of items in the
consumption baskets of different centres varies from centre to centre depending on the
consumption pattern related to specific centres. The price data for each centre is collected by
employees of State Governments called Price Supervisors and Price Collectors who usually
belong to the Directorate/ Bureau of Economics and Statistics of Labour Departments. Each
centre usually targets more than one market and several shops in each of them. Thereafter,
the same shops are visited at regular intervals by Price Collectors under the guidance of Price
Supervisors. Accordingly, retail prices for various commodities, including food items are
collected by each centre. The retail price data collected by several centres across India are
scrutinised by Labour Bureau officers who are posted in Regional Offices located in Kanpur,
Ahmedabad, Madras and Kolkata. Finally, price data is reviewed by officers working at the
Headquarters of the Directorate/Bureau of Economics and Statistics of Labour Department in
Chandigarh and CPI (IL) is released on a monthly basis.
Page 14
7
CPI for Agricultural Labourers (AL) and Rural Labourers (RL) as these terms suggest pertain
to agricultural labour and rural labour households respectively. A rural labour household is
defined as one whose income during the last 365 days was more from wages paid for manual
employment (agricultural labour) vis-à-vis wages paid for non-manual employment and also
self-employment. From among rural labour households, those households, which earn 50%
or more of their total income during the last 365 days from wages paid for manual labour
engaged in agriculture related activities, are categorized as agricultural labour households. It
follows that agricultural labour households are a subset of rural labour households.
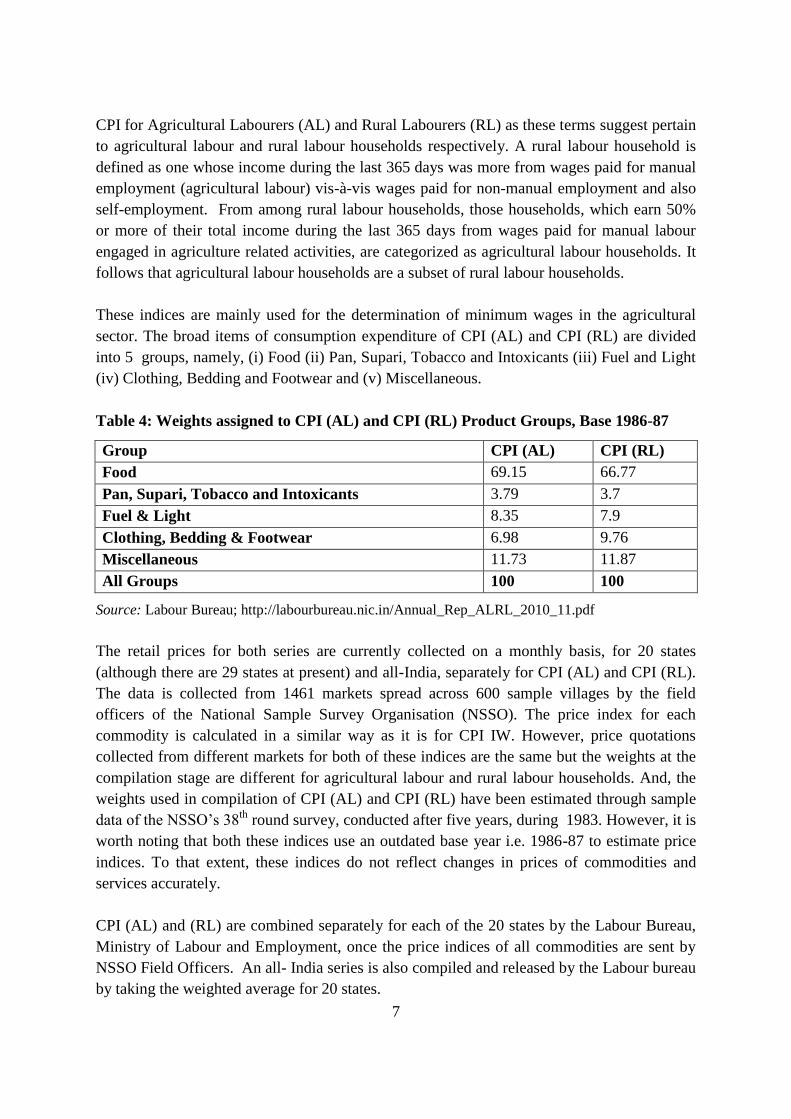
These indices are mainly used for the determination of minimum wages in the agricultural
sector. The broad items of consumption expenditure of CPI (AL) and CPI (RL) are divided
into 5 groups, namely, (i) Food (ii) Pan, Supari, Tobacco and Intoxicants (iii) Fuel and Light
(iv) Clothing, Bedding and Footwear and (v) Miscellaneous.
Table 4: Weights assigned to CPI (AL) and CPI (RL) Product Groups, Base 1986-87
Group CPI (AL) CPI (RL)
Food 69.15 66.77
Pan, Supari, Tobacco and Intoxicants 3.79 3.7
Fuel & Light 8.35 7.9
Clothing, Bedding & Footwear 6.98 9.76
Miscellaneous 11.73 11.87
All Groups 100 100
Source: Labour Bureau; http://labourbureau.nic.in/Annual_Rep_ALRL_2010_11.pdf
The retail prices for both series are currently collected on a monthly basis, for 20 states
(although there are 29 states at present) and all-India, separately for CPI (AL) and CPI (RL).
The data is collected from 1461 markets spread across 600 sample villages by the field
officers of the National Sample Survey Organisation (NSSO). The price index for each
commodity is calculated in a similar way as it is for CPI IW. However, price quotations
collected from different markets for both of these indices are the same but the weights at the
compilation stage are different for agricultural labour and rural labour households. And, the
weights used in compilation of CPI (AL) and CPI (RL) have been estimated through sample
data of the NSSO’s 38th
round survey, conducted after five years, during 1983. However, it is
worth noting that both these indices use an outdated base year i.e. 1986-87 to estimate price
indices. To that extent, these indices do not reflect changes in prices of commodities and
services accurately.
CPI (AL) and (RL) are combined separately for each of the 20 states by the Labour Bureau,
Ministry of Labour and Employment, once the price indices of all commodities are sent by
NSSO Field Officers. An all- India series is also compiled and released by the Labour bureau
by taking the weighted average for 20 states.
Page 15
8
The combined CPI which integrates different sections of the population is a better consumer
price measure as compared to aforementioned CPIs, since it is one unified and pan-India CPI
with the latest base year of 2010. Combined CPI provides statistics for urban, rural and
combined populations. The index is also available for all States13
/ UTs separately for rural,
urban and combined every month with effect from January 2011. Similar to CPI (AL) and
RL, weights or consumption pattern are derived on the basis of average monthly consumer
expenditure of urban/rural households obtained from the results of the Consumer Expenditure
Survey conducted by the NSSO during 2004-05. In comparison to other CPIs, it has a broader
consumption basket, comprising about 175 items in rural and around 200 items in urban
areas.
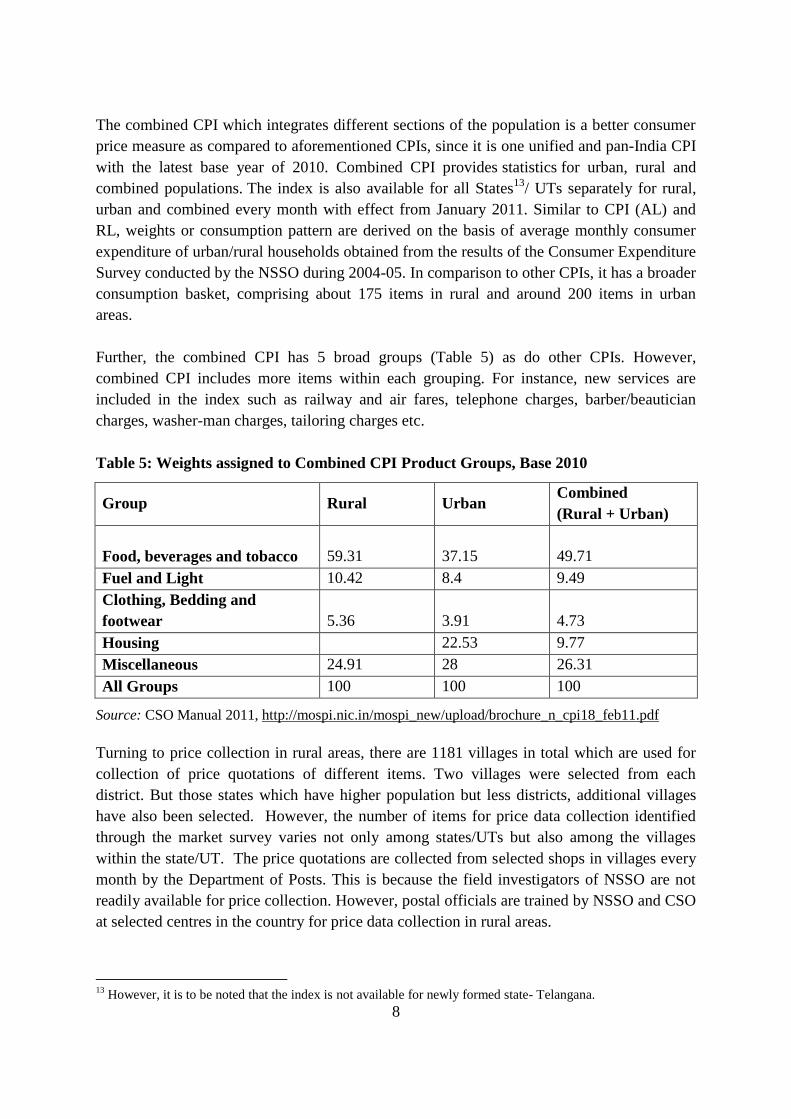
Further, the combined CPI has 5 broad groups (Table 5) as do other CPIs. However,
combined CPI includes more items within each grouping. For instance, new services are
included in the index such as railway and air fares, telephone charges, barber/beautician
charges, washer-man charges, tailoring charges etc.
Table 5: Weights assigned to Combined CPI Product Groups, Base 2010
Group Rural Urban Combined
(Rural + Urban)
Food, beverages and tobacco 59.31 37.15 49.71
Fuel and Light 10.42 8.4 9.49
Clothing, Bedding and
footwear 5.36 3.91 4.73
Housing 22.53 9.77
Miscellaneous 24.91 28 26.31
All Groups 100 100 100
Source: CSO Manual 2011, http://mospi.nic.in/mospi_new/upload/brochure_n_cpi18_feb11.pdf
Turning to price collection in rural areas, there are 1181 villages in total which are used for
collection of price quotations of different items. Two villages were selected from each
district. But those states which have higher population but less districts, additional villages
have also been selected. However, the number of items for price data collection identified
through the market survey varies not only among states/UTs but also among the villages
within the state/UT. The price quotations are collected from selected shops in villages every
month by the Department of Posts. This is because the field investigators of NSSO are not
readily available for price collection. However, postal officials are trained by NSSO and CSO
at selected centres in the country for price data collection in rural areas.
13
However, it is to be noted that the index is not available for newly formed state- Telangana.
Page 16
9
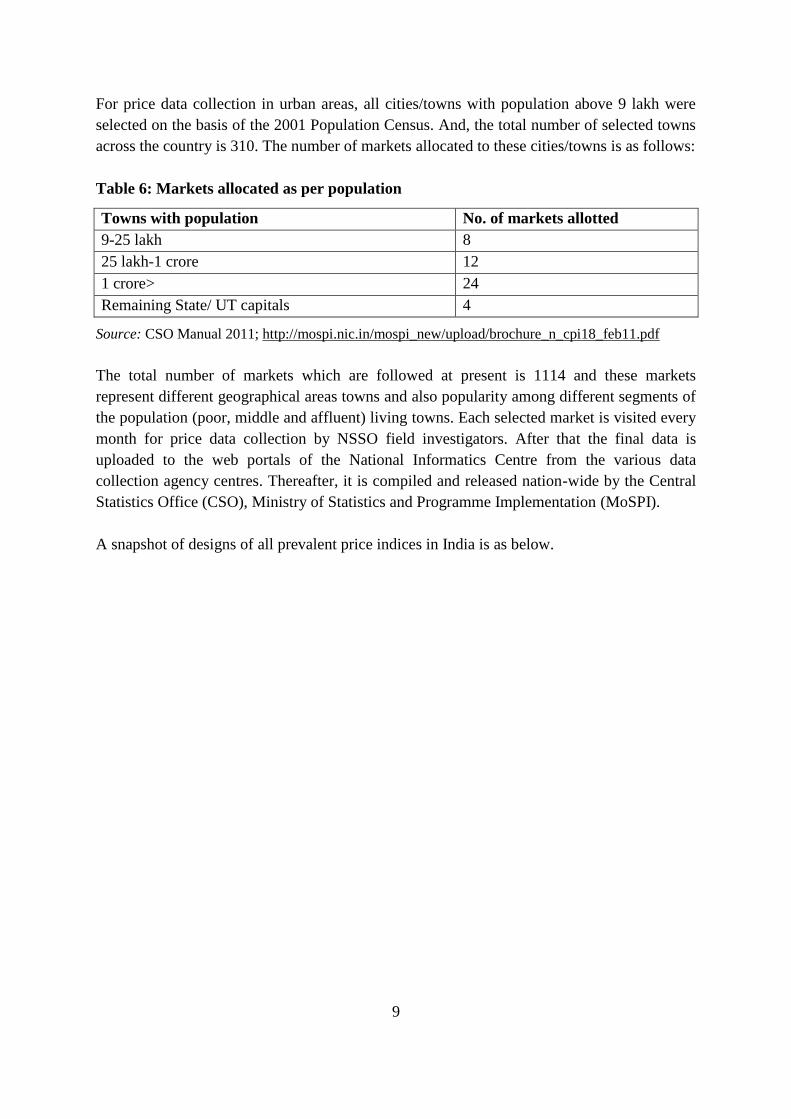
For price data collection in urban areas, all cities/towns with population above 9 lakh were
selected on the basis of the 2001 Population Census. And, the total number of selected towns
across the country is 310. The number of markets allocated to these cities/towns is as follows:
Table 6: Markets allocated as per population
Towns with population No. of markets allotted
9-25 lakh 8
25 lakh-1 crore 12
1 crore> 24
Remaining State/ UT capitals 4
Source: CSO Manual 2011; http://mospi.nic.in/mospi_new/upload/brochure_n_cpi18_feb11.pdf
The total number of markets which are followed at present is 1114 and these markets
represent different geographical areas towns and also popularity among different segments of
the population (poor, middle and affluent) living towns. Each selected market is visited every
month for price data collection by NSSO field investigators. After that the final data is
uploaded to the web portals of the National Informatics Centre from the various data
collection agency centres. Thereafter, it is compiled and released nation-wide by the Central
Statistics Office (CSO), Ministry of Statistics and Programme Implementation (MoSPI).
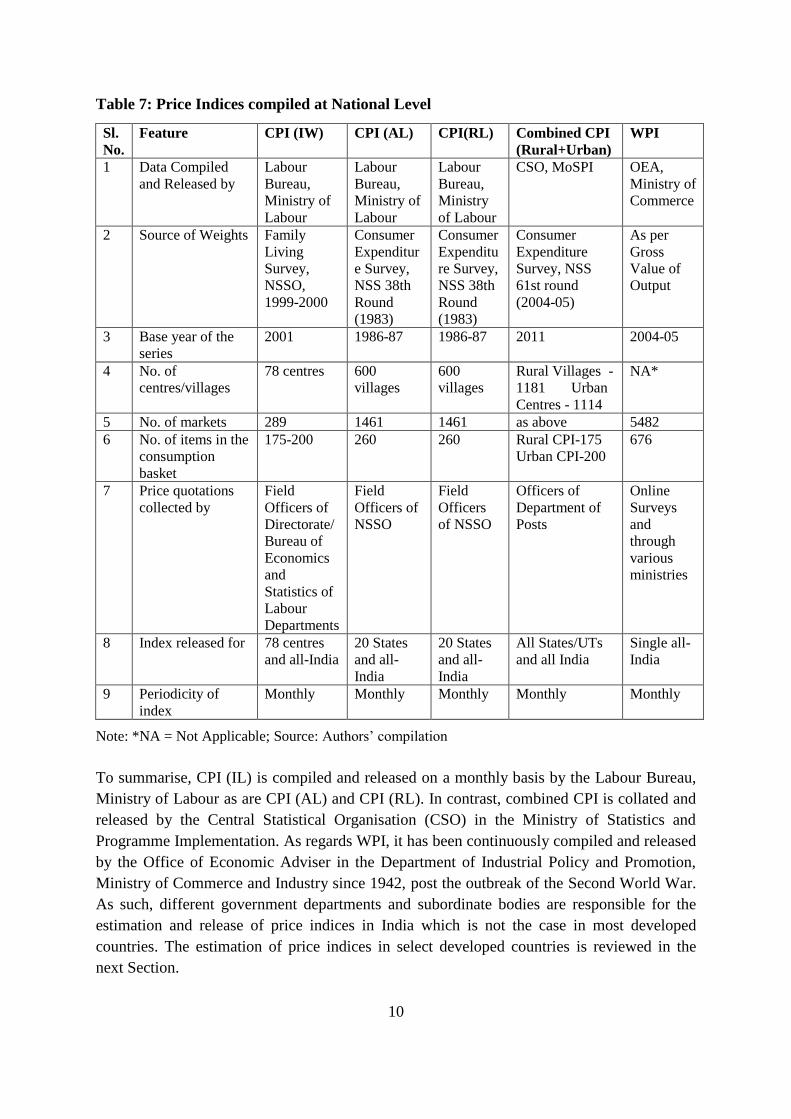
A snapshot of designs of all prevalent price indices in India is as below.
Page 17
10
Table 7: Price Indices compiled at National Level
Sl.
No.
Feature CPI (IW) CPI (AL) CPI(RL) Combined CPI
(Rural+Urban)
WPI
1 Data Compiled
and Released by
Labour
Bureau,
Ministry of
Labour
Labour
Bureau,
Ministry of
Labour
Labour
Bureau,
Ministry
of Labour
CSO, MoSPI OEA,
Ministry of
Commerce
2 Source of Weights Family
Living
Survey,
NSSO,
1999-2000
Consumer
Expenditur
e Survey,
NSS 38th
Round
(1983)
Consumer
Expenditu
re Survey,
NSS 38th
Round
(1983)
Consumer
Expenditure
Survey, NSS
61st round
(2004-05)
As per
Gross
Value of
Output
3 Base year of the
series
2001 1986-87 1986-87 2011 2004-05
4 No. of
centres/villages
78 centres 600
villages
600
villages
Rural Villages -
1181 Urban
Centres - 1114
NA*
5 No. of markets 289 1461 1461 as above 5482
6 No. of items in the
consumption
basket
175-200 260 260 Rural CPI-175
Urban CPI-200
676
7 Price quotations
collected by
Field
Officers of
Directorate/
Bureau of
Economics
and
Statistics of
Labour
Departments
Field
Officers of
NSSO
Field
Officers
of NSSO
Officers of
Department of
Posts
Online
Surveys
and
through
various
ministries
8 Index released for 78 centres
and all-India
20 States
and all-
India
20 States
and all-
India
All States/UTs
and all India
Single all-
India
9 Periodicity of
index
Monthly Monthly Monthly Monthly Monthly
Note: *NA = Not Applicable; Source: Authors’ compilation
To summarise, CPI (IL) is compiled and released on a monthly basis by the Labour Bureau,
Ministry of Labour as are CPI (AL) and CPI (RL). In contrast, combined CPI is collated and
released by the Central Statistical Organisation (CSO) in the Ministry of Statistics and
Programme Implementation. As regards WPI, it has been continuously compiled and released
by the Office of Economic Adviser in the Department of Industrial Policy and Promotion,
Ministry of Commerce and Industry since 1942, post the outbreak of the Second World War.
As such, different government departments and subordinate bodies are responsible for the
estimation and release of price indices in India which is not the case in most developed
countries. The estimation of price indices in select developed countries is reviewed in the
next Section.
Page 18
11
Section 3
Measurement of inflation in larger economies
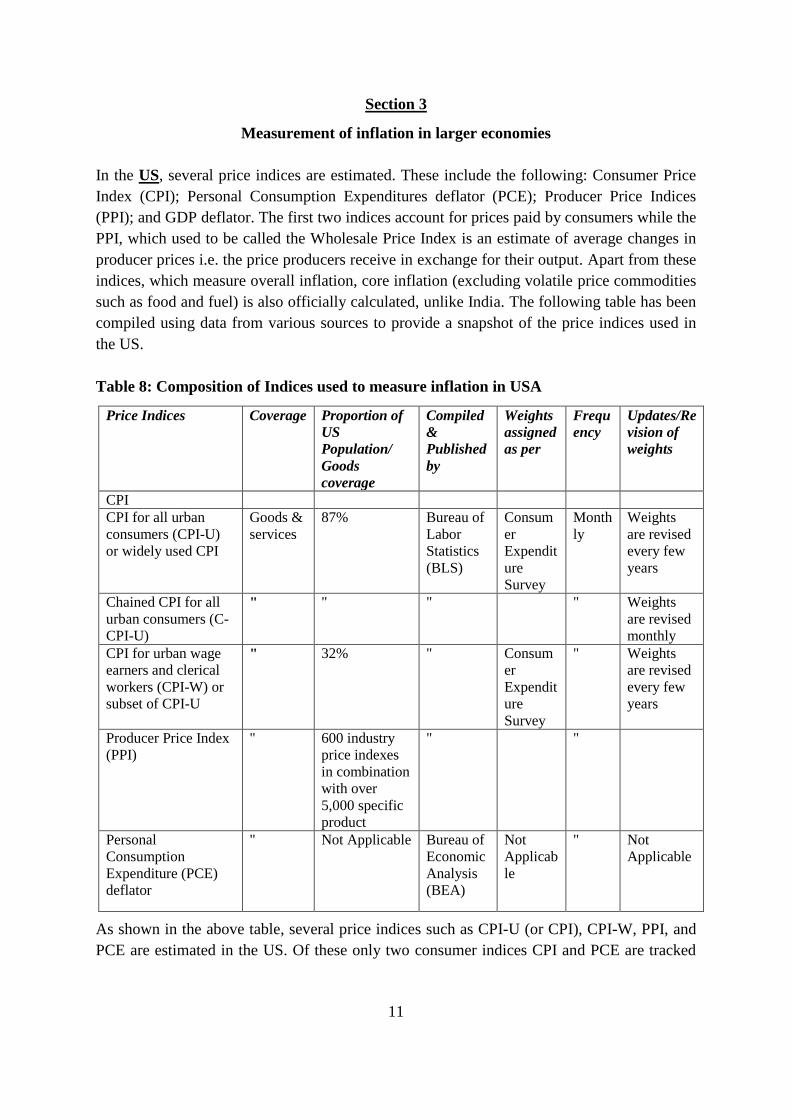
In the US, several price indices are estimated. These include the following: Consumer Price
Index (CPI); Personal Consumption Expenditures deflator (PCE); Producer Price Indices
(PPI); and GDP deflator. The first two indices account for prices paid by consumers while the
PPI, which used to be called the Wholesale Price Index is an estimate of average changes in
producer prices i.e. the price producers receive in exchange for their output. Apart from these
indices, which measure overall inflation, core inflation (excluding volatile price commodities
such as food and fuel) is also officially calculated, unlike India. The following table has been
compiled using data from various sources to provide a snapshot of the price indices used in
the US.
Table 8: Composition of Indices used to measure inflation in USA
Price Indices Coverage Proportion of
US
Population/
Goods
coverage
Compiled
&
Published
by
Weights
assigned
as per
Frequ
ency
Updates/Re
vision of
weights
CPI
CPI for all urban
consumers (CPI-U)
or widely used CPI
Goods &
services
87% Bureau of
Labor
Statistics
(BLS)
Consum
er
Expendit
ure
Survey
Month
ly
Weights
are revised
every few
years
Chained CPI for all
urban consumers (C-
CPI-U)
" " " " Weights
are revised
monthly
CPI for urban wage
earners and clerical
workers (CPI-W) or
subset of CPI-U
" 32% " Consum
er
Expendit
ure
Survey
" Weights
are revised
every few
years
Producer Price Index
(PPI)
" 600 industry
price indexes
in combination
with over
5,000 specific
product
" "
Personal
Consumption
Expenditure (PCE)
deflator
" Not Applicable Bureau of
Economic
Analysis
(BEA)
Not
Applicab
le
" Not
Applicable
As shown in the above table, several price indices such as CPI-U (or CPI), CPI-W, PPI, and
PCE are estimated in the US. Of these only two consumer indices CPI and PCE are tracked
Page 19
12
by the Federal government and the Federal Reserve Bank14
. To be precise the former uses
CPI to make inflation adjustments in social benefits such as social security while the latter
focuses on PCE inflation for its quarterly economic projections and for targeting longer-run
inflation goals. However, the Federal Open Market Committee (FOMC) used to focus on
headline CPI prior to 2000 but has since switched to PCE inflation. The PCE index is based
on actual spending by consumers whereas CPI is based on consumer surveys in which
consumers state what they spend. Further, the former has a more comprehensive coverage of
goods and services than the latter15
.
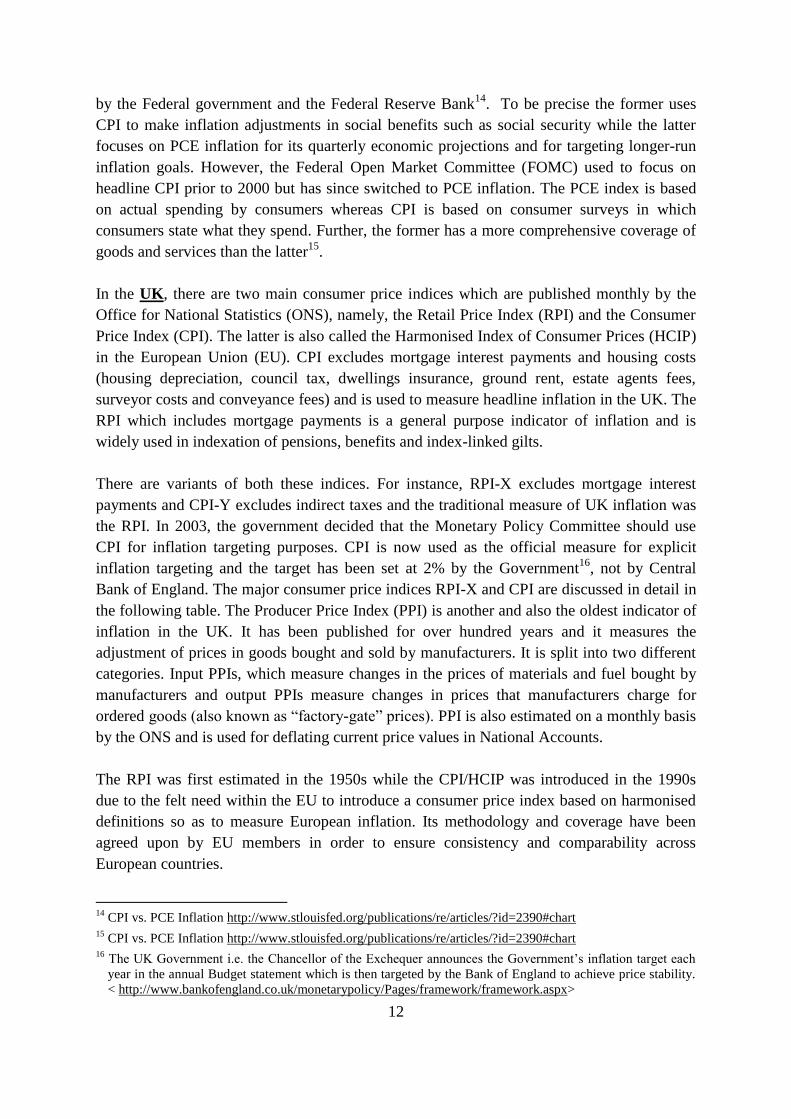
In the UK, there are two main consumer price indices which are published monthly by the
Office for National Statistics (ONS), namely, the Retail Price Index (RPI) and the Consumer
Price Index (CPI). The latter is also called the Harmonised Index of Consumer Prices (HCIP)
in the European Union (EU). CPI excludes mortgage interest payments and housing costs
(housing depreciation, council tax, dwellings insurance, ground rent, estate agents fees,
surveyor costs and conveyance fees) and is used to measure headline inflation in the UK. The
RPI which includes mortgage payments is a general purpose indicator of inflation and is
widely used in indexation of pensions, benefits and index-linked gilts.
There are variants of both these indices. For instance, RPI-X excludes mortgage interest
payments and CPI-Y excludes indirect taxes and the traditional measure of UK inflation was
the RPI. In 2003, the government decided that the Monetary Policy Committee should use
CPI for inflation targeting purposes. CPI is now used as the official measure for explicit
inflation targeting and the target has been set at 2% by the Government16
, not by Central
Bank of England. The major consumer price indices RPI-X and CPI are discussed in detail in
the following table. The Producer Price Index (PPI) is another and also the oldest indicator of
inflation in the UK. It has been published for over hundred years and it measures the
adjustment of prices in goods bought and sold by manufacturers. It is split into two different
categories. Input PPIs, which measure changes in the prices of materials and fuel bought by
manufacturers and output PPIs measure changes in prices that manufacturers charge for
ordered goods (also known as “factory-gate” prices). PPI is also estimated on a monthly basis
by the ONS and is used for deflating current price values in National Accounts.
The RPI was first estimated in the 1950s while the CPI/HCIP was introduced in the 1990s
due to the felt need within the EU to introduce a consumer price index based on harmonised
definitions so as to measure European inflation. Its methodology and coverage have been
agreed upon by EU members in order to ensure consistency and comparability across
European countries.
14
CPI vs. PCE Inflation http://www.stlouisfed.org/publications/re/articles/?id=2390#chart 15
CPI vs. PCE Inflation http://www.stlouisfed.org/publications/re/articles/?id=2390#chart 16
The UK Government i.e. the Chancellor of the Exchequer announces the Government’s inflation target each
year in the annual Budget statement which is then targeted by the Bank of England to achieve price stability.
< http://www.bankofengland.co.uk/monetarypolicy/Pages/framework/framework.aspx>
Page 20
13
Table 9: Composition of Inflation Indices in the UK
Criteria RPI-X CPI/HCIP
Composition: RPIX and
CPI differ in terms of
composition
Includes owner-occupied housing costs,
buildings insurance and Council Tax
These costs account for around 9% of
the RPIX basket of goods and services.
Does not include
owner-occupied
housing costs,
buildings insurance
and Council Tax
Measurement: Some
goods and services
appear in both baskets
but are measured in
different ways
Example: Cars
Uses only second-hand car prices
Example: Cars
Uses both new and
second-hand prices
Coverage: The RPIX’S chosen basket of goods
intends to represent an ‘average’ UK
household
Excludes expenditure by the highest
4% of earners, and pensioners largely
on benefits, and residents of
institutions.
The CPI takes into
accounting spending
by all consumers
Includes the
expenditure of all
private households and
residents, as well as
foreign visitors to the
UK
Methodology:
Differences arise from
combining
disaggregated price
information into an
aggregate index
Uses an arithmetic averaging procedure
for 60% of goods and services that do
not have sufficiently disaggregated
expenditure information to allow direct
inclusion in the aggregate index
Uses geometric
averaging
Since CPI takes the geometric mean of prices instead of the arithmetic mean, CPI is generally
lower than the RPI. The rationale is that this will account for consumers buying less if prices
go up and vice versa. This difference in the averaging method is the largest contributing
factor to the differences between the RPI and the CPI as per the Office for National Statistics.
Germany, Europe’s largest economy, monitors prices through its Federal Statistical Office
(FSO) which conducts surveys to calculate several price indices. Germany estimates a
national Consumer Price Index (CPI) and the Harmonised Index of Consumer Prices (HICP)
to track consumer price movements on a monthly basis. CPI captures the average price
change for all goods and services purchased by households for consumption and it provides
an overall sense of price rise in the country covering all households and regions. It is also
Page 21
14
used for deflation purposes in national accounts.17
German HCIP is calculated according to
EU wide established criteria and is used by the European Central Bank (ECB) to assess
inflation in Germany. It is also used in the calculation of European HICP. The Euro area
HICP is published by EU’s statistical outfit namely Eurostat and is used as a measure of
inflation in EU member countries.
Apart from these consumer price indices, Germany also estimates producer price, wholesale
price and foreign trade price indices. These indices are calculated on a monthly basis by the
FSO. The index of producer prices for industrial products measures price developments for
raw materials and industrial products produced and sold in Germany. This includes mineral
oil products, metals, basic chemicals and food and is used as a leading indicator of prices at
the upstream stages of production.
The Wholesale Price Index represents prices for goods sold by wholesalers in the domestic
economy. Goods sold include petrol, heating oil, metals, ores, grain and seed, etc. The goods
may have been produced within Germany territory or imported while in the case of the
Producer Price Index imported goods are not considered. In addition, price movements for all
goods traded between Germany and foreign countries are tracked by the Import and Export
Price Indices.
The Bundesbank was the first central bank to pursue strategies to contain inflation based on
monetary targets. The monetary aggregate used was central bank money, a narrow aggregate
which is the sum of currency in circulation and bank deposits weighted by the required
reserve ratios as of 1974. In 1988, the Bundesbank switched targets from central bank money
to M318
.
On 31 December 1998, due to the formation of the European Monetary Union, the
Bundesbank’s responsibility for conducting monetary policy came to an end. In the Euro
monetary area, a common inflation target is targeted for all member countries. Since 2000,
the strategy followed by the ECB is to keep year-on-year inflation in the Euro area HCIP to
below 2%. Of course, in recent times the ECB is concerned about deflation in the Euro area
and is even contemplating the possibility of negative nominal interest rates.
China’s central bank (People’s Bank of China or PBC) does not explicitly target inflation.
The PBC focuses on the value of the currency and exchange rate stability. China uses
multiple instruments including foreign exchange market interventions, reserve requirements
and administrative controls on interest rates to target growth of money and credit.19
17
Federal Statistical Office 18
European Central Bank Working Paper; Duetsche Bundesbank Discussion Paper 19
Filardo, A. and Genberg, H., ‘ Targeting inflation in Asia and the Pacific’, Bank of International Settlements
and Hong Kong Monetary Authority
Page 22
15
Indonesia achieves its objectives by an inflation targeting framework. Indonesia’s central
bank targets price stability and exchange rate stability as its objectives. The CPI ceiling is set
by the Government after coordination with the Bank of Indonesia which then serves as the
target for the central bank’s policies. It is important to note that the inflation in Indonesia is
subject to shocks represented by volatile food prices and administered price categories which
together account for about 40% of the CPI thereby constraining the ability of Bank Indonesia
to achieve its inflation targets. As per the Bank of Indonesia working to contain inflation
needs cooperation and coordination between the Government and Bank Indonesia.20
OECD countries have several price indices but they have consistently used one price index
for their monetary policy framework. Additionally, in these countries21
one agency has been
made responsible for estimation and publication of key price indices used by their central
banks and finance ministries unlike in India.
To sum up, the US targets core-inflation22
excluding food and oil because the prices of these
commodities do not respond readily to changes in monetary policy. The central bank of
Canada targets combined CPI but also monitors “core” inflation measures to ‘look
through’23
temporary changes in combined CPI to thereby remain focus on underlying
longer-term trends. The South African central bank targets a band for consumer prices
(overall CPI). However, it used to targets consumer prices only for metropolitan and other
urban areas until 2000 after which it introduced a flexible inflation-targeting framework.24
Bank of Thailand targets core-inflation25
while the EU and the UK target headline
inflation26
.
20
Bank Indonesia 21
In Japan the responsibility for estimation and publication of price indices has been assigned to two bodies.
These are the Statistics Bureau, Ministry of Internal Affairs and Communications and the Bank of Japan. 22
US does not have a formal target. However, an inflation rate of 2% is seen as desirable. 23
To use as a means to understand the drivers of inflation thereby identifying temporary spikes compared to
longer-term trends 24
South African Reserve Bank 25
Bank of Thailand 26
STCI (2011), ‘Which Measure of Inflation: Headline, Core or Trimmed?’, Available at
<http://www.stcipd.com/UserFiles/File/Which%20Measure%20of%20Inflation%20Headline,%20Core%20or
%20Trimmed.pdf>; BIS MC Compendium, Petursson (2004); Handbook of Central Banking, 29, Bank of
England
Page 23
16
Section 4
Trends in Indian Inflation
4.1 WPI and CPI
In the past four decades, WPI and CPI inflation have risen steadily in India. For instance,
CPI inflation in 2012-13 was 10.4% compared to 3.2% in 1971-7227
. Similarly, WPI inflation
rose to 7.4% from 5.6% over the same period. However, the inflation varied through several
highs and lows over these time periods.28
Another change has been the divergence between
WPI and CPI inflation from 1994 onwards29
. This has been particularly evident in times of
crisis be it the oil price shocks in the 1970s, 1997 Asian crisis or the 2008 global financial
sector meltdown. In the first two periods of stress, WPI and CPI inflation rose sharply but
this did not happen post 2008. In this Section, CPI (IW) is used as proxy for measuring CPI
inflation. Annual averages for CPI (IW) and WPI are taken into account while calculating
year-on-year changes in inflation.
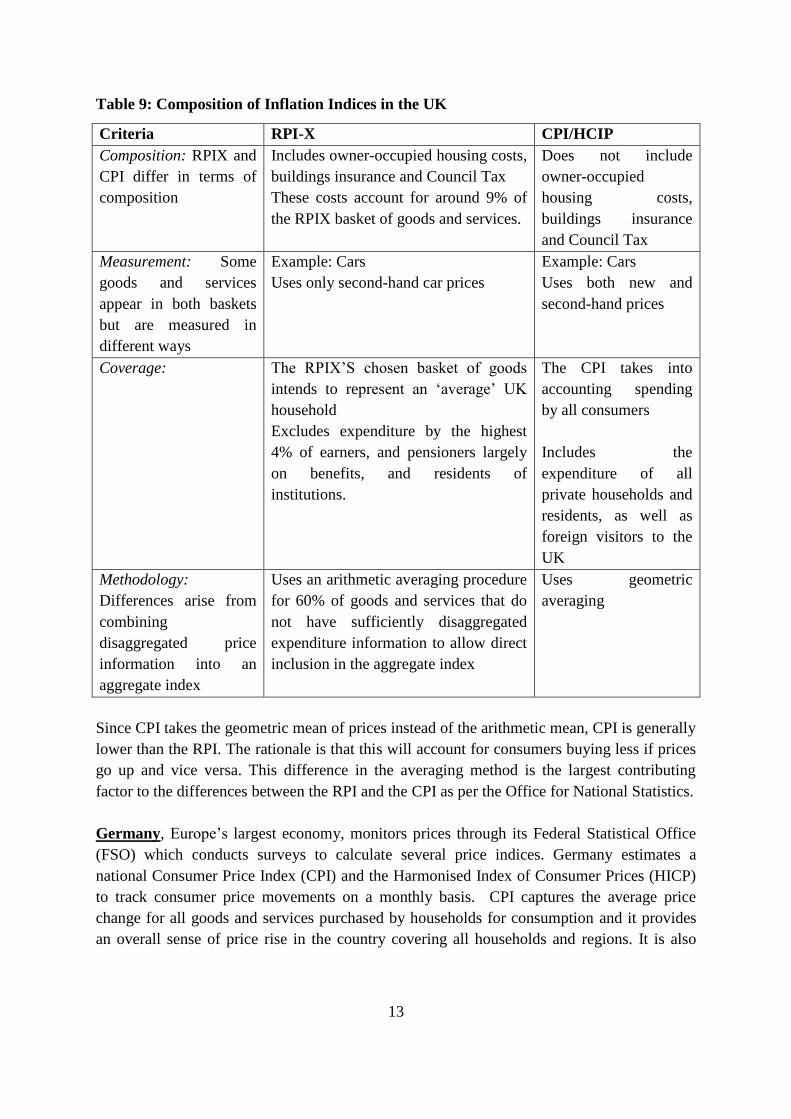
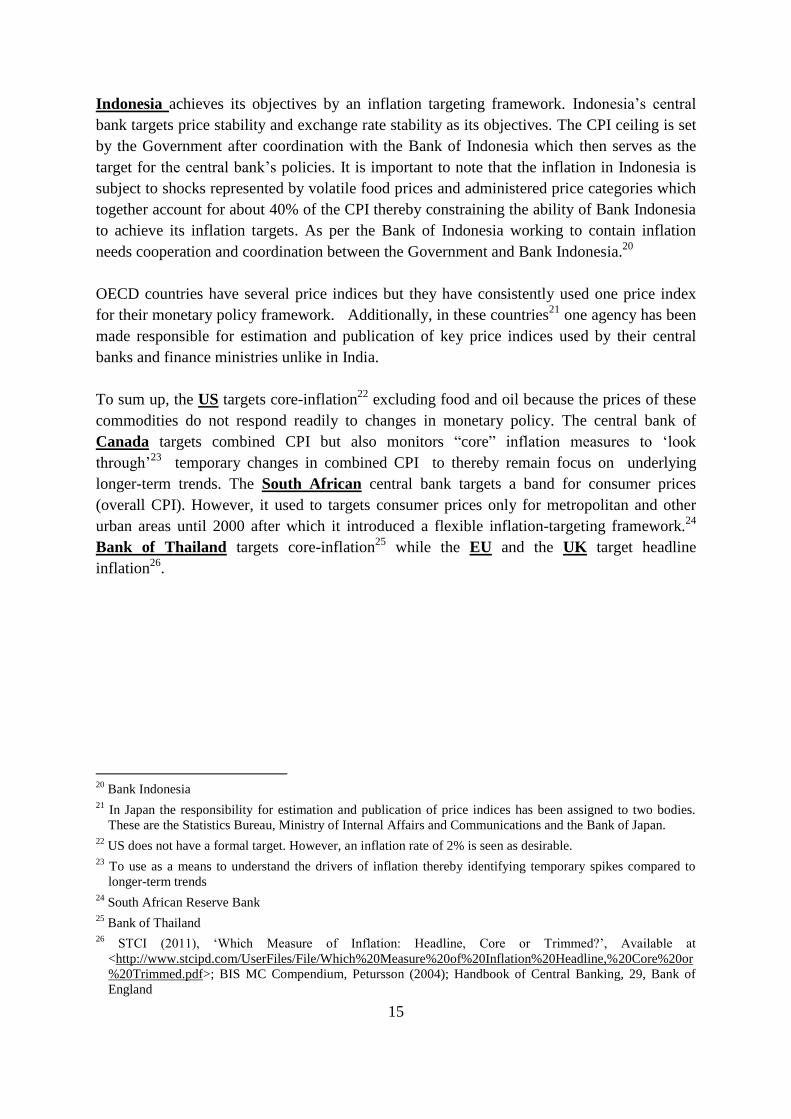
The following time series graph, starting from 1970s, illustrates that WPI and CPI-IW
inflation have moved in tandem except during the period of the last global financial crisis
(Figure 1). WPI inflation registered a sharp decline while CPI inflation rose sharply during
2009-10. Specifically, CPI increased from 9.1% in 2008-09 to 12.2% in 2009-10 and in
contrast WPI fell from 8% to 3.8% during the same period. The sharp surge in consumer
prices was due to adverse global and domestic factors with high food and fuel prices
dominating overall CPI.30
WPI inflation fell below 2%, in 8 out of 12 months in 2009 as this
was broadly due to a fall in industrial production driven by global recession. Surprisingly,
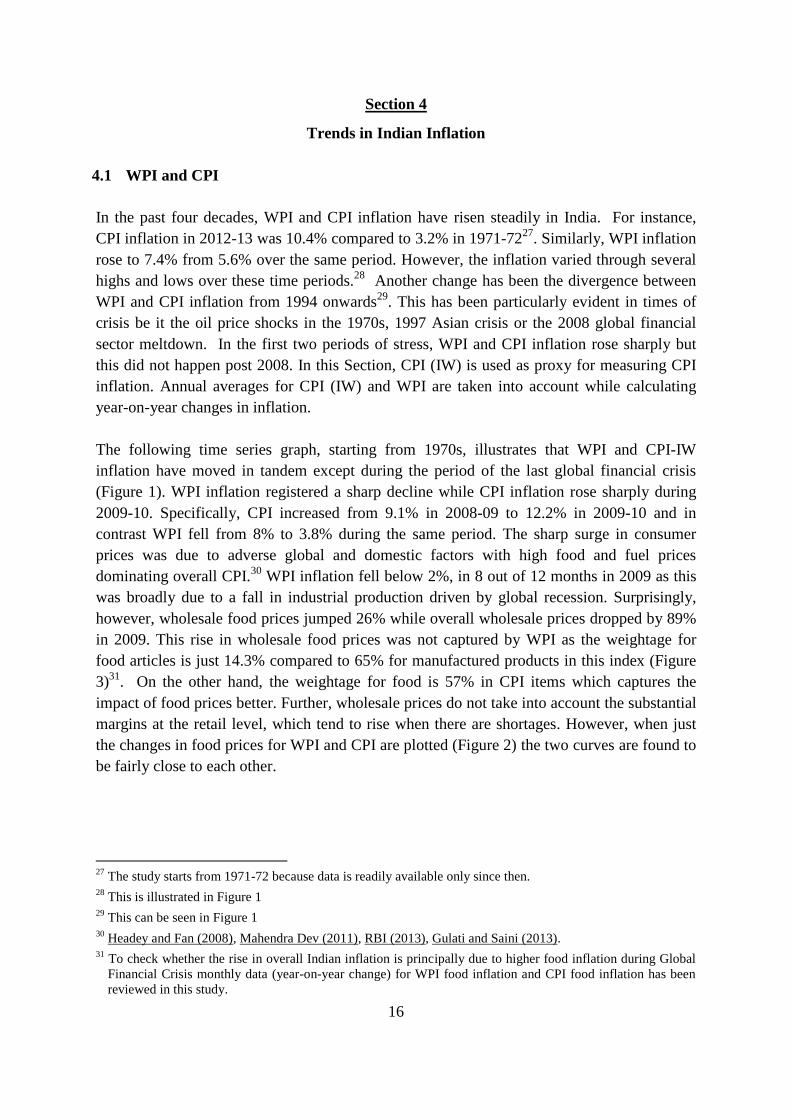
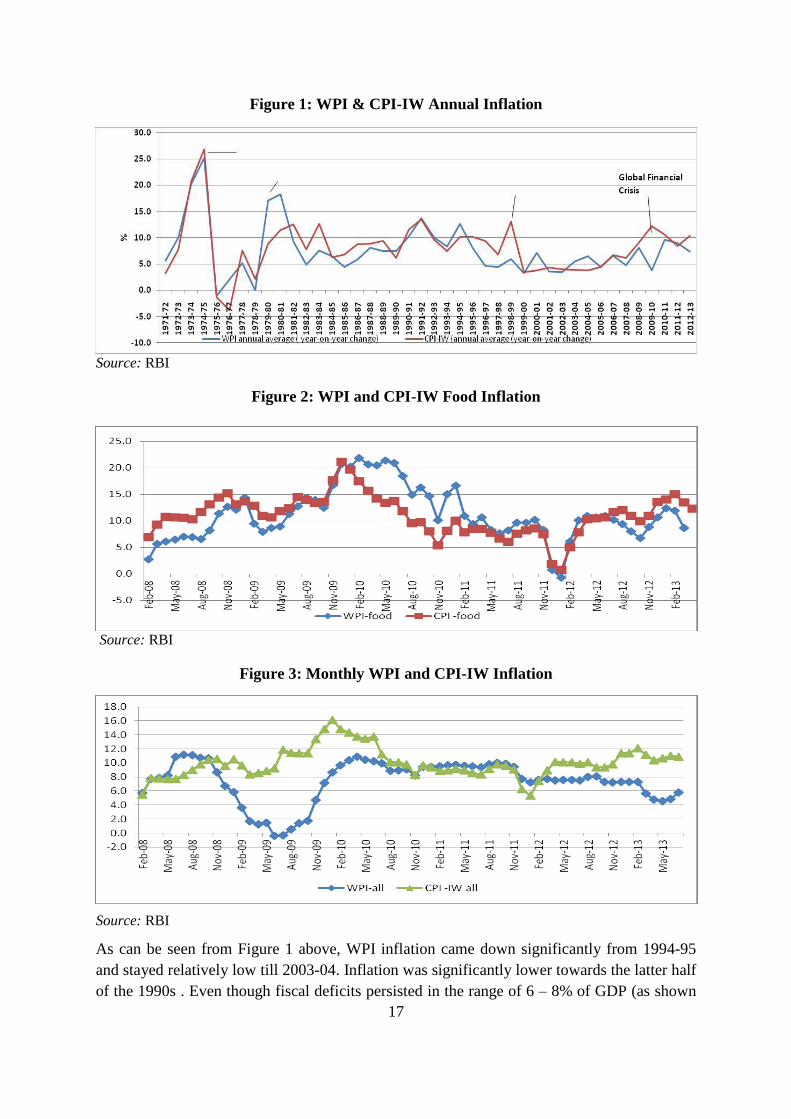
however, wholesale food prices jumped 26% while overall wholesale prices dropped by 89%
in 2009. This rise in wholesale food prices was not captured by WPI as the weightage for
food articles is just 14.3% compared to 65% for manufactured products in this index (Figure
3)31
. On the other hand, the weightage for food is 57% in CPI items which captures the
impact of food prices better. Further, wholesale prices do not take into account the substantial
margins at the retail level, which tend to rise when there are shortages. However, when just
the changes in food prices for WPI and CPI are plotted (Figure 2) the two curves are found to
be fairly close to each other.
27
The study starts from 1971-72 because data is readily available only since then. 28
This is illustrated in Figure 1 29
This can be seen in Figure 1 30
Headey and Fan (2008), Mahendra Dev (2011), RBI (2013), Gulati and Saini (2013). 31
To check whether the rise in overall Indian inflation is principally due to higher food inflation during Global
Financial Crisis monthly data (year-on-year change) for WPI food inflation and CPI food inflation has been
reviewed in this study.
Page 24
17
Figure 1: WPI & CPI-IW Annual Inflation
Source: RBI
Figure 2: WPI and CPI-IW Food Inflation
Source: RBI
Figure 3: Monthly WPI and CPI-IW Inflation
Source: RBI
As can be seen from Figure 1 above, WPI inflation came down significantly from 1994-95
and stayed relatively low till 2003-04. Inflation was significantly lower towards the latter half
of the 1990s . Even though fiscal deficits persisted in the range of 6 – 8% of GDP (as shown
Page 25
18
in Annex B as per annual Economic Surveys, the measures taken to reduce inflation
included constraining monetary growth to about 16% in 1996-97 and other supply side
measures such as continuation of Food Corporation of India’s (FCI’s) open market sale of
rice and wheat, import of wheat to augment public stocks, import of edible oils, palm oil and
pulses and reduction in excise duties among others. It is also explained in the Economic
Surveys of 1995-96 and 1996-97 that the rise in inflation in the early 1990s was mainly due
to the oil price shocks, higher import bills and the balance of payment crisis which has
prompted a foreign exchange reserves build-up phase which fed into a higher growth of
money supply.
While various studies point to the positive correlation between sustained fiscal deficits,
increase in inflation and negative effects on long-term economic growth32
, the increase in
inflation experienced since 2008-09 can be attributed to increasing fiscal deficit numbers and
higher growth rate of M3 in India as shown in Annex B and Annex D. The Economic Survey
for 2009-10 attributes the rise in inflation to higher international fuel and commodity prices
and increasing domestic demand. This year also marked the beginning of an erosion in the
growth momentum in India. This negative relationship between inflation and GDP growth
rate in India has been corroborated33
.
4.2 WPI inflation after alteration of weights assigned to Product Groups
In this sub-section, higher weightage is assigned to food items in the WPI basket to check if
this reduces the gap between WPI and CPI inflation. CPI inflation has been higher than WPI
inflation after the outbreak of global financial crisis and high food inflation as compared to
overall inflation levels is the principal causual factor. As mentioned in Section II, WPI
weights for primary articles in which food items have a dominant share have been reduced
over time. Currently, it stands at 20% while it was double that number in the 1970-71 base
year (Table10)34
.
The weights as per 1970-71 base year are applied to the WPI time series, starting from 1983-
84, when primary articles accounted for around 40% of all commodities taken together35
. In
other words, higher weights are assigned to primary articles (food) as compared to currently
prevalent weights to make these weights comparable to those in CPI which gives higher
weightage to food.
32
Rubin, R., Orszag, P. and Sinai, A. (2004), ‘Sustained Budget Deficits: Longer-Run US Economic
Performance and the Risk of Financial and Fiscal Disarray’ 33
Salian, P. and K., Gopakumar, ‘Inflation and Economic Growth in India – An Empirical Analysis’, IGIDR 34
The proportion of food items in primary articles has reduced from 75% in 1970-71 to 70% in 2004-05. 35
WPI numbers (annual average) are considered from early 1980s up to 2011-12. First, the whole series is
transformed into one base year i.e. 2004-05 (current). Thereafter the series is converted as per 1970-71
weights as shown in Table 6. However, there is one limitation in this method. Over time, items have been
changed from one group to other, over the three broad groups are not strictly comparable from one base year
to other.
Page 26
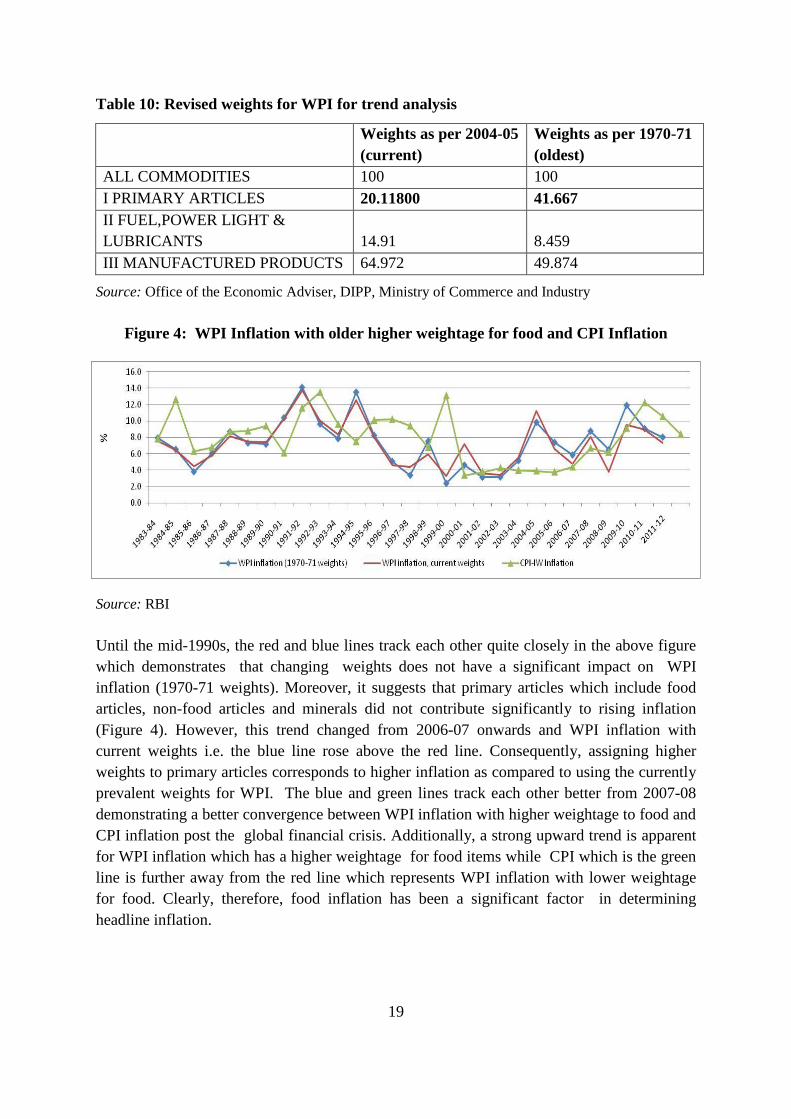
19
Table 10: Revised weights for WPI for trend analysis
Weights as per 2004-05
(current)
Weights as per 1970-71
(oldest)
ALL COMMODITIES 100 100
I PRIMARY ARTICLES 20.11800 41.667
II FUEL,POWER LIGHT &
LUBRICANTS 14.91 8.459
III MANUFACTURED PRODUCTS 64.972 49.874
Source: Office of the Economic Adviser, DIPP, Ministry of Commerce and Industry
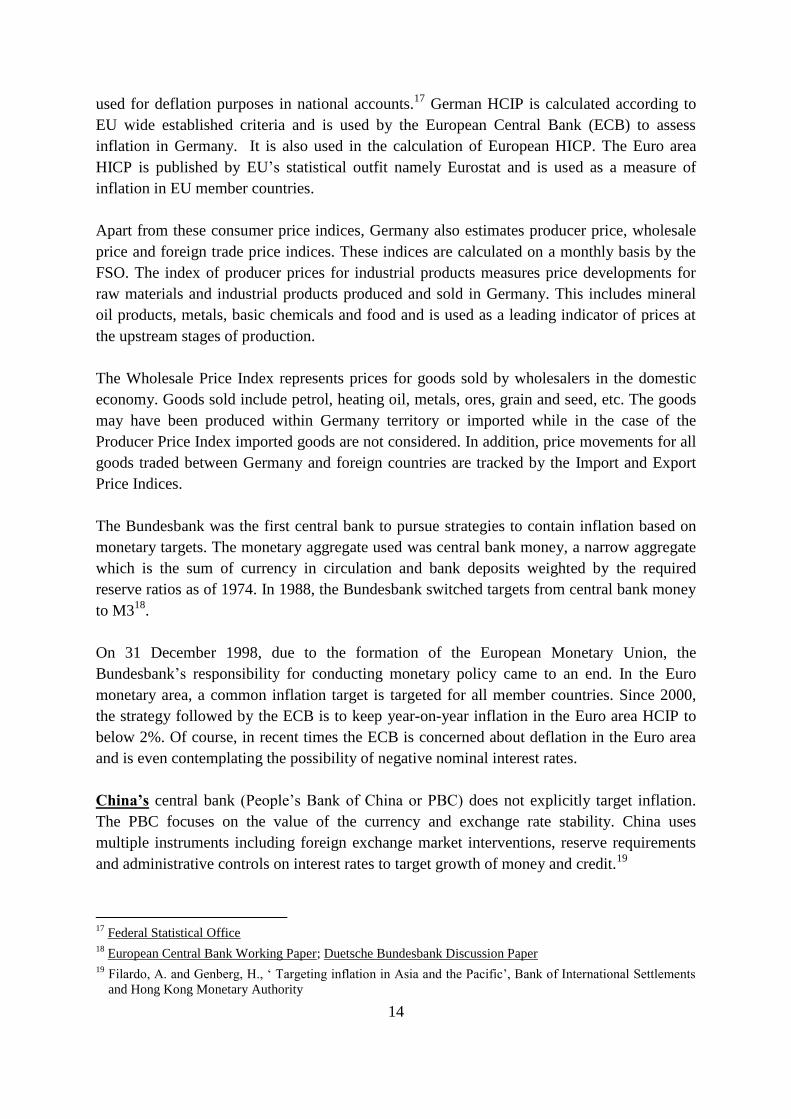
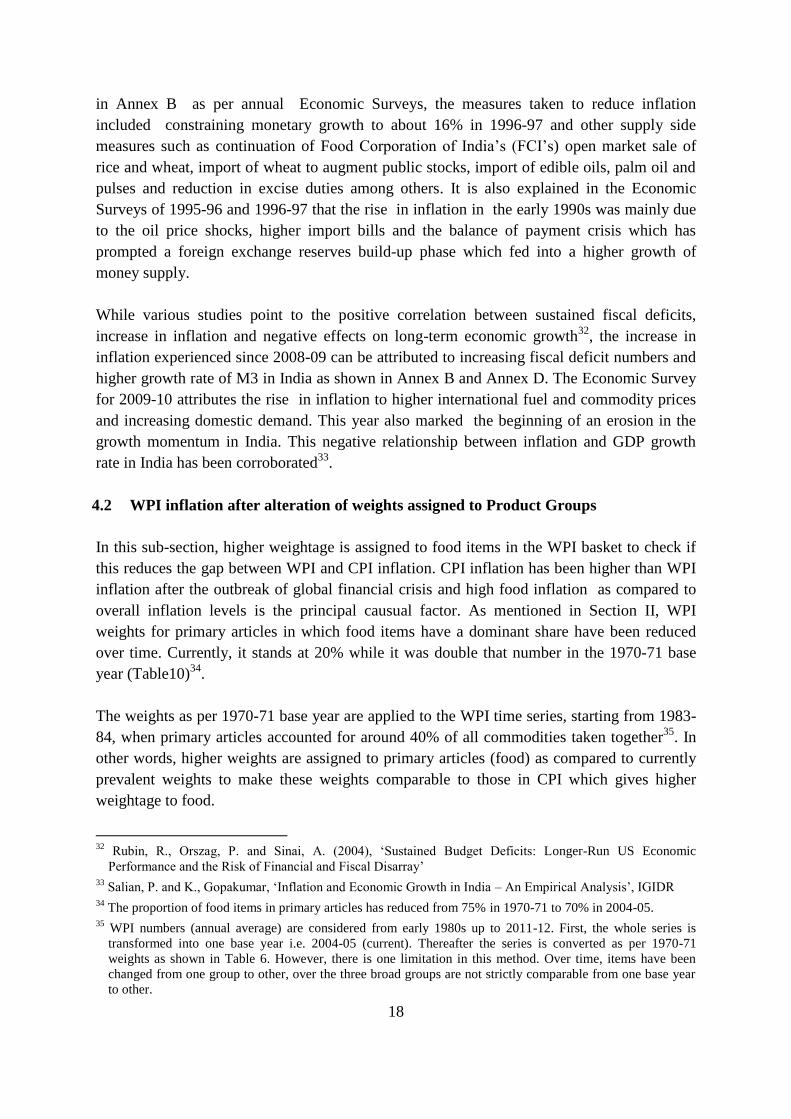
Figure 4: WPI Inflation with older higher weightage for food and CPI Inflation
Source: RBI
Until the mid-1990s, the red and blue lines track each other quite closely in the above figure
which demonstrates that changing weights does not have a significant impact on WPI
inflation (1970-71 weights). Moreover, it suggests that primary articles which include food
articles, non-food articles and minerals did not contribute significantly to rising inflation
(Figure 4). However, this trend changed from 2006-07 onwards and WPI inflation with
current weights i.e. the blue line rose above the red line. Consequently, assigning higher
weights to primary articles corresponds to higher inflation as compared to using the currently
prevalent weights for WPI. The blue and green lines track each other better from 2007-08
demonstrating a better convergence between WPI inflation with higher weightage to food and
CPI inflation post the global financial crisis. Additionally, a strong upward trend is apparent
for WPI inflation which has a higher weightage for food items while CPI which is the green
line is further away from the red line which represents WPI inflation with lower weightage
for food. Clearly, therefore, food inflation has been a significant factor in determining
headline inflation.
Page 27
20
Causal factors for inflation
Extensive studies have examined causal factors for inflation36
across countries around the
world and have listed factors such as fiscal deficits, oil imports, surging domestic demand,
low buffer stocks, changes in global and domestic consumption patterns, supply side
constraints and higher than anticipated growth in money supply. Determinants for inflation in
India has been recognised as high fiscal deficit, rising farm wages, domestic supply-side
constraints, unexpected weather patterns, rise in international oil prices, rupee depreciation,
increased demand, pass-through of global prices for input commodities such as coal, iron ore
and aluminium, volatile capital flows and monetary accommodation.37
The average annual growth in broad money supply, M3, had just grown by 14.7 % during
FY 2010 to FY 2014 compared to higher 19.1 % annual average growth during FY 2005 to
FY 2009. Thereby, supporting the reasoning that capital flows have not necessarily altered
the money supply to an extent to fan inflation. The remit of this paper does not extend to an
extensive and fuller analysis of anti-inflation measures38
.39
36
A monetarist view links inflation to money supply in the medium-term. One of the solutions is to decrease
money supply thereby increasing the rate of interest which should in turn reduce expenditures and ease the
pressure on resources and thereby prices. The Keynesian view identifies inflation as a result of excessive
expenditure relative to the available supply of goods at current prices. In this approach to explaining inflation,
fiscal policy is deemed to be more significant, both as a cause and for purposes of control, than monetary
policy. According to the Keynesian model, if money supply increases but does not influence spending, prices
should not rise. However, if money supply contracts, the velocity of circulation of the reduced money supply
would rise to negate the impact of a lower supply of money. Hence, reducing money supply would not reduce
inflation rather result in unemployment. A proposed solution by Keynesians is to pursue an income policies
which reduce inflationary expectations while decreasing expenditure to eliminate the “inflationary gap”. A
wage-price policy is advocated. The Wage-Push view approach believes that the labor unions have the power
within the market process and this is reflected in a persistent tendency for money wage rates to increase faster
than worker productivity. Further, these wage increases spill-over to non-union sectors as well. The Mark-Up
theory states that inflation is caused by firms with market power taking advantage of their monopolistic status
to increase profits and hence, changing the industry structure by introducing competition is a credible way to
tackle inflation. Other views disaggregate inflation into demand rate of inflation (caused by government,
fiscal and monetary policies), shock rate (caused by exogenous factors such as petroleum prices or increases
in payroll taxes), and core rate (caused by inflationary expectations).
37
Gulati and Saini (2013) attribute fiscal deficit, rising farm wages as major culprits.
RBI (Duvvuri Subbarao, Governor, RBI, 2009) attributes persisting Indian inflation to weather, oil prices,
rupee depreciation, increase in wages and demand and impediments to monetary policy transmission.
Nair and Eapen (2012) conclude that supply-side constraints has been the major contributor.
Gokarn and Singh focus on import of inflation due to oil prices and pass-through of global inflation on
commodities such as coal, aluminium and iron ore.
Patra, Khundrakpam and George (2013) attribute the persistence of inflation to oil and commodity price
shocks, fiscal deficits, capital flows, depreciation and supply-capacity retardation.
Raj, Dhal and Jain (2008) have suggested that Indian inflation is influenced by import prices, capital flows
and the Rupee’s exchange rate.
38
An IMF paper (Habermeier, K. etal., 2009) has reviewed developments related to inflation in 50 emerging and
developing countries till 2008. One of the findings of this study is that “most central banks have tightened
monetary policy to constrain aggregate demand and anchor inflation expectations, though the timing and
speed of the monetary policy actions varied significantly. The effect of monetary tightening has been limited
at the time of the writing, given the delayed actions in many countries, lags in policy transmission, and the
magnitude of the tightening.”
Page 28
21
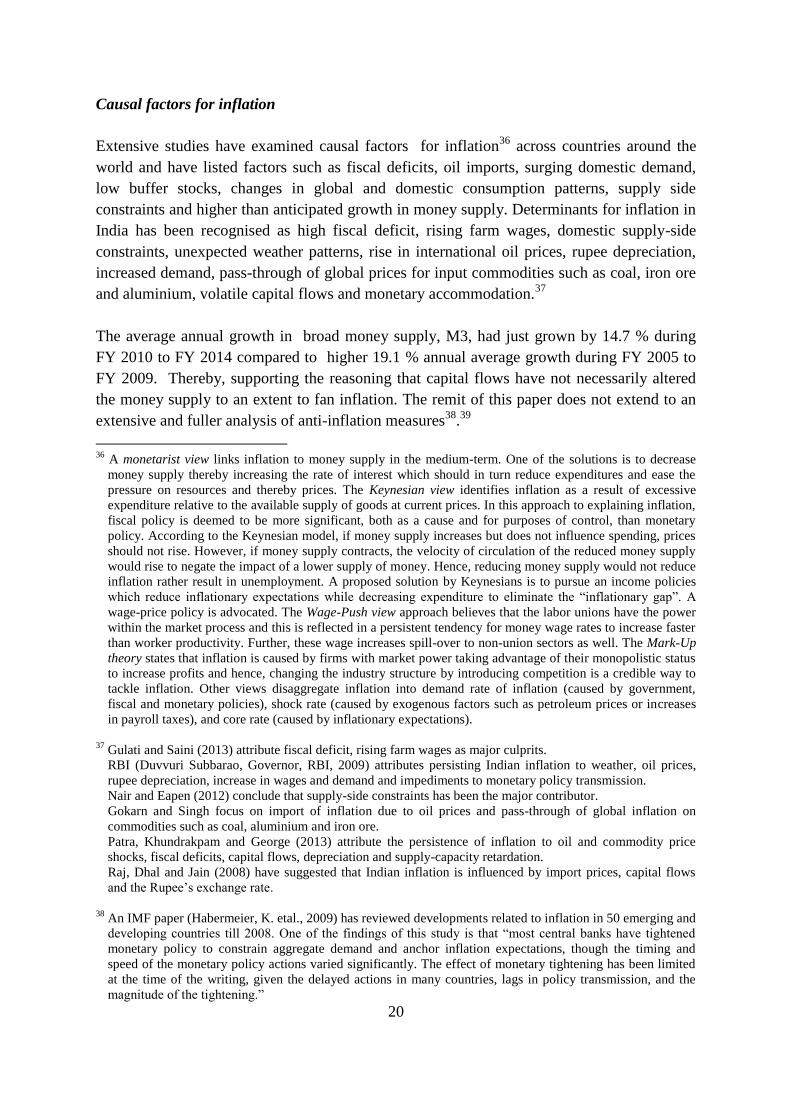
Figure 5: Europe Brent Spot Price
Source: US Energy Information Administration
Further, it can be seen in Figure 5 above, although oil prices have been rising since early
2009 the increase does not seem to have been significant enough post 2011 to list India’s
dependency on oil imports as the major reason for persistent inflation. One implication is that
there are inefficiencies on the supply-side which have possibly pushed up domestic inflation.
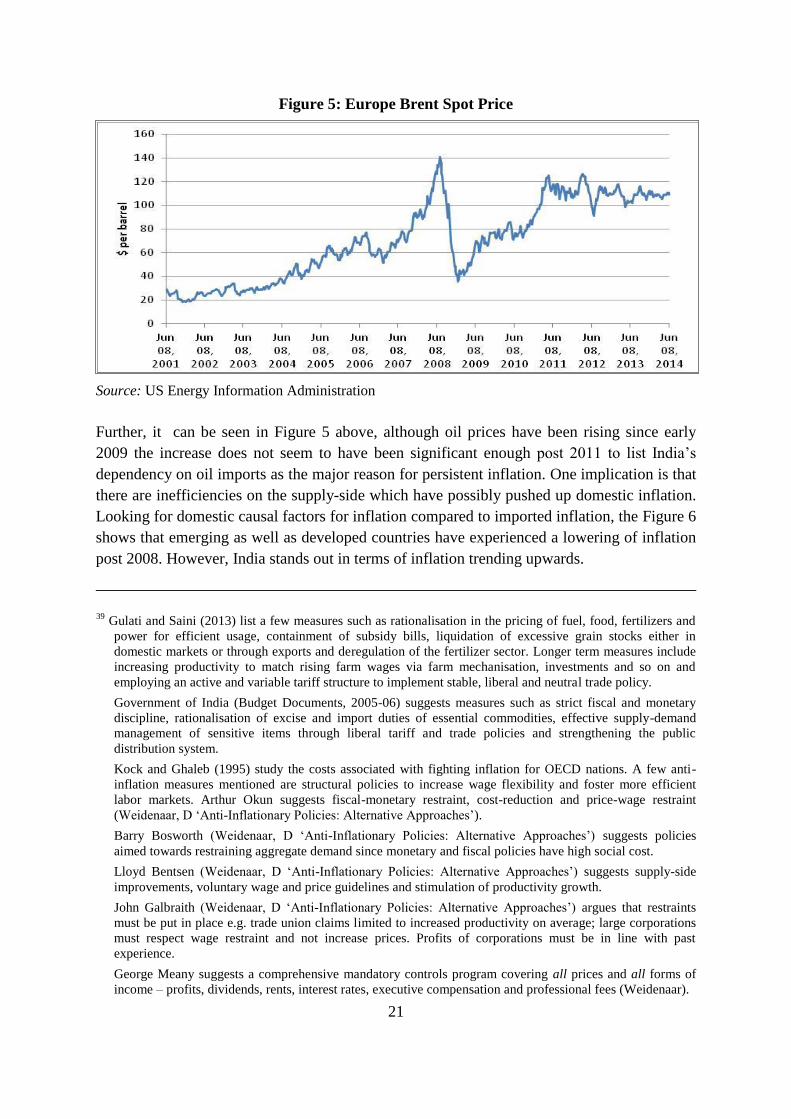
Looking for domestic causal factors for inflation compared to imported inflation, the Figure 6
shows that emerging as well as developed countries have experienced a lowering of inflation
post 2008. However, India stands out in terms of inflation trending upwards.
39
Gulati and Saini (2013) list a few measures such as rationalisation in the pricing of fuel, food, fertilizers and
power for efficient usage, containment of subsidy bills, liquidation of excessive grain stocks either in
domestic markets or through exports and deregulation of the fertilizer sector. Longer term measures include
increasing productivity to match rising farm wages via farm mechanisation, investments and so on and
employing an active and variable tariff structure to implement stable, liberal and neutral trade policy.
Government of India (Budget Documents, 2005-06) suggests measures such as strict fiscal and monetary
discipline, rationalisation of excise and import duties of essential commodities, effective supply-demand
management of sensitive items through liberal tariff and trade policies and strengthening the public
distribution system.
Kock and Ghaleb (1995) study the costs associated with fighting inflation for OECD nations. A few anti-
inflation measures mentioned are structural policies to increase wage flexibility and foster more efficient
labor markets. Arthur Okun suggests fiscal-monetary restraint, cost-reduction and price-wage restraint
(Weidenaar, D ‘Anti-Inflationary Policies: Alternative Approaches’).
Barry Bosworth (Weidenaar, D ‘Anti-Inflationary Policies: Alternative Approaches’) suggests policies
aimed towards restraining aggregate demand since monetary and fiscal policies have high social cost.
Lloyd Bentsen (Weidenaar, D ‘Anti-Inflationary Policies: Alternative Approaches’) suggests supply-side
improvements, voluntary wage and price guidelines and stimulation of productivity growth.
John Galbraith (Weidenaar, D ‘Anti-Inflationary Policies: Alternative Approaches’) argues that restraints
must be put in place e.g. trade union claims limited to increased productivity on average; large corporations
must respect wage restraint and not increase prices. Profits of corporations must be in line with past
experience.
George Meany suggests a comprehensive mandatory controls program covering all prices and all forms of
income – profits, dividends, rents, interest rates, executive compensation and professional fees (Weidenaar).
Page 29
22
Figure 6: Consumer Price Inflation
Source: International Finance Statistics, IMF
4.3 Report of the Expert Committee to Revise and Strengthen the Monetary Policy
Framework
Two principal and traditional channels through which a central bank can impact inflation are
by changing expectations and short term money market interest rates. In recent years, the
central banks of the US and the UK have engaged in Quantitative Easing i.e. purchasing of
long-term Treasury and mortgage based and other privately issued fixed income securities.
To implement monetary policy changes successfully in terms of their impact on economy
wide variables, monetary authorities need to assess which mechanisms of monetary policy
affect the economy in question and over what time frames. For instance, monetary
transmission can be effected by a central bank changing its policy rates which should impact
aggregate demand and price levels through various variables including lending rates, appetite
for credit, stock prices, exchange rates and so on. This is illustrated in the following flow
diagram.
Page 30
23
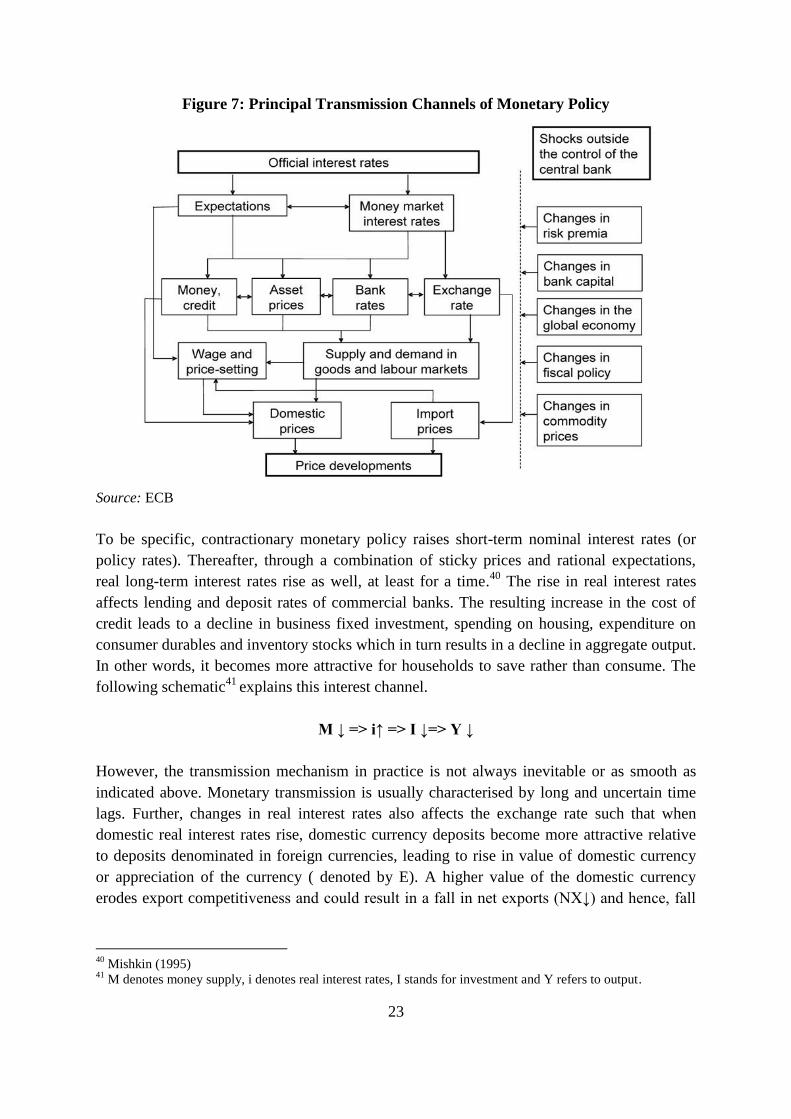
Figure 7: Principal Transmission Channels of Monetary Policy
Source: ECB
To be specific, contractionary monetary policy raises short-term nominal interest rates (or
policy rates). Thereafter, through a combination of sticky prices and rational expectations,
real long-term interest rates rise as well, at least for a time.40
The rise in real interest rates
affects lending and deposit rates of commercial banks. The resulting increase in the cost of
credit leads to a decline in business fixed investment, spending on housing, expenditure on
consumer durables and inventory stocks which in turn results in a decline in aggregate output.
In other words, it becomes more attractive for households to save rather than consume. The
following schematic41
explains this interest channel.
M ↓ => i↑ => I ↓=> Y ↓
However, the transmission mechanism in practice is not always inevitable or as smooth as
indicated above. Monetary transmission is usually characterised by long and uncertain time
lags. Further, changes in real interest rates also affects the exchange rate such that when
domestic real interest rates rise, domestic currency deposits become more attractive relative
to deposits denominated in foreign currencies, leading to rise in value of domestic currency
or appreciation of the currency ( denoted by E). A higher value of the domestic currency
erodes export competitiveness and could result in a fall in net exports (NX↓) and hence, fall
40
Mishkin (1995) 41
M denotes money supply, i denotes real interest rates, I stands for investment and Y refers to output.
Page 31
24
in aggregate output. And, it may ease inflation due to cheaper imported goods and lower
aggregate demand. The following is a flow diagram explaining the exchange rate mechanism:
M ↓ => i↑ => E↑ => NX ↓ => Y↓=> P (Prices) ↓
Concurrently, changes in policy rates impact equity prices which have consequent wealth
effects on consumption. For instance, a rise in interest rates causes stock prices42
to fall
(denoted by Pe) which decreases financial wealth and therefore consumption spending
declines and hence leads to a fall in aggregate demand.
M ↓ => i↑ => Pe ↓ => wealth↓ => consumption ↓ => Y↓ => P ↓
In brief, changes in policy rates lead to changes in consumption and investment which would
change the level of domestic demand for goods and services relative to domestic supply.
When demand is higher than supply, upward price pressures are likely to occur. As shown in
Figure 7, changes in aggregate demand may translate into tighter or looser conditions in
labour and intermediate product markets which in turn can affect price and wage-setting in
the respective markets43
. However, there is no consensus among economists about which
transmission channels would dominate and under what circumstances44
. In this context,
recent empirical studies45
suggest that the interest rate channel is stronger in many emerging
economies including India.46
Monetarists suggest that inflation is ultimately always a monetary phenomenon and suggest
that a rise in money supply translates into inflation even if it is with a medium-term lag.
However, this causality is probably more likely to be true in developed economies, which
have reached to fuller levels of employment. In emerging market economies which have
excess capacity, inflation is not necessarily reined in by reducing money supply. In fact,
empirical evidence seems to indicate that monetary tightening measures do not result in
lowering inflation in India47
. Moreover, inflation has been sticky in India even when growth
in money supply has declined. As can be seen in Table 11, despite a consistent decline in
42
Rise in interest rate may cause demand for bonds attractive relative to stocks, causing fall in stocks’ prices. 43
ECB - Transmission Mechanism of Monetary Policy 44
According to Taylor, the interest rate channel dominates while Ben Bernanke and Marl Gertler see less
empirical confirmation. Maurice Obstfeld and Kenneth Rogoff emphasise the importance of the exchange rate
channel while monetary economists give more weight to asset price channels. Mishkin (1995). 45
Mohanty, M.S. and P. Turner (2008); Aleem (2010), Gumata, N.,A Kabundi and E. Ndou (2013) 46
In a recent IMF paper dated June 2013 titled “Inflation Dynamics and Monetary Policy Transmission in
Vietnam and Emerging Asia” inflation in several Asian countries including India is compared. According to
this paper: “An important finding from our analysis is that interest rates in Vietnam do not have seem to have
a significant impact on headline inflation (as opposed to growth), neither in the short- term nor in the
medium-term; in this sense, it can be concluded that the monetary policy transmission mechanism is weak in
Vietnam.” (Bhattacharya, 2013) 47
Sabade Shubhada (2013) Available online at www.sciencedirect.com
Page 32
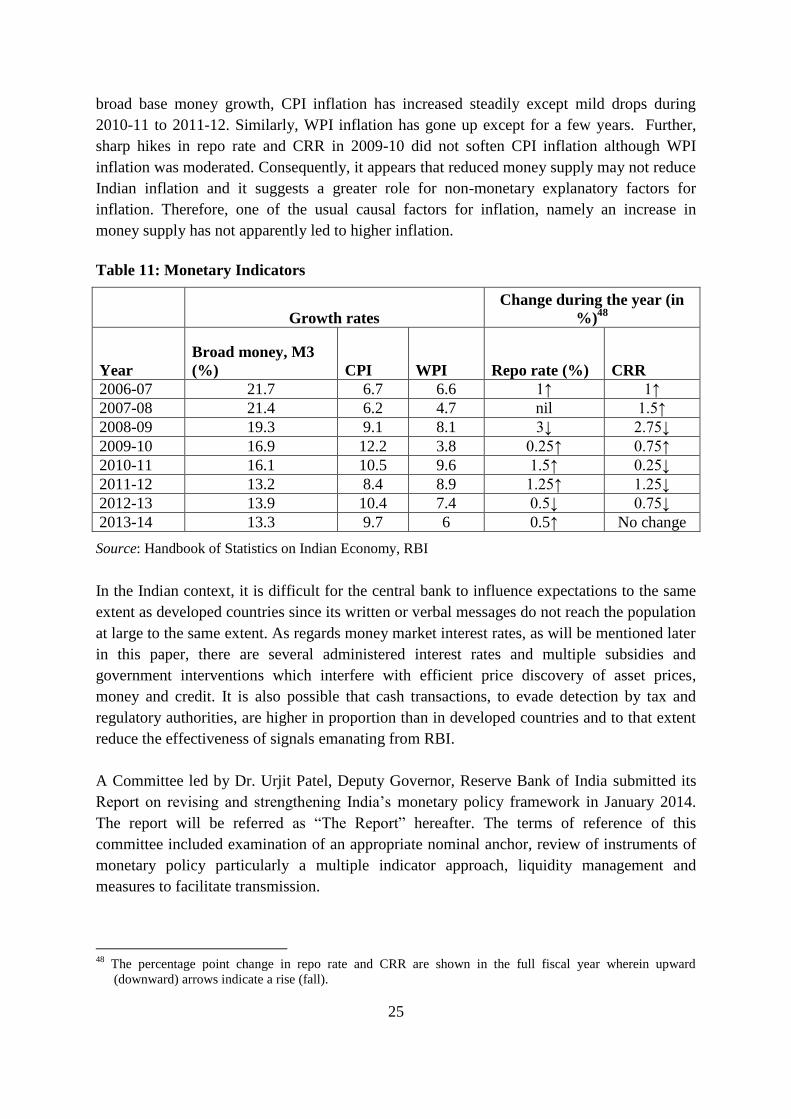
25
broad base money growth, CPI inflation has increased steadily except mild drops during
2010-11 to 2011-12. Similarly, WPI inflation has gone up except for a few years. Further,
sharp hikes in repo rate and CRR in 2009-10 did not soften CPI inflation although WPI
inflation was moderated. Consequently, it appears that reduced money supply may not reduce
Indian inflation and it suggests a greater role for non-monetary explanatory factors for
inflation. Therefore, one of the usual causal factors for inflation, namely an increase in
money supply has not apparently led to higher inflation.
Table 11: Monetary Indicators
Growth rates
Change during the year (in
%)48
Year
Broad money, M3
(%) CPI WPI Repo rate (%) CRR
2006-07 21.7 6.7 6.6 1↑ 1↑
2007-08 21.4 6.2 4.7 nil 1.5↑
2008-09 19.3 9.1 8.1 3↓ 2.75↓
2009-10 16.9 12.2 3.8 0.25↑ 0.75↑
2010-11 16.1 10.5 9.6 1.5↑ 0.25↓
2011-12 13.2 8.4 8.9 1.25↑ 1.25↓
2012-13 13.9 10.4 7.4 0.5↓ 0.75↓
2013-14 13.3 9.7 6 0.5↑ No change
Source: Handbook of Statistics on Indian Economy, RBI
In the Indian context, it is difficult for the central bank to influence expectations to the same
extent as developed countries since its written or verbal messages do not reach the population
at large to the same extent. As regards money market interest rates, as will be mentioned later
in this paper, there are several administered interest rates and multiple subsidies and
government interventions which interfere with efficient price discovery of asset prices,
money and credit. It is also possible that cash transactions, to evade detection by tax and
regulatory authorities, are higher in proportion than in developed countries and to that extent
reduce the effectiveness of signals emanating from RBI.
A Committee led by Dr. Urjit Patel, Deputy Governor, Reserve Bank of India submitted its
Report on revising and strengthening India’s monetary policy framework in January 2014.
The report will be referred as “The Report” hereafter. The terms of reference of this
committee included examination of an appropriate nominal anchor, review of instruments of
monetary policy particularly a multiple indicator approach, liquidity management and
measures to facilitate transmission.
48
The percentage point change in repo rate and CRR are shown in the full fiscal year wherein upward
(downward) arrows indicate a rise (fall).
Page 33
26
In the past few years, RBI’s concerns have included persistent high inflation, and sluggish
growth. High inflation has resulted in relatively low real interest rates for savers for most of
the post-global crisis period which tends to depress domestic savings49
. To an extent external
competitiveness too has eroded since inflation in trading partner countries has been relatively
lower and the Rupee has not depreciated adequately. Demand for gold which, among its other
benefits, is also is perceived as a hedge against inflation has contributed to deterioration in
India’s current account thus increasing its vulnerability to external shocks. Persistent inflation
impacts allocation of resources negatively, impedes growth and worsens income
distribution.50
The developed West is moving away from focusing principally on inflation to a multiple
target-multiple instrument approach without diluting the commitment to price stability over
the medium term. This RBI Report indicates that containing Indian inflation is of high
priority at the current juncture and it is important to anchor inflationary expectations to set
the context for addressing other objectives.51
A few salient features and observations of the Report are:
CPI52
chosen as a single nominal anchor53
for future inflation targeting purposes after
evaluating several other options for such an anchor including the real exchange rate,
monetary aggregates among others
Movement from a multiple indicator approach which was used from 1998-99 to 2008-
09 to a nominal anchor for monetary policy
Choice of CPI-Combined as the inflation measure to guide monetary policy
Interest rate transmission mechanism to be utilised to influence lending rates for sizable
sectors such as housing and automobiles54
The exchange rate channel has been relatively weak
Asset prices have reacted in a muted manner to interest rate changes
Credit channel is relatively direct due to the significant dependence of the economy on
bank finance55
49
This can be seen from the trend of real interest rates as shown in Annex A 50
Ibid., pp. 5 51
Ibid. 52
“The Committee recommends that the RBI should adopt the new CPI (combined) as the measure of the
nominal anchor for policy recommendations. The nominal anchor should be defined in terms of headline CPI
inflation …”, (The Report, pp. 18) 53
“…This nominal anchor should be set by the RBI as its predominant objective…”, (The Report, pp.11) 54
RBI (2014), ‘Report of the Expert Committee to Revise and Strengthen the Monetary Policy Framework’, pp.
41 55
Ibid., pp.44
Page 34
27
The Small Savings Schemes which carry administered usually higher interest rates have
a competitive edge over the bank deposits reducing the effectiveness of the monetary
transmission mechanisms at the margin and interest rate resets for such schemes should
be more frequent56
Taking a step back to ponder on this Report’s contents, high inflation can be tackled by
reducing demand or augmenting supply. Policies targeting demand usually take effect more
immediately. In contrast, supply-side measures including promotion of productivity gains
take time to gather traction but tend to be more sustainable in the longer run.57
As pointed out
in the 2013 Economic Survey, the growth-friendly strategy to deal with inflation is to focus
on boosting supply. RBI has limited options and curbing of demand in the short-term can
have an adverse impact on growth. However, although there are difficult choices to be made
in reducing inflation, the decision to switch from WPI to CPI is intrinsically sound since the
former measures the impact on suppliers while the latter is closely correlated with end users
and consumers. While WPI does not capture price movements in non-commodity producing
sectors such as services, which constitute a significant proportion of the economic activity
about 64.8%58
including construction in 2012-13, CPI more closely relates to the cost of
living for households59
. And, the underlying rationale for policy changes and corresponding
administrative steps is to protect consumers from inflation. Of course, the impediments to
effective control over inflation are common to both WPI and CPI such as effectiveness of
price discovery, transmission mechanisms and so on.
In India, it has been observed that an increase in interest rates has a depressing impact on
housing costs only in the short-term. In the longer term, higher interest rates have a marginal
impact on housing costs due to rising middle-class income and burgeoning of overall
demand60
. The Indian housing sector has a weight of 8.7% in Core CPI. This suggests that the
interest rate route to manage inflation may not be sustainable over the longer term. The
exchange rate channel too has been relatively weak61
and this paper’s remit does not extend
to examining the same. The various mechanisms detailed in RBI’s Report suggest a more
independent monetary policy which would be capable of handling volatile capital flows,
56
RBI (2014), ‘Report of the Expert Committee to Revise and Strengthen the Monetary Policy Framework’,
pp.47 57
This disproportionate effect is highlighted in the paper by Mohanty and Klau, ‘What determines inflation in
emerging market economies?’, BIS Paper No. 8 which points out the larger impact of supply side factors on
inflation – in turn due to growing trade openness of economies and flexible exchange rate regimes. It also
finds high correlation between exchange rate and inflation volatility. The factors influencing price
movements in Emerging Market Economies are affirmed as supply side factors, including large changes in
the exchange rate/import prices and agricultural shocks. 58
Economic Survey 2012-13, pp.3 59
Bank of England (2013), ‘Monetary Policy Trade-offs and Forward Guidance’ 60
Mahalik, M. K. and Mallick, H., ‘What Causes Asset Price Bubble in an Emerging Economy? Some
Empirical Evidence in the Housing Sector of India’, IIT Madras, pp. 28 61
RBI (2014), ‘Report of the Expert Committee to Revise and Strengthen the Monetary Policy Framework’, pp.
45
Page 35
28
external shocks and exchange rate volatility. However, the Report does not specifically
identify mechanisms to contain food and fuel inflation.
In the context of the impact of monetary policy on rural wage inflation, it has been observed
that tightening has a mild effect on price inflation and no direct impact on reducing wage
inflation. In contrast, fiscal measures have had a more consequences for rural wages.62
Further, while Government spending does have a limited impact on rural food prices, it has
subsequently led to some rise in productivity63
. Monetary tightening seems to have little
impact on rural wage inflation, a mild effect on rural price inflation and comparatively a
larger compression in growth64
.
Monetary policy transmission can be expected to be impeded by pre-dominant fiscal policy.
In this regard, the Report points out that biggest constraint to monetary targeting as lack of
control over RBI’s credit to the central government. 65
In addition, exchange rate volatility
makes inflation management that much more complex and a stable exchange rate makes for
better monetary transmission. Of course, the impact of exchange rate changes does not have
to impact inflation if growth in reserve money is reduced through sterilisation interventions
by RBI66
. It is important to note that sterilised intervention to manage the Rupee exchange
rate has significant costs. Interest rates paid on domestic government securities are higher
than the yields RBI earns on their foreign exchange reserves67
. At the same time, it needs to
be recognised that higher nominal inflation and interest rates should result in a depreciating
currency with its attendant benefits.
62
Goyal, A. and Baikar, A.K. (2014), ‘Psychology, cyclicality or social programs: Rural wage and inflation
dynamics in India’, IGIDR 63
As long as price rise has been associated with productivity increase, it accommodates moderate rise in real
wages without affecting inflation. Conversely, real wages cannot rise in the long-term without an increase in
productivity since inflation would persist until wages were brought in line with productivity. 64
In the light of NSS surveys which state that 52.9% of total monthly per capita expenditure (MPCE) in rural
areas is on food items and this number stands at 42.9% for urban areas. The second largest item of
expenditure is fuel and power which was 8% and 6.7% of MPCE for rural and urban areas respectively in
2011-12. The impact of monetary policies on containing inflation via the standard transmission presents a
somewhat unconvincing picture. 65
However, fiscal dominance over monetary policy has significantly reduced over the years. A series of
auctions of 182-day Treasury bills from November 1986, 364-day Treasury bills from April 1992, and 91-
day Treasury bills from January 1993 to finance Government debt enabled a sizeable reduction in
monetization of deficits, which helped to moderate fiscal dominance of monetary policy. The automatic
monetisation of fiscal deficit through issuance of ad-hoc Treasury bills had been phased out. Moreover, the
Fiscal Responsibility and Budget Management (FRBM) Act, 2003 was enacted to curb the monetisation of
debt. Namely, it prevented the Reserve Bank from subscribing to primary issuance of Government securities
from April 1, 2006. Since then, RBI has been periodically engaging indirect monetisation of fiscal deficits by
conducting open market operations which undermines the credibility of discretionary liquidity management
operations. Source: Report on Currency and Finance (2013), RBI 66
Mohanty and Bhanumurthy (2014), “ Exchange Rate Regimes and Inflation: Evidence from India” , NIPFP
Working Paper No. 2014-130 67
Devereux and Yetman, “Responding to exchange rates in a globalised world”, BIS Papers No 77; Mohan and
Kapur (2009)
Page 36
29
The Report suggests increasing the frequency of resets for the Small Savings Schemes which
carry administered interest rates68
. Table 12 lists the administered rates used for various
savings schemes in India.
Table 12: Administered Interest Rates
Year GPF
Rate of
Interest
EPF
Rate of
Interest
PPF
Rate of
Interest
5-year Post Office
Recurring Deposit
Account
5-year National
Savings
Certificate
10-year
National
Savings
Certificate
Public
Provident
Fund
Interest
201
3-14 8.70%
8.75
%
8.80
% 8.30% 8.50% 8.80% 8.60%
Source: http://ag36g.cag.gov.in/GPFInterest.aspx;
http://www.epfindia.com/sites/pdf/InterestRate_OnPFAccumulationsSince1952.pdf;
http://www.indiapost.gov.in/posb.aspx; http://www.tnsmallsavings.com/schemedttot.htm;
http://www.unionbankofindia.co.in/personal_govt_ppfund.aspx;
The Employee Provident Fund (EPF) had a corpus of Rs. 3 lakh crores in 2011-12. The assets
under the National Small Saving Fund which includes various Postal Office Saving Schemes
is estimated at Rs. 8.6 lakh crores in 2011-12.69
GPF subscriptions can be assumed to be of
similar enormity. State Provide Funds amount to about 1.5% of GDP and are administered by
the Central Government. The interest rate on this liability was 8% for 2010-11.70
Based on
AMFI data, the AUMs of all mutual funds as of March 2012 were Rs. 5.87 lakh crores. These
administered interest rate schemes including provident funds represent a significant share of
financial savings and adversely impact RBI’s ability to alter financial savings behavior and
consumption by changing short-term rates.
In addition to the above mentioned points, the Report also presents the liquidity framework
and highlights issues faced by RBI. The challenges to effective liquidity management have
included large fluctuations in the central government’s balances with the RBI and forex
market intervention. The operating framework is anchored with an interest rate rule since
empirical estimates point to money demand responding to interest rate changes. It is
highlighted that standing sector-specific refinance facilities interfere with monetary policy
transmission because of assurance of additional access to liquidity at fixed rates (not market
determined). 71
To further strengthen the ability of RBI to manage liquidity, longer-term
repos have been suggested. However, use of the longer-term repos to mop up liquidity
particularly as a result of foreign exchange reserves intervention may lead to segmentation of
68
The frequent changes in the cap ($30 billion) on foreign investments in government fixed income securities
create market uncertainty and to that extent complicates RBI’s monetary policy choices. 69
Ministry of Finance, Comprehensive review of NSSF, June 7, 2011 70
Government Debt, Status Paper, March 2012, Ministry of Finance 71
The Report, pp. 33-34
Page 37
30
the already comparatively shallow domestic sovereign bond market72
(promoting the
development of government bond markets is in the interest of monetary policy transmission
effectiveness and hence, RBI73
). This could also raise the issue of conflicting objectives:
preference for longer-term paper to reduce the need to roll it over and inclination towards
short-term instruments for day-to-day liquidity operations. This may lead to undesirable
consequences for monetary transmission mechanisms.74
According to Riksbank, the impact
on inflation due to changes in repo rates is over the medium-term and hence, reliance on
longer-term repos may delay the impact further.75
The Indian Rupee- US$ nominal and real exchange rates, India’s total FX debt and short-term
debt defined as FX debt with remaining maturity of one year, FX reserves (all as % of GDP)
and import cover in number of months are shown in Figures 8, 9 and 10 respectively.
Figure 8: Rupee – US$ Nominal and Real Exchange Rates76
Source: RBI and IMF
72
Filardo, A., Mohanty, M. and Moreno, R., ‘Central bank and government debt management: issues for
monetary policy’, BIS Papers No. 67 73
Harun Khan, Deputy Governor, RBI, ‘Promoting Retail Investor Participation in Government Bonds’, RBI 74
Filardo, A., Mohanty, M. and Moreno, R., ‘Central bank and government debt management: issues for
monetary policy’, BIS Papers No. 67 75
http://www.riksbank.se/en/Monetary-policy/Forecasts-and-interest-rate-decisions/How-changes-in-the-repo-
rate-affect-inflation/ 76
Real Exchange Rate between Indian Rupee and the US$ has been calculated simply as Nominal Exchange
Rate *(1 + Domestic Inflation)/ (1 + US Inflation)
Page 38
31
Figure 9: Composition of Overall External Debt of India77
Source: Ministry of Finance, India’s External Debt, A Status Report, 2012-13
Figure 10: India’s FX Reserves and Import Cover
Source: RBI
FX reserves, as a percentage of GDP, have declined over the last 5-6 years. This declining
trend is also apparent for the number of months of import cover and short-term FX debt as a
percentage of FX reserves has risen steadily over the last ten years78
. This presents an
unfavorable picture about the adequacy of India’s FX reserves.79
The Report states that ,
77
Residual Short-term Debt is calculated as the sum of Short-term debt payable within one year + the portion of
repayment obligation of Long-term debt maturing within one year
78
Short-term debt defined as all debt which is due within 1 year (long-term debt maturing within the year +
short-term debt) 79
Due to higher Indian inflation, the rupee should, all other factors held constant, be expected to depreciate
correspondingly in nominal terms over time. The inflow of foreign capital tends to make the rupee appreciate
at a minimum in real terms and sometimes even nominally depending on the volumes of inflows. As can be
seen in Figure 7, the rupee has appreciated in real terms against the US$ during the last 5 years. This should
Page 39
32
“large inflows in excess of the absorptive capacity of the economy created concerns about
erosion in external competitiveness through exchange rate appreciation…”80
which the paper
appears to perceive as an outcome of inflation targeting since exchange rate appreciation
dampens inflation to some extent. In RBI’S opinion its ability to conduct effective Open
Market Operations (OMOs) through MSS was constrained due to limited availability of
government securities81
.82
RBI’s proposed amendment to the RBI Act to enable the RBI to
absorb surplus liquidity without the need for collateral would necessarily require detailed
consideration by the Government and approval by Parliament. In the interim, this paper
recommends closer coordination with Government to borrow government securities held by
FIs, PFIs and PSUs (due to mandatory holding requirements) to augment the effectiveness of
OMOs.
In stark contrast to a statement in the Report, “… inflation should be the nominal anchor for
monetary policy framework … nominal anchor should be set by the RBI as its predominant
objective of monetary policy…”83
, the then RBI Governor, D. Subba Rao, had suggested that
inflation targeting is neither possible or advisable for RBI as Indian inflation is influenced by
a number of factors other than excess demand. According to the previous RBI Governor, the
Indian economy is dependent on imports and has to deal with volatile capital flows, decisions
of other central banks, trade channels which cause inflation, vulnerability of agriculture
prices to monsoon and adverse weather conditions and more.84
The following are a few of the
reasons provided by RBI in 2009 why inflation targeting is neither desirable nor practical in
India:
It is unlikely that in an emerging economy such as India, the central bank would push
exclusively for a single goal oblivious of the larger development context. The RBI
would probably have to be guided simultaneously by the objectives of price stability,
financial stability and growth
Food items which have a large weight in consumer price indices are vulnerable to
large supply shocks, especially because of the vagaries of the monsoon. An inflation
targeting regime cannot do much to tame supply-driven inflation
It is not possible for an emerging market economy such as India with market
imperfections, diverse geography and 1.1 billion people to develop a single
representative inflation index
have had a dampening effect on inflation ceteris paribus. Similarly, an outflow of FX should have the
reverse effect fanning inflation. 80
The Report, pp. 59 81
The Report states, “Reverse repos and outright OMO sales demanded the availability of adequate stock of
government securities with the RBI, which became a constraining factor in sterilization operations as the
volume of capital inflows expanded.” 82
The Report, pp. 40 83
The Report, pp. 11 84
RBI Speech, July 2, 2009, Available at < http://rbi.org.in/scripts/BS_SpeechesView.aspx?Id=427>
Page 40
33
The monetary transmission mechanism is impeded because of large fiscal deficits,
persistence of administered interest rates and illiquid private bond markets
A boom-bust pattern of capital flows can lead to large disorderly movements in
exchange rates rendering both inflation targeting and financial stability vulnerable85
This was a substantially different RBI position in the past86,87
. Most of these factors standing
in the way of an efficient conventionally understood inflation targeting regime still appear to
hold true.
On a separate note, ECB President Mario Draghi has pointed out the dangers of lowering
interest rates in the context of a flagging economy when inflation is already high88
. Former
Bank of England Governor Mervyn King has commented that central banks need to go
beyond containing inflation and be mindful of financial stability89
. He has also highlighted
the importance of supply-side policies.90
The former Chairman of the Federal Reserve Board,
Ben Bernanke, commenting on inflation targeting at Kotak Presidium in Mumbai on 15th
April 2014 said, “I have been very supportive of inflation targeting. Monetary policy benefits
from clarity and transparency. It really helps people know what you are trying to achieve.
Particularly in a country where inflation has been high, setting a target, even if higher...it
tells markets what to expect.”91
In the light of the 2008 financial-economic breakdown
experience around the world and the above mentioned and other similar views this paper
recommends use of a multiple-objective approach92
. For example, inflation targeting even as
85
Duvvuri Subbarao, Governor of RBI, ‘Global financial crisis – questioning the questions’, Available at <
http://www.bis.org/review/r090806a.pdf> 86
This difference in stance is also reflected in the 2008 comments of ex-RBI governor YV Reddy when he said,
“India is not an inflation-targeting country…the two groups of commodities that carry a large weight in the
consumption basket, namely food and fuel, are subject to supply shocks, making it difficult to identify a ‘core’
that could be meaningfully targeted…” 87
The difference in opinion can be seen in the Report of the Committee on Financial Sector Reforms, 2009
chaired by Dr. Raghuram Rajan when he stated, “the RBI can best serve the cause of growth by focusing on
controlling inflation, and intervening in currency markets only to limit excessive volatility…” (carried in Urjit
Patel Report to Revise and Strengthen the Monetary Policy Framework, pp. 10) 88
“…presence of heavily indebted private and public sectors with large open foreign exchange positions,
central banks have little space for manoeuvre when faced with a flagging economy. This is especially true
when inflation is already high…In these circumstances, lowering the policy rate to stimulate the economy may
risk sparking depreciation pressures on the domestic currency … in turn fuel inflation and offset the impact of
economic stimuli…”, (Speech by Mario Draghi, December 2012 89
In light of costs such as the financial crisis of 2008, he suggests monetary policy to go beyond targeting price
stability and also target financial stability (Mervyn King (2012), ‘Twenty years of inflation targeting’, Bank of
England) 90
Interview/Mervyn King, ‘Inflation targeting welcome but policy instruments hard to come by’, Available at
http://ajw.asahi.com/article/views/opinion/AJ201303160009 91
However, he added the caveat that a focus on inflation should not mean the central bank ignores everything
else. Available at http://articles.economictimes.indiatimes.com/2014-04-16/news/49185226_1_rbi-governor-
raghuram-rajan-kotak-mahindra-bank-ben-bernanke 92
The global financial crisis has proved that policymakers have to gauge many targets along with the traditional
indicators. For instance, monetary policy should not only target price stability but needs to introduce
regulation tools. Evidence suggests that Central Banks that target inflation have also intervened in foreign
Page 41
34
the predominant anchor for monetary policy could work against FX reserves accumulation as
a way of addressing sharply higher capital inflows93
. The Report comments on the issue of
inadequate foreign exchange reserves94
and recommends building up of reserves during
periods of inflows. However, the Report perceives this as a conflicting objective to that of
containing inflation.
In the above context, macro-prudential oversight and monetary policy impact on the financial
system is now within the purview of the Financial Stability and Development Council
(FSDC). FSDC is headed by the Finance Minister and includes financial sector regulators and
senior officials of the Ministry of Finance95
. It was set up by the Government of India in
201096
for better inter-regulatory coordination and promotion of financial stability. The
following tasks have been listed for this body:
Macro prudential supervision of the economy, including the functioning of large
financial conglomerates
Address inter-regulatory coordination issues
Focus on financial literacy and financial inclusion
Coordinating India’s international interface with financial sector bodies such as the
Financial Action Task Force (FATF) and Financial Stability Board (FSB)
Issues related to financial development97
In the recent meeting of the Council, held on June 7 2014, the Finance Minister stressed the
need to improve the climate for business and reduce the costs of doing business in order to
revive stalled investments in the economy.
In addition to this Council, a FSDC sub-committee has been set up which is headed by the
Governor of RBI. It is expected to meet more often than the full Council98
.
exchange markets to smooth volatility and influence the level of exchange rate. Source: Blanchard et al
(2010) 93
Since the primary objective may be in conflict with the policy, “…inflation is the RBI’s primary objective and
that it expects to be held accountable for its performance in this regard.”, (The Report, pp. 13) 94
The Report states, “…if the foreign exchange reserves are not perceived to be adequate, monetary measures
to avert a free fall in the exchange rate may not be very effective.” (pp.61) 95
FSDC is headed by the Finance Minister and the members are the Governor of Reserve Bank of India and the
heads of the Securities and Exchange Board of India (SEBI), Insurance Regulatory and Development
Authority (IRDA), Pension Fund Regulatory and Development Authority (PFRDA), and Forward Markets
Commission (FMC). In addition, Finance Secretary and/ or Secretary of Department of Economic Affairs
(DEA), Secretary of Department of Financial Services (DFS) and Chief Economic Adviser of the Ministry of
Finance are members of this Council. The Council can invite experts to its meetings if deemed necessary. 96
It should be noted that the FSDC is not a statutory body. The Financial Sector Legislative Reforms
Commission (FSLRC) has recommended that the FSDC should be a statutory body in order to have
operational and financial autonomy. This suggestion was opposed by the former Governor of the Reserve
Bank of India. He felt that the role of the Council should be limited to that of a “coordination body”. 97
Press Information Bureau, Government of India
Page 42
35
A separation of tasks in relation to financial stability has been attempted by other countries in
the light of the crisis of 200899
. The BIS has observed in this regard that “prudential tools that
target financial stability need to be calibrated at the level of the financial system but
implemented at the level of each regulated institution”. Similarly, the European Commission
has set up the European Systemic Risk Board in charge of macro prudential oversight to
enhance effectiveness of early warning mechanisms.100
In the UK, a Financial Policy
Committee will be created within the Bank of England which will track the wider economic
and financial risks to the stability of the system.101
4.4 Inflation Targeting in India in the context of Distorted Price Discovery Mechanisms
In broad terms, the problem of sustained food inflation in India could be attributed to the
mismatches between the relatively larger income elasticities of demand for farm products and
lower price elasticities of supply in the short and even medium-term. Macroeconomic
policies which induce significant increase in demand for farm products when supplies cannot
be enhanced conceivably cause significant upward price impact102
. For instance, fiscal
stimulus provided by the government even ahead of the global financial crisis resulted in a
rise in the central government’s fiscal deficit and lead to rising prices. Rising prices would
usually be implicit in revenue expenditures which are consistently above revenue receipts.
Under such circumstances, tighter monetary policies can be expected to have a slower impact
on containing inflation while it has a relatively faster dampening effect on investment103.
Clearly and somewhat simplistically, longer term solutions lie in correcting supply-side
bottlenecks. It calls for investment in large volume supply chains starting with high yielding
seeds, investment in irrigation facilities, warehousing and efficient retail chains104
and all this
calls for proactive and effective administration.
Governor, RBI’s intervention on Fighting Inflation delivered at the FIMMDA-PDAI Annual
Conference on 26th
February 2014 provides a detailed exposition on Indian inflation. It was
explained that the food basket with 48% weight for all India CPI does explain overall
inflation to a large extent during April 2012 and January 2014. Housing and Fuel & Lighting
contribute about 20% and 11% respectively to all India CPI for the same period. As food
prices are a significant explanatory factor, irrespective of which measure of inflation is
chosen, it is pertinent to review to what extent the prices of agricultural commodities are
determined efficiently in India.
98
This Sub-committee has met 12 times whereas the full Council has met 11 times so far. 99
A new Council of regulators consisting of the heads of the Treasury, SEC, CFTC and the Fed has been created
to supplement the Fed’s role to ensure financial stability. 100
http://www.esrb.europa.eu/home/html/index.en.html 101
http://www.bankofengland.co.uk/financialstability/Pages/fpc/default.aspx 102
(Thompson, 1988) 103
Rangarajan and Sheel (2013) 104
Gulati and Saini (2013)
Page 43
36
Agricultural markets continue to be fragmented in India. Prices of agriculture commodities
are influenced by Central and State government interventions at several stages. From sowing
of crops to selling of agricultural produce, prices of inputs and crops continue to be distorted.
Minimum support prices (MSPs) declared by Government before sowing for 24
agricultural
items, constitute more than one-third of primary articles in the WPI. MSPs are meant to
incentivise farmers to shift towards higher priced MSP crops such as wheat and rice from low
yielding crop and it follows that this distorts price discovery105
. Agricultural products acquied
at MSP result in higher than otherwise market prices at the retail level. Further, state
governments declare their own bonuses above MSPs from time to time. For example, the
Tamil Nadu government offered a bonus of Rs 50-70 per quintal and Bihar Rs 250 per quintal
on procurement of paddy for fiscal 2013-14. A table listing minimum support prices (MSPs)
is provided in Annex E highlighting Government’s intervention in the agricultural market and
upward revision in MSP on a regular basis. Concurrently, agricultural inputs such as
fertilisers, irrigation, agricultural credit are invariably provided at prices lower than the
prices which would determined by market processes resulting probably in higher margins for
intermediaries rather than farmers. Furthermore, prices of fruits and vegetables which
account for high price votality items among food articles in WPI as well as in CPI are subject
to Agricultural Produce Market Committee (APMC) Acts. It is likely that the repeal of these
acts would enable farmers to sell their produce more freely including to APMC regulated
markets. Consequently, less regulated flow of perishable goods would result in better price
discovery which should be beneficial for consumers and producers. An analysis of the paddy
market reveals Government’s interventions in buying paddy at MSP is costly since the
objective of protecting farmers’ revenues can be met through purchases of levy rice from
millers which reduces the government’s fiscal and managerial burden106
. Various studies
have been conducted to ascertain the effectiveness of policies on the supply side in India and
particularly in the agricultural sector. India ranks among the highest in emerging economies
in terms of distortions to world trade due to trade barriers, import restrictions and domestic
support either through subsidies or minimum support prices107
. This point is emphasised by
Gulati et al. (2008).
According to FCI, approximately 30% and 36% of the total production of wheat and rice is
procured by Government at MSPs. The fertilizer subsidy was about Rs. 90,000 crore (~1% of
GDP)108
for the 2012-13 fiscal year109
. The total subsidy on petroleum products in 2012-13
was Rs. 96,880 crore (~1% of GDP)110
and the support for oil marketing companies from
105
RBI 2014, Fighting Inflation- Raghuram G. Rajan 106
Gupta, N. (2010), ‘Reserve Prices, Minimum Support Prices and Farmers’ Revenues: Government Grain
Policy through the Prism of Rice Auctions in North India’, Delhi School of Economics, University of Delhi 107
Anderson, K., Martin, W. and Mensbrugghe, D. (2005), ‘Distortions to world trade: impacts on agricultural
markets and farm incomes’, World Bank Policy Research Working Paper 3736 108
Ministry of Chemicals and Fertilizers 109
Fertilizer subsidy was reduced in 2013-14 to about 0.6% of GDP (Budget Documents) 110
Ministry of Petroleum and Natural Gas
Page 44
37
upstream oil companies was Rs. 60,000 crore (~0.65% of GDP)111
. The quantum of subsidy
provided by State Governments to all electricity utilities was about Rs. 25,832 crores
(~0.25% of GDP) in 2011-12112
. Interventions at these levels result in distortions in the price
discovery processes, weakening monetary policy transmission mechanisms.
International trade in agriculture continues to be regulated through tariffs on imports or stop-
go bans on exports although this trade has been significantly liberalised over the years. For
example, exports of non-basmati rice were banned in April 2008 and were reallowed from
September 2011. Similarly, exports of wheat were banned for the same period. Moreover,
India restricts wheat exports from time-to-time according to the domestic demand-supply
situation. It is likely that such ad-hoc administrative decisions have not benefited Indian
farmers or consumers in any sustainable sense. For instance, after the removal of the ban on
export of regular rice in September 2011, India has emerged as the world’s largest rice
exporter in 2012. Customs duties on import of cereals hover in the range of 50-80% whereas
pulses attract zero import duty as domestic production barely meets domestic demand. In the
case of maize there has been no government intervention and India has emerged as a large
exporter113
. Unpredictable government interventions ostensibly to protect the interest of
producers or consumers distort price discovery, hence transparent and sustained trade policies
are required for farm products for a competitive and buoyant agricultural sector.
111
Ibid. 112
Performance Report on State Power Utilities, Power Finance Corporation Ltd, pp.viii 113
Gulati et al (2013), Farm trade: tapping the hidden potential
Page 45
38
Section 5
Conclusions
In India, price data collection has been more systematic for CPI than for WPI. CPI price
surveys are conducted on an all-India basis at regular intervals while WPI price data is
not collected on any fixed periodicity basis and there are no pan-India collection centres.
As food inflation accounts for more than 50% of CPI inflation, combined CPI provides
adequate weightage to expenditure on food products and hence is a preferable inflation
measure in terms of consequences for the population at large. Moreover, CPI inflation is
closely related to household expenditure and better reflects the cost of living. Evidence
from select OECD countries suggests that a single price index is invariably targeted for
monetary policy formulation despite the availiability of multiple price indices. It follows
that the Urjit Patel Committee Report’s recommendation to use CPI inflation for
monetary policy decision making is timely (Sections II, III, IV.I & IV.II).
In India, several government bodies are collectively responsible for the compilation and
release of price indices which is not the case in the US, UK or Germany. Accountability
for efficient and reliable data collection should preferably be housed in one institution to
curb duplication of effort and expenditure. That is, the overall responsibility and
accountability for estimating Indian price indices should be housed in one central
government body to maintain consistency of follow up action and to improve domain
expertise (Sections II & III).
Discretionary fiscal measures and global financial conditions affect the efficacy of
monetary transmission mechanism. Additionally, to enhance monetary policy
effectiveness, administered interest rates on savings in GPF, EPF, PPF and Postal savings
schemes need to be progressively dropped. In this environment, an enhancement in RBI’s
role as communicator and inclusion of projected fiscal developments in well explained
statements in a coordinated manner with Government would help in lowering inflation
expectations (Section IV.III).
Due to transmission impediments and the nature of second order effects of policies,
targeting and controlling consumption patterns present a difficult challenge and hence
monetary policies may impact exchange rates more immediately. That is, raising interest
rates could lead to FX investments in Rupee Treasury bills resulting in upward pressure
on the Rupee exchange rate in the short-term rather than on inflation (Section IV.III).
From reviewing the recommendations of the Urjit Patel Report, it is found that the Report
does not explicitly identify the policies to be adopted when RBI’s objectives are
conflicting such as building up of foreign exchange reserves can be in conflict with the
objective of containing inflation. (Section IV.III).
Page 46
39
The Indian central and state government interventions via subsidies, tariffs and MSPs
distort prices and to that extent price discovery is sub-optimal. As such, monetary policies
can be expected to have less than the expected impact on food prices particularly on rural
headline inflation. Rural household expenditure is relatively higher on food products than
urban households. This combined probably with a lower impact of monetary policies on
agricultural wages/incomes compared to industrial wages, the depressing impact on the
growth in the shorter term could possibly be higher than the constraining impact on rural
food inflation. Such differences in the inter-temporal impact on wages can be expected to
vary between regions and over time (Section IV.IV).
A related and current issue is whether RBI should target headline CPI or core CPI. At
first blush, it seems appropriate that RBI should target core inflation since it excludes
volatile price items such as food and fuel. Moreover, inflation in food and fuel would be
better addressed by correcting supply side constraints. However, using core CPI inflation
would defeat the purpose of switching from WPI to CPI inflation. As discussed in Section
IV, price discovery mechanisms for agricultural products are distorted. Hence it is not
meaningful to focus only on core inflation rather than broader measures which include
movements in food and fuel prices. Concurrently, it has to be accepted that any central
bank’s ability to constrain headline inflation is limited. Hence, as the RBI Report suggests
a multipronged approach needs to be adopted to meet the objective of price stability
(Section IV.IV).
Lastly, this paper recommends that the FSDC could periodically and systematically assess
the impact of fiscal and monetary policies on headline and core CPI and suggest
coordinated action. (Section IV.III).
Page 47
40
References
Aleem Abdul (2010), “Transmission mechanism of monetary policy in India”, Journal of
Asian Economics, 2010, vol. 21, issue 2, pages 186-197
Anderson, Kym, Martin, Will and Mensbrugghe, Dominique van der (2005), ‘Distortions to
world trade: impacts on agricultural markets and farm incomes’, World Bank Policy
Research Working Paper 3736
Bayoumi, Tamim, Ariccia, Giovanni Dell, Habermeier, Karl, Mancini-Griffoli,
Tommaso, Valencia, Fabian and IMF Staff Team, ‘Monetary Policy in the New
Normal’, IMF Staff Discussion Note
Beyer, Andreas et al (2009), ‘Opting out of the great inflation: Monetary policy after the
breakdown of Bretton Woods’, Discussion Paper Series 1: Economic Studies No
12/2009, Deutsche Bundesbank
Blanchard et al (2010), ‘Rethinking Macroeconomic Policy’ IMF Staff Position Note,
February 2010, International Monetary Fund
Bullard, James (2013), ‘CPI vs. PCE Inflation: Choosing a Standard Measure’, Federal
Reserve Bank of St. Louis
Bullard, James (2011), ‘Measuring Inflation: The Core Is Rotten’, Federal Reserve Bank of
St. Louis
Bhattacharya, Rina (2013), ‘Inflation Dynamics and Monetary Policy Transmission in
Vietnam and Emerging Asia’, IMF Working Paper, WP/13/155
Bhattacharya, Rudrani and Ila Patnaik (2014), ‘Monetary policy analysis in an inflation
targeting framework in emerging economies:The case of India’, National Institute of
Public Finance and Policy, New Delhi
Capehart, Tom and Richardson, Joe (2008), ‘Food Price Inflation: Causes and Impact’,
Congressional Research Service, The Library of Congress
Central Statistics Office, Ministry of Statistics and Programme Implementation,
Government of India (2011), ‘Consumer Price Index Numbers - Separately for Rural and
Urban Areas and also Combined (Rural plus Urban)’, Central Statistics Office,
http://mospi.nic.in/mospi_new/upload/brochure_n_cpi18_feb11.pdf
Page 48
41
Central Statistics Office, Ministry of Statistics and Programme Implementation,
Government of India (2010), ‘Manual on Consumer Price Index 2010’, Central
Statistics Office, New Delhi
Dev, S. Mahendra (2011), ‘Rising Food Crisis and Financial Crisis in India: Impact on
Women and Children and Ways of Tackling the Problem’, Indira Gandhi Institute of
Development Research, Mumbai, January 2011
Devereux and Yetman, “Responding to exchange rates in a globalised world”, BIS Papers
No 77; Mohan and Kapur (2009)
Duvvuri Subbarao, Governor of RBI, ‘Global financial crisis – questioning the questions’,
Available at < http://www.bis.org/review/r090806a.pdf>
Dr. Duvvuri Subbarao, Governor of RBI, Interview with Claire Jones, July 2, 2009,
Available at < http://rbi.org.in/scripts/BS_SpeechesView.aspx?Id=427>
ECB (2012), “Central bank communication on fiscal policy”, Working paper series no 1477 /
September2012
ECB - Transmission Mechanism of Monetary Policy
European Central Bank (2011), “Price Stability: Why is it important for you?”
Federal Statistical Office, Germany, https://www.destatis.de/EN/Meta/abisz/VPI_e.html
Filardo, Andrew, Mohanty, Madhusudan and Moreno, Ramon, ‘Central bank and
government debt management: issues for monetary policy’, BIS Papers No. 67
Filardo, Andrew and Genberg, Hans (2009), ‘Targeting inflation in Asia and the Pacific:
lessons from the recent past’, BIS Representative Office for Asia and the Pacific
Gokarn, Subir and Singh, Bhupal, ‘External factors and monetary policy: Indian evidence’,
BIS Papers No. 57
Goyal, Ashima and Akash Kumar Baikar (2014), ‘Psychology, cyclicality or social
programs: Rural wage and inflation dynamics in India’, Indira Gandhi Institute of
Development Research, Mumbai
Gulati, Ashok et al (2013), ‘Farm trade: tapping the hidden potential’, Commission for
Agricultural Costs and Prices, Discussion Paper No. 3, February 2013
Page 49
42
Gulati, Ashok and Pursell, Garry (2008), ‘Distortions to Agricultural Incentives in India
and Other South Asia’, Agricultural Distortions Working Paper 63, World Bank
Gulati, Ashok and Shweta Saini (2013), ‘Taming Food Inflation in India’ Commission for
Agricultural Costs and Prices, Discussion Paper No. 3, April 2013
Gulati, Ashok and Anil Sharma (1995), ‘Subsidy Syndrome in Indian Agriculture’,
Economic and Political Weekly, Vol. 30, No. 39 (Sep. 30, 1995), pp. A93-A102
Gupta, Neha (2010), ‘Reserve Prices, Minimum Support Prices and Farmers’ Revenues:
Government Grain Policy through the Prism of Rice Auctions in North India’, Delhi
School of Economics, University of Delhi
Habermeier, Karl, Otker-Robe, Inci, Jacome, Luis, Giustiniani, Alessandro, Ishi,
Kotaro, Vavra, David, Kisinbay, Turgut and Vazquez, Francisco (2009),
‘Inflation Pressures and Monetary Policy Options in Emerging and Developing
Countries: A Cross Regional Perspective’, IMF Working Paper 09/01
Headey, Derek and and Shenggen Fan (2008), ‘Anatomy of a crisis: the causes and
consequences of surging food prices’, Journal of Agricultural Economics, Volume
39, Issue Supplement s1, pages 375–391,November 2008
Kapur and Mohan (2014), “India’s Recent Macroeconomic Performance: An Assessment
and Way Forward”, IMF Working Paper.
Kock, Gabriel and Ghaleb, Tanya (1995), ‘Has the Cost of Fighting Inflation Fallen?’,
Federal Reserve Bank of New York
Kumar, Ashish and G. M. Boopathy (2013), ‘National price indices and inflation during
2012’, Central Statistics Office,
http://mospi.nic.in/mospi_new/upload/price_stat_8mar13.pdf?status=1&menu_id=21
5
Mahalik, Mantu Kumar and Mallick, Hrushikesh, ‘What Causes Asset Price Bubble in an
Emerging Economy? Some Empirical Evidence in the Housing Sector of India’, IIT
Madras
Mario Draghi (2012), ‘A central banker’s perspective on European economic convergence’,
Speech at the Anchor 2013 Conference organized by the Magyar Nemzeti Bank
Mervyn King (2012), ‘Twenty years of inflation targeting’, Bank of England, The Stamp
Memorial Lecture, London School of Economics
Page 50
43
Interview/Mervyn King, ‘Inflation targeting welcome but policy instruments hard to come
by’, Available at http://ajw.asahi.com/article/views/opinion/AJ201303160009
Mishkin (1995), "Symposium on the Monetary Transmission Mechanism”, American
Economic Association, The Journal of Economic Perspectives, Vol. 9, No. 4
(Autumn, 1995), pp. 3-10
Mohan and Kapur (2009), “Managing the Impossible Trinity: Volatile Capital Flows and
Indian Monetary Policy”, Working Paper No. 401, Stanford Center for International
Development
Mohanty and Bhanumurthy (2014), “Exchange Rate Regimes and Inflation: Evidence from
India”, NIPFP Working Paper No. 2014-130
Mohanty, Deepak (2014), ‘Why is Recent Food Inflation in India so Persistent?’, Reserve
Bank of India, http://www.rbi.org.in/scripts/BS_SpeechesView.aspx?Id=867
Mohanty, Deepak (2013), ‘Indian Inflation Puzzle’, Reserve Bank of India
Mohanty, Deepak (2012), ‘The Importance of Inflation Expectations’, Reserve Bank of
India
Nadhanael, GV and Sitikantha Pattanaik (2010), ‘Measurement of Inflation in India:
Issues and Associated Challenges for the Conduct of Monetary Policy’, Department
of Economic Analysis and Policy, September 2010, Reserve Bank of India
Nair, Sthanu and Eapen, Leena (2012), ‘Food Price Inflation in India (2008 to 2010): A
Commodity-wise Analysis of the Causal Factors’, Indian Institute of Management,
Kozhikode
Office of the Economic Adviser, Department of Industrial Policy and Promotion, Ministry
of Commerce and Industry, ‘WPI Manual’, Office of the Economic Adviser,
http://www.eaindustry.nic.in/WPI_Manual.pdf
Office of the Economic Adviser, Department of Industrial Policy and Promotion, Ministry
of Commerce and Industry, ‘Revision of Index Numbers of Wholesale Prices in India
with base 2004-05=100- Methodology, Basket and Weights’, Office of the Economic
Adviser, http://eaindustry.nic.in/wpi_2004_05/Report.pdf
Patnaik, Ila et al (2011), ‘How Should Inflation Be Measured in India?, Economic and
Political Weekly, vol xlvI no 16, April 16, 2011
Page 51
44
Patra, Michael Debabrata and Ray, Partha (2010), ‘Inflation Expectations and Monetary
Policy in India: An Empirical Exploration’, IMF Working Paper, WP/10/84
Patra, Michael Debabrata, Khundrakpam, Jeevan Kumar and George, Asish Thomas
(2013), ‘Post-Global Crisis Inflation Dynamics in India: What has changed?’, India
Policy Forum 2013, NCAER and The Brookings Institution
Pattnaik, R K and Amaresh Samantaraya (2006), ‘Indian Experience of Inflation: A
Review of the Evolving Process’, Economic and Political Weekly, Vol. 41, No. 4
(Jan. 28 - Feb. 3, 2006), pp. 349+351-357
Raj, Janak, Dhal, Sarat and Jain, Rajeev (2008), ‘Imported Inflation: The Evidence from
India’, Reserve Bank of India Occasional Papers, Vol. 29, No. 3
Rajan, Raghuram (2014), ‘Fighting Inflation’, Reserve Bank of India,
http://www.rbi.org.in/scripts/BS_SpeechesView.aspx?Id=878
Rangarajan, C and Alok Sheel (2013), ‘Relevance of Keynesianism in the Post-Recession
Period’, Economic and Political Weekly, Vol - XLVIII No. 33, August 17, 2013
Reserve Bank of India (2014), ‘Report of the Expert Committee to Revise and Strengthen
the Monetary Policy Framework’, January 2014, Reserve Bank of India
Reserve Bank of India (2013), ‘Report on Currency and Finance’, March 2014, RBI
Rubin, Robert, Orszag, Peter and Sinai, Allen (2004), ‘Sustained Budget Deficits: Longer-
Run US Economic Performance and the Risk of Financial and Fiscal Disarray’, AEA-
NAEFA Joint Session
Sabade Shubhada (2013), “Is money supply the cause of inflation in India? An alternative
postulate to understand inflation”, Science Direct
Salian, Prasanna and K, Gopakumar, ‘Inflation and Economic Growth in India – An
Empirical Analysis’, IGDIR
Sharma, G D, ‘Compilation of Consumer Price Indices (CPI) and Wholesale price Index
(WPI) in India’, Central Statistics Organisation, Ministry of Statistics and Programme
Implementation.
Shirakawa Masaaki, “ Is inflation (or deflation) “always and everywhere” a monetary
phenomenon?” BIS Papers
Page 52
45
Singh, B. Karan (2012), ‘An Assessment of Inflation Modelling in India’, Working Paper
No 259, Indian Council for Research on International Economic Relations
Singh, B. Karan et al (2011), ‘Revisiting the empirical existence of the Phillips curve for
India’, Journal of Asian Economics 22 (2011) 247–258
Singhi, M.C., ‘Wholesale and Retail Price trends of Select Commodities– Do they
converge?’ Office of the Economic Advisor, Ministry of Commerce and Industry
Structure of Financial Stability and Development Council
http://finmin.nic.in/fsdc/StrucFSDC.pdf
STCI (2011), ‘Which Measure of Inflation: Headline, Core or Trimmed?’,
http://www.stcipd.com/UserFiles/File/Which%20Measure%20of%20Inflation%20He
adline,%20Core%20or%20Trimmed.pdf
Subbarao, Duvvuri (2013), ‘Is There a New Normal for Inflation?’, Reserve Bank of India
Thompson, Robert L (1988), ‘Macroeconomic Policy and Agriculture-Macroeconomics,
Agriculture, and Exchange Rates’, Chapter 7, Edited by P. L. Paarlberg, Robert G.
Weidenaar, Dennis, ‘Anti-Inflationary Policies: Alternative Approaches’, Purdue University
World Economic Outlook, International Monetary Fund (2013), ‘The Dog That Didn’t
Bark: Has Inflation Been Muzzled Or Was It Just Sleeping?’ World Economic
Outlook, April 2013
Websites:
i. www.mospi.gov.in
ii. www.eaindustry.nic.in
iii. www.labourbureau.nic.in
iv. www.rbi.org.in
v. http://finmin.nic.in/fslrc/fslrc_index.asp
vi. http://www.mydigitalfc.com/news/subbarao-says-fsdc-must-restrict-itself-coordination-
334
vii. http://www.esrb.europa.eu/home/html/index.en.html
viii. http://www.bankofengland.co.uk/financialstability/Pages/fpc/default.aspx
ix. http://articles.economictimes.indiatimes.com/2014-04-16/news/49185226_1_rbi-
governor-raghuram-rajan-kotak-mahindra-bank-ben-bernanke
Page 53
46
Annex A: Real Interest Rates in India
Source: RBI114
Annex B: Fiscal Deficit trend in India
Central
Government
Fiscal Deficit [%
of GDP]
Central
Government Net
Primary Deficit
[% of GDP]
Central
Government
Primary Revenue
Deficit [% of GDP]
Central plus State
Government Fiscal
Deficit [% of GDP]
2013-14 4.69% 1.58% 3.27% 6.90%
2012-13 5.10% 2.13% 3.6% 7.20%
2011-12 5.70% 2.91% 4.39% 8.10%
2010-11 4.80% 1.88% 3.24% 6.90%
2009-10 6.50% 3.40% 5.23% 9.30%
2008-09 6% 2.80% 4.5% 8.30%
2007-08 2.54% -0.88% 1.05% 4.09%
2006-07 3.32% -0.18% 1.87% 5.37%
2005-06 3.97% 0.37% 2.5% 6.49%
2004-05 3.88% -0.04% 2.42% 7.19%
2003-04 4.50% -0.03% 3.57% 8.18%
Source: Economic Survey 2012-13; RBI; Planning Commission
114
The real interest rate is calculated by subtracting the CPI-IW inflation recorded with the Base CPI-2001 as
100 from the 1-Year Treasury yields. The data is taken from RBI.
Page 54
47
Annex C: Repo Rate and CPI
Note: CPI (AL) series is used till 2011 and CPI (combined) numbers are being used from
2012 onwards Source: RBI
Annex D: Time-Series of Repo-rates, Bank Rates and Growth rate of M3
Year Repo Rates*
Bank
Rates*
Cash Reserve
Ratio*
Yearly Growth rate
of M3
Mar 1989 -Apr-1990 - 10.0% 15% 19.0%
Mar 1990 -Apr-1991 - 10.0% 15% 17.1%
Mar 1991- Apr-1992 - 12.0% 15% 16.7%
Mar 1992- Apr-1993 - 12.0% 15% 17.7%
Mar 1993 -Apr-1994 - 12.0% 14% 15.9%
Mar 1994 - Apr-1995 - 12.0% 15% 19.8%
Mar 1995 -Apr-1996 - 12.0% 14% 15.6%
Mar 1996 -Apr-1997 - 11.0% 10% 16.2%
Mar 1997 - Apr-1998 - 10.5% 10.25% 17.0%
Mar 1998 -Apr-1999 - 8.0% 10.5% 19.8%
Mar 1999 -Apr-2000 - 7.0% 9% 17.2%
Mar 2000 -Apr-2001 9.0% 7.0% 8% 15.9%
Mar 2001 -Apr-2002 8.0% 6.5% 5.5% 16.0%
Mar 2002 - Apr-2003 7.0% 6.3% 4.75% 16.1%
Mar 2003 - Apr-2004 6.0% 6.0% 4.5% 13.0%
Mar 2004 - Apr-2005 6.0% 6.0% 5% 14.0%
Mar 2005 -Apr-2006 6.8% 6.0% 5% 15.9%
Mar 2006 -Apr-2007 7.8% 6.0% 6% 20.0%
Mar 2007 -Apr-2008 7.8% 6.0% 7.5% 22.1%
Mar 2008 -Apr-2009 5.0% 6.0% 5% 20.5%
Mar 2009 - Apr-2010 5.0% 6.0% 5.75% 19.2%
Mar 2010 -Apr-2011 6.8% 6.0% 6% 16.1%
Mar 2011 -Apr-2012 8.5% 9.5% 4.75% 15.8%
Mar 2012 - Apr-2013 7.5% 8.5% 4% 15.4%
Mar 2013 -Apr-2014 8.0% 10.3% 4% 13%**
* These numbers are as of 1st April of the year
** Projection according to RBI
Page 55
48
Annex E: Minimum Support Prices
Minimum Support Prices (Rs. Per quintal)
(According to Crop Year)
Sl.
No. Commodity Variety
2009-
10
2010
-11
2011
-12
2012
-13
(#) increase
in
MSP 2012-
12
over 2011-
12
2013
-14
(#)
increase
in MSP
2013-14
over 2012
- 13
KHARIF
CROPS
1 PADDY
Commo
n 950$ 1000 1080 1250 170(15.7) 1310 60(4.8)
Grade
'A' 980$ 1030 1110 1280 170(15.3) 1345 65(5.1)
2 JOWAR Hybrid 840 880 980 1500 520(53.1) 1500 .-
Maldan
di 860 900 1000 1520 520(52.0) 1520 .-
3 BAJRA 840 880 980 1175 195(19.9) 1250 75(6.4)
4 MAIZE 840 880 980 1175 195(19.9) 1310 135(11.5)
5 RAGI 915 965 1050 1500 450(42.8) 1500 .-
6 ARHAR (Tur) 2300
3000
3200
¶ 3850 650(20.3) 4300 450(11.7)
7 MOONG 2760
3170
3500
¶ 4400 900(25.7) 4500 100(2.3)
8 URAD 2520
2900
3300
¶ 4300 1000(30.3) 4300 .-
9 COTTON
Medium
Staple 2500a 2500
a 2800
a 3600 800(28.6) 3700 100(2.8)
Long
Staple 3000aa
3000a
a
3300a
a 3900 600(18.2) 4000 100(2.6)
10
GROUND IN
SHELL 2100 2300 2700 3700 1000(37.0) 4000 300(8.1)
11
SUNFLOWE
R SEED 2215 2350 2800 3700 900(32.1) 3700 .-
12 SOYABEEN Black 1350 1400 1650 2200 550(33.3) 2500 300(13.6)
Yellow 1390 1440 1690 2240 550(32.5) 2560 320(14.3)
13 SESAMUM 2850 2900 3400 4200 800(23.5) 4500 300(7.1)
14 NIGERSEED 2405 2450 2900 3500 600(20.7) 3500 .-
RABI
CROPS
15 WHEAT 1100
1120
$ 1285 1350 65(5.05) 1400 50(3.7)
16 BARLEY 750 780 980 980 0(0.00) 1100 120(12.2)
17 GRAM 1760 2100 2800 3000 200(7.14) 3100 100(3.3)
18
MASUR
(LENTIL) 1870 2250 2800 2900 100(3.57) 2950 50(1.7)
19
RAPESEED/
MUSTARD 1830 1850 2500 3000 500(20.00) 3050 50(1.7)
20 SAFFLOWER 1680 1800 2500 2800 300(12.00) 3000 200(7.1)
Page 56
49
21 TORIA 1735 1780 2425 2970 545(22.47) 3020 50(1.7)
OTHER
CROPS
22 COPRA Milling 4450 4450 4525 5100 575(12.7) 5250 150(2.94)
(Calender
Year) Ball 4700 4700 4775 5650 575(12.0) 5500 150(2.80)
23
DE-HUSKED
COCONUT
(Calender
Year) 1200 1200 1200 1400 200(16.7) 1425 25(1.79)
24 JUTE 1375 1575 1675 2200 525 (31.3) 2300 100(4.55)
25
SUGARCAN
E*
129.8
4
139.1
2
145.0
0 170 25(17.2)
210.0
0 40(23.5)
#
Figures in brackets
indicate percentage
increase
$
An additional incentive bonus of Rs. 50 per quintal was
payable over the Minimum Support Price (MSP)
*
Staple Length (mm) of 24.5 - 25.5
and Micronaire value of 4.3 - 5.1
aa
Staple length (mm) of 29.5 - 30.5
and Micronaire value of 3.5 - 4.3
Additional incentive at the rate of Rs. 500 per quintal of tur, urad and moong sold to
procurement agencies was payable duirng the harvest/arrival period of two months.
*
Fair and
remunerative
price
Page 57
50
Annex F: New Series of CPI-All India Weights
New series of CPI - All India Weights
Sub group/group Rural Urban Combined
(Rural +
Urban)
Cereals and products 19.08 8.73 14.59
Pulses and products 3.25 1.87 2.65
Milk and milk products 8.59 6.61 7.73
Oils and fats 4,67 2.89 3.90
Egg, fish and meat 3.38 2.26 2.89
Vegetables 6.57 3.96 5.44
Fruits 1.90 1.88 1.89
Sugar etc 2.41 1.26 1.91
Condiments and spices 2.13 1.16 1.71
Non-alcoholic beverages 2.04 2.02 2.03
Prepared meals etc 2.57 3.17 2.83
Pan, tobacco and Intoxicants 2.73 1.35 2.13
Food, beverages and tobacco 59.31 37.15 49.71
Fuel and Light 10.42 8.40 9.49
Clothing and bedding 4.60 3.34 4.05
Footwear 0.77 0.57 0.68
Clothing, Bedding and footwear 5.36 3.91 4.73
Housing 22.53 9.77
Education 2.71 4.18 3.35
Medical care 6.72 4.34 5.69
Recreation and amusement 1.00 1.99 1.43
Transport and communication 5.83 9.84 7.57
Personal care and effects 3.05 2.74 2.92
Household requisites 4.48 3.92 4.30
others 1.12 0.99 1.06
Miscellaneous 24.91 28.00 26.31
All Groups 100.00 100.00 100.00
Page 58
51
LATEST ICRIER’S WORKING PAPERS
NO. TITLE Author YEAR
278 THE ECONOMIC IMPACTS OF
TEMPERATURE ON
INDUSTRIAL PRODUCTIVITY:
EVIDENCE FROM INDIAN
MANUFACTURING
ANANT
SUDARSHAN
MEENU TEWARI
JULY 2014
277 JOINING THE SUPPLY CHAIN: A
FIRM-LEVEL PERSPECTIVE FROM
SOUTHEAST ASIA
GANESHAN
WIGNARAJA
JUNE 2014
276 EL NIÑO AND INDIAN DROUGHTS-
A SCOPING EXERCISE
SHWETA SAINI
ASHOK GULATI
JUNE 2014
275 INDIA-PAKISTAN TRADE: AN
ANALYSIS OF THE
PHARMACEUTICAL SECTOR
MANOJ PANT
DEVYANI PANDE
JUNE 2014
274 ENHANCING INDIA-PAKISTAN
ECONOMIC COOPERATION:
PROSPECTS FOR INDIAN
INVESTMENT IN PAKISTAN
PALAKH JAIN AND
SAMRIDHI BIMAL
MAY 2014
273 SECURITIES TRANSACTION TAX-
CASE STUDY OF INDIA
NEHA MALIK APRIL 2014
272 IMPACT OF TRANSACTION TAXES
ON COMMODITY DERIVATIVES
TRADING IN INDIA
SAON RAY
NEHA MALIK
MARCH 2014
271 FEEDSTOCK FOR THE
PETROCHEMICAL INDUSTRY
SAON RAY
AMRITA GOLDAR
SWATI SALUJA
FEBRUARY
2014
270 USING IPRS TO PROTECT NICHES?
EVIDENCE FROM THE INDIAN
TEXTILE AND APPAREL INDUSTRY
SUPARNA
KARMAKAR MEENU
TEWARI
JANUARY
2014
269 MONSOON 2013: ESTIMATING THE
IMPACT ON AGRICULTURE
ASHOK GULATI
SHWETA SAINI
SURBHI JAIN
DECEMBER
2013
268 REMOTENESS AND UNBALANCED
GROWTH:
UNDERSTANDING DIVERGENCE
ACROSS
INDIAN DISTRICTS
SAMARJIT DAS
CHETAN GHATE
PETER E.
ROBERTSON
SEPTEMBER
2013
Page 59
52
About ICRIER
Established in August 1981, ICRIER is an autonomous, policy-oriented, not-for-profit,
economic policy think tank. ICRIER's main focus is to enhance the knowledge content of
policy making by undertaking analytical research that is targeted at informing India's policy
makers and also at improving the interface with the global economy. ICRIER's office is
located in the institutional complex of India Habitat Centre, New Delhi.
ICRIER's Board of Governors includes leading academicians, policymakers, and
representatives from the private sector. Dr. Isher Ahluwalia is ICRIER's chairperson. Dr.
Rajat Kathuria is Director and Chief Executive.
ICRIER conducts thematic research in the following seven thrust areas:
Macro-economic Management in an Open Economy
Trade, Openness, Restructuring and Competitiveness
Financial Sector Liberalisation and Regulation
WTO-related Issues
Regional Economic Co-operation with Focus on South Asia
Strategic Aspects of India's International Economic Relations
Environment and Climate Change
To effectively disseminate research findings, ICRIER organises workshops, seminars and
conferences to bring together academicians, policymakers, representatives from industry and
media to create a more informed understanding on issues of major policy interest. ICRIER
routinely invites distinguished scholars and policymakers from around the world to deliver
public lectures and give seminars on economic themes of interest to contemporary India.