Working Paper No. 2011/54 The Efficiency of States and Cities: Is There a Case for Public Land Leasing and Sales to Finance India’s Cities? Kala Seetharam Sridhar* September 2011
Abstract
In this study an attempt has been made to assess the potential of land as a municipal financing tool in four Indian cities, to enable better public service delivery and attainment of the MDGs. The institutional arrangements for land use are fragmented in India’s cities between the urban development authorities, which are state agencies, and the cities. To determine whether or not transfer of revenues from land to cities from the para-statal entities is justified, stochastic frontier analysis is used to determine the efficiency of Indian cities and the Indian states. The efficiency of service provision is examined taking the case of roads. Keywords: land lease, efficiency of cities, India, urban infrastructure finance, stochastic frontier analysis, JEL classification: H27, H71, H72, H82
The World Institute for Development Economics Research (WIDER) was established by the United Nations University (UNU) as its first research and training centre and started work in Helsinki, Finland in 1985. The Institute undertakes applied research and policy analysis on structural changes affecting the developing and transitional economies, provides a forum for the advocacy of policies leading to robust, equitable and environmentally sustainable growth, and promotes capacity strengthening and training in the field of economic and social policy making. Work is carried out by staff researchers and visiting scholars in Helsinki and through networks of collaborating scholars and institutions around the world. www.wider.unu.edu [email protected]
UNU World Institute for Development Economics Research (UNU-WIDER) Katajanokanlaituri 6 B, 00160 Helsinki, Finland Typescript prepared by Rosaleen McDonnell. The views expressed in this publication are those of the author(s). Publication does not imply endorsement by the Institute or the United Nations University, nor by the programme/project sponsors, of any of the views expressed.
Acknowledgements
I thank UNU-WIDER for the funding support and opportunity to work on an extension of the study I originally did for the Thirteenth Finance Commission, Government of India. At WIDER, I thank Finn Tarp for his comments regarding the paper. I thank Augustin Fosu for the time he spent discussing the paper and for facilitating a seminar. I thank the seminar participants at UNU-WIDER where this paper was presented in April 2011, for their comments. Special thanks are due to James Thurlow for his comments during discussions with him. I thank Bruck Tadesse for his assistance with STATA and STATA’s technical support for answering my questions. I thank my colleague at Public Affairs Centre in Bangalore, India, Venugopal Reddy, for his assistance in collating the information regarding citizen report cards. Any errors remain with me.
1
1 Introduction
The year 2007 was important for urbanization since the number of urban inhabitants surpassed rural dwellers as a percentage of the total world population. The world population is expected to become two-third urban by 2025. The urbanization pattern in India also has been undergoing significant change, consistent with the worldwide phenomenon. The share of urban population in the total population of the country grew from 11per cent in 1901 to 26 per cent in 1991, and 29 per cent in 2001. While India adopts a very conservative definition of what is ‘urban’, the ‘urban’ population in India is expected to increase to about 500 million by 2021. While the urbanization phenomenon is widely accepted as being an inevitable by-product of development, there are many undesirable outcomes that have resulted. According to the Government of India’s Ministry of Urban Development, 20 per cent of the country’s urban households do not have access to safe drinking water, 58 per cent do not have safe sanitation, and more than 40 per cent of garbage generated is left uncollected for want of proper waste management. There is no consensus on what the cause is of the poor state of such public service delivery in India’s cities. Some studies point to institutional overlaps and governance as factors causing problems in the delivery of public services (Savage and Dasgupta 2006; Sridhar 2006). Another set of studies point to weak municipal finances as the core of the problem (see Reedy 1986; Sridhar and Mathur 2009). Based on our discussions, field visits and observations, there is evidence that cities that have access to liquid sources of revenue such as octroi are able to provide public services such as solid waste management much better than others. Given this evidence, it is plausible to believe that finances play an important role in public service delivery. One reason for exploring innovative sources of development finance is that city finances in India are in poor condition. Most of India’s cities have now abolished the highly buoyant source of revenue, the octroi, which is now generally accepted to be distortionary in its effects. Further, the property tax base is at best subjective and has not yet become a resilient source of revenue. The sphere of municipal taxation was, in India some time ago, enlarged to include land tax and tax on land values; however, with the exception of a few local bodies in Tamil Nadu, little progress has been reported regarding the levy/enhancement of land taxes by local bodies. A high tax rate on land encourages improvements on land, and provides a disincentive for large speculative landholdings. A high land value tax would decrease the market value of land and provide a stimulus to develop land to its full potential. Having said this, it should be recognized that local governments frequently have more flexibility in managing their assets than they do in adjusting tax rates, or introducing new taxes which require higher-level governmental approval (as in China) or are prohibited entirely by the fiscal framework. One of the means by which local governments increase revenues in the absence of an effective taxation system is through public land leasing (Ding 2005). While it is important to understand that land is a non-renewable resource and can be exhausted, one
2
option that has been given much less attention in municipal finances is their land assets. In fact, many cities and municipal governments have access to substantial land assets such as public buildings, housing, and municipally owned enterprises. It is also easy to understand that since local governments make infrastructure investments on their land, such as water supply networks, roads, and schools, these are likely to be capitalized in the land value. Further, urbanization and economic growth drive up land prices. In fact, Sridhar (2004) summarizes the disparity in real estate prices between the central business district and the suburbs of some of India’s metropolitan areas. Hence, municipal governments have every right to capture the outcome of economic growth which manifests itself in increased land prices, and also their own investment through sale (see Peterson 2007). Land in urban areas is a scarce resource which needs to be optimally utilized if the objective of affordable housing is to be attained and in order to halve global poverty by 2015, as set out in the Millennium Development Goals (MDGs). Hence in this study, an attempt has been made to assess the potential of land as a municipal financing tool and for financing expenditures in India’s cities. Second, I have examined the case for whether or not Indian cities are more efficient than the states in the provision of public services (taking the case of roads), so that one may decide whether or not a case for transferring revenues from public land leasing and sales to cities exists.
2 Objectives and scope
The objective of this study is to gather systematic evidence regarding the actual potential of municipal land as a revenue generating source. In India, a large amount of urban land is held by urban development authorities (UDAs), and it is possible to use the revenues from their sales as an infrastructure financing strategy.1 However, there is very little systematic research, thus far, that throws light on the important role played by land held by the UDAs in municipal financing in India’s context. Further, if one advocates transfer of revenues away from state agencies such as the UDAs in favour of cities, one needs to throw light on why it would be beneficial for cities to have the extra resources. This is why the issue of efficiency of cities and the states in the provision of public services is examined. I assume that, given the institutional arrangements, UDAs are more efficient than city governments in raising revenues from land leasing and sales.2 The revenue raising 1 In India, a number of state government agencies such as the Karnataka Industrial Areas Development Board (KIADB) acquire and dispose land. For instance, as of July 2008 (Times of India, July 24, 2008), the KIADB had acquired 869 acres of farmland for a proposed hardware park, in addition to the over 50,000 acres of surplus land which was waiting to be disposed through a specially formed realty corporation. There were reports that over 1,00,000 acres of land was lying with the state government of Karnataka in 2007 of which some 28,000 acres were encroached upon by politicians, builders, government servants, and many landless poor (some of them being former owners who lost their land during acquisition). A committee (Venkatswamy Committee) was set up to investigate these encroachment cases, but little was known of its report or recommendations (Times of India, 24 July 2008). 2 For instance, Sridhar and Reddy (2009) found, based on anecdotal evidence, that UDAs were more likely to rope in the private sector, and engaged in public private partnerships more actively for infrastructure projects, than the city governments.
3
efficiency of the UDAs compared with that of the city governments is not questioned here. I only make an attempt to examine the efficiency with which public services are offered by the city government when compared with that of the state governments (which the UDAs, being para-statal entities, represent). This is to understand, along with other reasons, whether there is a case for transferring the revenues so raised by the UDAs, to the city governments. In this study, I intend to answer the following questions:
a. What is the potential of public land leasing and sales (by the UDAs) as a revenue generating source in India’s cities, when compared to the total revenues and own source revenues of these city governments?
b. How can the UDA’s proceeds from land leasing and sales be realized by city governments, given that land is held by agencies different from the municipal authorities in many cases? Answers to this question are quite important since it means that infrastructure financing can become a much simpler process once the value of land is realized.
c. Are Indian cities more or less efficient than the Indian states in service provision? If the cities are more efficient, the case for transferring financial resources to them from the UDAs (which are state agencies) would be stronger, since they also represent local priorities and preferences in a much more effective manner, when compared with the distant national or state governments.
This study is organized as follows. In order to understand the questions raised above, and to enable a response, the institutional arrangements for land use in India’s cities are described in Section 3. Section 4 then outlines the gaps in the literature after presenting a survey of the relevant literature. Section 5, on methodology, explains the theory behind the stochastic frontier analysis used to examine the efficiency of Indian cities and that of the states, A whilst Section 6 focuses on the findings from the potential of land as a revenue source for cities in India. Section 7 summarizes the findings from the stochastic frontier analysis for India’s cities and states, and presents implications for their efficiency in the provision of public services, taking the case of roads. Section 8 summarizes the findings by presenting a synthesis, and draws policy implications for the transfer of revenues, rising beyond findings from the stochastic frontier analysis. Section 9 presents concluding remarks.
3 Institutional arrangements for land use in India’s cities
In India’s cities, urban development authorities (UDAs) hold substantial amounts of land as part of urban development projects. In new areas these UDAs acquire land under public purpose regulation, develop them with infrastructure networks, and then sell to developers and end-users. Once the capital costs of the projects are recovered, the UDAs typically hand over the developed parcels to the municipal government for their operation and maintenance. This is notwithstanding the several institutional overlaps that exist with respect to land use in India’s cities (see Sridhar 2006 for one such example taking the case of Ludhiana, India). However, the UDAs do not have municipal functions in the same way that the cities have. Cities in India are not free to dispose of land at will or commercially lease it. They
4
are, on the one hand, tied by ‘public purpose’ uses of their land such as the construction of schools and hospitals. Further, municipal authorities in India are also saddled with other municipal functions, such as sanitation and solid waste management, of their areas in addition to the provision of roads, street lighting, water supply and sewerage (in cases where the cities are mandated to provide it), quite in contrast to the UDAs which are required to provide only water supply, sewerage and roads in the areas which they develop.3 It is instructive to note that UDAs are not required to provide schools, hospitals, solid waste management or sanitation, which continues to be the responsibility of the city government.4 Currently, in Indian cities some land is held by municipal corporations, revenues from the sale or lease of which accrue to them (and is classified under their ‘non-tax’ revenues). However, a substantial amount of land is held by UDAs in cities but their revenues do not accrue to the ULBs and hence is not accounted for in the ULB revenues reported by the various state finance commissions. While acknowledging the substantial variability in the revenue capacity of India’s cities, and fully understanding the exhaustible nature of land resources, in this study I explore the potential of land as a revenue source for municipalities, were the UDAs to transfer them to the city governments. I also examine the extent of city expenditures that can be 3 Below is the list of municipal functions mandated in the Twelfth Schedule of India’s 74th Constitutional Amendment Act: 1. Urban planning including town planning. 2. Regulation of land-use and construction of buildings. 3. Planning for economic and social development. 4. Roads and bridges. 5. Water supply for domestic, industrial and commercial purposes. 6. Public health, sanitation conservancy and solid waste management. 7. Fire services. 8. Urban forestry, protection of the environment and promotion of ecological aspects. 9. Safeguarding the interests of weaker sections of society, including the handicapped and mentally retarded. 10. Slum improvement and upgradation. 11. Urban poverty alleviation. 12. Provision of urban amenities and facilities such as parks, gardens, playgrounds. 13. Promotion of cultural, educational and aesthetic aspects. 14. Burials and burial grounds; cremations, cremation grounds and electric crematoriums. 15. Cattle pounds; prevention of cruelty to animals. 16. Vital statistics including registration of births and deaths. 17. Public amenities including street lighting, parking lots, bus stops and public conveniences. 18. Regulation of slaughter houses and tanneries. 4 As an instance, the UDA in Bangalore is the Bangalore Development Authority (BDA) whose website (http://www.bdabangalore.org/) summarizes the planning and development functions of the BDA, which involve the following: * Preparation of development plan for Bangalore. * Preparation of scheme plans. * Approval of development plans for group housing and layouts. * Approval of building plans. * Other statutory functions under Karnataka Town and Country Planning Act of 1961. In addition to the planning functions, the BDA Act envisages the following development functions: * Planning and implementation of schemes to provide for residential, commercial and industrial sites, civic amenity sites, parks and playgrounds. * Construction of commercial complexes. * Construction of houses for economically weaker sections, low, middle and high-income groups. * Development of major infrastructure facilities.
5
potentially financed by these revenues. Next, I ascertain the efficiency of cities and that of the state governments in the provision of public services, given that UDAs are parastatal entities, to examine if the transfer of revenues to cities would be justified from an efficiency perspective. There could, of course, be other grounds for transferring revenues to cities from state agencies, such as equity, accountability and decentralization, which I do not examine in detail here.
4 Gaps in the literature
There is a lengthy literature on the efficiency of local governments as well as on the potential of land as a means of financing revenue. I summarize these streams of literature here and present the gaps at the end of this section.
4.1 Literature on local government efficiency
Studies which examine the efficiency of cities around the world abound. Afonso and Fernandes (2003) measure and analyse the expenditure efficiency of Portuguese local governments using a non-parametric technique for production frontier estimation (known as Free Disposal Hull). They construct an index of municipal performance and compute input and output efficiency scores for 51 Portuguese municipalities located in the Region of Lisbon and Vale do Tejo (RLVT) in order to estimate the extent of municipal spending that seems to be wasted relative to the best-practice frontier. The results of their empirical analysis suggest that RLVT municipalities could achieve, on average, roughly the same level of local output with about 39 per cent fewer resources, i.e. that local performance could be improved without necessarily increasing municipal spending. In Italy, as in other countries, recent legislative reforms aim at increasing the fiscal autonomy of local governments, in order to align spending with funding responsibility and, in this way, to improve both the efficiency and the effectiveness of public services provided to the citizens. Boetti, Piacenza and Turati (2009) assess spending efficiency for Italian municipalities, and investigate–in particular–the effects of fiscal decentralization, considering also the role played by electoral accountability of incumbent politicians. This analysis relies on a sample of 262 Italian municipalities and exploits parametric (SFA) and nonparametric (DEA) frontier techniques to study efficiency performances and their determinants. Consistent with fiscal federalism theories, their preliminary results suggested that more autonomous municipalities exhibit less inefficient spending behaviour. Bossert et al. (2003) investigate the relation between decentralization and equity of resource allocation in Colombia and Chile. Using a ‘decision space’ approach, they compare decentralization of the health systems of Columbia and Chile. Their evidence from Colombia and Chile suggests that decentralization, under certain conditions and with some specific policy mechanisms, can improve the equity of resource allocation. In these countries, they found that equitable levels of per capita financial allocations at the municipal level were achieved through different forms of decentralization—the use of allocation formulae, adequate local funding choices and horizontal equity funds. Findings on equity of utilization of services were less consistent, but they did show that
6
increased levels of funding were associated with increased utilization. This suggests that improved equity of funding over time might reduce inequities of service utilization. Da Motta and Moreira (2009) analyse how political and institutional factors affect the performance of municipalities in improving social welfare in Brazil during 1990-2000. Their model adopts a stochastic production frontier, conditioned by variables related to the costs of provision of services and those that can affect municipal efficiency. Their results indicated that one cannot reject: (1) economies of scale; (2) the effect of vote margin in the municipality and the type of mandate of the elected governor; and (3) that local politics and the existence of sectorial boards did not affect the level of efficiency for municipal spending. Loikkanen, Susiluoto and Funk (2011) study whether Finnish city managers’ characteristics and work environment, in addition to other external factors, explain differences in the cost efficiency of service provision in Finnish municipalities. In this paper, first, Data Envelopment Analysis (DEA) is employed in calculating efficiency scores for municipalities. In DEA the outputs consist of six to ten volume indicators of services in health, social and education sectors. As the combined input, the cost of providing (either producing or buying) these services is used. Next, the DEA efficiency scores are explained with regression models. As external factors, they use variables which characterize the municipality, its location and its population. They found that the ten municipalities ranking highest in efficiency were rather small and located mostly in southern Finland. The biggest cities showed rather varying performance. Their regressions showed that peripheral location, large population and high unemployment reduced efficiency of municipal service provision. Dense urban structure, high education level of inhabitants, big share of middle aged municipal workers, narrow range of services and big share of purchases from the private sector or other municipalities increased efficiency. They found political variables and turnover in local elections did not explain efficiency differences. Holzer et al. (2009), based on their meta-analysis of studies of American municipalities, find that there is an inverted U-shaped relationship between size and efficiency on a general level, with efficiency increasing with population sizes of up to about 25,000, which was stable until about 250,000 population, and declining with population after that. Thus their findings showed that the smallest and largest municipalities were the least efficient. However, the (inverted) U-shaped relationship they found was not the same for all service types. In capital-intensive services such as utility systems or public works, they found that increasing size was related to increased efficiency. For labour-intensive services, such as police services, they found an increase in size was related to a decrease in efficiency−smaller units were more efficient than larger units. They also found that while the literature suggests that cost per capita may not be a good measure of efficiency or performance because of the distorting effect of other factors, studies use this measure commonly due to the absence of data on other measurable indicators. A major gap in the literature summarized above is that there are no studies relating to the efficiency of public service provision in India’s cities, possibly due to the lack of adequate disaggregated municipal data that could throw light on relevant aspects of service provision.
7
4.2 Literature on land leasing and sales
This section summarizes the literature on evidence from using land leasing and sales to finance urban infrastructure provision. Land asset sales are attractive as a way to mobilize investment resources and land leasing and sales have been time tested in other countries. This has been documented in the literature. In the aftermath of Proposition 13, which froze property tax assessments in the state of California, USA, California’s localities turned to land assets as a means of financing infrastructure. Such a phenomenon is not restricted to developed countries alone. The city of Bratislava, Slovakia, financed about 15 per cent of its annual capital budget from privatization proceeds. Deng (2005) points out that in China, it was only in 1988 that the Constitution was amended and in 1990 was the ground lease system formally approved by the central government; the nation-wide adoption of public land leasing started in 1992. The paper finds that without public land leasing, local public goods are completely capitalized in wages. Deng finds that public land leasing is Pareto improving because it eliminates free riding on the consumption of local public goods and establishes the link of rent capitalization. It also helps to shift local government’s role from a production manager to public goods provider. Peterson (2007) presents evidence that many cities in China have financed more than half of their urban infrastructure investment from land leasing, while borrowing against the value of land on their balance sheets to finance much of the remainder. As Chan (1997) points out, most of land leasing revenues were assigned to municipal governments (in the ratio 5:95 (5 per cent to central government and 95 per cent to local government)) as part of the 1994 fiscal reforms. Chreod (2005) points out that several municipalities studied in the World Bank’s City Development Strategies had freed up land for resale in the urban centre by moving their city hall and other related municipal buildings to a new location outside the urban centre and auctioned the vacated land to developers. Hong (1996) found that the Hong Kong Government captured about 39 per cent of the land-value increments occurring between 1970 and 1991 from land leased in the 1970s. More importantly, the captured value financed 55 per cent of the average annual infrastructure investment between 1970 and 1991. The evidence regarding Ethiopia which recently introduced land leasing as a financing device for cities is from Peterson (2007). Except for water tariffs, which some regions allow municipalities to adjust in the light of service costs, land leasing is the only source of revenue over which municipalities have policy control. Ethiopian policy, by specifying that a municipality shall earmark 90 per cent of all land-leasing proceeds for infrastructure investment, ties revenues from land leasing directly to municipal infrastructure investment. Peterson (2007) also presents evidence from India, focusing on land sales and auctions by the Mumbai Metropolitan Regional Development Authority (MMRDA). The startling finding is that sales from MMRDA land auctions in just one complex (Bandra-Kurla complex) in January 2006 was a staggering ₹23 billion, which was two times more than the total infrastructure investment made by the Mumbai Municipal Corporation, during 2004-05 (which was only ₹10.4 billion) and four times more than MMRDA’s own infrastructure investment in 2004-05 which was a mere ₹5.4 billion.
8
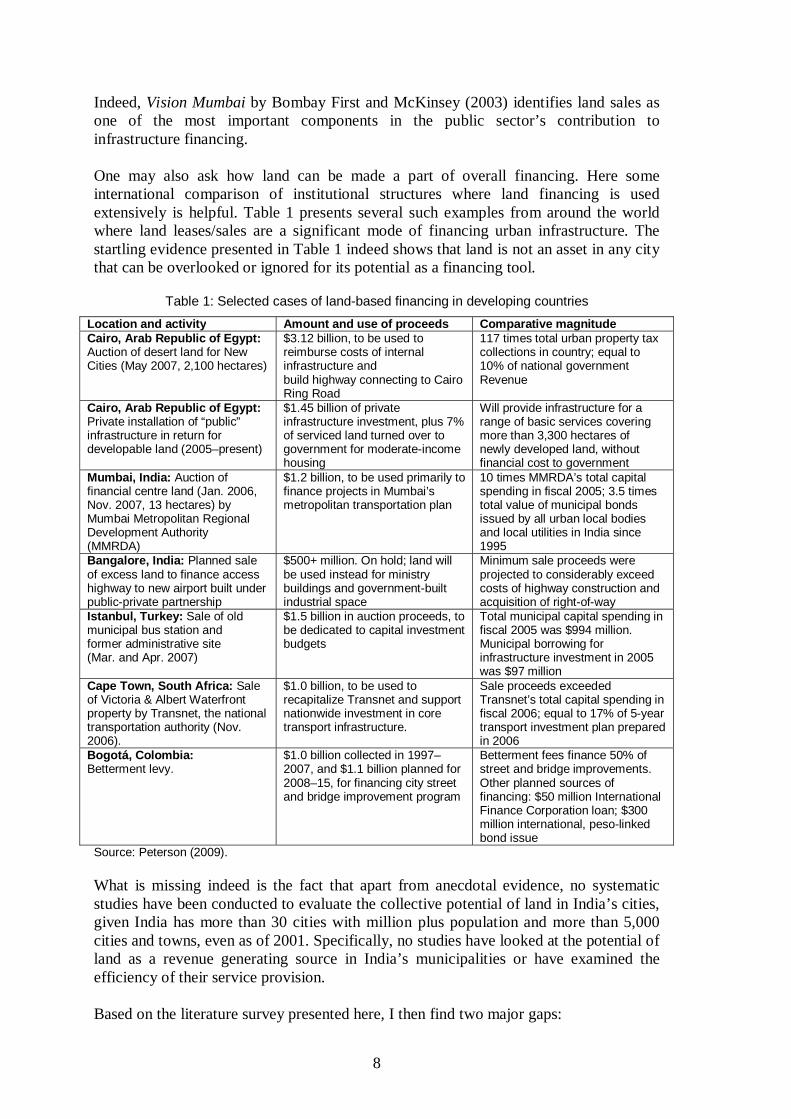
Indeed, Vision Mumbai by Bombay First and McKinsey (2003) identifies land sales as one of the most important components in the public sector’s contribution to infrastructure financing. One may also ask how land can be made a part of overall financing. Here some international comparison of institutional structures where land financing is used extensively is helpful. Table 1 presents several such examples from around the world where land leases/sales are a significant mode of financing urban infrastructure. The startling evidence presented in Table 1 indeed shows that land is not an asset in any city that can be overlooked or ignored for its potential as a financing tool.
Table 1: Selected cases of land-based financing in developing countries
Location and activity Amount and use of proceeds Comparative magnitude Cairo, Arab Republic of Egypt: Auction of desert land for New Cities (May 2007, 2,100 hectares)
$3.12 billion, to be used to reimburse costs of internal infrastructure and build highway connecting to Cairo Ring Road
117 times total urban property tax collections in country; equal to 10% of national government Revenue
Cairo, Arab Republic of Egypt: Private installation of “public” infrastructure in return for developable land (2005–present)
$1.45 billion of private infrastructure investment, plus 7% of serviced land turned over to government for moderate-income housing
Will provide infrastructure for a range of basic services covering more than 3,300 hectares of newly developed land, without financial cost to government
Mumbai, India: Auction of financial centre land (Jan. 2006, Nov. 2007, 13 hectares) by Mumbai Metropolitan Regional Development Authority (MMRDA)
$1.2 billion, to be used primarily to finance projects in Mumbai’s metropolitan transportation plan
10 times MMRDA’s total capital spending in fiscal 2005; 3.5 times total value of municipal bonds issued by all urban local bodies and local utilities in India since 1995
Bangalore, India: Planned sale of excess land to finance access highway to new airport built under public-private partnership
$500+ million. On hold; land will be used instead for ministry buildings and government-built industrial space
Minimum sale proceeds were projected to considerably exceed costs of highway construction and acquisition of right-of-way
Istanbul, Turkey: Sale of old municipal bus station and former administrative site (Mar. and Apr. 2007)
$1.5 billion in auction proceeds, to be dedicated to capital investment budgets
Total municipal capital spending in fiscal 2005 was $994 million. Municipal borrowing for infrastructure investment in 2005 was $97 million
Cape Town, South Africa: Sale of Victoria & Albert Waterfront property by Transnet, the national transportation authority (Nov. 2006).
$1.0 billion, to be used to recapitalize Transnet and support nationwide investment in core transport infrastructure.
Sale proceeds exceeded Transnet’s total capital spending in fiscal 2006; equal to 17% of 5-year transport investment plan prepared in 2006
Bogotá, Colombia: Betterment levy.
$1.0 billion collected in 1997–2007, and $1.1 billion planned for 2008–15, for financing city street and bridge improvement program
Betterment fees finance 50% of street and bridge improvements. Other planned sources of financing: $50 million International Finance Corporation loan; $300 million international, peso-linked bond issue
Source: Peterson (2009). What is missing indeed is the fact that apart from anecdotal evidence, no systematic studies have been conducted to evaluate the collective potential of land in India’s cities, given India has more than 30 cities with million plus population and more than 5,000 cities and towns, even as of 2001. Specifically, no studies have looked at the potential of land as a revenue generating source in India’s municipalities or have examined the efficiency of their service provision. Based on the literature survey presented here, I then find two major gaps:
9
1. There are no credible studies which examine the efficiency of Indian city
governments and that of the Indian states in the provision of public services; 2. No papers examine systematically the role played by innovative sources such as
public land leasing/sales in financing India’s cities, probably due to the lack of centralized data.
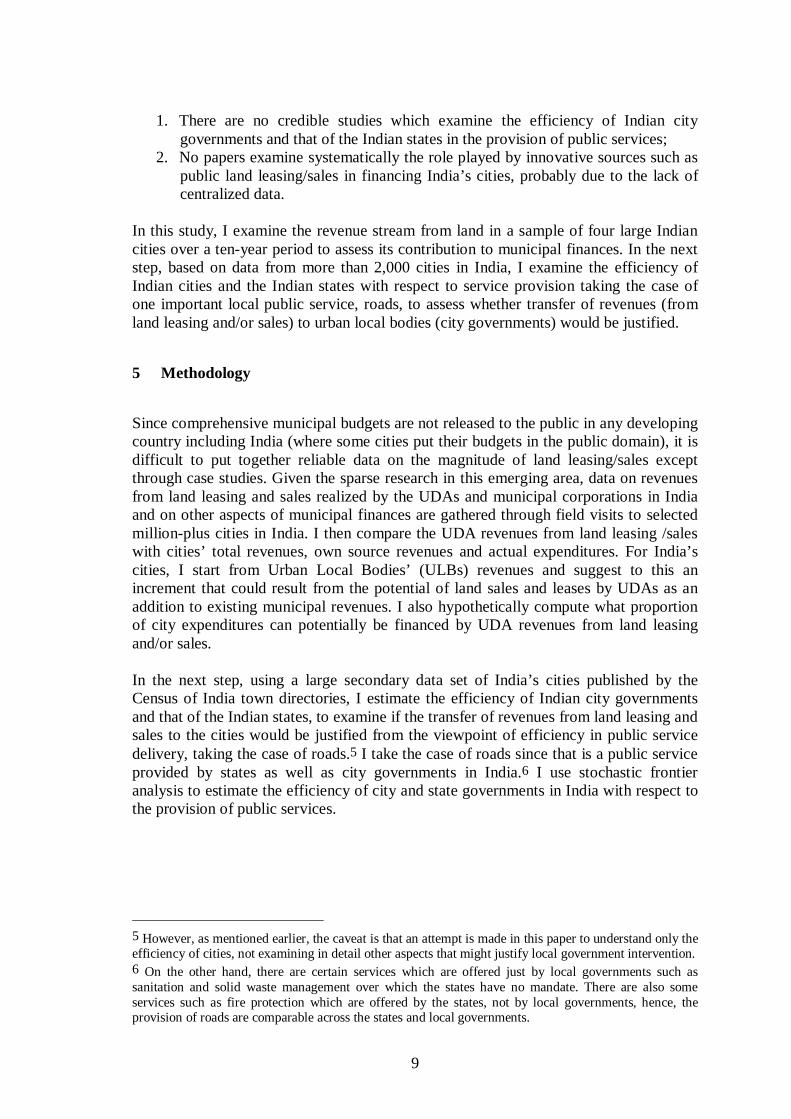
In this study, I examine the revenue stream from land in a sample of four large Indian cities over a ten-year period to assess its contribution to municipal finances. In the next step, based on data from more than 2,000 cities in India, I examine the efficiency of Indian cities and the Indian states with respect to service provision taking the case of one important local public service, roads, to assess whether transfer of revenues (from land leasing and/or sales) to urban local bodies (city governments) would be justified.
5 Methodology
Since comprehensive municipal budgets are not released to the public in any developing country including India (where some cities put their budgets in the public domain), it is difficult to put together reliable data on the magnitude of land leasing/sales except through case studies. Given the sparse research in this emerging area, data on revenues from land leasing and sales realized by the UDAs and municipal corporations in India and on other aspects of municipal finances are gathered through field visits to selected million-plus cities in India. I then compare the UDA revenues from land leasing /sales with cities’ total revenues, own source revenues and actual expenditures. For India’s cities, I start from Urban Local Bodies’ (ULBs) revenues and suggest to this an increment that could result from the potential of land sales and leases by UDAs as an addition to existing municipal revenues. I also hypothetically compute what proportion of city expenditures can potentially be financed by UDA revenues from land leasing and/or sales. In the next step, using a large secondary data set of India’s cities published by the Census of India town directories, I estimate the efficiency of Indian city governments and that of the Indian states, to examine if the transfer of revenues from land leasing and sales to the cities would be justified from the viewpoint of efficiency in public service delivery, taking the case of roads.5 I take the case of roads since that is a public service provided by states as well as city governments in India.6 I use stochastic frontier analysis to estimate the efficiency of city and state governments in India with respect to the provision of public services.
5 However, as mentioned earlier, the caveat is that an attempt is made in this paper to understand only the efficiency of cities, not examining in detail other aspects that might justify local government intervention. 6 On the other hand, there are certain services which are offered just by local governments such as sanitation and solid waste management over which the states have no mandate. There are also some services such as fire protection which are offered by the states, not by local governments, hence, the provision of roads are comparable across the states and local governments.
10
5.1 Stochastic frontier analysis (SFA)
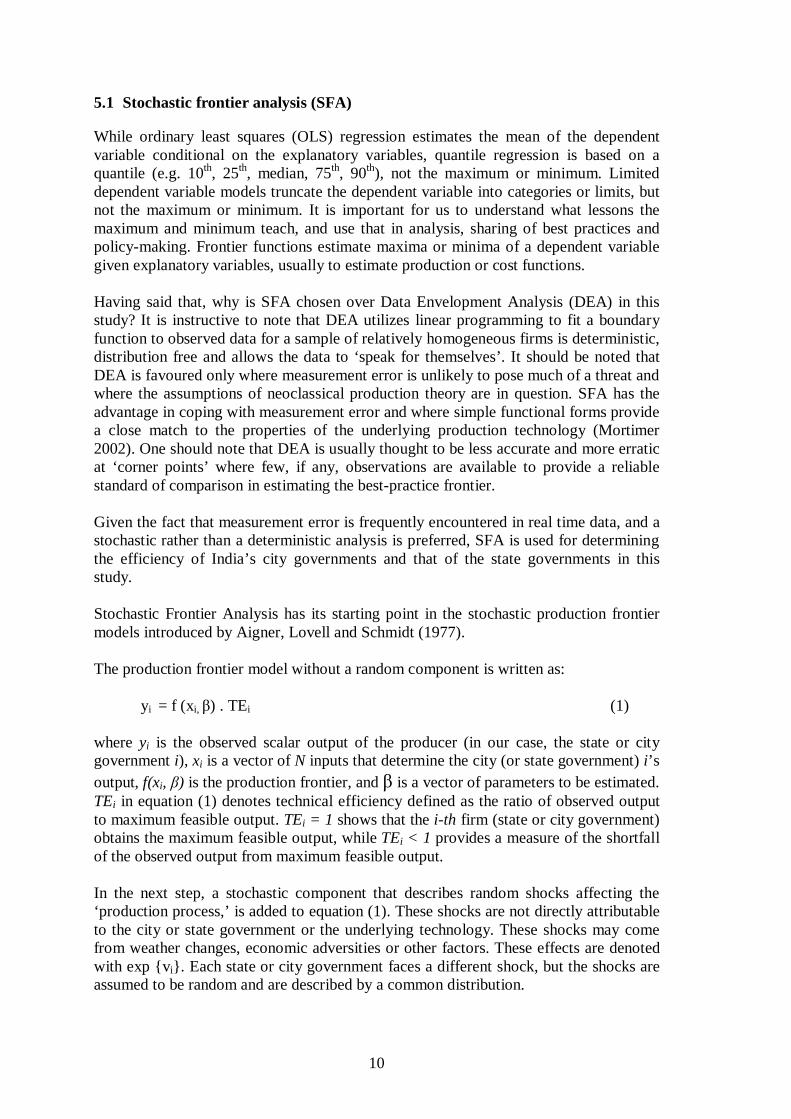
While ordinary least squares (OLS) regression estimates the mean of the dependent variable conditional on the explanatory variables, quantile regression is based on a quantile (e.g. 10th, 25th, median, 75th, 90th), not the maximum or minimum. Limited dependent variable models truncate the dependent variable into categories or limits, but not the maximum or minimum. It is important for us to understand what lessons the maximum and minimum teach, and use that in analysis, sharing of best practices and policy-making. Frontier functions estimate maxima or minima of a dependent variable given explanatory variables, usually to estimate production or cost functions. Having said that, why is SFA chosen over Data Envelopment Analysis (DEA) in this study? It is instructive to note that DEA utilizes linear programming to fit a boundary function to observed data for a sample of relatively homogeneous firms is deterministic, distribution free and allows the data to ‘speak for themselves’. It should be noted that DEA is favoured only where measurement error is unlikely to pose much of a threat and where the assumptions of neoclassical production theory are in question. SFA has the advantage in coping with measurement error and where simple functional forms provide a close match to the properties of the underlying production technology (Mortimer 2002). One should note that DEA is usually thought to be less accurate and more erratic at ‘corner points’ where few, if any, observations are available to provide a reliable standard of comparison in estimating the best-practice frontier. Given the fact that measurement error is frequently encountered in real time data, and a stochastic rather than a deterministic analysis is preferred, SFA is used for determining the efficiency of India’s city governments and that of the state governments in this study. Stochastic Frontier Analysis has its starting point in the stochastic production frontier models introduced by Aigner, Lovell and Schmidt (1977). The production frontier model without a random component is written as:
yi = f (xi, β) . TEi (1) where yi is the observed scalar output of the producer (in our case, the state or city government i), xi is a vector of N inputs that determine the city (or state government) i’s output, f(xi, β) is the production frontier, and β is a vector of parameters to be estimated. TEi in equation (1) denotes technical efficiency defined as the ratio of observed output to maximum feasible output. TEi = 1 shows that the i-th firm (state or city government) obtains the maximum feasible output, while TEi < 1 provides a measure of the shortfall of the observed output from maximum feasible output. In the next step, a stochastic component that describes random shocks affecting the ‘production process,’ is added to equation (1). These shocks are not directly attributable to the city or state government or the underlying technology. These shocks may come from weather changes, economic adversities or other factors. These effects are denoted with exp {vi}. Each state or city government faces a different shock, but the shocks are assumed to be random and are described by a common distribution.
11
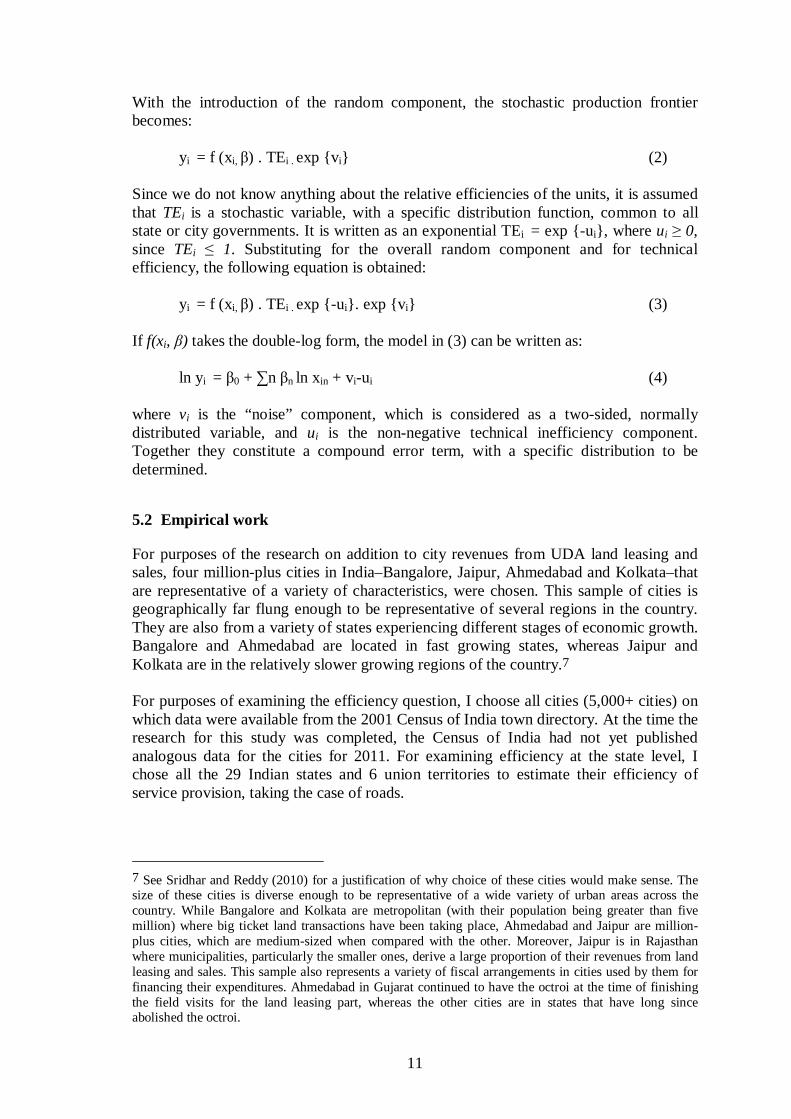
With the introduction of the random component, the stochastic production frontier becomes:
yi = f (xi, β) . TEi . exp {vi} (2) Since we do not know anything about the relative efficiencies of the units, it is assumed that TEi is a stochastic variable, with a specific distribution function, common to all state or city governments. It is written as an exponential TEi = exp {-ui}, where ui ≥ 0, since TEi ≤ 1. Substituting for the overall random component and for technical efficiency, the following equation is obtained:
yi = f (xi, β) . TEi . exp {-ui}. exp {vi} (3) If f(xi, β) takes the double-log form, the model in (3) can be written as:
ln yi = β0 + ∑n βn ln xin + vi-ui (4)
where vi is the “noise” component, which is considered as a two-sided, normally distributed variable, and ui is the non-negative technical inefficiency component. Together they constitute a compound error term, with a specific distribution to be determined.
5.2 Empirical work
For purposes of the research on addition to city revenues from UDA land leasing and sales, four million-plus cities in India–Bangalore, Jaipur, Ahmedabad and Kolkata–that are representative of a variety of characteristics, were chosen. This sample of cities is geographically far flung enough to be representative of several regions in the country. They are also from a variety of states experiencing different stages of economic growth. Bangalore and Ahmedabad are located in fast growing states, whereas Jaipur and Kolkata are in the relatively slower growing regions of the country.7 For purposes of examining the efficiency question, I choose all cities (5,000+ cities) on which data were available from the 2001 Census of India town directory. At the time the research for this study was completed, the Census of India had not yet published analogous data for the cities for 2011. For examining efficiency at the state level, I chose all the 29 Indian states and 6 union territories to estimate their efficiency of service provision, taking the case of roads.
7 See Sridhar and Reddy (2010) for a justification of why choice of these cities would make sense. The size of these cities is diverse enough to be representative of a wide variety of urban areas across the country. While Bangalore and Kolkata are metropolitan (with their population being greater than five million) where big ticket land transactions have been taking place, Ahmedabad and Jaipur are million-plus cities, which are medium-sized when compared with the other. Moreover, Jaipur is in Rajasthan where municipalities, particularly the smaller ones, derive a large proportion of their revenues from land leasing and sales. This sample also represents a variety of fiscal arrangements in cities used by them for financing their expenditures. Ahmedabad in Gujarat continued to have the octroi at the time of finishing the field visits for the land leasing part, whereas the other cities are in states that have long since abolished the octroi.
12
6 Public land leasing and sales as a source of revenue: Findings from selected Indian cities
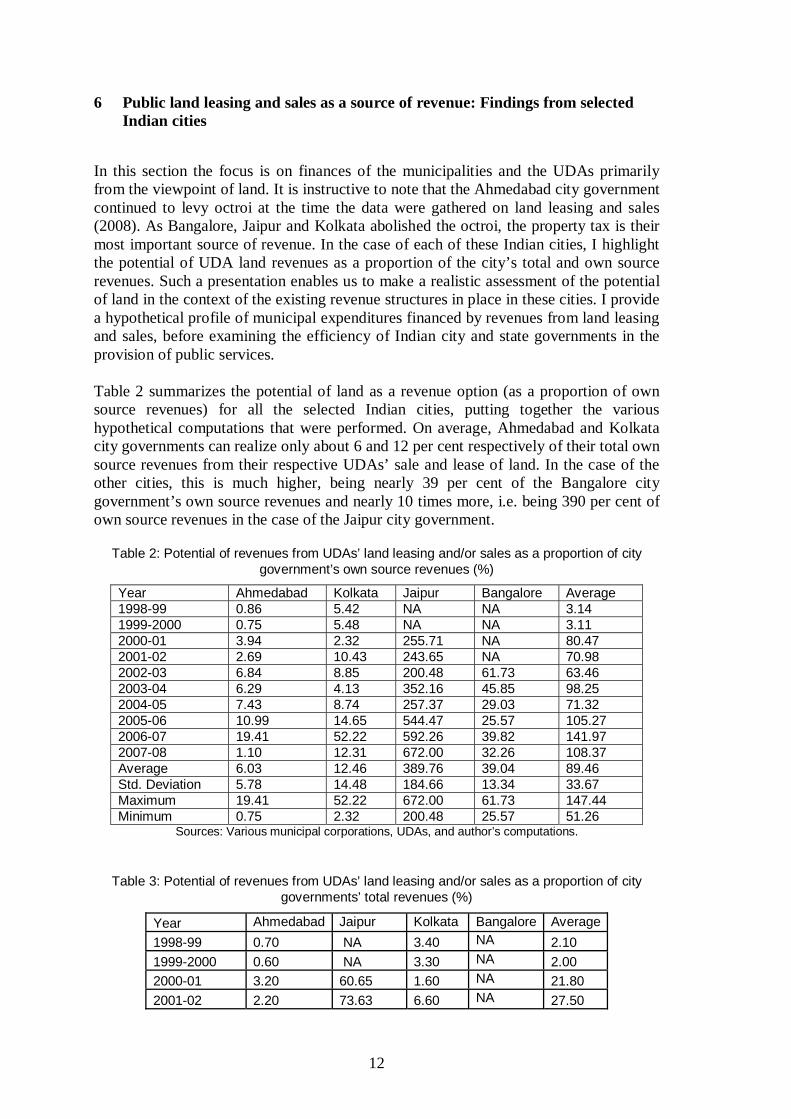
In this section the focus is on finances of the municipalities and the UDAs primarily from the viewpoint of land. It is instructive to note that the Ahmedabad city government continued to levy octroi at the time the data were gathered on land leasing and sales (2008). As Bangalore, Jaipur and Kolkata abolished the octroi, the property tax is their most important source of revenue. In the case of each of these Indian cities, I highlight the potential of UDA land revenues as a proportion of the city’s total and own source revenues. Such a presentation enables us to make a realistic assessment of the potential of land in the context of the existing revenue structures in place in these cities. I provide a hypothetical profile of municipal expenditures financed by revenues from land leasing and sales, before examining the efficiency of Indian city and state governments in the provision of public services. Table 2 summarizes the potential of land as a revenue option (as a proportion of own source revenues) for all the selected Indian cities, putting together the various hypothetical computations that were performed. On average, Ahmedabad and Kolkata city governments can realize only about 6 and 12 per cent respectively of their total own source revenues from their respective UDAs’ sale and lease of land. In the case of the other cities, this is much higher, being nearly 39 per cent of the Bangalore city government’s own source revenues and nearly 10 times more, i.e. being 390 per cent of own source revenues in the case of the Jaipur city government.
Table 2: Potential of revenues from UDAs’ land leasing and/or sales as a proportion of city government’s own source revenues (%)
Year Ahmedabad Kolkata Jaipur Bangalore Average 1998-99 0.86 5.42 NA NA 3.14 1999-2000 0.75 5.48 NA NA 3.11 2000-01 3.94 2.32 255.71 NA 80.47 2001-02 2.69 10.43 243.65 NA 70.98 2002-03 6.84 8.85 200.48 61.73 63.46 2003-04 6.29 4.13 352.16 45.85 98.25 2004-05 7.43 8.74 257.37 29.03 71.32 2005-06 10.99 14.65 544.47 25.57 105.27 2006-07 19.41 52.22 592.26 39.82 141.97 2007-08 1.10 12.31 672.00 32.26 108.37 Average 6.03 12.46 389.76 39.04 89.46 Std. Deviation 5.78 14.48 184.66 13.34 33.67 Maximum 19.41 52.22 672.00 61.73 147.44 Minimum 0.75 2.32 200.48 25.57 51.26
Sources: Various municipal corporations, UDAs, and author’s computations.
Table 3: Potential of revenues from UDAs’ land leasing and/or sales as a proportion of city governments’ total revenues (%)
Year Ahmedabad Jaipur Kolkata Bangalore Average 1998-99 0.70 NA 3.40 NA 2.10 1999-2000 0.60 NA 3.30 NA 2.00 2000-01 3.20 60.65 1.60 NA 21.80 2001-02 2.20 73.63 6.60 NA 27.50
Sources: Various municipal corporations, UDAs, and author’s computations. Table 3 summarizes the contribution of UDAs’ land leasing and sales to municipal corporations’ (city governments’) total revenues for the four cities. Jaipur is the one with above average additions to total revenues, with Bangalore coming out second. On average, taking all cities into account, revenue from land lease and/or sale by UDAs accounts for nearly 90 per cent of existing own source revenues of municipal corporations (Table 2), and 33 per cent of their total revenues (Table 3). Next, the structure of own source revenues of the city governments was examined. Table 4 summarizes per capita municipal own source revenues in the selected cities. The table shows that from a self-reliance perspective, Ahmedabad is the richest city government of all, followed by Bangalore and Kolkata. The poorest is Jaipur, which explains its success with land leasing and sales. Tables 5 and 6 summarize respectively the per capita revenues in each of the municipal corporations and UDAs from land leasing and sales, which are a direct outcome of the institutional arrangements for land use in the cities versus the UDAs.
Table 4: Per capita own source revenues, city governments (₹)
Year Ahmedabad Kolkata Jaipur Bangalore 1998-99 1404.98 787.02 NA NA 1999-2000 1641.04 933.49 NA NA 2000-01 1598.21 1451.66 154.77 NA 2001-02 1564.22 1114.83 187.40 NA 2002-03 1679.74 1422.82 195.71 1393.38 2003-04 1846.82 2623.50 128.71 1816.44 2004-05 2114.97 1708.23 156.07 2235.36 2005-06 2317.43 1736.94 250.27 1784.71 2006-07 3010.23 1803.82 401.23 1955.23 2007-08 3322.13 2234.69 315.11 2398.51 Average 2,049.98 1,581.70 223.66 1,930.60 Maximum 3,322.13 2,623.50 401.23 2398.51 Minimum 1,404.98 787.02 128.71 1393.38 Std.Dev 651.31 568.92 93.37 356.47
Sources: Various municipal corporations and author’s computations.
Table 5: Per capita revenues from municipal corporations’ land leasing and/or sales (₹)
Year Ahmedabad Kolkata Jaipur Bangalore 1998-99 0.24 0.08 NA NA 1999-2000 2.38 0.91 NA NA
Sources: Various UDAs and author’s computations. As Table 5 shows, while city governments’ revenues from land leasing and sales are low compared with that for the UDAs (Table 6) (recall the ‘public purposes’ to which city governments have to use their land primarily for), the clear winner, even when the municipality’s revenues from land leasing and sales are examined, is Jaipur, which earns nearly ₹30 per capita from land leasing and sales, on average, followed by Ahmedabad (at INF12 per capita), with Kolkata and Bangalore trailing, as far as average per capita municipal revenues from land leasing and sales are concerned. Table 6, which summarizes UDAs’ per capita revenues from land leasing and sales, confirms that revenues from land leasing and sales for UDAs are much higher than they are for city governments. Per capita revenues are the highest in Jaipur followed by Bangalore, with Kolkata and Ahmedabad trailing. Summarizing, our findings based on municipality revenues and UDA revenues from land leasing and sales suggest two groups of cities: one set which is able to capitalize on land for raising revenues (Jaipur and Bangalore) and the other which is unable to do so (Kolkata and Ahmedabad). These city types are representative of many one finds in the country, some of which are capitalizing on land value increases, and some of which are unable to lease or sell land, due to various constraints.
6.1 Making sense of the discrepancies across cities in the potential of land
A systematic investigation was performed of the causes of these discrepancies across cities in terms of the potential of land as a revenue generating source. One reason could be the institutional arrangements for land use in the cities. For instance, in the case of Kolkata, it was found that the funds transferred by developers into the UDA (KMDA’s) escrow account are not taken into account in the UDA revenues from land leasing and sales there. This could be one reason why Kolkata comes a distant third in terms of KMDA’s contribution to the municipality (KMC’s) revenues. In the case of Ahmedabad (AUDA), its inability to make money out of land leasing and sales seems to arise due to constraints imposed on it by the Gujarat Town Planning Act which specifies reservation to the extent of 10 per cent of land for providing housing to the socially and
16
economically weaker sections, 15 per cent for roads, 5 per cent for parks, playgrounds and open space, 5 per cent for social infrastructure such as schools, dispensaries, fire brigade, and only 15 per cent for sale by the authority for residential, commercial or industrial use depending on the nature of development. In the case of Jaipur, it is worth noting that the sale of land is an important source of non–tax income for municipalities in Rajasthan, particularly for the smaller municipalities. According to the report of Rajasthan’s First State Finance Commission, sale of lands accounts for, in the aggregate, 8–9 per cent of the total income of municipalities, and it could be as high as 15–16 per cent of the income of smaller municipalities. For city governments (municipal corporations), however, land sales are not an important source of income on account of their limited jurisdiction over lands and other land–related assets, as one observes in the case of Jaipur. In all municipal corporations, Urban Improvement Trusts (UITs) hold the statutory responsibility for matters relating to lands. Thus in the case of Rajasthan, the poor financial position of the city governments, and the lack of an adequate tax base (due to the abolition of octroi in 1998) has led to attempts on the part of municipalities to improve their other sources of income. Land lease and sales are the most important of these. Another reason why the impact is huge in Jaipur is because the city government’s own source revenues are quite low, compared with the UDA’s revenues from land leasing and sales. However, in contrast, the revenues of Ahmedabad and the Kolkata city governments are huge compared to those from the respective UDA revenues from land leasing and sales. Hence the impact of the additional revenues from UDAs in Ahmedabad and Kolkata is muted. In the case of Jaipur, while the revenues from its UDA (JDA) have been fairly stable, there is substantial variability in the revenues of the Jaipur city government, hence there is variability in the proportion UDA revenues account for out of the city’s revenues. In the case of Bangalore, corner sites are sold off by the UDA (the BDA) through auction which yields revenues much higher than the price at which plots are sold in Ahmedabad by the UDA. This explains Bangalore’s relatively higher revenues from land lease compared with that in Ahmedabad. In the case of Bangalore the city government thus far has not used land as a revenue generating source, except for charitable purposes. But the UDA there has been relatively more prolific in its use of land for revenue generation. Summarizing the reasons for the discrepancies found across the Indian cities with respect to the ability of land lease and sales as a revenue generating mechanism, one answer lies in the institutional arrangements for land use and the mechanisms used to transfer the revenues from the developers to the UDAs. Another reason could be the relative financial strength of the city government vis-à-vis that of the UDA. Yet another reason could be the land disposal process itself–usually auctioned off plots or sites are sold at a premium when compared to other sites. The next section makes an attempt to answer the second question which was raised in this study which is, to understand the expenditure patterns of the city governments based on revenues from the UDAs.
17
6.2 Hypothetical computation of city expenditures
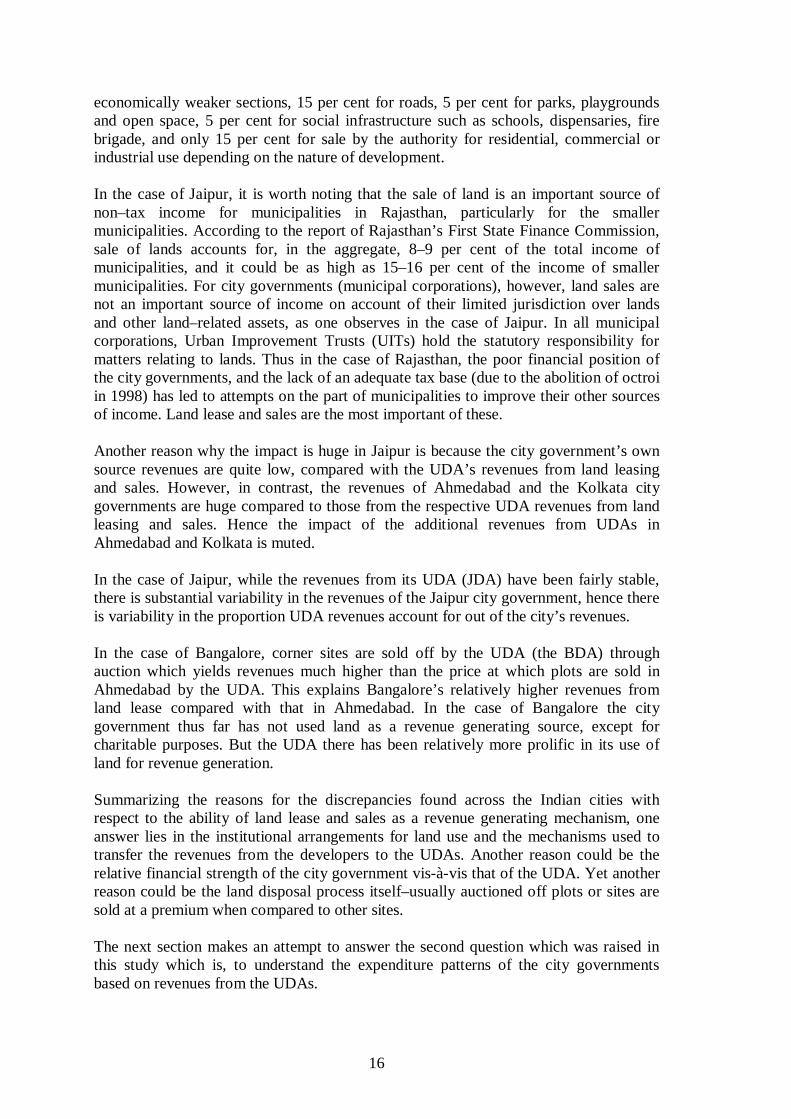
It was found that most of the revenues of the UDAs are spent on capital projects, hence the resources from land leasing and sales are being used for developing infrastructure of some sort. The discussions during field visits also confirmed that there is enough local autonomy, at least on paper, for spending limited resources (i.e. funds up to a ceiling) as seen by the existence of local representatives on committees appointed to approve spending decisions. Table 7 summarizes what proportion of the capital expenditure, in each of the cities, revenues from land leasing and sales in each city’s UDA can be expected to finance.
Table 7: Hypothetical proportion of city capital expenditures financed by UDA revenues from land leasing and sales (%)
Year Ahmedabad Kolkata Jaipur Bangalore Average, all cities
1998-99 5.05 62.68 NA 18.00 28.58
1999-2000 2.21 54.82 NA 22.45 26.49
2000-01 16.27 38.25 193.96 21.92 67.60
2001-02 8.90 306.26 194.18 120.27 157.40
2002-03 30.61 132.69 189.72 144.17 124.30
2003-04 17.84 35.74 257.90 141.92 113.35
2004-05 31.52 30.94 207.12 90.48 90.02
2005-06 54.52 45.97 441.32 54.07 148.97
2006-07 64.36 120.05 730.09 65.02 244.88
2007-08 3.03 23.75 382.76 NA 136.51
Average 23.43 85.12 324.63 75.37 113.81
Maximum 64.36 306.26 730.09 144.17 244.88
Minimum 2.21 23.75 189.72 18.00 26.49
Std.Deviation 21.75 86.07 189.72 51.13 65.43 Sources: city corporations, UDAs and author’s computations.
On average, if UDA revenues from land leasing and sales were to be transferred to cities, they can expect to finance more than 100 per cent (in some cases more than 200 per cent) of the cities’ capital expenditures. So it is clear that UDA revenues from land leasing and sales are a very promising way of financing much needed city capital expenditures in Indian cities. However, the issue of contention is one of examining the efficiency of city governments and that of the state governments in the provision of public services, should UDA revenues be transferred to them. This is the issue to which I turn in the next section.
7 Efficiency of Indian cities and states
As described earlier, one aspect of the transfer of revenues from UDAs to city governments, i.e. efficiency, was examined. In order to understand whether cities are more efficient (rather than UDAs which are parastatal entities, or agencies of the state), and whether the transfers of revenues from land leasing and sales to the cities from the
18
UDAs would be at all efficient from a public service delivery viewpoint, stochastic frontier models were estimated separately for the Indian cities and states. For purposes of modelling, I narrowed the scope of the analysis to a specific indicator of a public service, namely provision of roads, since they are required to be provided both by local governments and the states.8
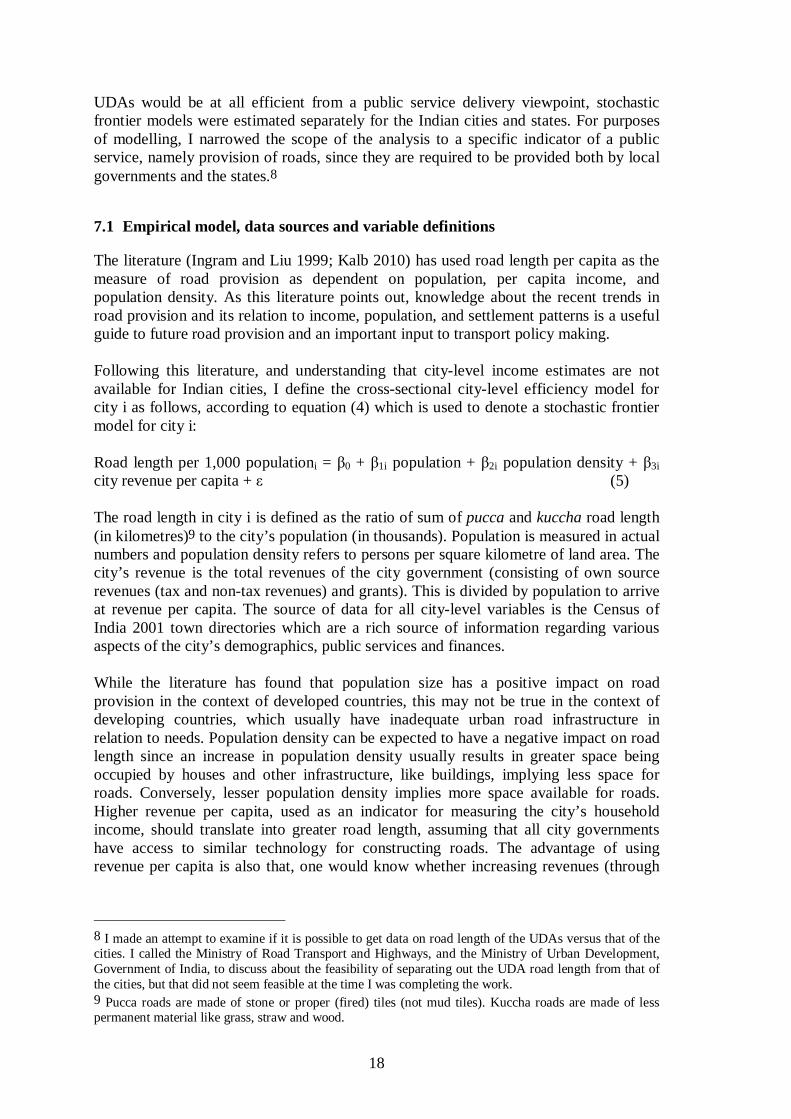
7.1 Empirical model, data sources and variable definitions
The literature (Ingram and Liu 1999; Kalb 2010) has used road length per capita as the measure of road provision as dependent on population, per capita income, and population density. As this literature points out, knowledge about the recent trends in road provision and its relation to income, population, and settlement patterns is a useful guide to future road provision and an important input to transport policy making. Following this literature, and understanding that city-level income estimates are not available for Indian cities, I define the cross-sectional city-level efficiency model for city i as follows, according to equation (4) which is used to denote a stochastic frontier model for city i: Road length per 1,000 populationi = β0 + β1i population + β2i population density + β3i city revenue per capita + ε (5) The road length in city i is defined as the ratio of sum of pucca and kuccha road length (in kilometres)9 to the city’s population (in thousands). Population is measured in actual numbers and population density refers to persons per square kilometre of land area. The city’s revenue is the total revenues of the city government (consisting of own source revenues (tax and non-tax revenues) and grants). This is divided by population to arrive at revenue per capita. The source of data for all city-level variables is the Census of India 2001 town directories which are a rich source of information regarding various aspects of the city’s demographics, public services and finances. While the literature has found that population size has a positive impact on road provision in the context of developed countries, this may not be true in the context of developing countries, which usually have inadequate urban road infrastructure in relation to needs. Population density can be expected to have a negative impact on road length since an increase in population density usually results in greater space being occupied by houses and other infrastructure, like buildings, implying less space for roads. Conversely, lesser population density implies more space available for roads. Higher revenue per capita, used as an indicator for measuring the city’s household income, should translate into greater road length, assuming that all city governments have access to similar technology for constructing roads. The advantage of using revenue per capita is also that, one would know whether increasing revenues (through
8 I made an attempt to examine if it is possible to get data on road length of the UDAs versus that of the cities. I called the Ministry of Road Transport and Highways, and the Ministry of Urban Development, Government of India, to discuss about the feasibility of separating out the UDA road length from that of the cities, but that did not seem feasible at the time I was completing the work. 9 Pucca roads are made of stone or proper (fired) tiles (not mud tiles). Kuccha roads are made of less permanent material like grass, straw and wood.
19
land leasing and sales from the UDAs) would increase the efficiency of road provision by cities. The state-level cross-sectional model for technical efficiency is specified as follows, following the literature, and consistent with the city-level efficiency model:
Road length per 1,000 populationj = α0 + α 1j population + α 2j population density + α 3j state income per capita + ε (6)
The road length, population and population density at the state level (states are denoted by j in equation (6)) are defined in the same way as they are in the case of cities. Data on road length, population and population density for the states are from the Ministry of Road Transport and Highways, Government of India.10 The state income per capita is measured by the net state domestic product per capita (in constant 1999-2000 prices), and is obtained from the national accounts division of India’s Central Statistical Organization (CSO).11
8 Findings
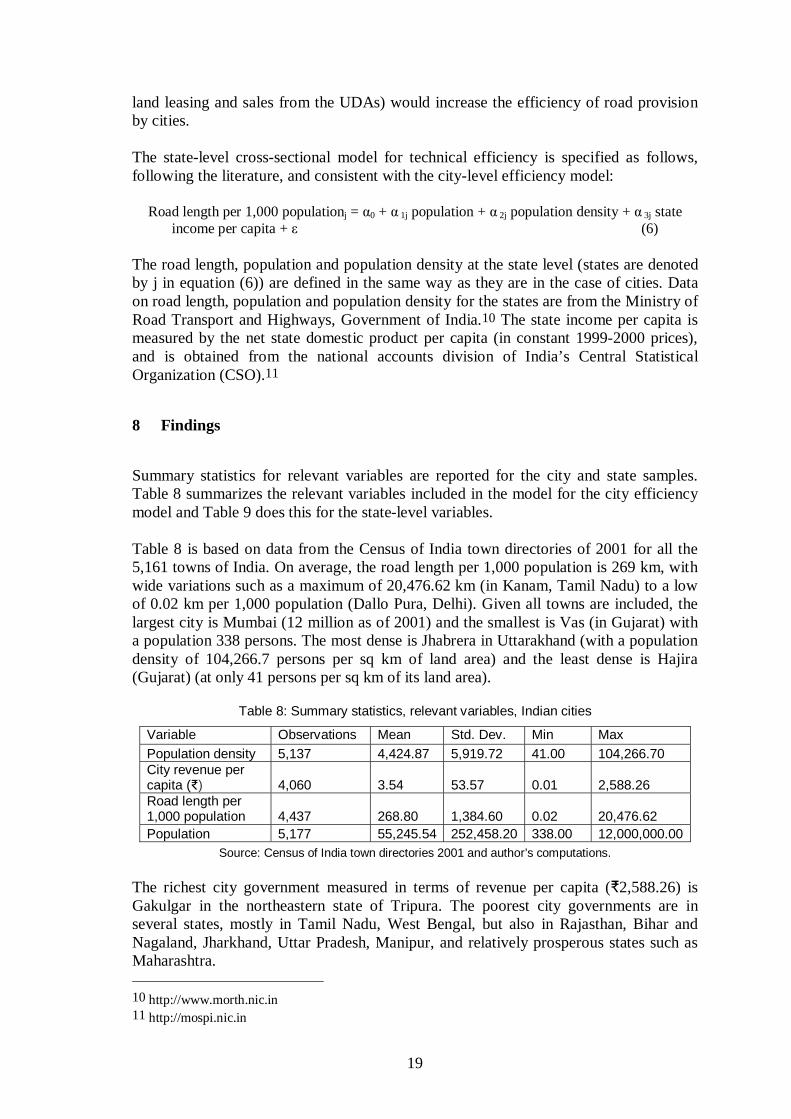
Summary statistics for relevant variables are reported for the city and state samples. Table 8 summarizes the relevant variables included in the model for the city efficiency model and Table 9 does this for the state-level variables. Table 8 is based on data from the Census of India town directories of 2001 for all the 5,161 towns of India. On average, the road length per 1,000 population is 269 km, with wide variations such as a maximum of 20,476.62 km (in Kanam, Tamil Nadu) to a low of 0.02 km per 1,000 population (Dallo Pura, Delhi). Given all towns are included, the largest city is Mumbai (12 million as of 2001) and the smallest is Vas (in Gujarat) with a population 338 persons. The most dense is Jhabrera in Uttarakhand (with a population density of 104,266.7 persons per sq km of land area) and the least dense is Hajira (Gujarat) (at only 41 persons per sq km of its land area).
Table 8: Summary statistics, relevant variables, Indian cities
Variable Observations Mean Std. Dev. Min Max Population density 5,137 4,424.87 5,919.72 41.00 104,266.70 City revenue per capita (₹) 4,060 3.54 53.57 0.01 2,588.26 Road length per 1,000 population 4,437 268.80 1,384.60 0.02 20,476.62 Population 5,177 55,245.54 252,458.20 338.00 12,000,000.00
Source: Census of India town directories 2001 and author’s computations. The richest city government measured in terms of revenue per capita (₹2,588.26) is Gakulgar in the northeastern state of Tripura. The poorest city governments are in several states, mostly in Tamil Nadu, West Bengal, but also in Rajasthan, Bihar and Nagaland, Jharkhand, Uttar Pradesh, Manipur, and relatively prosperous states such as Maharashtra. 10 http://www.morth.nic.in 11 http://mospi.nic.in
20
Table 9 summarizes the relevant efficiency variables at the state level used in the state model specified in equation (6). The roads, population and population density are based on data from the Ministry of Road Transport and Highways for 2001 for all the 29 states and 6 union territories in the country. Although more recent data are available for the state roads, in order to compare them with the municipal roads (whose data are for 2001), 2001 data are used for the state roads. On average, the road length per 1,000 population at the state level is only 3.83 km, compared with nearly an average of 269 km (per 1,000 population) for the cities (Table 8). One observes the low coverage of population with state roads because state roads include rural areas as well, where the road density is lower than in the urban areas. Cities on the other hand have relatively higher coverage with roads. The maximum road coverage of population is in Arunachal Pradesh (at 16.72 km of road per 1,000 population). The state with least coverage of roads is Jharkhand (at 0.37 km of roads per 1,000 population). Uttar Pradesh is the most populous state (with a population of 166 million as of 2001) and the smallest is Sikkim, a northeastern state (with a population of 540,891). The most dense state is Delhi (at 9,339 persons per sq km of land area) and the least dense is Arunachal Pradesh, which is one reason explaining the high coverage of its population with roads. If one were to examine net state domestic product (at constant 1999-2000 prices), the richest state (with a per capita NSDP of ₹48,292) is the union territory, Chandigarh, which is the capital of both Punjab and Haryana, two high-income states. The poorest state is Bihar as of 2001 (at a per capita net state domestic product of ₹6,554) (in constant 1999-2000 prices).
Table 9: Summary statistics, relevant variables, Indian states
Variable Obs. Mean Std. Dev. Min Max Population density 30 865.51 2130.26 13.11 9339.52 Per capita net state domestic product (₹ in constant 1999-2000 prices) 32 18,831.81 9,512.57 6,554 48,292 Road length per 1,000 population 30 3.83 3.22 0.37 16.72 Population 32 34,200,000 38,400,000 540,851 166,000,000 Source: Central Statistical Organization (for NSDP), Ministry of Road Transport and Highways for road
length and population and author’s computations. State highways are also included.
Table 10: Maximum likelihood estimates of Stochastic Frontier Analysis, India’s cities
Variable Coefficient Standard error z P>z Log of population -0.31 0.03 -9.35 0.00 Log of population density
0.0000. Observations=3,547. Source: Census of India town directories 2001 and author’s computations.
21
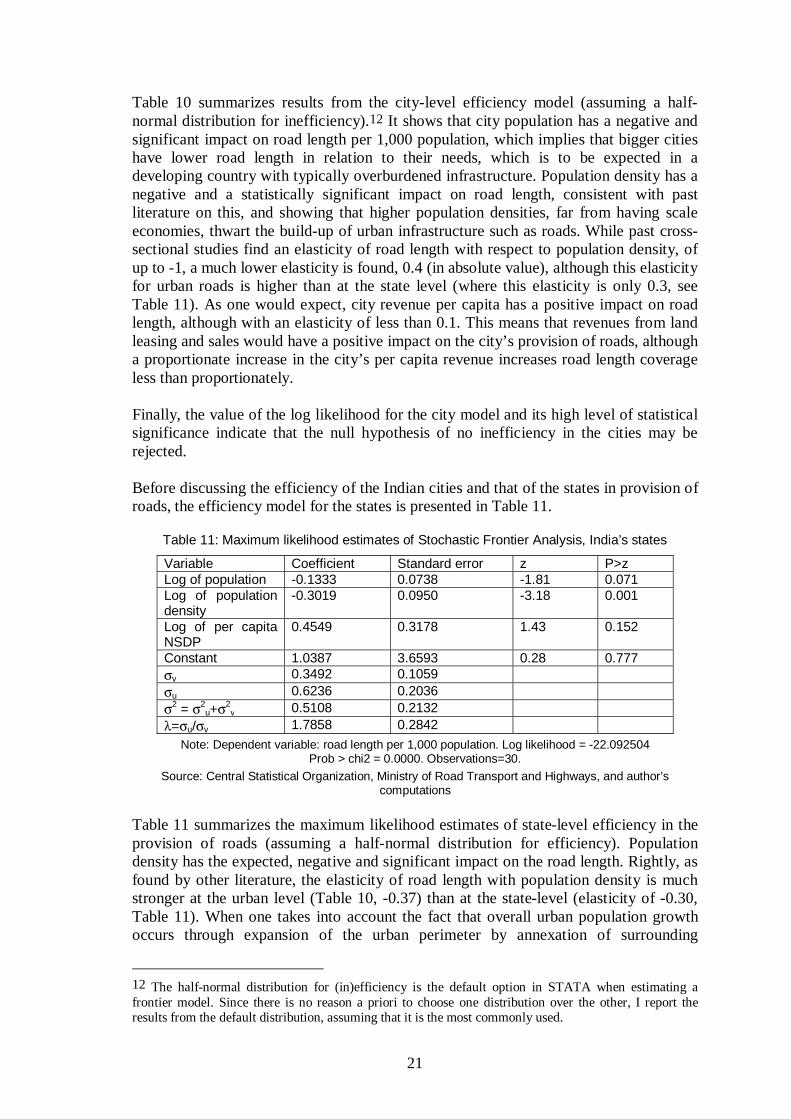
Table 10 summarizes results from the city-level efficiency model (assuming a half-normal distribution for inefficiency).12 It shows that city population has a negative and significant impact on road length per 1,000 population, which implies that bigger cities have lower road length in relation to their needs, which is to be expected in a developing country with typically overburdened infrastructure. Population density has a negative and a statistically significant impact on road length, consistent with past literature on this, and showing that higher population densities, far from having scale economies, thwart the build-up of urban infrastructure such as roads. While past cross-sectional studies find an elasticity of road length with respect to population density, of up to -1, a much lower elasticity is found, 0.4 (in absolute value), although this elasticity for urban roads is higher than at the state level (where this elasticity is only 0.3, see Table 11). As one would expect, city revenue per capita has a positive impact on road length, although with an elasticity of less than 0.1. This means that revenues from land leasing and sales would have a positive impact on the city’s provision of roads, although a proportionate increase in the city’s per capita revenue increases road length coverage less than proportionately. Finally, the value of the log likelihood for the city model and its high level of statistical significance indicate that the null hypothesis of no inefficiency in the cities may be rejected. Before discussing the efficiency of the Indian cities and that of the states in provision of roads, the efficiency model for the states is presented in Table 11.
Table 11: Maximum likelihood estimates of Stochastic Frontier Analysis, India’s states
Variable Coefficient Standard error z P>z Log of population -0.1333 0.0738 -1.81 0.071 Log of population density
Prob > chi2 = 0.0000. Observations=30. Source: Central Statistical Organization, Ministry of Road Transport and Highways, and author’s
computations Table 11 summarizes the maximum likelihood estimates of state-level efficiency in the provision of roads (assuming a half-normal distribution for efficiency). Population density has the expected, negative and significant impact on the road length. Rightly, as found by other literature, the elasticity of road length with population density is much stronger at the urban level (Table 10, -0.37) than at the state-level (elasticity of -0.30, Table 11). When one takes into account the fact that overall urban population growth occurs through expansion of the urban perimeter by annexation of surrounding
12 The half-normal distribution for (in)efficiency is the default option in STATA when estimating a frontier model. Since there is no reason a priori to choose one distribution over the other, I report the results from the default distribution, assuming that it is the most commonly used.
22
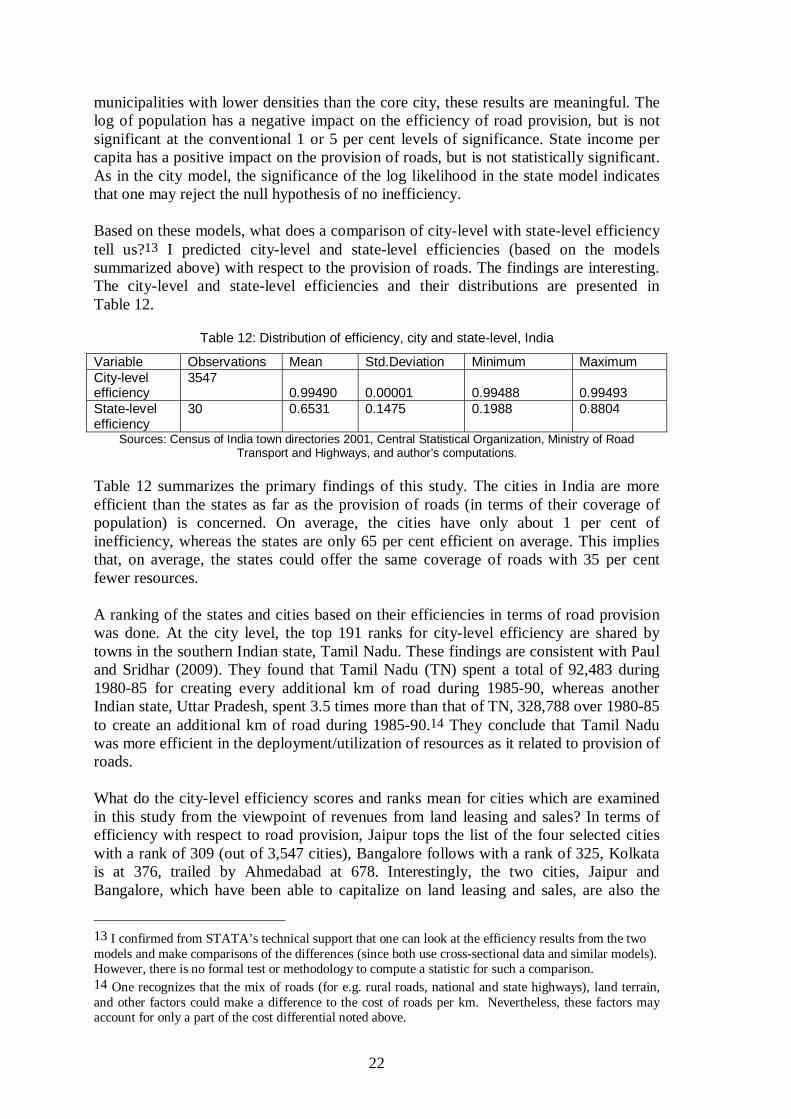
municipalities with lower densities than the core city, these results are meaningful. The log of population has a negative impact on the efficiency of road provision, but is not significant at the conventional 1 or 5 per cent levels of significance. State income per capita has a positive impact on the provision of roads, but is not statistically significant. As in the city model, the significance of the log likelihood in the state model indicates that one may reject the null hypothesis of no inefficiency. Based on these models, what does a comparison of city-level with state-level efficiency tell us?13 I predicted city-level and state-level efficiencies (based on the models summarized above) with respect to the provision of roads. The findings are interesting. The city-level and state-level efficiencies and their distributions are presented in Table 12.
Table 12: Distribution of efficiency, city and state-level, India
Variable Observations Mean Std.Deviation Minimum Maximum City-level efficiency
3547 0.99490 0.00001 0.99488 0.99493
State-level efficiency
30 0.6531 0.1475 0.1988 0.8804
Sources: Census of India town directories 2001, Central Statistical Organization, Ministry of Road Transport and Highways, and author’s computations.
Table 12 summarizes the primary findings of this study. The cities in India are more efficient than the states as far as the provision of roads (in terms of their coverage of population) is concerned. On average, the cities have only about 1 per cent of inefficiency, whereas the states are only 65 per cent efficient on average. This implies that, on average, the states could offer the same coverage of roads with 35 per cent fewer resources. A ranking of the states and cities based on their efficiencies in terms of road provision was done. At the city level, the top 191 ranks for city-level efficiency are shared by towns in the southern Indian state, Tamil Nadu. These findings are consistent with Paul and Sridhar (2009). They found that Tamil Nadu (TN) spent a total of 92,483 during 1980-85 for creating every additional km of road during 1985-90, whereas another Indian state, Uttar Pradesh, spent 3.5 times more than that of TN, 328,788 over 1980-85 to create an additional km of road during 1985-90.14 They conclude that Tamil Nadu was more efficient in the deployment/utilization of resources as it related to provision of roads. What do the city-level efficiency scores and ranks mean for cities which are examined in this study from the viewpoint of revenues from land leasing and sales? In terms of efficiency with respect to road provision, Jaipur tops the list of the four selected cities with a rank of 309 (out of 3,547 cities), Bangalore follows with a rank of 325, Kolkata is at 376, trailed by Ahmedabad at 678. Interestingly, the two cities, Jaipur and Bangalore, which have been able to capitalize on land leasing and sales, are also the
13 I confirmed from STATA’s technical support that one can look at the efficiency results from the two models and make comparisons of the differences (since both use cross-sectional data and similar models). However, there is no formal test or methodology to compute a statistic for such a comparison. 14 One recognizes that the mix of roads (for e.g. rural roads, national and state highways), land terrain, and other factors could make a difference to the cost of roads per km. Nevertheless, these factors may account for only a part of the cost differential noted above.
23
ones which are relatively more efficient in the provision of local public services such as roads. The cities, Ahmedabad and Jaipur, which are unable to capitalize on the revenues from land leasing and sales are also the ones which are relatively inefficient in the provision of roads. This lends support to the observation that more efficient cities should be provided with greater resources in order to enable them to carry out their functions. When the efficiency scores and ranks of the Indian states were examined, an interesting pattern emerged. While the states’ efficiency is way below that of the cities, in the provision of roads (as summarized in Table 12), of the 29 states, the top states in terms of their efficiency ranks are Orissa (88 per cent efficiency), Kerala and Nagaland (at 85 per.cent efficiency each), and the most inefficient ones are Jharkhand (only 20 per cent efficiency), Jammu and Kashmir, and Haryana (41 per cent efficiency each).15 The relatively greater efficiency of the city governments when compared with that for the state governments here is consistent with other evidence which compares, more specifically, the performance of UDAs with that of the city governments, from a service delivery point of view. A study by Public Affairs Centre (Sekhar and Shah 2006) showed that in the third citizen report card (CRC), which was done for Bengaluru in 2003, the proportion of households reporting complete satisfaction with the city government’s (then called the Bangalore Mahanagara Palike (BMP)) services was much higher (being 44 per cent)16 than it was for the UDA (the Bangalore Development
15 An attempt was also made to examine the efficiency of cities and states in terms of the provision of pucca roads (roads which are covered with concrete and cement) (in the case of cities) and surfaced roads (in the case of states) respectively, rather than examining total road length which the models in Tables 12 and 13 do. However, even those estimations do not change the findings reported here. In the case of the city-level efficiency model, when only pucca road length per 1,000 population is used (rather than the total road length including pucca and kuccha roads) as the key efficiency variable to be explained, population and population density continue to exert the same negative impact on the pucca road length coverage, whereas the city government’s revenue per capita exhibits a positive impact. With this model, the six most efficient city governments are again in the southern Indian state, Tamil Nadu (as compared with the earlier distribution where the 192 most efficient city governments were located in Tamil Nadu). The average city-level efficiency (taking into account the full sample of 4,022 cities) is 0.99, the same as I find in the earlier (total road length) case. Whereas in the earlier case, the four most inefficient city governments were all in Maharashtra, in this case, out of the four most inefficient governments, one is in Maharashtra, but the other three are in other states (Gujarat, West Bengal, and Andhra Pradesh). When a similar exercise was attempted for the state-level efficiency model, however, the maximum likelihood iterations would not converge with the assumption of a half-normal distribution for the efficiency term. While the exponential distribution converged for the state-level model, this distribution for the city-level model did not converge. In any case, the state-level efficiency model (assuming the exponential distribution for technical efficiency) showed an average inefficiency of 30 per cent (although there were a few states which had no inefficiency—in other words had an efficiency score of 1. These were Gujarat, Nagaland, Uttar Pradesh and Delhi). However, since these are based on a different assumption regarding distribution of the technical efficiency which did not converge for the city-level model, they could not be directly compared. However, when compared with the previous state-level model, states become a little more efficient when only surfaced roads are considered, as in this specification. 16 The number of observations on which this is based is 105, the exact question asked being 'Taking everything into consideration, are you satisfied /dissatisfied with overall service of the agency?' The next question which was asked was 'If satisfied, to what extent are you satisfied?' the options given being 'partly satisfied' and 'completely satisfied'.
24
Authority (BDA)), for which the satisfaction level reported by respondents was only 15 per cent.17 The relatively greater efficiency of the municipal government, when compared with that of parastatal entities in India’s context, is also borne out by a study by Sridhar, Reddy and Srinath (2011), which was completed for the Expenditure Reforms Commission, Government of Karnataka. This study found that parastatal bodies (such as the Karnataka Urban Water Supply and Drainage Board) were unable to satisfy mandatory reforms required of them as part of national urban renewal programmes which, as a result, had to use their own funds to implement projects, whereas the city governments had satisfied most reforms required of them mandatorily, with whatever little physical and financial resources they had. The above findings make sense because local governments are expected to be more accountable to the residents since all local infrastructure such as roads are eventually locally owned and used, and the local governments have a much better understanding of local priorities and preferences rather than the state governments.
8.1 Policy implications
This study has shown that the institutional arrangements for land use are fragmented between the UDAs and town planning departments of municipal corporations in India’s cities. There are overlaps among various agencies as far as planning and development of schemes for town planning are concerned. Given municipal corporations have limited control over land assets, especially for commercial purposes (leasing and selling), they cannot leverage their land resources for raising revenues. It is found that urban local governments in India are much more efficient than the state governments in the provision of local public services, taking the case of roads. Further, city revenues per capita have a positive impact on their provision of roads (in terms of their coverage of population). Next, city governments also understand local priorities and preferences much better, hence they are more likely to be accountable to their residents, as found by Sridhar, Reddy and Srinath (2011), and as argued by the literature on decentralization (see Faguet 1997). Given these considerations, it is recommended that revenues accruing to UDAs from their land leasing and/or sales be systematically transferred to cities in a phased manner. In the early part of the decade, revenues from land leasing and/or sales were small in the case of most cities, but have grown progressively, even in the case of Ahmedabad and Kolkata. The results from this study thus show that cities have been attempting to use land as a potentially powerful financing tool, and plenty of opportunities remain for transfer of funds from land lease and sales from UDAs to municipal authorities.Some cities such as Jaipur have already been doing this. The UDA there (the JDA) transfers 17 The number of observations on which this is based is 23, the question being the same as that reported above. In an earlier report card done for Bengaluru in 1994 by Public Affairs Centre (Paul 1995), the complete satisfaction reported for BMP was 5 per cent and that reported for the BDA by respondents was only 1 per cent (unfortunately the number of observations on which these are based, is unavailable). Based on the above, there is some citizen-centric evidence to believe that the satisfaction levels of the citizens have always been higher for the city government, when compared with that for the UDA.
25
about 15 per cent of its gross revenues (after transfer of 20 per cent to the state government) from land leasing and sales to the Jaipur city government, to enable it to carry out municipal functions as specified by the state government. In Bangalore the UDA (the BDA) transfers funds to the city government in an ad hoc way, sometimes as and when required by the city to operate and maintain land transferred to it by the BDA. But frequently city governments point out that lands that are transferred to them by the UDA are often inadequately developed and serviced, and therefore, place a disproportionately large financial burden on them (Mathur and Peterson 2006). In 2007, the UDA in Bangalore transferred some 1.5 crores to the city government to enable it to do the operations and maintenance of lands transferred to it. Such transfers are one-time, sometimes meagre, and are not required by the statute. Moreover such transfers by the UDA to the city government are made for the enabling of operations and maintenance purposes only, not to enable the carrying out of general municipal functions, as is done by Jaipur’s UDA to the city government there. In Ahmedabad, the city government is required to transfer funds to the UDA, to enable it to carry out its functions of city improvement. While the city’s finances were in relatively good condition (until octroi abolition), given the city’s increasing burden of public services with the merging of surrounding areas, there should be a flow in the reverse direction, from the UDA to the city. In Kolkata, while the city government and the UDA owe something to each other, they are in the nature of quid pro quo payments.18 There is no statutory transfer of funds that is required by the UDA to the city or vice-versa, as is required in some other cities. Hence it is interesting to note that city governments such as Kolkata would stand to benefit substantially if the revenues from land leasing, and/or sales taking place in the city area, were to be transferred to the local government by the UDA. Similarly in Ahmedabad, given the city government’s service responsibilities, it would make more sense for the UDA to transfer some portion of its funds routinely to the city to enable it to carry out its functions, rather than the reverse transfer stipulated by the Gujarat Town Planning and Urban Development Act. Bangalore and Jaipur are already partly doing what this study recommends, and they are also relatively more efficient in the provision of roads. Hence transfer of funds and functions from the UDAs to the municipal corporations is much recommended for orderly growth of cities, doing away with the multiplicity of agencies with respect to land use, and respecting the financial autonomy and decentralization spirit of the 74th CAA. The above recommendation is also in line with recommendations made by Karnataka’s First State Finance Commission (see Mathur and Peterson 2006). This merging has the following advantages:
1. Cities would have enough resources to finance their urban infrastructure programmes, which would be in line with the provisions of the 74th CAA.
2. The multiplicity of institutions with respect to land use would be done away with. This would enable more orderly growth of cities.
3. There would be more efficient provision of public services such as roads. 18 The UDA in Kolkata (called the Kolkata Metropolitan Development Authority (KMDA) supplies water to the city government (the Kolkata Municipal Corporation (KMC)), hence the city government owes a payment to the UDA. The UDA, in turn, has to pay property tax to the city.
26
It is useful to note that since India’s Jawaharlal Nehru National Urban Renewal Mission (JnNURM) specifies municipalities to prepare a city development plan and other statutory plans, a review of the role of UDAs vis-à-vis municipalities will be required to be done by all cities. Having said this, land acquisition, land development, sale and lease of lands, and preparation of master plans including long-range urban planning and determination of land uses are specialized functions, for which the required expertise might not be available in most city governments. As Mathur and Peterson (2006) point out, the scale and complexity of urban planning could overwhelm the city governments’ primary function of service provision and maintenance if such functions were transferred to the cities. Hence they suggest that it is unrealistic to simply transfer these functions to ULBs by a stroke of the pen. One possible solution which has been suggested is to broaden the mandate of the UDA. However, despite the many advantages the development authorities have with regard to land related activity, in practice, the functioning of development authorities and other similar agencies has been found to be far from satisfactory (which is consistent with the evidence from the citizen report cards summarized earlier). They have not been able to control haphazard development on the periphery and on lands that are either notified for acquisition or acquired for development. Nor have they been able to effectively put in place cost recovery principles for charging for the services that they provide. Thus it is fundamental to decentralization for cities to participate in the planning decisions that affect their future development and future service responsibilities. There are several prerequisites for achieving efficient functional performance at the level of cities, as Mathur and Peterson (2006) point out. There also has to be a strong coordination mechanism between the state, parastatal and other institutions, and the cities in matters relating to city development and restructuring and provision of services. Everything said and done, it should be acknowledged that public land leasing and/or sales have the potential to stimulate speculation in the land and real estate markets, and cause property prices to rise, as has generally happened in the case of India and China’s cities. Further, land may not be a sustainable means of financing, since it is an exhaustible resource. A better channel for cities to get access to more finances might be the capital market, as that involves credit rating and has the effect of improving their governance as well. However, rarely are city projects perceived as being commercially viable, for which funds can easily be made available from the bond market. Further, rating institutions would bring about difficulties in deciding whether to go by measures of the city’s financial performance, such as total revenue including grants, or by building appropriate efficiency indicators. This is where this research would prove to be of assistance. Thus, taking the institutional fragmentation with respect to land use and efficiency, and accountability of city governments in the provision of public services, there is a need for revisiting the institutional roles of the UDAs versus the city governments, and seriously considering the transfer of institutional autonomy and requisite resources to municipal authorities in matters relating to land, given that it can constitute a substantial addition to municipal revenues in India’s cities, and can result in more efficient and accountable provision of local services such as roads.
27
9 Concluding remarks
While this study has found that land can be quite attractive as a financing tool for cities, it has implications for the institutional arrangements pertaining to land between UDAs and municipal corporations. It is found that India’s cities are more efficient in the provision of public services, taking the case of roads. Hence transfer of finances from UDAs to cities in a phased manner is recommended, to enable them to carry out their municipal functions which are, until now, in the nature of unfunded mandates imposed upon them by the 74th Constitutional Amendment Act.
References
Afonso, Antonio and Sonia Fernandes (2003). ‘Efficiency of Local Government Spending: Evidence for the Lisbon Region’. Working Paper 09/2003/DE/CISEP. Instituto Superior de Economia e Gestão, Universidade de Técnica de Lisboa.
Aigner, D.J., C.A.K.Lovell, P. Schmidt (1977). ‘Formulation and estimation of stochastic frontier production functions’. Journal of Econometrics, 6:21—37.
Boetti, Lorenzo, Massimiliano Piacenza, and Gilberto Turati (2009). ‘Fiscal Decentralization and Spending Efficiency of Local Governments: An Empirical Investigation on a Sample of Italian Municipalities’. Mimeo.
Bombay First and McKinsey (2003). Vision Mumbai, New Delhi: Galaxy Offset (India) Pvt. Ltd.
Bossert, Thomas J., Osvaldo Larranaga, Ursula Giedion, Jose Jesus Arbelaez, and Diana M. Bowser (2003). ‘Decentralization and equity of resource allocation: Evidence from Colombia and Chile’. Bulletin of the World Health Organization, 81 (1): 1—6.
Chan, Kam Wing (1997). ’Urbanization and urban infrastructure services in the PRC’. In Christine P.W.Wong (ed.), Financing Local Government in the People’s Republic of China, Hong Kong: Asian Development Bank and Oxford University Press.
Chreod (2005). Report to World Bank on City Development Strategies II. Ottawa: Chreod Ltd.
Deng, Frederic (2005). ‘Public land leasing and the changing roles of local government in Urban China’. Annals of Regional Science, 39 (2): 353—73.
Ding, Chengri (2005). ‘Property tax developments in China’. Land Lines, 17 (3). Cambridge MA: Lincoln Institute of Land Policy.
Faguet, Jean-Paul (1997). Decentralization and Local Government Performance, Technical Consultation on Decentralization. Rome: FAO.
Hong, Yu-Hung (1996). ‘Can Leasing Public Land Be An Alternative Source of Local Public Finance?’. Lincoln Institute of Land Policy Working Paper WP96YH2. http://66.223.94.76/pubs/dl/145_hong96web.pdf. Retrieved April 30, 2008.
Holzer, Marc et al. (2009) Literature Review and Analysis Related to Optimal Municipal Size and Efficiency, Rutgers School of Public Affairs and Administration.
28
Ingram, Gregory K. and Liu, Zhi (1999). ‘Determinants of motorization and road provision’. World Bank Policy Research Working Paper 2042.
Kalb, Alexander (2010). ‘What Determines Local Governments' Technical Efficiency? The Case of Road Maintenance’. Centre for European Economic Research (ZEW).
Loikkanen, Heikki A., Ilkka Susiluoto and Michael Funk (2011). ‘The role of city managers and external variables in explaining efficiency differences of Finnish municipalities’. Helsinki Centre for Economic Research (HECER), Discussion Paper 312.
Mathur, O.P. and George Peterson (2006). ‘State Finance Commissions and Urban Fiscal Decentralization in India: India Urban Initiatives’. Washington DC: The Urban Institute.
Motta, Ronaldo Seroa da and Ajax Moreira (2009). ‘Political factors and the efficiency of municipal expenditure in Brazil’. Economia Aplicada, (13): 353—71.
Mortimer, Duncan (2002). ‘Competing Methods for Efficiency Measurement: A Systematic Review of Direct DEA vs SFA/DFA Comparisons’. School of Medicine, Health Policy & Practice, University of East Anglia Working Paper 136.
Paul, Samuel (1995). ‘A Report Card on Public Services in Indian Cities: A View from Below’. Mimeo. Public Affairs Centreo.
Paul, Samuel and Kala S. Sridhar (2009). ‘The paradox of India’s north-south divide’. Mimeo. Public Affairs Centre.
Peterson, George E. (2009). ‘Unlocking Land Values to Finance Urban Infrastructure’. Trends and Policy Options Series. Washington, DC: World Bank.
Peterson, George E (2007). ’Land Leasing and Land Sale as an Infrastructure Financing Option in Financing Cities’. In George E. Peterson and Patricia Clarke Annez (eds) Land Leasing and Land Sale as an Infrastructure Financing Option in Financing Cities. Washington DC: Sage Publications and the World Bank.
Reedy, Diane E. (1986). ‘Domestic Water Use and Sanitation in Lagos, Nigeria’. Background paper. Washington DC: World Bank, West Africa Projects Department.
Savage, David and S. Dasgupta (2006) ‘Governance Framework for Delivery of Urban Services’, in 3iNetwork (ed.) India Infrastructure Report 2006: Urban Infrastructure. New Delhi: Oxford University Press.
Sekhar, Sita and Manish Shah (2006). ‘Benchmarking Bangalore's Public services: what the third report card reveals’. Mimeo. Public Affairs Centre.
Sridhar, Kala S. (2006). ’Institutional Arrangements for Land Use in Ludhiana, Punjab’. in India Infrastructure Report 2006: Urban Infrastructure (ed., 3i Network), New Delhi: Oxford University Press.
Sridhar, Kala S. (2004). ‘Cities with Suburbs: Evidence from India’. National Institute of Public Finance and Policy Working Paper 23/2004.
Sridhar, Kala S. and A.V.Reddy (2009). ‘Land as a municipal financing tool: A pilot study from India’. Final report submitted to the Thirteenth Finance Commission, Government of India. http://fincomindia.nic.in/writereaddata/html_en_files/report12.pdf
29
Sridhar, Kala S. and O.P. Mathur (2009). ‘Costs and challenges of local urban services: Evidence from India’s cities’. New Delhi: Oxford University Press.
Sridhar, Kala S., A.V. Reddy and P.Srinath (2011). ‘A study of program implementation and service delivery to improve efficiency and cost-effectiveness: The cases of MNY, UIDSSMT and SJSRY’. Expenditure Reforms Commission, Government of Karnataka. Draft final report.