A series of short papers on regional research and indicators produced by the Directorate-General for Regional Policy by Tiziana Fabbris and Francesca Michielin n° 01/2010 Working Papers The economy of the Italian regions: recent developments and responses to the economic crisis
Transcript
A series of short papers on regional research and indicators produced by the Directorate-General for Regional Policy
by Tiziana Fabbris and Francesca Michielin
n° 01/2010
Working Papers
The economy of the Italian regions: recent
developments and responses to the economic crisis
2
n° 01/2010
The economy of the Italian regions: recent developments and responses to the economic crisis
Executive summary After a seven-year cycle of moderate growth, the international crisis which originated in the United States of America (US) in 2008 has pushed Italy into its deepest recession for 50 years. Italy was the first euro-zone country to record negative growth as early as 2008. A downturn is also expected for 2009, when GDP is forecast to contract by around 5%.
EU Member States have implemented robust recovery packages broadly in line with the principles set out in the European Economic Recovery Package (asking for timely, temporary and targeted recovery measures). In the case of Italy, excluding the initiatives in favour of the banking sector, the national crisis-containment plan – encompassing initiatives to safeguard credit and the saving system, measures for the real economy, provisions for enhancing income support, the acceleration of public investments and further initiatives to sustain employment and revive business investments – set aside gross resources of around EUR 35.5 billion for the 2008-2011 period or 2.3% of 2008 GDP1. Directorate-General Economic and Financial Affairs (DG ECFIN) estimated in a recent Occasional Paper2 that the overall discretionary stimulus to support the real economy, aggregated over 2009-2010, amounted to around 1.2% of 2009 GDP.
A questionnaire-based survey was carried out by Directorate-General Regional Policy (DG REGIO) in September 2009 with a view to providing inputs on the regional contribution to the national crisis-containment plan. We estimate that regions, through either their discretionary budgets, national transfers and ordinary instruments or structural funds, provided an overall recovery package of gross resources worth around EUR 15 billion for the 2009-2010 period. Excluding the national transfers, already captured in the national recovery plan, the net additional stimulus provided by regions in response to the economic crisis is estimated at around EUR 9 billion, i.e. 0.7% of 2009 GDP3.
The aim of this survey, based on data provided by regions, is to analyse the regions’ response to the crisis, looking for possible differences among the less developed regions (Convergence
1 Italian National Reform Programme 2008-2010, 2009 Implementation Report.2 European Economy, Occasional Papers 51, July 2009.3 DG REGIO estimates, based on 2009 Ministry of Economic Development forecasts, which
incorporated more realistic estimates of the impact of the crisis on economic activity with respect to the 2009 Implementation Report.
regions whose per capita GDP is less than 75% of the Community average, i.e. Campania, Apulia, Calabria, Sicily and Basilicata4) and the more prosperous ones (eligible for the Regional Competitiveness and Employment objective, i.e. all the remaining 16 Italian regions5) from both a quantitative point of view (i.e. amount of resources invested) and a qualitative point of view (i.e. nature of the measures adopted). The full geographical coverage of the analysis allows not only a comparison of the economic responses to the crisis, shedding light on socio-economic and institutional differences among regions, but also an understanding of whether regional interventions were aimed only at reinforcing the national plan or completing it with a more forward-looking approach, combining contingent measures while tackling structural problems.
Macroeconomic data for 2009 show that the deterioration in economic activity is broad-based across regions and sectors. However, when considering the dynamics of the crisis, the similarity between GDP contractions expected in 2009 for both Convergence (CONV) and Regional Competitiveness and Employment (RCE) regions (-5.2% for CONV against -5.3% for RCE) is more likely to be explained by mirror-like positions in the economic cycle. Indeed, macroeconomic indicators suggest that the crisis first hit northern regions and then spread to the remaining regions: different product specialisation and degrees of openness explain the asynchrony between the economic cycles of northern and southern regions and, more generally, between RCE and CONV regions during the crisis. Given those differences, the more open (northern) regions are expected to recover from the downturn first, as soon as economic conditions stabilise and the contraction in global demand is reabsorbed.
This view is partly confirmed by the analysis of the regional recovery packages. RCE regions seem to have more chances of overcoming stagnation given: i) the larger amount of resources they were able to mobilise to tackle the economic crisis, particularly when considering the timely use of structural funds; ii) the ownership of
4 Basilicata is a phasing-out (pho) region. Due to EU enlargement and the consequent decrease of EU-27 per capita GDP, it is no longer eligible for the Convergence objective in the 2007-2013 programming period.
5 Sardinia is a phasing-in (phi) region, i.e. a region covered by objective 1 between 2000-2006 and not covered by the Convergence objective in 2007-2013 programmes. Both pho and phi regions obtain transitional support in the 2007-2013 period.
3
the main source of financing for recovery measures, i.e. regional discretionary packages. In the light of the critical juncture and of their larger portfolio of resources (regional, national and structural funds), CONV regions would have been expected to fully mobilise all the available resources to accelerate the recovery. In reality, however, the response from the CONV regions has not been as effective as it should have been, at least from a quantitative point of view.
The picture appears more balanced when we look at the quality of regional recovery interventions in Italy, which appear in line with the broad guidelines put forward in the Commission’s European Economic Recovery Plan, in that they are timely and temporary – as their impact will mainly unfold in 2009-2010 – but also targeted to the beneficiaries most affected by the crisis. RCE and CONV regions show similar patterns regarding: i) the nature of the measures introduced, combining prevailing anti-cyclical extraordinary measures (70% of the package) with a non-marginal share of structural measures aiming at raising growth and employment in the medium to long-term; ii) the target beneficiaries, the main focus being placed by all regions on support for the business community in order to avoid the risk of a permanent reduction of productive capacity as a consequence of the crisis. In addition, the majority of CONV regions seem to have realised the need to tackle structural problems in the functioning of the labour market functioning, and to have taken appropriate measures aimed at raising jobs potential.
However, notwithstanding the satisfactory quality of CONV regions’ response to the crisis – which will require some time to deliver the expected results – the risk that the stronger and timely reaction of RCE regions could lead to a further widening of the existing gap within the two subsets of regions once normal economic conditions are restored cannot be ruled out.
The paper is organised as follows: Section 1 reports recent macroeconomic indicators to analyse the impact of the economic downturn on Italian regions; Section 2, in investigating the regions’ response to the crisis, provides a quantification of recovery packages by regions’ objectives (CONV versus RCE regions) and their sources of financing (discretionary budget, national transfers and structural funds). An analysis of the measures introduced by regions in support of the real economy is also carried out both for the regional discretionary recovery packages and for structural funds. Section 3 draws some conclusions.
4
1. How the economic crisis has affected Italian regions
1.1 Economic activity
After a seven-year cycle of moderate growth, the international crisis which originated in the US in 2008 has pushed Italy into its deepest recession for the last 50 years. Italy was the first euro-zone country to record negative growth as early as 2008. A downturn is also expected for 2009, when GDP is forecast to contract by around 5%.
The deterioration in economic activity is broad-based across regions and sectors. However, whereas CONV and RCE6 regions expect equivalent GDP contraction in 2009 (-5.2% for CONV against -5.3% for RCE regions)7, this apparently similar trend needs to be qualified as it results from different temporal and sectoral dynamics and could hide specular positions in the economic cycle.
Indeed, RCE regions were the first to react to the international economic downturn which has led to a sizeable decline in global demand and, consequently, in their economic activity since the second half of 2008, due to their higher exposure to global markets and specialisation in investment goods. In summer 2009 there were signs of recovery which were more pronounced in the regions in the centre and north of the country, which had seen the largest fall in demand in the first half of the year8.
Because of their specialisation in traditional productive sectors (such as domestic appliances), which took longer to be affected by the fall in consumption demand, coupled with their more inward-oriented production, there was some delay before the southern regions were hit by the recession.
1.2 Exports
As a consequence of the economic crisis, exports have slumped in all Italian regions since the beginning of 2009 (-24.2% in the first semester 2009 compared to the same period in 2008). However, as in the case of economic activity, the contraction spread out from the northern, more export-oriented regions, to the rest of the country. In the first semester of 2009, CONV regions, representing around 10% of total Italian exports, recorded the worst trend (-30.5% against -23.8% of RCE).
The most heavily-hit productive sectors were primarily: transport equipment, metals, machinery and electrical equipment, metallic mineral product manufacturing, and textiles and footwear. The decline in oil prices explains the contraction recorded in the two islands (Sicily and Sardinia), which specialise in refining oil products.
1.3 Labour market
Following the decline in economic activity, labour market conditions progressively worsened, leading to a gradual fall in the number of hours worked. In November 2008, to contain the impact of the crisis in the real economy, the Italian government
6 CONV stands for Convergence objective, i.e. NUTS 2 regions whose per capita GDP is less than 75% of the Community average. RCE stands for Regional Competitiveness and Employment objective, i.e. all regions not covered by the Convergence objective or by transitional support.
7 Minister of Economic Development, Development Policy Department (DPS) 2009 estimates.8 Regional Economies, Bank of Italy, December 2009.
extended the eligibility for the Cassa Integrazione Guadagni (CIG)9 or Wage Supplementation Fund to a higher number of sectors and dimensional classes of firms than originally planned.
Recourse to the CIG has increased rapidly since the second half of 2008, initially in the industrial sector to which the CIG support was originally addressed, and therefore in those regions where industrial production mainly takes place. Compared to the same period in 2008, the use of CIG almost tripled in the first semester of 2009. Ordinary CIG (covering firms in temporary difficulties lasting no more than 12 months) accounted for the largest share (73%), reflecting firms’ expectations that the economic crisis was cyclical. RCE regions recorded the steepest increase, for both ordinary and extraordinary schemes (for firms in lasting difficulties). Piedmont, Lombardy, Friuli-Venezia Giulia (Friuli-V.G.), Emilia-Romagna and Abruzzo, accounting for more than half of total authorised hours, reported the sharpest rise.
The extended use of CIG has enabled enterprises to adjust working hours to their production needs, keeping people in employment and maintaining their salaries at the same levels as before the crisis. By containing potential job losses of around 400 000 workers, mainly in the RCE regions, the CIG has, at least temporarily, cushioned the economic recession. However, since the beginning of 2009, labour market surveys have registered a progressive reduction in the number of people employed in all Italian regions.
The impact of the crisis on the unemployment rate (+0.7% in the first semester of 2009 compared to the same period in 2008 for the whole of Italy) is instead differentiated for CONV and RCE regions, which are the hardest hit with a 0.8% increase. CONV regions, which normally show unemployment rates higher than the rest of the country, reported, on average, a rather limited increase (0.1%) in the number of unemployed, with Calabria and Campania showing a declining unemployment rate accompanied by the highest drop in participation rates. This trend is far from being reassuring. The continuing contraction of the labour force – as confirmed by the significant drop in the participation rate (-2.3% in CONV against -0.9% for Italy as a whole) – indicates that the most disadvantaged groups (mainly women and young people) are withdrawing from the labour market, due to the increasing difficulty of finding jobs. Recent surveys of firms show that in the coming months, labour market developments could get even worse. Employment is expected to go on falling in all geographical areas, and particularly in industry, due to the progressive attainment of maximum CIG ceilings established by the government.
These developments make the achievement of the Lisbon objectives on employment (70% in 2010) virtually impossible, not only for CONV regions but for Italy as a whole.
9 The CIG, used to protect workers’ income, is financed by companies and the State and administered by INPS, the National Institute of Social Insurance.
5
Table 1 – Selected indicators on the scale and impact of the economic crisis in Italian regions
Regions
Depth of the crisis Labour market indicators ***
GDP growthExports **
1st semester 2009
Participation rate
(age 15-64)
Employment rate
(age 15-64)
Un employment rate
Hours paid by CIG (% change compared to 1st semester 2008) Equivalent
Sources: * 2008 SVIMEZ estimates; 2009 Ministry of Economic Development, DPS estimates; ** ISTAT, Survey on External Trade, 17.09.2009; *** ISTAT, Labour Market Survey, 22.09.2009 and INPS (National Institute of Social Insurance)
6
1.4 Firms
Industrial production has experienced a sharp decline since the spring of 2008, bringing the index back to the level of the mid-1980s. Since April 2008, an overall decrease in output of around 18% has been recorded for Italy as a whole.
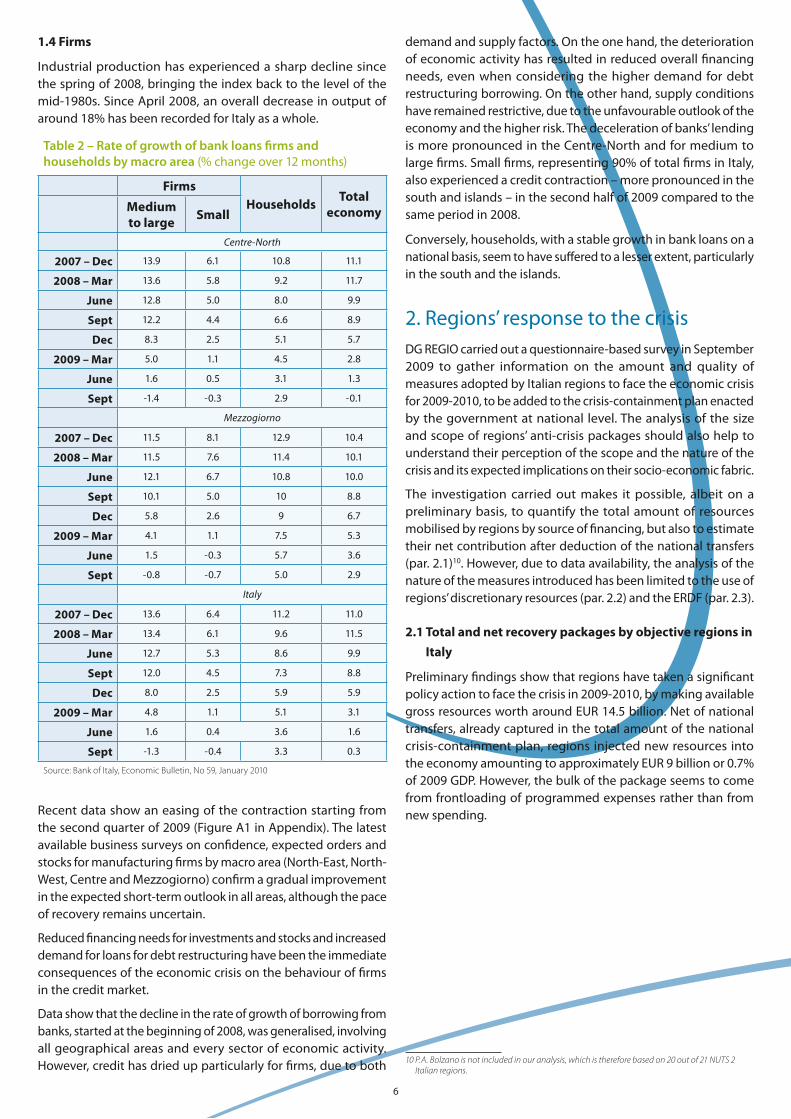
Table 2 – Rate of growth of bank loans firms and households by macro area (% change over 12 months)
FirmsHouseholds
Total economyMedium
to largeSmall
Centre-North
2007 – Dec 13.9 6.1 10.8 11.1
2008 – Mar 13.6 5.8 9.2 11.7
June 12.8 5.0 8.0 9.9
Sept 12.2 4.4 6.6 8.9
Dec 8.3 2.5 5.1 5.7
2009 – Mar 5.0 1.1 4.5 2.8
June 1.6 0.5 3.1 1.3
Sept -1.4 -0.3 2.9 -0.1
Mezzogiorno
2007 – Dec 11.5 8.1 12.9 10.4
2008 – Mar 11.5 7.6 11.4 10.1
June 12.1 6.7 10.8 10.0
Sept 10.1 5.0 10 8.8
Dec 5.8 2.6 9 6.7
2009 – Mar 4.1 1.1 7.5 5.3
June 1.5 -0.3 5.7 3.6
Sept -0.8 -0.7 5.0 2.9
Italy
2007 – Dec 13.6 6.4 11.2 11.0
2008 – Mar 13.4 6.1 9.6 11.5
June 12.7 5.3 8.6 9.9
Sept 12.0 4.5 7.3 8.8
Dec 8.0 2.5 5.9 5.9
2009 – Mar 4.8 1.1 5.1 3.1
June 1.6 0.4 3.6 1.6
Sept -1.3 -0.4 3.3 0.3
Source: Bank of Italy, Economic Bulletin, No 59, January 2010
Recent data show an easing of the contraction starting from the second quarter of 2009 (Figure A1 in Appendix). The latest available business surveys on confidence, expected orders and stocks for manufacturing firms by macro area (North-East, North-West, Centre and Mezzogiorno) confirm a gradual improvement in the expected short-term outlook in all areas, although the pace of recovery remains uncertain.
Reduced financing needs for investments and stocks and increased demand for loans for debt restructuring have been the immediate consequences of the economic crisis on the behaviour of firms in the credit market.
Data show that the decline in the rate of growth of borrowing from banks, started at the beginning of 2008, was generalised, involving all geographical areas and every sector of economic activity. However, credit has dried up particularly for firms, due to both
demand and supply factors. On the one hand, the deterioration of economic activity has resulted in reduced overall financing needs, even when considering the higher demand for debt restructuring borrowing. On the other hand, supply conditions have remained restrictive, due to the unfavourable outlook of the economy and the higher risk. The deceleration of banks’ lending is more pronounced in the Centre-North and for medium to large firms. Small firms, representing 90% of total firms in Italy, also experienced a credit contraction – more pronounced in the south and islands – in the second half of 2009 compared to the same period in 2008.
Conversely, households, with a stable growth in bank loans on a national basis, seem to have suffered to a lesser extent, particularly in the south and the islands.
2. Regions’ response to the crisisDG REGIO carried out a questionnaire-based survey in September 2009 to gather information on the amount and quality of measures adopted by Italian regions to face the economic crisis for 2009-2010, to be added to the crisis-containment plan enacted by the government at national level. The analysis of the size and scope of regions’ anti-crisis packages should also help to understand their perception of the scope and the nature of the crisis and its expected implications on their socio-economic fabric.
The investigation carried out makes it possible, albeit on a preliminary basis, to quantify the total amount of resources mobilised by regions by source of financing, but also to estimate their net contribution after deduction of the national transfers (par. 2.1)10. However, due to data availability, the analysis of the nature of the measures introduced has been limited to the use of regions’ discretionary resources (par. 2.2) and the ERDF (par. 2.3).
2.1 Total and net recovery packages by objective regions in
Italy
Preliminary findings show that regions have taken a significant policy action to face the crisis in 2009-2010, by making available gross resources worth around EUR 14.5 billion. Net of national transfers, already captured in the total amount of the national crisis-containment plan, regions injected new resources into the economy amounting to approximately EUR 9 billion or 0.7% of 2009 GDP. However, the bulk of the package seems to come from frontloading of programmed expenses rather than from new spending.
10 P.A. Bolzano is not included in our analysis, which is therefore based on 20 out of 21 NUTS 2 Italian regions.
7
Table 3 – Recovery packages by source of financing and by objective regions (million EUR)
Source: DG REGIO estimates based on data provided by regions
* Includes regional discretionary funds + regional co-financing to structural funds** Includes (ordinary) national transfers + national co-financing to structural funds programmes and possibly to regional recovery plans
Economic and structural conditions prior to the crisis help to explain the differences in scale and composition among regions’ recovery packages.
The relative (net) contribution of the two sets of regions to the financing of the net additional package is proportional to their weight in total economic activity (76.1% for RCE, 23.9% for CONV). However, the picture is not so clear-cut in per capita terms, where the gap between the two sets of regions tends to shrink (Figure 1). Indeed, when excluding outlier RCE regions (notably P.A. Trento) it appears that some CONV regions, such as Basilicata and Calabria, have made sizeable recovery efforts, greater than any RCE region once those enjoying special administrative status (Aosta Valley (VdA), Friuli-Venezia Giulia (FVG) and Sardinia)11 have been excluded.
Figure 1 – Per capita expenditure from net contributionby regions (EUR)
Source: DG REGIO estimates based on data provided by regions
11 In Italy there are five regions enjoying special administrative status: four are RCE regions (Aosta Valley, Trentino Alto-Adige i.e. Trento and Bolzano Autonomous Provinces, Friuli VG and Sardinia) and one belongs to the CONV subset of regions (Sicily).
As regards the source of financing of the recovery packages, the following insights can be drawn:
Regional funds (regions’ discretionary resources coming from their own budgets) are the main source of financing in the case of RCE regions, given their higher incomes and tax collection capacity. Even excluding outliers (notably P.A. Trento), RCE regions made stronger efforts than CONV not only in absolute but also in relative terms by investing a relatively higher share of discretionary funds, compared to both regional capital expenditure (2007) and GDP (2009), in anti-crisis measures (respectively 6.8% and 0.37% for RCE against 0.9% and 0.3% for CONV, see Table A1 in Appendix).
Source: DG REGIO estimates based on data provided by regions
Figure 2 – Regions' net contribution to national crisis-containment plan by source of �nancing (million EUR)
ESF ERDF Regional funds 2009-10
0
200
400
600
800
1 000
1 200
1 400
Piedmont VdA
Lombardy
Liguria
Trento
Veneto
FVG
Emilia-R.
Tuscany
Umbria
Marches
Latium
Abruzz
o
Molise
Sardinia
Campania
Apulia
Basilica
ta
Calabria
Sicily
8
Structural funds coming from both the European Regional Development Fund (ERDF) and the European Social Fund (ESF) have financed the bulk of anti-crisis measures in CONV regions, granting, on average, twice the contribution of discretionary regional funds. In three out of five CONV regions (Calabria, Campania and Apulia), structural funds have filled the gap left by limited regional budgets and central government funding (Figure 2). However, on average, as shown in par. 2.3, CONV regions have not exploited the full potential of EU funds to maintain investment financing during the crisis.
Given the different nature of interventions provided, the ERDF is accompanying regional plans both in the RCE and in the CONV regions, whereas the ESF grants a higher contribution to the recovery package of RCE regions, in particular through direct participation in social protection benefits schemes (CIG).
National transfers provided for by the government to finance regional laws and to co-finance either regional or European programmes have not been considered in calculating the net contribution by regions to the national recovery package. However, national transfers are very relevant for both sets of regions, financing on average more than 1/3 of their total packages (see Figure A3 in Appendix).
2.2 Regional (discretionary) recovery packages: some
insights into the quality of regional interventions in
Italy
Almost all regions adopted a comprehensive regional recovery plan and/or regional anti-crisis laws. However, the scope and nature of measures included in their packages differ, depending on the financial means available and the expected socio-economic impact of the crisis.
Regions were asked to classify all discretionary measures (i.e. those financed only with regional budgets) adopted in their regional plans, on the basis of target beneficiaries (businesses, households, workers or more generally, public works) and of the objective of the intervention (i.e. short-term counter-cyclical measures providing a quick response to the crisis, or structural measures aiming at raising potential growth and employment over the medium to long run).
As expected, the large majority of recovery measures introduced by regions are counter-cyclical. Excluding outliers (P.A. Trento), RCE and CONV show a similar pattern, with short-term measures representing on average 70% of the package. Provided that anti-crisis measures are reversed once the economic crisis is over, discretionary regional packages seem well designed and in line with the broad guidelines put forward in the Commission’s European Economic Recovery Plan, in that they are timely and temporary as their impact will mainly unfold in 2009-2010. In addition, they also appear balanced, since all regions seem to have combined contingent extraordinary measures with a non-marginal share of structural measures with the aim of tackling structural weaknesses and enhancing competitiveness in the medium to long run.
RCE regions are the biggest contributors to discretionary recovery packages, financing 84% of the total amount.
Table 4 – Regional packages (million EUR) by nature of measures introduced (values without P.A. Trento in brackets)
Counter-cyclical
measures
Structural measures
Regional Package
2009-2010
ITALY3 289.49 2 250.54 5 540.03
(3 027.34) (1 266.54) (4 293.88)
shares 59.4% 40.6% 100%
(70.5%) (29.5%) (100%)
CONV 486.86 199.98 686.84
shares 70.9% 29.1% 100%
Contribution to the total
8.8% 3.6% 12.4%
(11.3%) (4.7%) (16%)
RCE2 802.63 2 050.56 4 853.19
(2 540.48) (1 066.56) (3 607.04)
shares 57.7% 42.3% 100%
(70.4%) (29.6%) (100%)
Contribution to the total
50.6% 37.0% 87.6%
(59.2%) (24.8%) (84%)
Regional packages are also targeted, since they are aimed at bringing some relief to specific categories of beneficiaries most affected by the crisis. According to the data collected from the regions, the main focus of regional recovery measures has been placed on the business community. Social interventions (i.e. measures designed to address the needs of specific population categories such as low-income households or disadvantaged people) are also sizeable, but these have been put in place only by a minority of regions. Combined with support to firms, the vast majority of regions have chosen to sustain the labour market in order to contain the impact of the crisis on employment and thus on demand during the recession.
Figure 3 – Composition of regional packages in Italy (in %)
Source: DG REGIO estimates based on data provided by regions
0
20
40
60
80
100
Support to businesses Social interventions Labour market interventions Public Investments
COUNTER-CYCLICAL measures STRUCTURAL measures
Public investment (public works), although forming a significant share of the total discretionary recovery package, represents a response to the economic crisis only for a very limited number of regions which have invested significant amounts of money (P.A. Trento, Tuscany and Veneto represent 90% of the total amount invested, see Figure A4 in Appendix)12.
12 Public investment representing around 2/3 of Trento’s regional (discretionary) package, its exclusion as an outlier, represents no more than a limited alteration to the picture provided by Figure 3 by reducing the weight of public investments in the total by Trento’s share.
9
A more detailed assessment of the kind of measures introduced to support businesses and the labour market, and the policy actions adopted by the vast majority of regions to support the real economy, is found in the following paragraphs.
2.2.1 Discretionary recovery packages: an overview of recovery measures in support of business
Overall, when designing their recovery packages, regions have placed the highest emphasis on supporting the business community. In regions with a deep-rooted industrial vocation or major industrial districts (Lombardy, Friuli-V.G., Piedmont, Marches and Molise), a considerable amount of money, up to 90% of total discretionary resources, has been allocated to sustain firms in order to avoid the risk of a permanent, rather than cyclical, reduction of productive capacity as a consequence of the crisis.
Figure 4 – Regions' support to business (as a % of regional packages)
Source: DG REGIO estimates based on data provided by regions
0
20
40
60
80
100
Molise
FVG
Lombardy
Abruzz
o
Marches
Piedmont
Emilia-R.
VdAApulia
Basilica
ta
Campania
Calabria
Sicily
Liguria
Veneto
PA Trento
Latium
Tuscany
Umbria
Sardinia
ITALY= 40%
The crisis seems to have been perceived by regions as being more financially-led rather than demand-led: most measures have primarily tried to ease firms’ access to finance, particularly in the form of guarantee funds (or counter-guarantees), in order to get credit moving.
Interventions are mainly counter-cyclical, with some exceptions (particularly the case of Emilia-Romagna, but also Basilicata within CONV regions) having opted mainly for structural restructuring of specific sectors13, a strategy that, overall, collected a significant amount of resources: subsidies to selected sectors (tourism, chemicals and mechanics), geographical (depressed) areas, or vulnerable segments (young/female entrepreneurs, micro-businesses, particularly in RCE regions) have been awarded mainly to compensate for aggressive risk aversion among lending institutions. Sectoral support to firms operating in research and development sectors, awarded by the majority of regions in both subsets, appears appropriate and consistent with the Lisbon strategy as a way to address the negative impact of the crisis on high-tech firms’ investments.
Tax rebates on IRAP, the regional tax on productive activity, have been used only by regions with special administrative status (P.A. Trento, Aosta Valley and Friuli-V.G.), that can offset them with higher transfers from central government.
13 This is probably the case of the tourism sector in Emilia-Romagna, the chemical and mechanical clusters in Basilicata and the Prato textile cluster in Tuscany.
ITALY 73.2x=measure taken xx=measure taken and financedwith a significant budget (compared to the other regions)Source: DG REGIO estimates based on data provided by regions
10
2.2.2 Discretionary recovery packages: an overview of recovery measures in support of the labour market and households (social interventions)
In contrast to the trend at national level, where they represent almost half of the government’s crisis-containment plan, measures to sustain the functioning of the labour market account on average for around 10-12% of discretionary regional packages. This strategy may appear short-sighted, particularly in a situation of prolonged economic crisis where unemployment is expected to increase further in the months ahead. How ever, it should be considered that the bulk of passive labour market interventions (like the CIG or similar social protection benefits) have been financed by the government and the European Social Fund, thus substantially reducing the need for regional co-financing of such measures.
Figure 5 – Regions' support to the labour market (as a % of regional packages)
Source: DG REGIO estimates based on data provided by regions
0
20
40
60
80
100
Sici
ly
Apul
ia
Mar
ches
La
tium
Sa
rdin
ia
Vene
to
Cam
pani
a Li
guria
Pi
edm
ont
Tusc
any
P.
A.Tr
ento
Ba
silic
ata
FVG
VdA
Abru
zzo
Emili
a-R.
Lo
mba
rdy
Umbr
ia
Mol
ise
Cala
bria
ITALY = 12.4%
Almost all regions have focused on two main priorities: i) improving job placement and investing in retraining and life-long leaning, in order to improve the matching process and support present and future employability of the labour force. A consistent number of regions, particularly among the CONV subgroup, has chosen to support vulnerable groups, such as the disabled, the unemployed, young people and women, through targeted measures to increase their employability; ii) maintaining existing jobs in order to keep people in employment through the financial support provided by the CIG and/or other arrangements to adjust working time. CONV regions have mainly reinforced social protection, through investments in childcare and housing.
Measures undertaken are mainly (and for the majority of RCE regions, exclusively) of a counter-cyclical nature, to cushion the impact of the economic crisis on labour markets. However, some regions adopted a more forward-looking approach, using discretionary regional funds to finance only structural measures consistent with the Lisbon strategy (such as ii). Among CONV regions, the comprehensive packages of Campania, Apulia and Calabria, financing exclusively structural measures, stand out, the latter placing particular emphasis on active labour market policies. Such an approach is particularly welcome, in that it aims at reducing the widening gap in labour market functioning – as shown by the exceptionally low employment rate and participation rate in CONV regions (Table 1) – with the more prosperous northern and Centre regions.
Social protection measures incorporate the (sometimes limited) budget devoted to interventions in support of the labour market, which thus have to be seen in conjunction.
Social interventions, amounting on average to around 17% of discretionary regional packages, aim at helping households to maintain payments of mortgages and meet their financial obligations (rents and home bills). Among CONV regions, free or reduced-cost access to services (transport for students, childcare and cost of energy) has also been granted to the
most disadvantaged people.
Figure 6 – Regions’ social interventions (as a % of regional packages)
Source: DG REGIO estimates based on data provided by regions
0
20
40
60
80
100
Umbria
Latium
Liguria
Sardinia
Calabria
Emilia-R.
VdA
Basilica
ta
Abruzz
o
Piedmont
Lombardy
Sicily
Apulia
PA Trento
FVG
Tuscany
Campania
Veneto
Marches
Molise
ITALY= 17.24%
11
Table 6 – Regional discretionary measures supporting the labour market and households
Regions
Labour market interventionsSocial
interventions
Share of counter-cyclical
measures (%)
Job placement, retraining
and life-long learning
CIG and other mechanisms to adjust working
time*
Reinforcing social
protectionSubsidies **
Share of counter-cyclical
measures (%)
Piedmont 74.0 xx xx 15.0
Aosta Valley 100 x x x 100
Lombardy 100 xx x 100
Liguria 100 x x 100
P.A. Trento 93.4 x x 100
Veneto 0 x x 0
Friuli-V.G. 52.1 x x x x 96.9
Emilia-Romagna 0 xx xx 100
Tuscany 100 x x x 100
Umbria 0 x 51.1
Marches 100 x x 0
Latium 100 x 100
Abruzzo 100 x 100
Molise 0 0
Sardinia 72.9 x xx x xx 43.5
RCE + phi 79 70.6
Campania 0 x x 100
Apulia 0 x xx xx xx 100
Basilicata 95.3 x x x 92.4
Calabria 0 xx x x xx 77
Sicily 100 xx x xx 100
CONV+pho 68.8 89.3
ITALY* 76.7 72.4
x=measure taken xx= measure taken and financed with a significant budget (compared to the other regions)Source: DG REGIO estimates based on data provided by regions* CIG also includes solidarity contracts (reduced working hours to keep people in employment) ** Targeted measures in support of vulnerable groups (mainly women, the unemployed and the disabled), such as ‘Misure anticrisi per le donne’, ‘Prestiti d’onore per le donne’, ‘Prestiti d’onore per le donne, per persone diversamente abili’, ‘Misure per favorire l’occupazione femminile’, ‘Bonus all’occupazione’.
2.3 Structural funds: some insights into recovery actions
supported by the ERDF
Cohesion Policy has complemented Italian regions’ plans by providing robust support to finance anti-crisis measures. On average, around 42% of total ERDF 2009-2010 commitments by Italian regions has been engaged for recovery interventions.
However, RCE and CONV regions show different patterns concerning the use of these funds. For a consistent number of RCE regions, ERDF recovery funds exceed the financial envelopes allocated for 2009 and 2010 – implying the use of 2007 and 2008 non-allocated resources – ensuring in this way that all available Cohesion Policy resources were fully mobilised to support regional efforts.
Given the critical juncture and their larger financial envelopes, CONV regions should have profited from the crisis to speed up implementation of their ERDF operational programmes. On the contrary, by making only very limited use of ERDF resources, they showed a lower administrative capacity compared to RCE
regions, particularly when considering that the higher absolute dimension of their financial envelopes does not really represent a binding constraint with respect to the figures in the Internal Stability Pact14, which puts a cap on regions’ expenses, since capital expenditure (like financial engineering mechanisms, i.e. the bulk of ERDF recovery interventions in support of business) does not contribute to the achievement of the cap.
Regarding the measures financed, as in the case of discretionary regional packages, the bulk of ERDF operational programmes have been used to support the business community. Axis I (R&D and Innovation) of the programmes, by sustaining SMEs suffering from significant restrictions in access to credit (through the establishment of new guarantee funds), and/or operating in highly innovation-orientated sectors, proved to be a valid instrument to tackle the crisis not only in the short-term to help the productive system to get out of it, but also in the medium
14 The Internal Stability Pact is an agreement between the State, the regions and municipalities to fix a cap on local administrations’ current expenses in order to guarantee compliance with the Stability and Growth Pact. The cap (which therefore excludes capital expenditure) is reviewed annually in the Budget Law.
12
to long-term by sheltering the investment capacity of the most innovative firms.
The remaining part of the ERDF funds has enabled regions to maintain reasonable levels of public investments by supporting investment in infrastructure (Tuscany, Veneto, P.A. Trento, Sardinia, Campania) and energy (Tuscany, P.A. Trento, Basilicata), in particular from renewable sources and aiming at a higher degree of energy efficiency.
3. ConclusionsThe economic crisis started in Italy as long ago as the end of 2008, first hitting the northern regions, which are more exposed to international trade, and then spreading to the remaining regions. Different product specialisations and degrees of openness seem to explain the asynchrony between northern and southern regions and, more generally, between RCE and CONV regions during the crisis. When economic conditions stabilise and the contraction in global demand is reabsorbed, the more open (and resilient) RCE regions can reasonably be expected to get out of the downturn first.
This view is partly confirmed by the analysis of the regional recovery packages.
Table 7 – Use of ERDF in response to the crisis
RegionsERDF recovery interventions (million EUR)*
As a % share of ERDF 2009-
2010 envelope
Measures as a % of ERDF recovery interventions
Support to business
Social interventions
Labour market interventions
Public Investments
Piedmont 70.98 58.9 61 39
Aosta Valley** 0.00 0.0
Lombardy 50.98 85.6 100
Liguria 61.30 129.0 100
P.A. Trento 2.85 52.3 74 26
Veneto 82.70 140.7 83 17
Friuli-V.G. 33.81 157.7 100
Emilia-Romagna 30.96 85.5 59 41
Tuscany 73.42 76.7 47 53
Umbria 115.48 272.4 79 21
Marches 11.10 34.8 100
Latium 105.50 100.4 100
Abruzzo 34.99 88.6 51 49
Molise 38.12 190.6 47 53
Sardinia 217.70 109.3 13 1 86
RCE + phi 929.88 104.6 56 0.2 43
Campania 220.00 22.7 80 20
Apulia 250.00 33.8 89 5 6
Basilicata 25.29 26.9 34 10 56
Calabria 233.00 55.0 58 8 34
Sicily 41.92 4.5 67 33
CONV + pho 770.21 24.3 74 4 22
ITALY* 1 700.09 41.9 64 2 34
Source: DG REGIO estimates based on data provided by regions* ERDF 2009-2010 commitments engaged for recovery interventions** VdA has financed the anti-crisis plan only with regional resources
On the basis of the data provided by regions, we estimate that they provided an overall recovery package of gross resources worth around EUR 15 billion for the 2009-2010 period, corresponding to a net contribution of EUR 9 billion or an additional stimulus comparable to 0.7% of 2009 GDP.
Given the critical juncture and their larger portfolio of resources (regional, national and from structural funds), we would have expected that CONV regions would have fully mobilised all the available resources to accelerate the recovery. Actually, the analysis of the geographical distribution of regional efforts in supporting the real economy shows a different picture. RCE regions seem to have more chances to overcome stagnation when considering: i) the wider amount of resources they were able to mobilise to tackle the economic crisis and, in particular, the timely use of structural funds; ii) the ownership of the main source of financing for recovery measures, i.e. regional discretionary resources.
The picture appears more balanced when looking at the quality of regional recovery interventions in Italy. RCE and CONV regions show similar patterns regarding i) the nature of the measures introduced, combining prevailing anti-cyclical extraordinary measures (70% of the package) with a non-marginal share of structural measures aiming at raising growth and employment in the medium to long-term; ii) the target beneficiaries, the main focus being placed by all regions on support for the business
13
community in order to avoid the risk of a permanent reduction of productive capacity as a consequence of the crisis.
The overall response to the crisis from the CONV regions is positive, but not as effective as it should have been. As the main recipients of structural funds in Italy, CONV regions should have taken more determined steps to exploit the potential of EU funds to maintain investment financing, particularly at this juncture when other revenue streams (own resources and government contributions) fade as a consequence of the crisis. Although the majority of
CONV regions seem to have realised the need to tackle structural problems in labour market functioning, and to have taken appropriate measures aimed at raising employment potential, those measures will require time to get the expected results and should have been accompanied by bolder interventions in order to accelerate the cyclical recovery. Therefore, the risk that the stronger and timely reaction of RCE regions could lead to a further widening of the existing gap with CONV regions once normal economic conditions are restored cannot be excluded.
14
Appendix
Figure A1 – Industrial Production Index in Italy (q-q) Figure A2 – Per capita expenditure from TOTAL recovery packages (EUR)
Source: DG REGIO estimates based on data provided by regions
Figure A3 – Regions' total recovery package by source of �nancing (million EUR)
Source: DG REGIO estimates based on data provided by regions
0 200 400 600 800
1 000 1 200 1 400 1 600 1 800 2 000 2 200
Piedmont VdA
Lombardy
Liguria
P.A.Trento
Veneto
FVG
Emilia-R.
Tuscany
Umbria
Marches
Latium
Abruzz
o
Molise
Sardinia
Campania
Apulia
Basilica
ta
Calabria
Sicily
National contribution ESF ERDF Regional funds 2009-2010
Figure A4 – Public investment share in regional packages
Source: DG REGIO estimates based on data provided by regionsSource: DG REGIO estimates based on data provided by regions
0
20
40
60
80
Tuscany
P.A. Trento
Veneto
Campania
Sardinia
Marches
Calabria
Liguria
Basilica
ta
Piedmont
Apulia
Sicily
Lombardy
FVG VdA
Emilia-R.
Umbria
Latium
Abruzz
o
Molise
ITALY= 30.4%
Figure A1 – Industrial Production Index in Italy (q-q)
Source: Based on ISAE, ISTATSource: Based on ISAE, ISTAT
110
105
100
95
90
85
80
75
70
Aug 07
Oct 07
Dec 07
Feb 08
Apr 08
Jun 08
Aug 08
Oct 08
Dec 08
Feb 09
Apr 09
Jun 09
Aug 09
Table A1– Regional packages as a share of GDP and Capital Expenditure
Regional package 2009-2010
as a % of 2009 GDP
as a % of 2009 GDP
(excl. P.A. Trento)
as a % of capital expenditure
undertaken by regions in 2007
as a % of capital expenditure
undertaken by regions in 2007
(excl. P.A. Trento)
RCE + phi regions 4 853.18 0.5 0.37 8.8 6.8
CONV + pho regions 686.84 0.30 0.30 0.9 0.9
ITALY 5 540.02 0.46 0.36 7.4 5.9
Source: DG REGIO estimates based on data provided by regions
15
List of referencesBanca d’Italia, Bollettino Economico, No 57, June 2009; No 58, October 2009; and No 59, January 2010.
Banca d’Italia, L’economia delle regioni italiane, Economie regionali, No 103, December 2009.
European Commission, The EU’s response to support the real economy during the economic crisis: an overview of Member States’ recovery measures, European Economy, Occasional Paper 51, July 2009.
ISTAT, Le esportazioni delle regioni italiane gennaio-giugno 2009, Statistiche sul commercio con l’estero, September 2009.
ISTAT, Rilevazione sulle forze lavoro II trimestre 2009, September 2009.
MiSE, Dept. Sviluppo e coesione economica, Quaderno congiunturale territoriale No 39, July 2009.
MiSE, Dept. Sviluppo e coesione economica, Rapporto Strategico Nazionale 2009, December 2009.
Presidenza Consiglio Ministri, Dept. for EU Affairs, Italian National Reform Programme 2008-10, Implementation Report, 2009.